Article

Sizing and Energy Management of Parking Lots of Electric Vehicles Based on Battery Storage with Wind Resources in Distribution Network

by
Saman Shahrokhi
1,
Adel El-Shahat
2,*,
Fatemeh Masoudinia
3,
Foad H. Gandoman
4 and
Shady H. E. Abdel Aleem
5
1
Department of Electrical Engineering, Sanandaj Branch, Islamic Azad University, Sanandaj 1584743311, Iran
2
Energy Technology Program, School of Engineering Technology, Purdue University, West Lafayette, IN 47907, USA
3
Department of Electrical Engineering, Sofian Branch, Islamic Azad University, Sofian 1584743311, Iran
4
ETEC Department & MOBI Research Group, Vrije Universiteit Brussel (VUB), Pleinlaan 2, 1050 Brussel, Belgium
5
Department of Electrical Engineering, Valley Higher Institute of Engineering and Technology, Science Valley Academy, Al-Qalyubia 44971, Egypt
*
Author to whom correspondence should be addressed.
Energies 2021, 14(20), 6755; https://doi.org/10.3390/en14206755
Submission received: 31 August 2021 / Revised: 12 October 2021 / Accepted: 13 October 2021 / Published: 17 October 2021

Abstract

:
In this paper, an optimal sizing and placement framework (OSPF) is performed for electric parking lots integrated with wind turbines in a 33-bus distribution network. The total objective function is defined as minimizing the total cost including the cost of grid power, cost of power losses, cost of charge and discharge of parking lots, cost of wind turbines as well as voltage deviations reduction. In the OSPF, optimization variables are selected as electric parking size and wind turbines, which have been determined optimally using an intelligent method named arithmetic optimization algorithm (AOA) inspired by arithmetic operators in mathematics. The load following strategy (LFS) is used for energy management in the OSPF. The OSPF is evaluated in three cases of the objective function such as minimizing the cost of power losses, minimizing the network voltage deviations, and minimizing the total objective function using the AOA. The capability of the AOA is compared with the well-known particle swarm optimization (PSO) and artificial bee colony (ABC) algorithms for solving the OSPF in the last case. The findings show that the power loss, voltage deviations, and power purchased from the grid are reduced considerably based on the OSPF using the AOA. The results show the lowest total cost of energy and also minimum network voltage deviation (third case) by the AOA in comparison with the PSO and ABC with a higher convergence rate, which confirms the better capability of the proposed method. The results of the first and second cases show the high cost of power purchased from the main grid as well as the high total cost. Therefore, the comparison of different cases confirms that considering the cost index along with losses and voltage deviations causes a compromise between different objectives, and thus the cost of purchasing power from the main network is significantly reduced. Moreover, the voltage profile of the network improves, and also the minimum voltage of the network is also enhanced using the OSPF via the AOA.

1. Introduction

In the last decade, the use of electric vehicles in the transportation industry has been widely welcomed in various countries. Electric vehicles can be used as controllable loads [1]. Electric vehicles can also be used as distributed generation (DG) units during peak load periods when electricity prices are high. Due to the limited power of electric vehicles, these devices can also be used as a source of DG [2]. The optimal placement of electric parking lots as charging stations is a new type of DG resource, which is important in the operation of distribution networks, their location, and determining their optimal capacity [3]. A lack of proper allocation of DG resources and charging stations in the network increases losses and the cost of the production and transmission of energy, so it is necessary to determine the optimal installation location and size in the distribution network to obtain the maximum reduction in losses and energy production costs [4,5].
Various studies have been conducted on the optimal use of electric parking lots and renewable resources in distribution networks. In [6], a multi-objective parking lot allocation was performed to improve the reliability and cost reduction, regardless of the electric vehicle battery charging model. The results showed that the location of parking lots in a suitable location with optimal capacity increases the economic benefits of the network. In [7], the location of the parking lot was determined in order to reduce the power losses of electric vehicles without the need for vehicle batteries to be charged, and a genetic algorithm (GA) was applied to solve the problem. In [8], using the GA, the optimal location and size of the electric parking and distributed generation sources are developed to charge vehicle batteries. In [9], the management of electric vehicle parking charges was presented using PSO. Assessing the quality of network power with respect to the charging and discharging of electric vehicle parking was studied in [10]. In [11], the scheduling of renewable energy sources for smart grids was performed by considering the parking of electric vehicles connected to the grid. In [12], an energy management strategy was developed for parking grid-connected electric vehicles, in which the appropriate operation mode is determined based on optimal control. In [13], the authors provided an intelligent method to use the scheduled energy storage capacity available in the parking lot of electric vehicles using PSO. In [14], a method was presented for locating and determining the optimal capacity of distributed generation sources and parking electric vehicles. In [15], the role of vehicle-to-grid in frequency regulation was investigated. In [16], a multi-criteria method was presented to determine the optimal capacity of parking lots to be placed in the network to minimize losses and voltage deviation and also improve the reliability. In [17], the sizing of parking lots considering demand response was performed to minimize the network loss and voltage deviation using a genetic algorithm. In [18], the allocation and sizing of the vehicle charging station in the network were determined with the aim of voltage profile improvement, loss minimization, and minimizing the energy cost via a balanced mayfly algorithm. In [19], the allocation of parking lots in the network was developed by maximizing the benefit, incorporating different load conditions.
In general, most of the research conducted in the field of electric vehicles based on optimal charging planning in order to achieve the desired level of different characteristics, such as reducing losses and voltage profiles, is also connected to the network as a storage system. The optimal allocation of renewable energy sources as energy production sources [20,21,22] in distribution networks along with electric parking lots can be a suitable option for the operation of distribution networks based on new and renewable technologies. On the other hand, with the participation of these units and the release of network capacity, the cost of purchasing power from the main network is reduced, which has not been well addressed in previous studies. In addition, using a powerful optimization method in determining the location and capacity of these units can increase the advantage of using them and also reduce the cost of energy production in the network.
In this paper, an optimal sizing and placement framework (OSPF) for electric parking lots with wind turbines is performed on 33-bus distribution networks to minimize the cost of losses, wind turbine power, battery charging and discharging, and purchasing power from the main grid. The decision variables include the number of electric vehicles in the parking lots and the wind turbine number in the distribution network. The arithmetic optimization algorithm (AOA), which is inspired by arithmetic operators in mathematics [23,24], is applied to determine the optimization variables by considering the objective function and operation constraints. The motivation of using the AOA is the high capability of this method to solve the optimization problem, quickly achieving the global optimal solution [19,20]. In this study, the cost of power losses, the cost of purchasing power from the main network, and also network voltage conditions are investigated before and after problem solution, and the effect of the optimal application of electric parking lots has been evaluated. This framework is very effective for distribution network operators to understand the sizing and placement of parking lots as integrated renewable energy resources in the distribution network. To verify the proposed framework based on the AOA, the results are compared with the artificial bee colony (ABC) [25] and PSO [26] methods, which are well-known powerful methods in solving electrical engineering problems.
The problem formulation and also strategy of energy management are presented in Section 2. The overview of the proposed optimization method and its development to solve the problem are presented in Section 3. The simulation results in different cases are given in Section 4. Finally, the obtained results are concluded in Section 5.

2. Problem Formulation

2.1. Objective Function

In this paper, the optimal sizing and placement framework (OSPF) for electric parking lots and wind turbines is presented with the objective function of cost minimization as well as voltage deviation minimization as multi-objective optimization based on the weighted coefficient method. The cost function includes the cost of power loss, grid power cost, wind power cost, and also charging and discharging cost of electric parking. The objective function of the OSPF is defined as follows:
min   Objective _ Function = W 1 ( Cost After ( x t , size t ) Cost Before ) +   W 1 ( VD After ( x t , size t ) VD Before )
Cost   ( x t , size t ) = t = 1 N [ Cost Loss ( x t , size t ) + Cost Grid ( x t , size t ) + Cost Wind ( x t , size t ) + Cost EP ( x t , size t ) ]
VD ( x t , size t ) = 1 N Bus i = 1 N Bus ( V i V p ) 2
where   x indicates the installation location of parking lots and wind turbines in the network and the size of parking lots and wind turbines, W 1   and W 1   are the weights of the cost and voltage deviation function, Cost After and Cost Before are the system cost after and before the OSPF, and VD After   and VD Before are the voltage deviation after and before the OSPF, respectively. Cost Loss ( x t , size t ) , Cost Grid ( x t , size t ) , Cost Wind ( x t , size t ) , and Cost EP ( x t , size t ) are the cost of power losses, cost of purchasing power, cost of wind power, and cost of electric parking, respectively. N Bus refers to the number of buses, V i is the voltage of bus i, and V p is the average of the bus’s voltage. The following is each part of the objective function.
  • Cost of power loss
Cost Loss ( t )   = C l o s s × P l o s s ( t )
  • Cost of purchased power from main network
Cost Grid ( t ) = C g r i d × P g r i d ( t )
  • Cost of wind power
The cost of wind turbine power is as follows:
Cost Wind ( t ) = C w i n d × P w i n d ( t )
  • Cost of parking lots
The cost of electric parking lots, which is the cost difference between discharge and charge power, is defined by:
Cost EP ( t ) F . H = C EP × P EP ( t )
where C l o s s , C g r i d , C W i n d , and C E P , respectively, are the cost per kW of losses, the cost per kW of power received from the main grid, the cost of per kW wind power, and the cost per kWh battery power of electric vehicles. Additionally, P l o s s , P g r i d , P W i n d , and P E P express the amount of power loss, power purchased from the main network, wind turbine power, and battery bank capacity, respectively. N also indicates the study period (24 h).

2.2. Constraints

The optimization problem should be optimized under the following constraints. The operating constraints are as follows [27,28,29,30].
  • Power balance
P W i n d ( t ) + P g r i d ( t ) + P E P ( t ) P l o s s ( t ) P D ( t ) = 0
  • Power purchased from the main network
Up to 30% of the required network load can be received from the main grid per hour. In other words, the operator is not allowed to apply the main grid to supply the entire network load due to the high cost. Therefore, a maximum of 30% of the network load needs can be met by the main grid.
P g r i d ( t ) P g r i d m a x
  • Vehicle’s battery capacity
The state of charge (SOC) of the battery of parking lots has a lower and upper limit as follows [27]:
S O C m i n S O C i ( t ) S O C m a x
The SOC of batteries when the vehicle’s battery is in charge mode is defined as follows:
S O C i ( t ) = S O C i ( t 1 ) + P c h ( t )
where P c h ( t ) is the amount of power that is injected into the vehicles of parking lots to charge in t hours and S O C i ( t 1 ) is the amount of SOC in hour t−1.
The SOC of batteries when the battery of the vehicle is in discharge mode is defined as follows:
S O C i ( t ) = S O C i ( t 1 ) P d i s c h ( t )
where P d i s c h ( t ) is the amount of power discharged from parking lots (discharge mode) at t hour.
  • Voltage
Network bus voltages have a minimum ( V i m i n ) and maximum ( V i m a x ) limit that should not exceed these values [4,16].
V i m i n V i ( t ) V i m a x      
The minimum and maximum voltages are 0.95 p.u and 1.05 p.u, respectively. In other words, the voltage of each bus should be more than 0.95 p.u and less than 1.05 p.u [30].
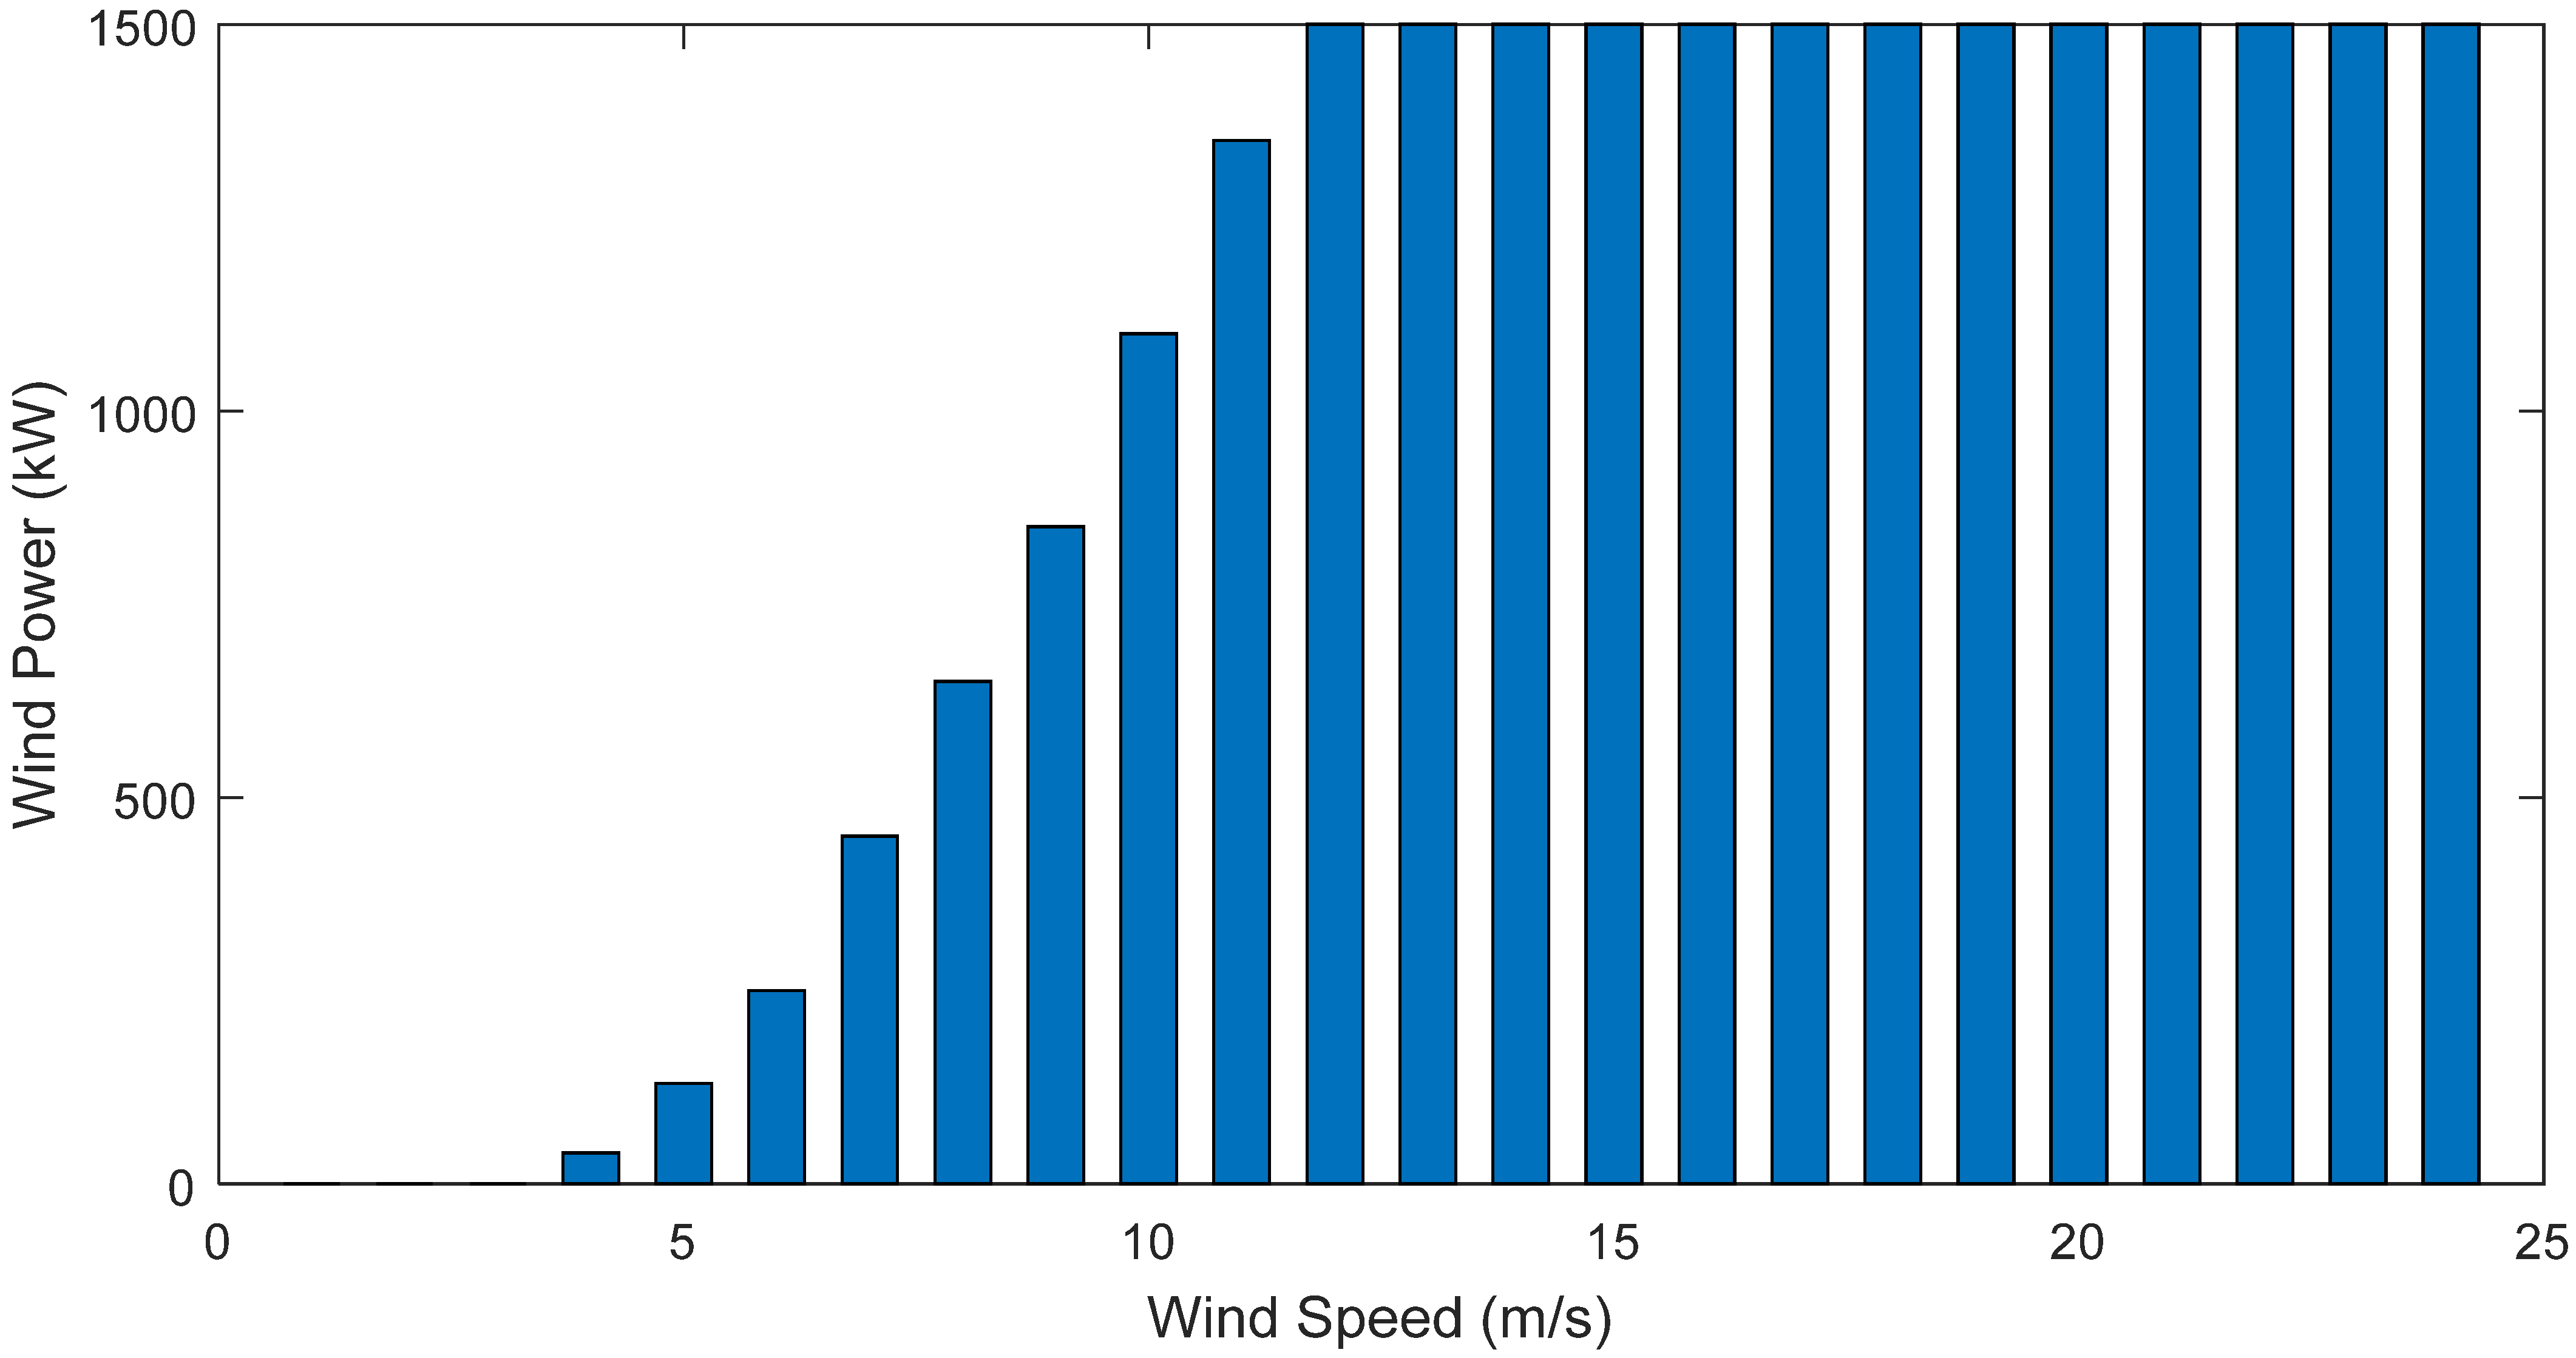
  • Power of wind generator
P W i n d i m i n P W i n d i ( t ) P W i n d i m a x
where the power output of the ith wind turbine has a minimum range ( P W i n d i m i n ) and a maximum range ( P W i n d i m a x ).
  • Allowable power of network lines (thermal limit)
The power flowing in each line must be lower than its thermal limits as follows:
F i L i m i t i
where L i m i t i is the maximum allowable power passing through line i.

2.3. Energy Management Strategy

The energy management strategy (EMS) is a method to manage the energy resources in terms of time to meet the demand. The load following strategy [31,32] is applied as an EMS in the proposed system. In this strategy, firstly the wind resource energy and also the energy of the electric vehicles in the parking lots operate to supply the demand. If wind resources and parking lots are not capable of meeting the load fully, the power is purchased from the main grid. The EMS per hour is as follows:
  • If the power output of wind turbines is more than the load demand and if the amount of parking battery charge is less than the maximum allowable value, then the parking battery will be charged based on the allowable charging capacity.
  • If the power output of wind turbines is less than the load demand and if the amount of parking battery charge is more than the maximum allowable value, then considering the allowable charging capacity, the parking battery will be discharged to load supply.
  • If the capacity of wind resources in addition to charging electric parking lots is less than the demand, then in proportion to the load shortage, the power can be purchased from the main grid.

3. Proposed Optimization Method

In this paper, the OSPF based on the AOA is applied for the allocation of parking lots and wind turbines in the 33-bus distribution network, which is described below, and its implementation in problem solving is described.

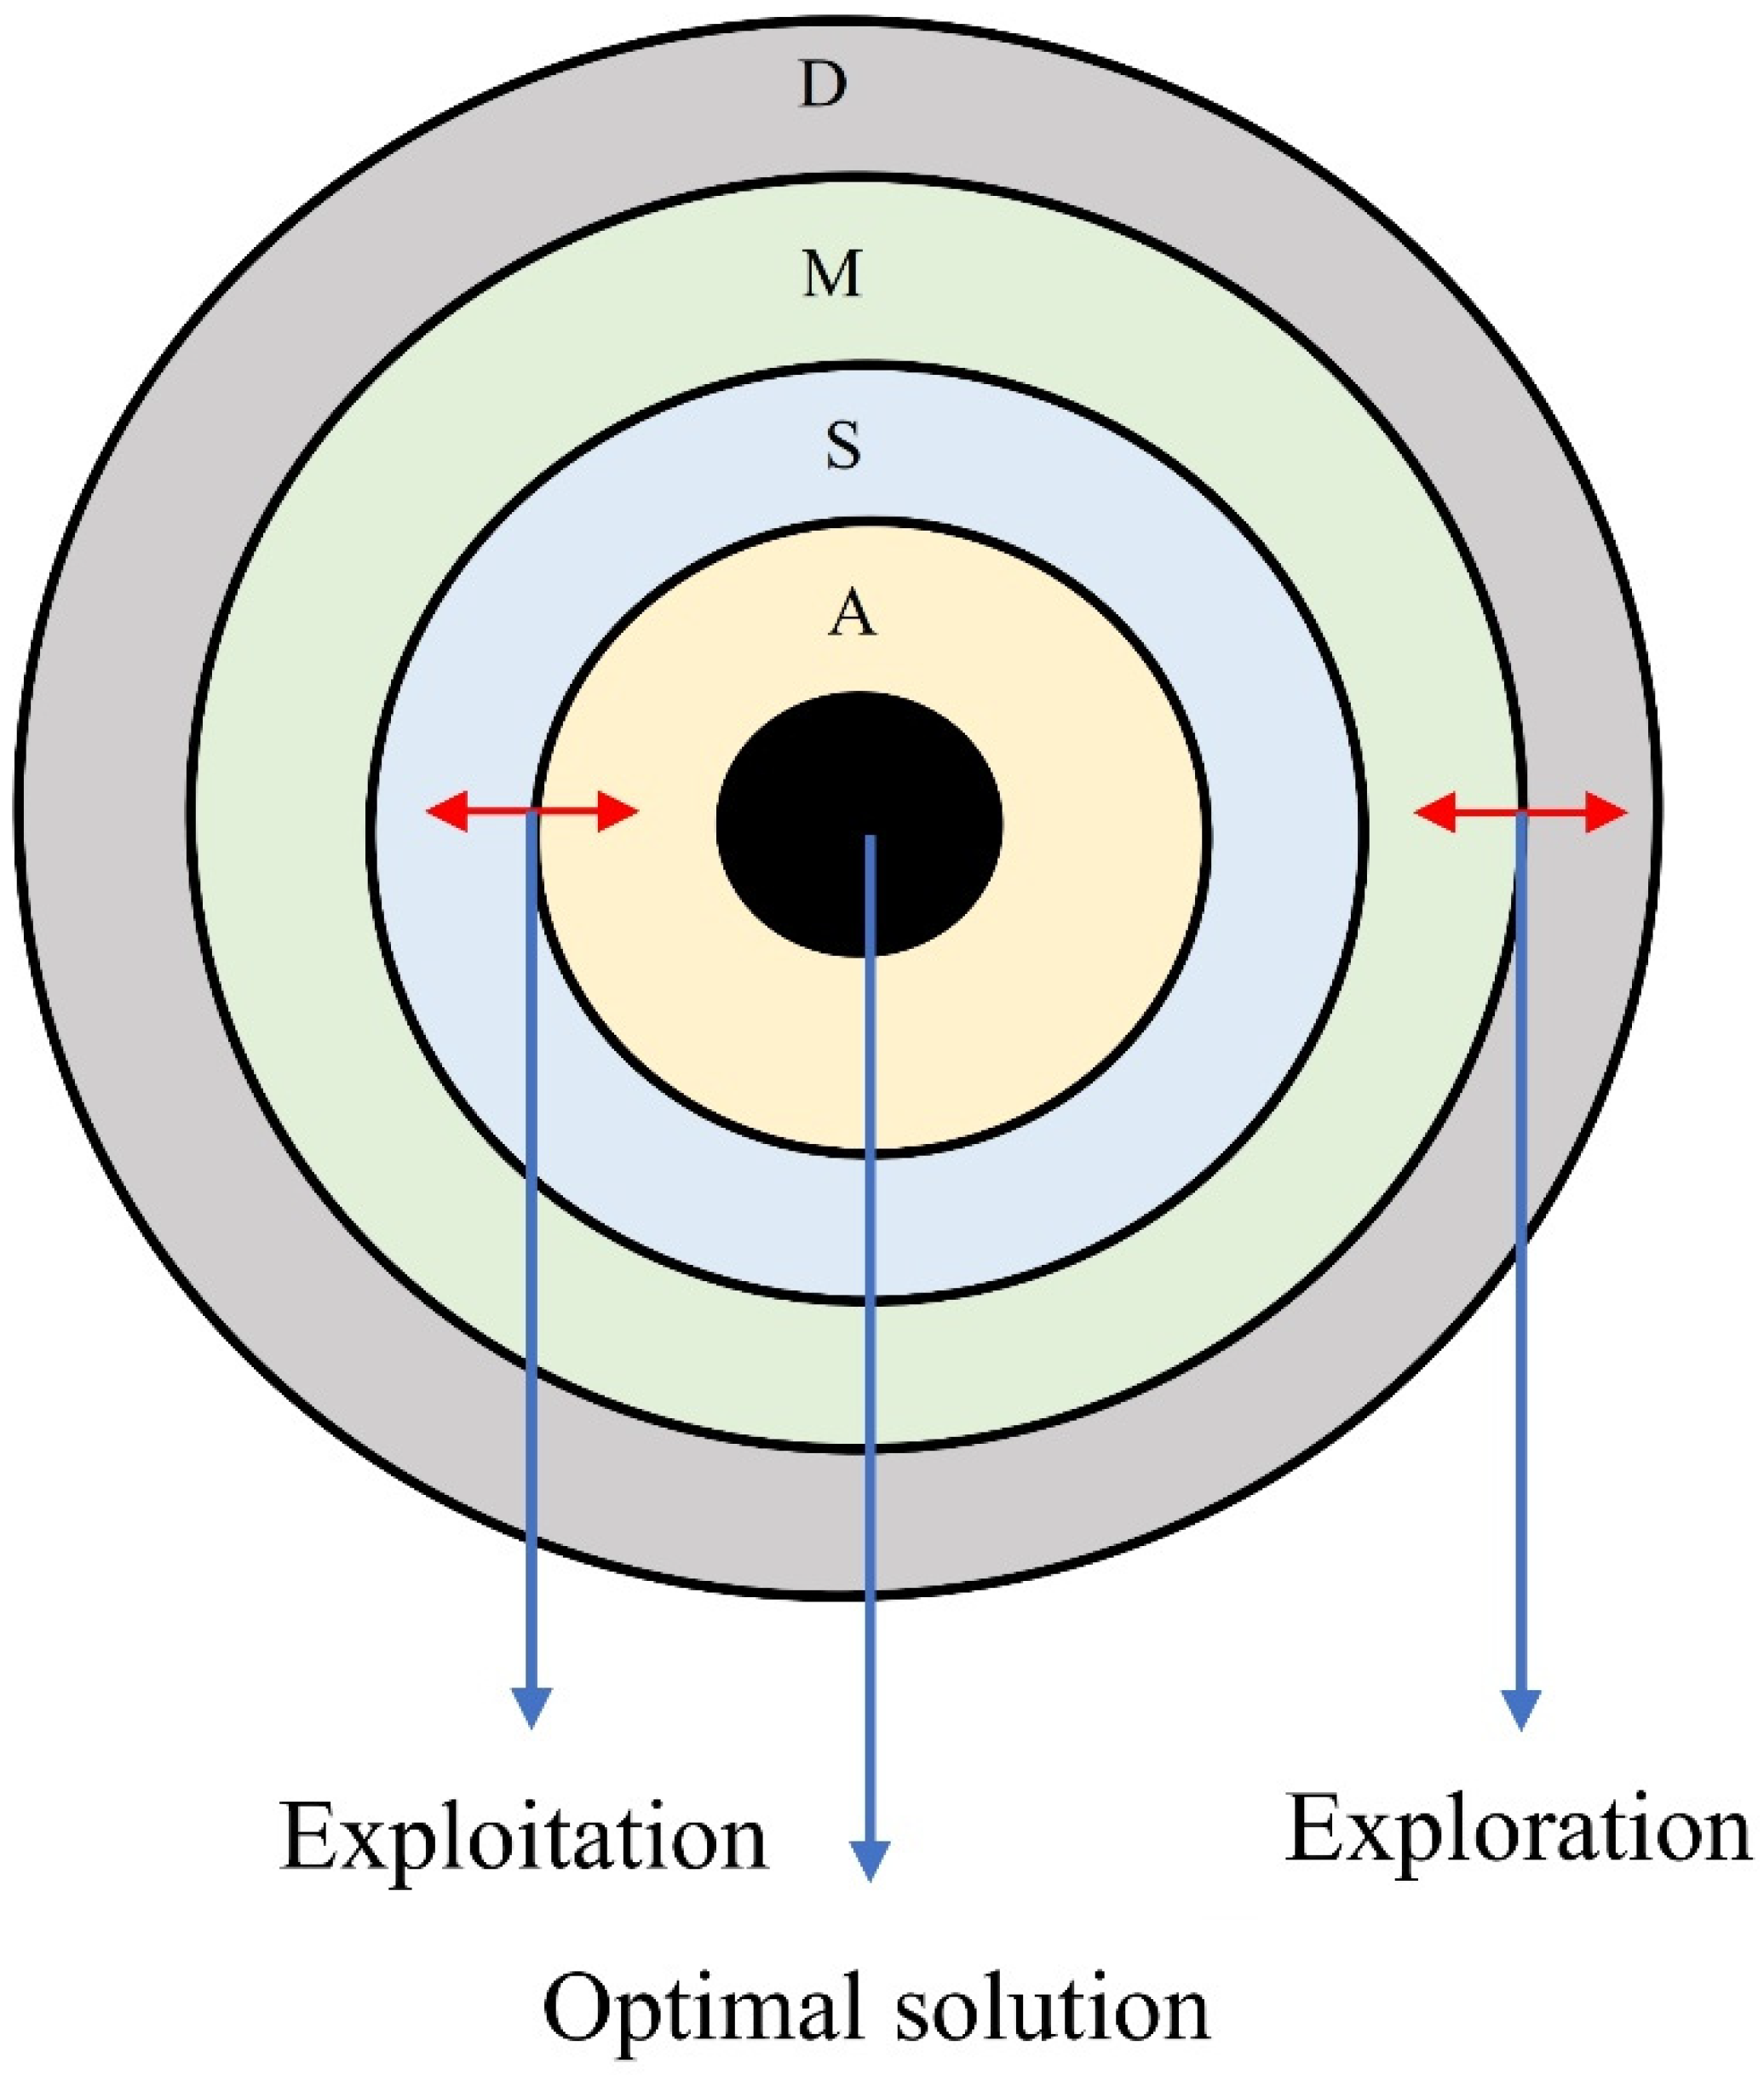
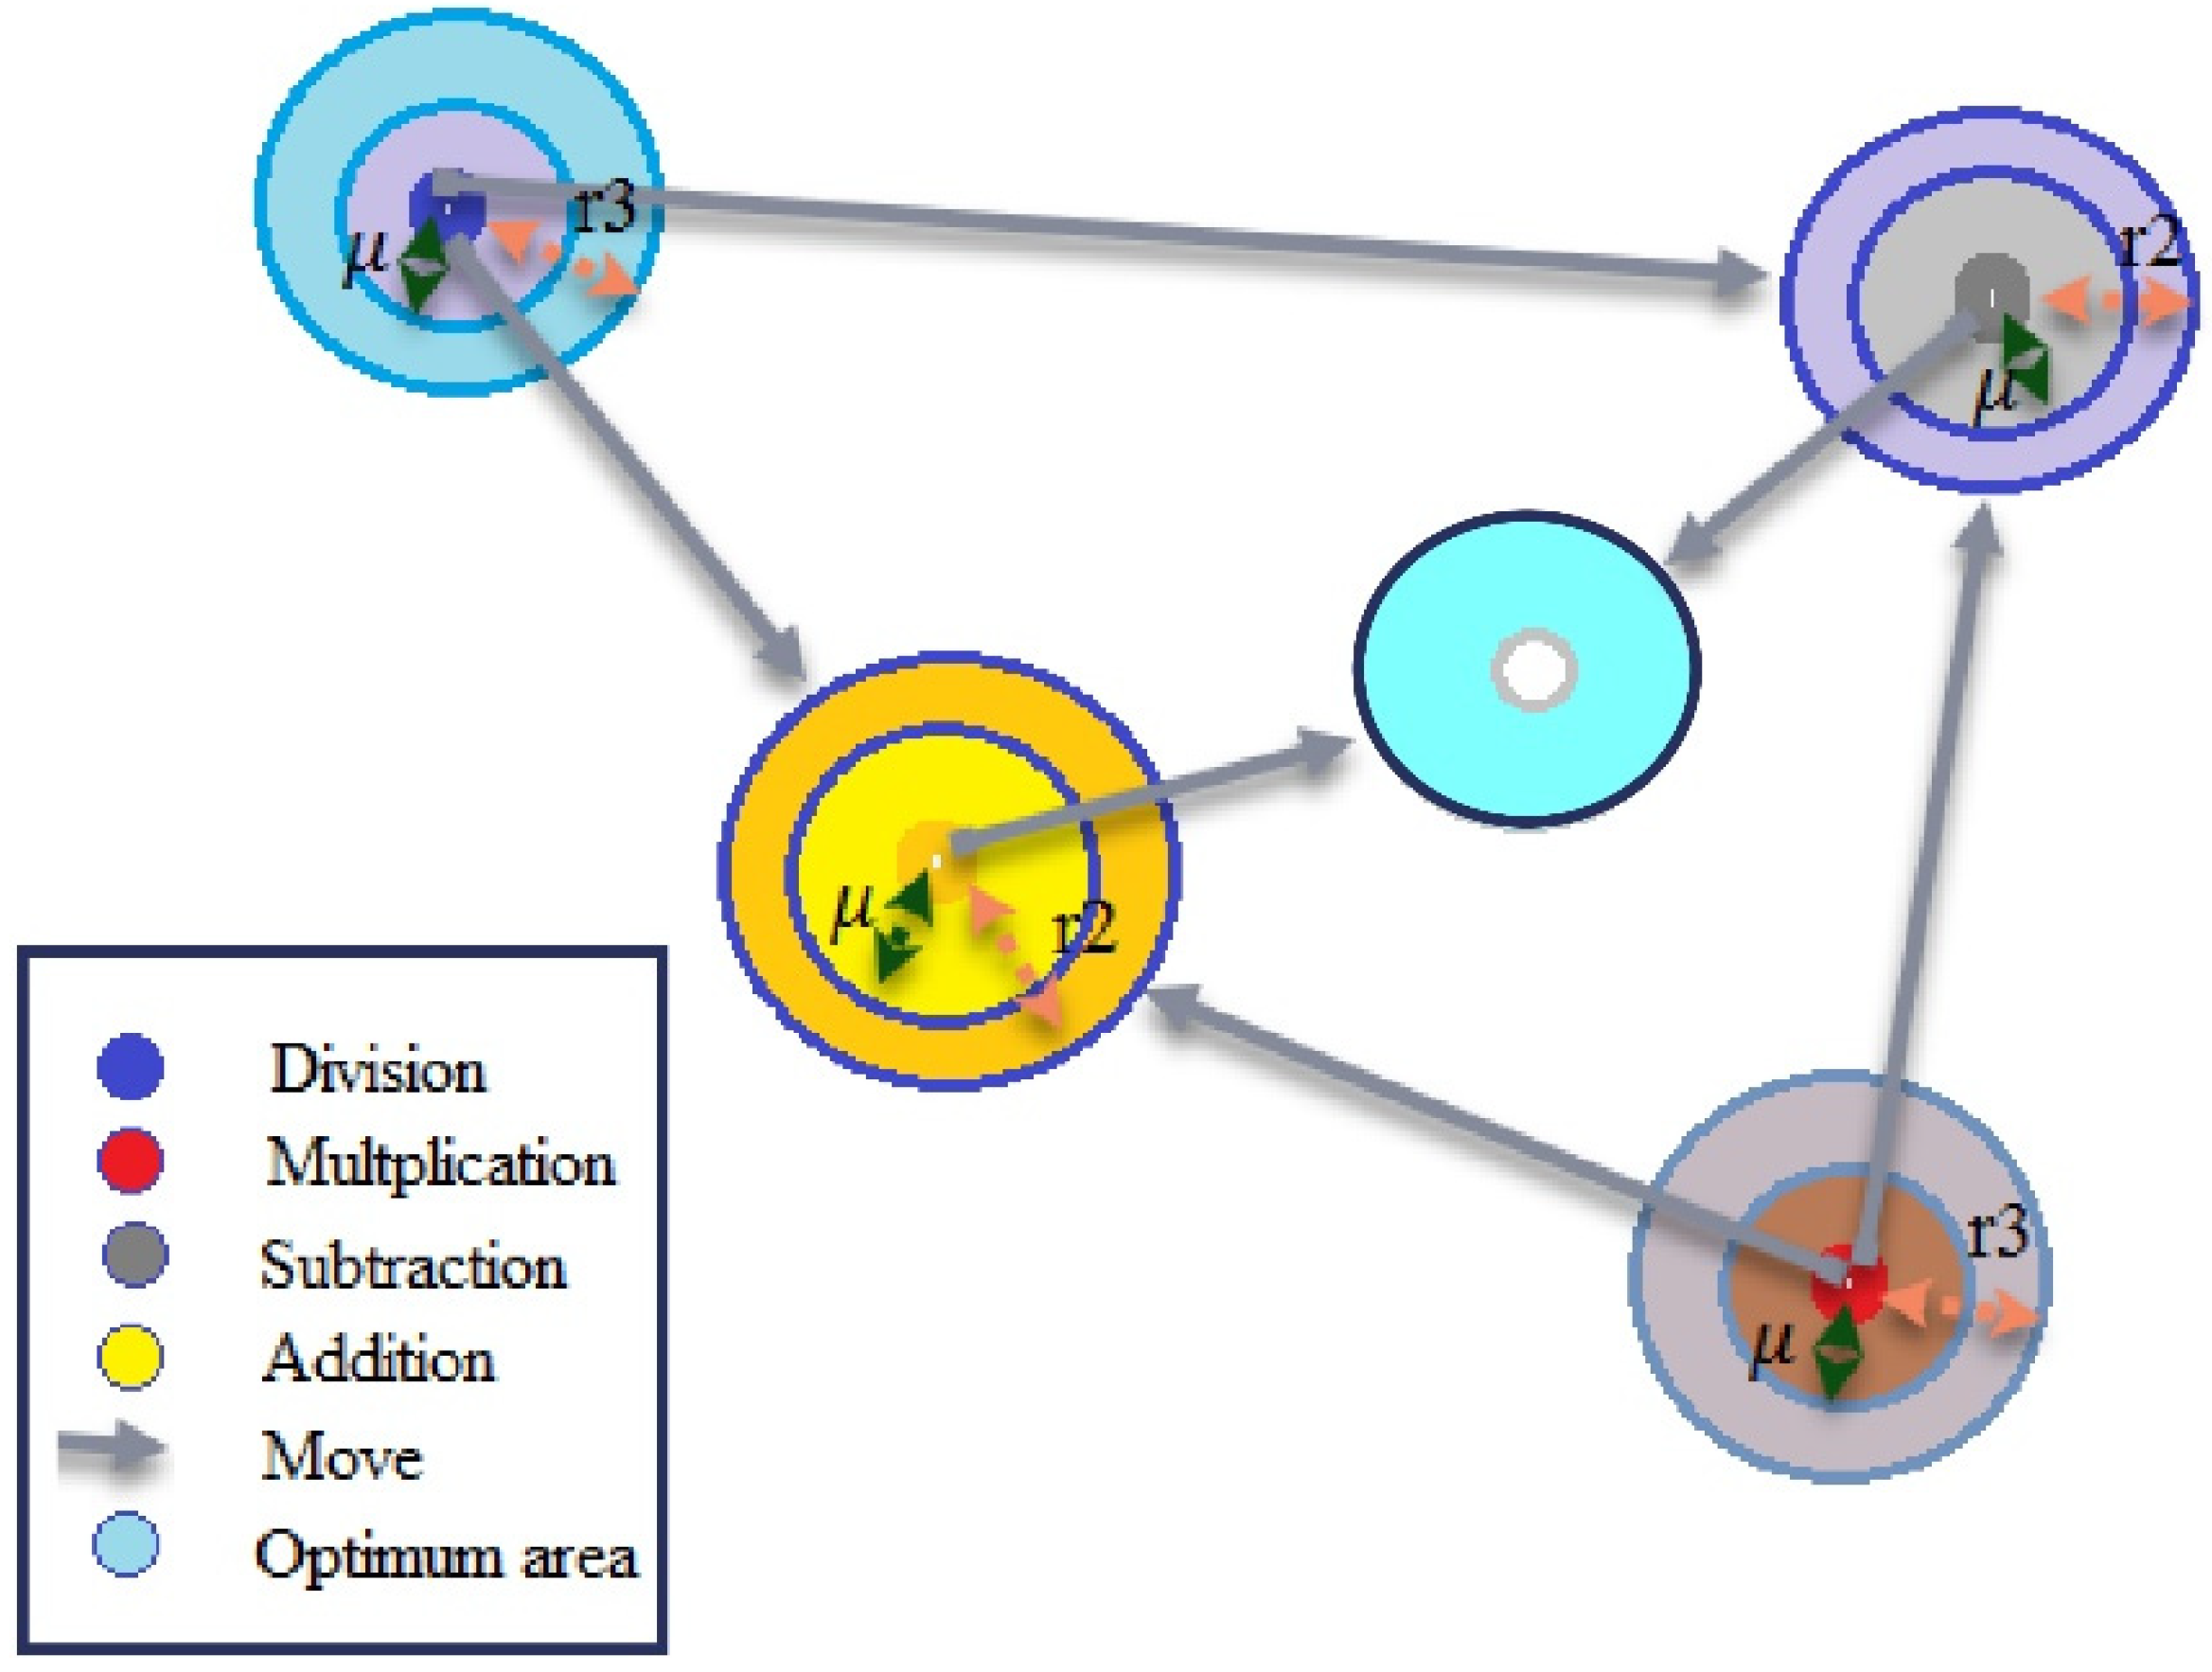
3.1. Overview of AOA

Population-based meta-heuristic algorithms include two main phases of exploration and exploitation. In the exploration phase, the search space is extensively evaluated based on search operators to avoid being trapped in the local optimal, and in the exploitation phase, the accuracy of the solutions extracted in the exploration phase is increased. In this study, the formulation of an arithmetic optimization algorithm (AOA) is described based on exploration and exploitation phases. This optimization method is inspired by arithmetic operators (AOs) in mathematics such as multiplication (M), division (D), subtraction (S), and addition (A) and can solve optimization problems without the need for their derivatives [23,24].
Arithmetic is an essential part of number theory, and AOs are the traditional computational tools applied to investigate numbers. In the AOA, simple operators are used for optimization. The performance of each AO expressed in the AOA formulation is described below. Figure 1 depicts the hierarchy of AOs along with the exploration and operation phases. In the AOA based on Figure 1, top-down dominance has a decreasing trend [23,24].

3.1.1. Preparation Stage

Candidate solution set (X) is randomly generated at the start of optimization. The best solution is considered the solution close to the current optimal [23].
X = [ x 1 , 1 X 1 , 2 x 1 , j   x 1 , n 1 x 1 , n x 2 , 1 X 2 , 2 x 2 , j   x 2 , n x N , 1 X N , 1 x N , j x N , n 1 x N , n ]
The AOA must first select the exploration or exploitation phase. Thus, the Math Optimization Function (MOA) is calculated as follows and used in the search process [23].
M O A ( C _ I t e r ) = M i n + C _ I t e r   ( M a x M i n M _ I t e r )
where MOA (C_Iter) refers to the value of the function in the t-iteration, C_Iter refers to the current iteration, M_Iter indicates the maximum iterations of AOA, and Min and Max also refer to the lower and upper values of the MOA.

3.1.2. Exploration Stage

Based on the AOs expressed, computations using the division operator (D) or even the multiplication operator (M) determine which is related to the exploration search phase. The M and D operators cannot easily reach the objective due to the high scatter in comparison with the S and A operators. The exploratory search phase can determine the near-optimal response after several iterations. In the optimization process, M and D operators are applied to support the operational phase through communication between them.
The exploration operators in the AOA evaluate the search space to determine a better solution according to the two strategies of operators M and D. Figure 2 shows how to update the operators used towards the optimal region [23]. In this phase, the D operator is conditional on r2 < 0.5, and the M operator is ignored until the end of the D operator operation. When the function of operator D ends, operator M is activated (r2 is a random number). The position update equations are defined as follows for the exploration phase [23,24]:
X i , j ( C _ I t e r + 1 ) = { b e s t   ( x j ) ( M O P + ε ) × ( ( U B j L B j ) × μ + L B j )     r 2 < 0.5 b e s t   ( x j ) × M O P × ( ( U B j L B j ) × μ + L B j ) ,     o t h e r w i s e
where xi (C_Iter + 1) represents the ith next iteration solution, xi,j (C_Iter) is the jth position of the ith solution in the present iteration, best (xj) is the jth position in the best solution, ε represents a very small number, UBj and LBj specify the upper and lower limits of the j position, and μ is the control parameter (equal to 0.5) [23].
M O P ( C _ I t e r ) = 1 C _ I t e r 1 / α M _ I t e r 1 / α
where MOP represents the mathematical optimizer probability, and as a coefficient, MOP (C_Iter) represents the value of the function in iteration t and C_Iter refers to the current iteration. M_Iter indicates the maximum number of AOA iterations, and α is an important parameter with high sensitivity to express the accuracy of the operation phase (α = 5) [23].

3.1.3. Exploitation Phase

In the exploitation phase of the AOA, subtraction (S) or addition (A) operators achieve higher density results. Operators S and A, unlike operators M and D, have low scatter and therefore can achieve the target. Therefore, the operating phase can determine the near-optimal response after several iterations (r1 is not greater than the value of MOA (C_Iter)). In the AOA, the S and A operators explore the search space on areas with different densities for better response, the mathematical expression of which is given by [19]:
X i , j ( C _ I t e r + 1 ) = { b e s t   ( x j ) ( M O P + ε   ) × ( ( U B j L B j ) × μ + L B j )       r 3 < 0.5 b e s t   ( x j ) + ( M O P + ε ) × ( ( U B j L B j ) × μ + L B j ) , o t h e r w i s e
In this phase, the operator S is conditional on r3 < 0.5, and the operator A is ignored until the end of the operation of the operator D. When the S operator terminates, the A operator is activated (r3 is a random number). Operators S and A prevent trapping in the local optimum. Therefore, this process improves the performance of the algorithm in achieving the optimal solution. Figure 2 shows the updating of variables (positions) based on the D, M, S, and A operators in a 2D search space. It is observed that the current position can be within a certain range that corresponds to the corresponding positions of D, M, S, and A in the search space. In other words, operators D, M, S, and A randomly update their position around the response position by estimating it to be close to the optimal response.
The AOA starts the optimization process by considering a set of random solutions. The position vector is defined based on the initialization of the random variables in the minimum and maximum ranges. The position and step of each population member in each iteration are updated. The position update operation continues until the convergence conditions are satisfied, and finally, the optimal variables are determined according to the best objective function.

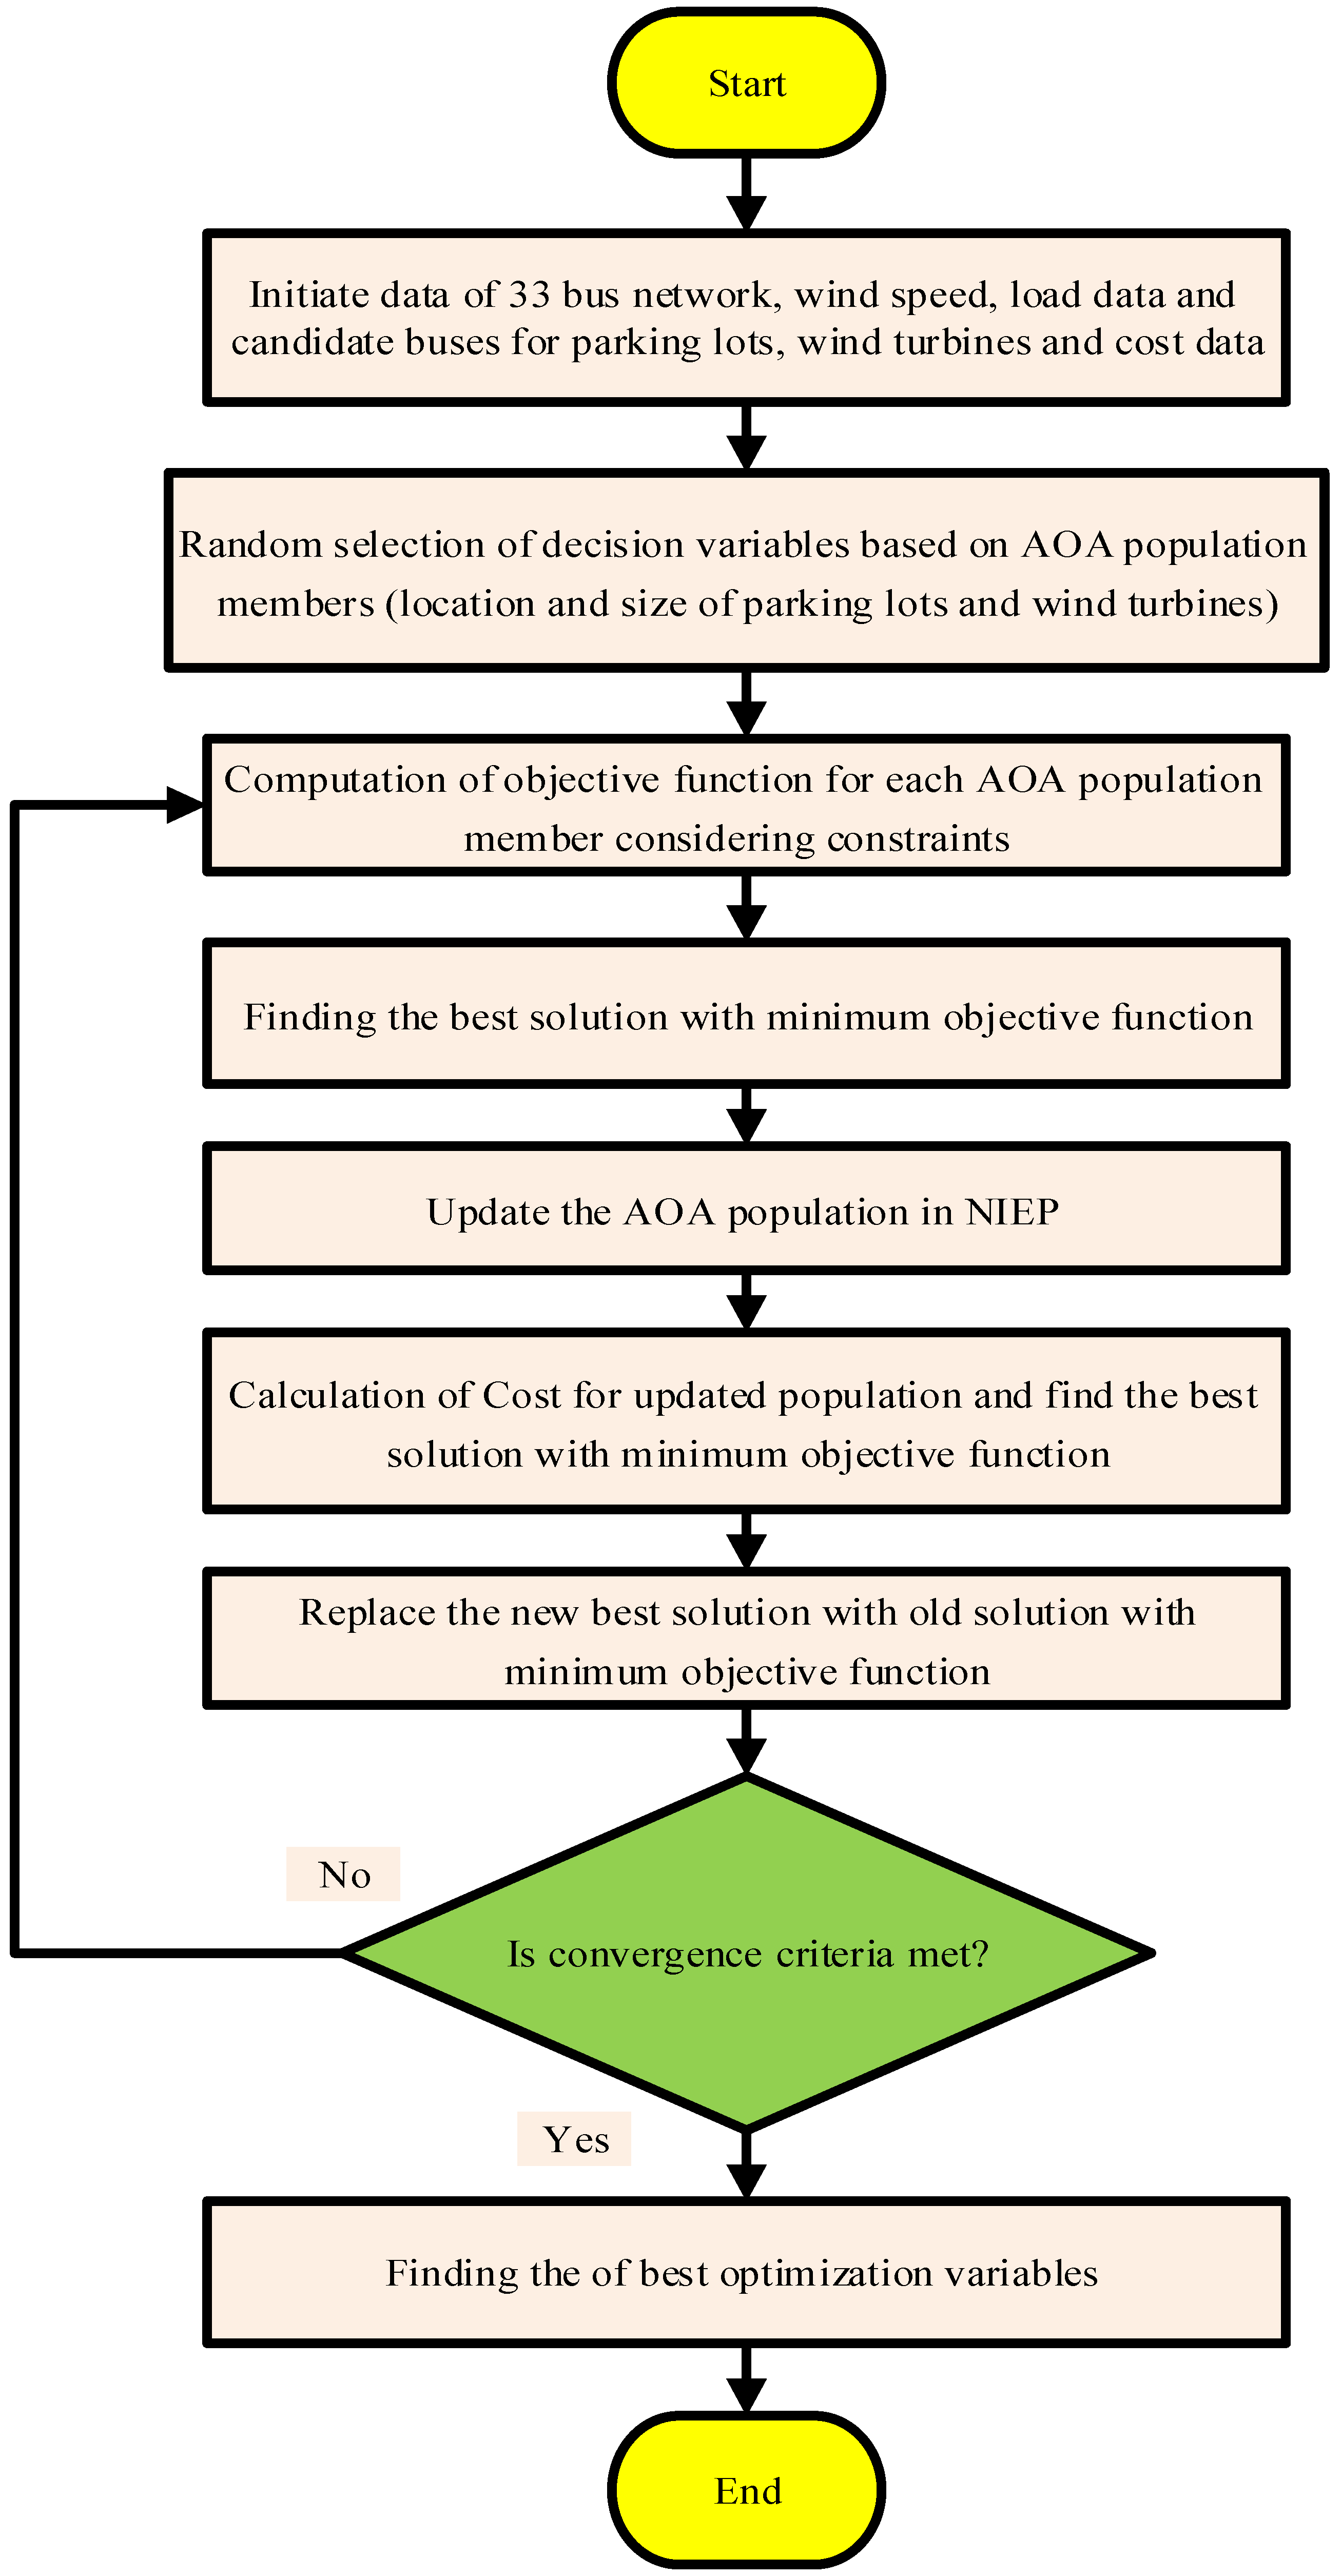
3.2. Implementation of the AOA

The OSPF based on the AOA for parking lots and wind turbines in 33-bus distribution networks is illustrated in Figure 3. The steps for AOA implementation are as follows:
Step 1. The problem variables are randomly determined for the AOA population. The population of the algorithm is selected as 50 and the maximum iteration of the AOA is considered to be 300.
The variable vectors are considered as those that should be determined optimally.
Step 2. For each of the AOA population members, the energy contribution of the parking lots and also wind energy resources are considered and the operating conditions are checked. In this study, backward–forward load flow is used. The voltage constraints and also thermal limits should be satisfied.
Step 3. The value of the objective function for the variables selected in step 1 is calculated for each of the AOA population members and the best solution is determined. The variable set with a lower objective function value is considered as the best set of the variables in this step.
Step 4. Using the AOA, the population is updated in this step and then the variables are randomly determined again. Then, the objective function is evaluated for the new variable set.
Then, the best solution with the lowest value of the objective function is determined. If the value of the objective function obtained in step 3 is better than the one obtained in step 4, it is replaced and the corresponding variable set is considered as the best set.
Step 5. If the convergence conditions such as achieving the best value of the objective function and maximum iteration are met, we go to step 6; otherwise, we go to step 2.
Step 6. In this step, after the determination of the optimal variable set, we stop the AOA to save the optimal variable.

4. Simulation Results
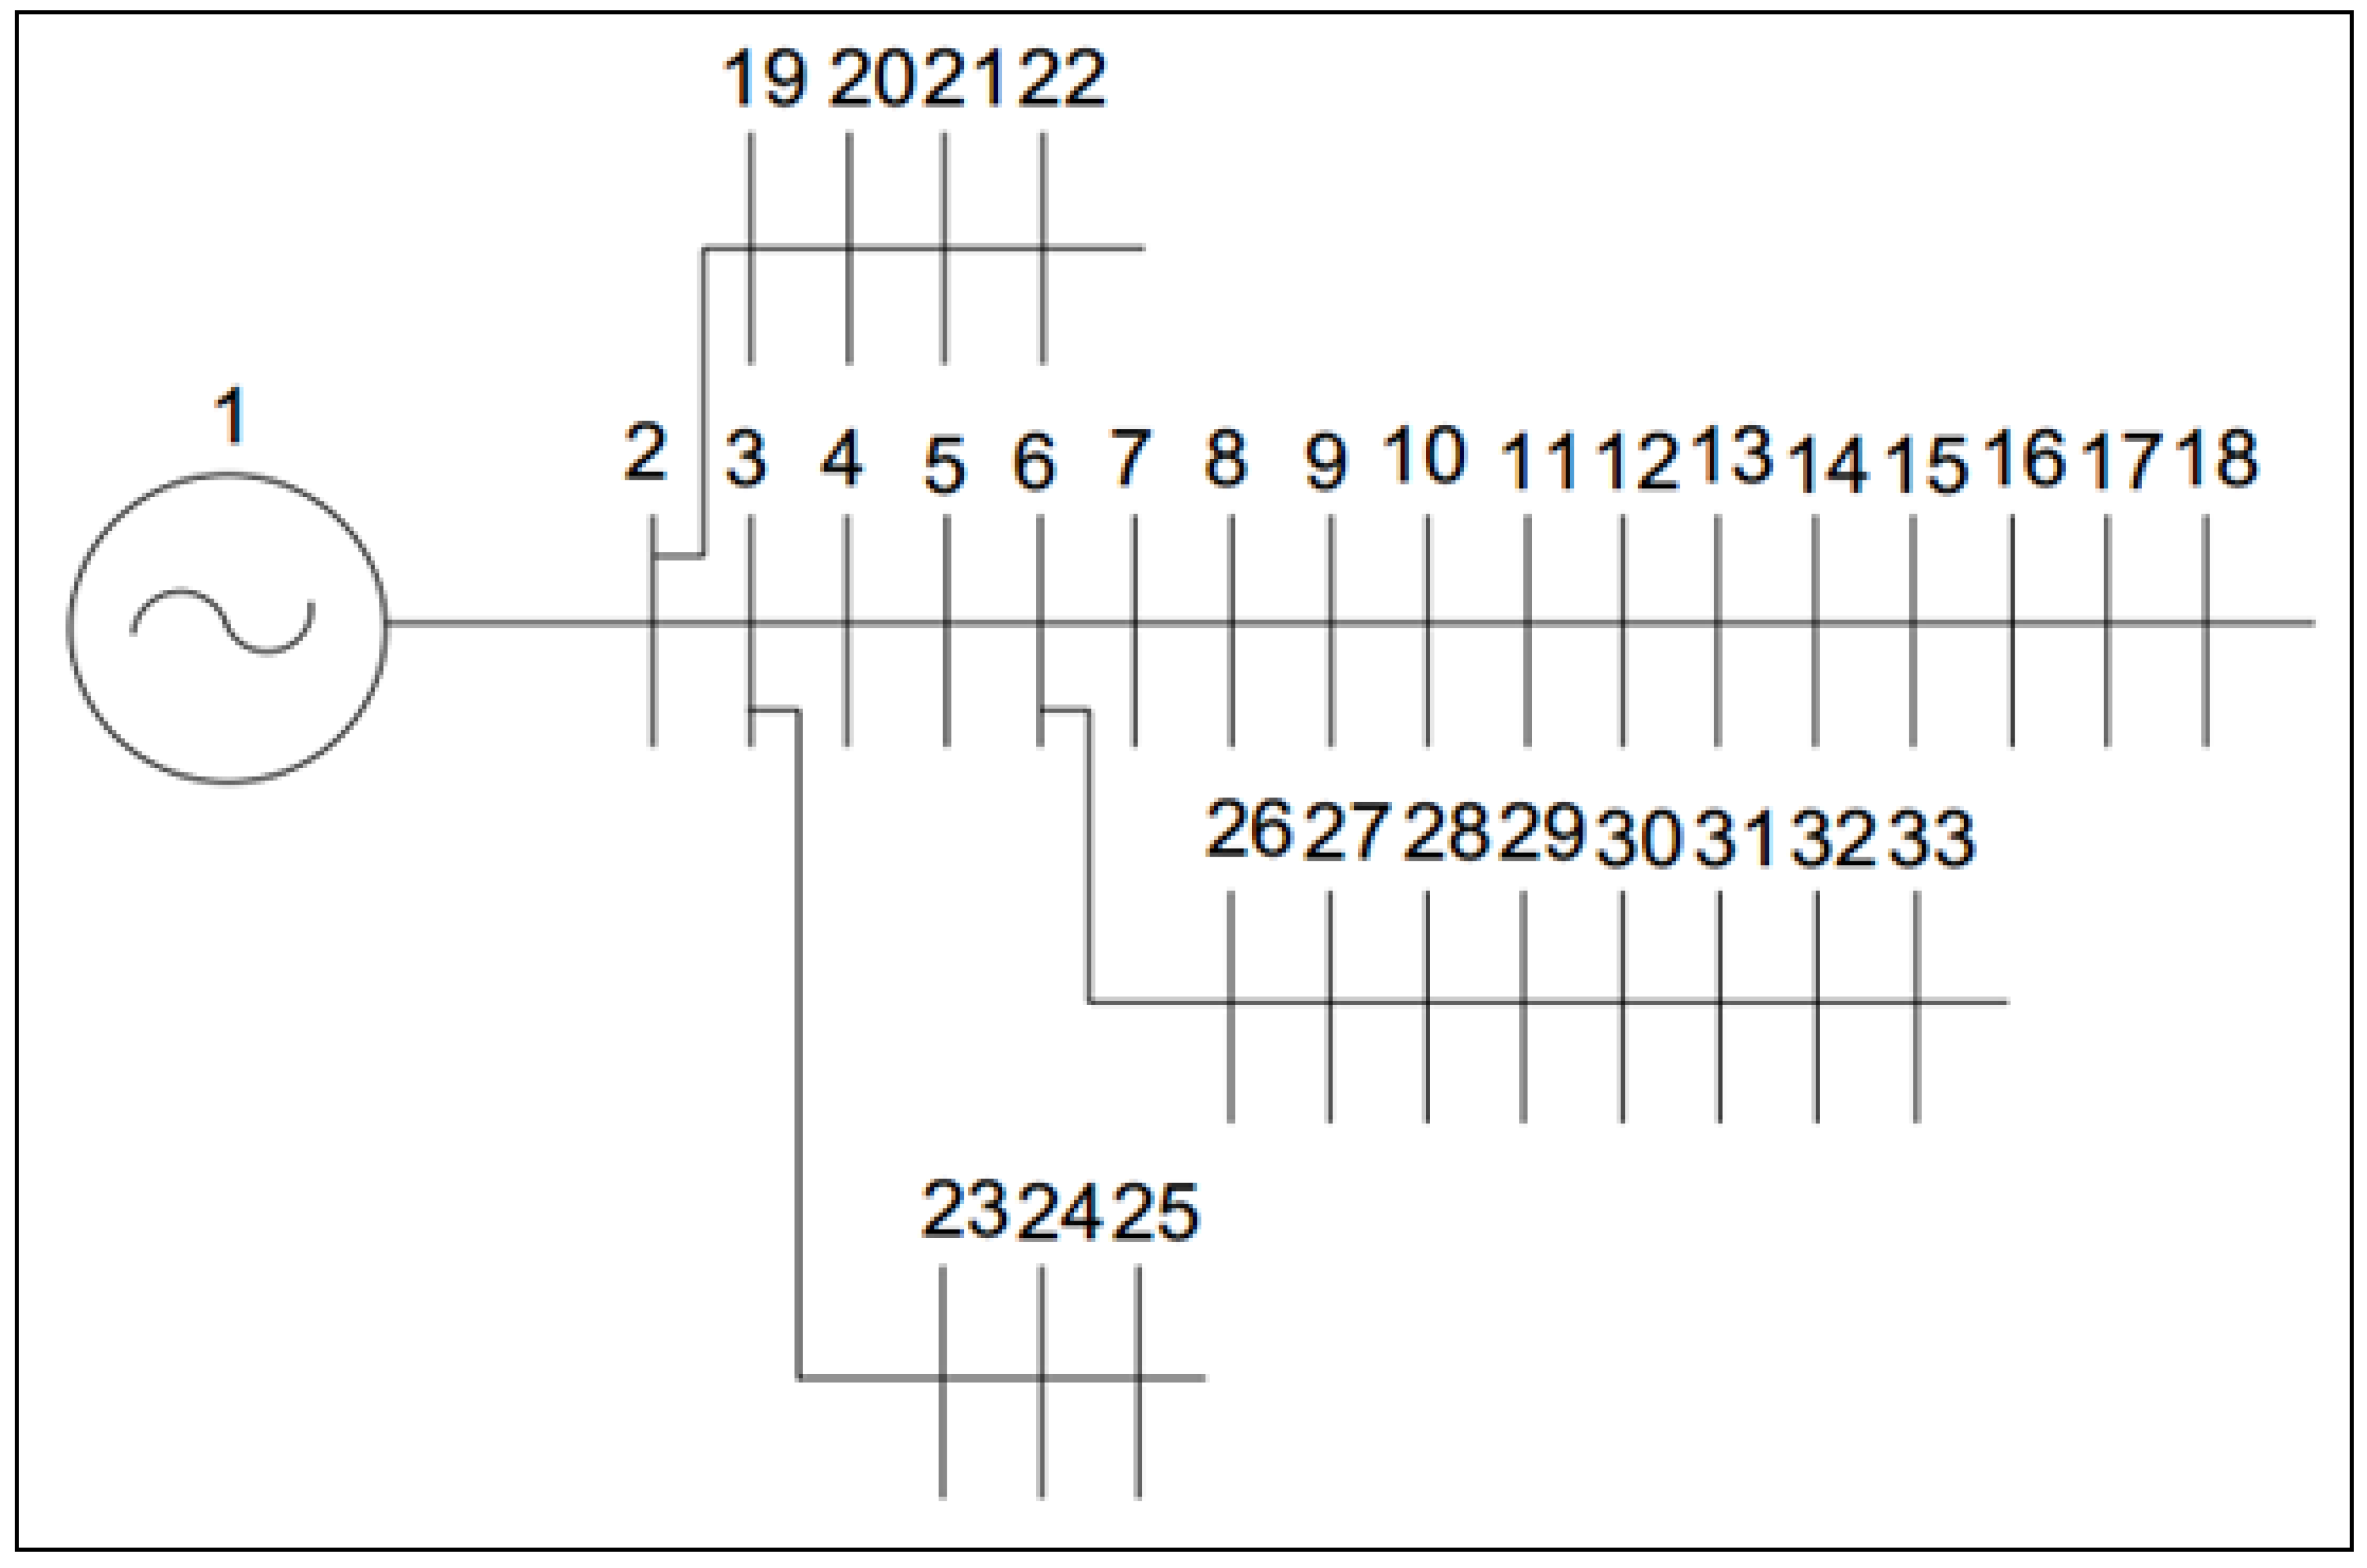
4.1. Test Network

The Institute of Electrical and Electronics Engineers (IEEE) standard 33-bus network [33] has been selected to implement the proposed method. This network has 3.72 MW of active load and 2.3 MVAr of reactive load. The amount of active network losses in the base state is 202.67 kW [33]. The single-line schematic of the 33-bus network is shown in Figure 4. The wind speed profile for 24 h is shown in Figure 5 [34]. The wind speed variation curve related to the real data of Gorgan city in Iran is related to the third day of September 2020, during which the network load is at its highest mean value. These data are derived from the Meteorological Organization by measuring devices. In proportion to the given wind speed, the wind turbine power generation curve in terms of wind speed is presented in Figure 6. Additionally, the loading coefficients are demonstrated in Figure 7. Changes in load coefficients have been measured based on the smart equipment of the electricity distribution company. Smart metering refers to all infrastructures including smart meters, communication networks/infrastructure between smart meters, and other relevant institutions such as energy consumers, meter operators, power supply or electricity meters, and data management systems. The OSPF based on the AOA is implemented with MATLAB software (R2016b) with a personal computer with Core i7, 3.1 GHz central processing point (CPU), 8 GB memory, 1 T Hard Disk Drive (HDD), and Windows 8 system.
Therefore, according to the wind turbine power generation curve in terms of wind speed, the amount of turbine power generation is calculated as a ratio of the turbine peak power per hour of study. In this study, the cost per kW of wind power is equal to United States dollar (USD) 0.068 [35], the cost per kW of parking power is equal to USD 1, the cost per kW of losses is equal to USD 0.06 [36], and the cost per kW received from the main network is estimated at USD 2. It is assumed that the minimum and maximum state of charge of the batteries are equal to 25 and 90%, respectively. In this study, a maximum of three wind turbines of 500 kW have been considered for installation. The parking lots also include a maximum of eight parking lots considering that each parking lot is equivalent to 200 vehicles and each of them has a 16-kWh battery energy in full charge.
In this study, the design is implemented for 24 h of network peak load. The network voltage profile curve under peak load conditions and the most severe voltage deviation and the minimum network voltage curve are plotted in Figure 8. The lowest network voltage is 0.9134 p.u, which is out of the allowable voltage range. The base results of the distribution network obtained from backward–forward power flow are presented in Table 1. The cost of power loss, cost of the grid, and also minimum voltage are achieved at USD 57.02, USD 75,011, and 0.9134 p.u for the 24 h study period. The total cost in the case study is USD 75,068.

4.2. Simulation Cases

The OSPF for the allocation of parking lots integrated with wind turbines is implemented in three cases in the 33-bus distribution network as follows [37]: Case 1# OSPF with minimizing the cost of power losses, Case 2# OSPF with minimizing the voltage deviations, and Case 3# OSPF with minimizing the total objective (Equation (1)). The results of the OSPF based on the AOA for the allocation of parking lots integrated with wind turbines are implemented in three cases. The convergence curve of the AOA in the problem solution is depicted in Figure 9. The convergence process of the AOA in the optimization of the problem and achieving the optimal variables is plotted in this figure for the three cases.
The optimal size and location of wind turbines and also the PHEVs are given in Table 2 and Table 3, respectively. The AOA determines two turbines for cases 1 and 2 and also three turbines for case 3. Moreover, the AOA considers seven parking lots for case 1 and also four parking lots for cases 2 and 3.
The numerical results of PV and PHEV sizing and placement in the 33-bus distribution network include the cost of power loss, cost of the grid, cost of PHEVs, cost of WTs, total cost, voltage deviation, and also the voltage minimum, which are presented in Table 4. The results show that the cost of losses in case 1 as a single-objective OSPF with the aim of minimizing the power losses is lower than the other cases. Additionally, the voltage deviation in case 2 with the objective of voltage deviation minimization is less than cases 1 and 3 as a single-objective OSPF. The results show that by considering the cost in the objective function as the third case (total objective function), the system’s total cost is less than the other cases, and also the cost of power purchased from the main grid is significantly reduced compared to cases 1 and 2. The cost of grid power in cases 1, 2, and 3 is USD 47,012, USD 45,876, and USD 29,271. The total cost of the multi-objective OSPF in case 3 is found at USD 31,123, while this cost is USD 48,584 and USD 47,291 in cases 1 and 2, respectively. So, the multi-objective OSPF is the optimal case to improve the network performance.

4.3. Comparison of the Results
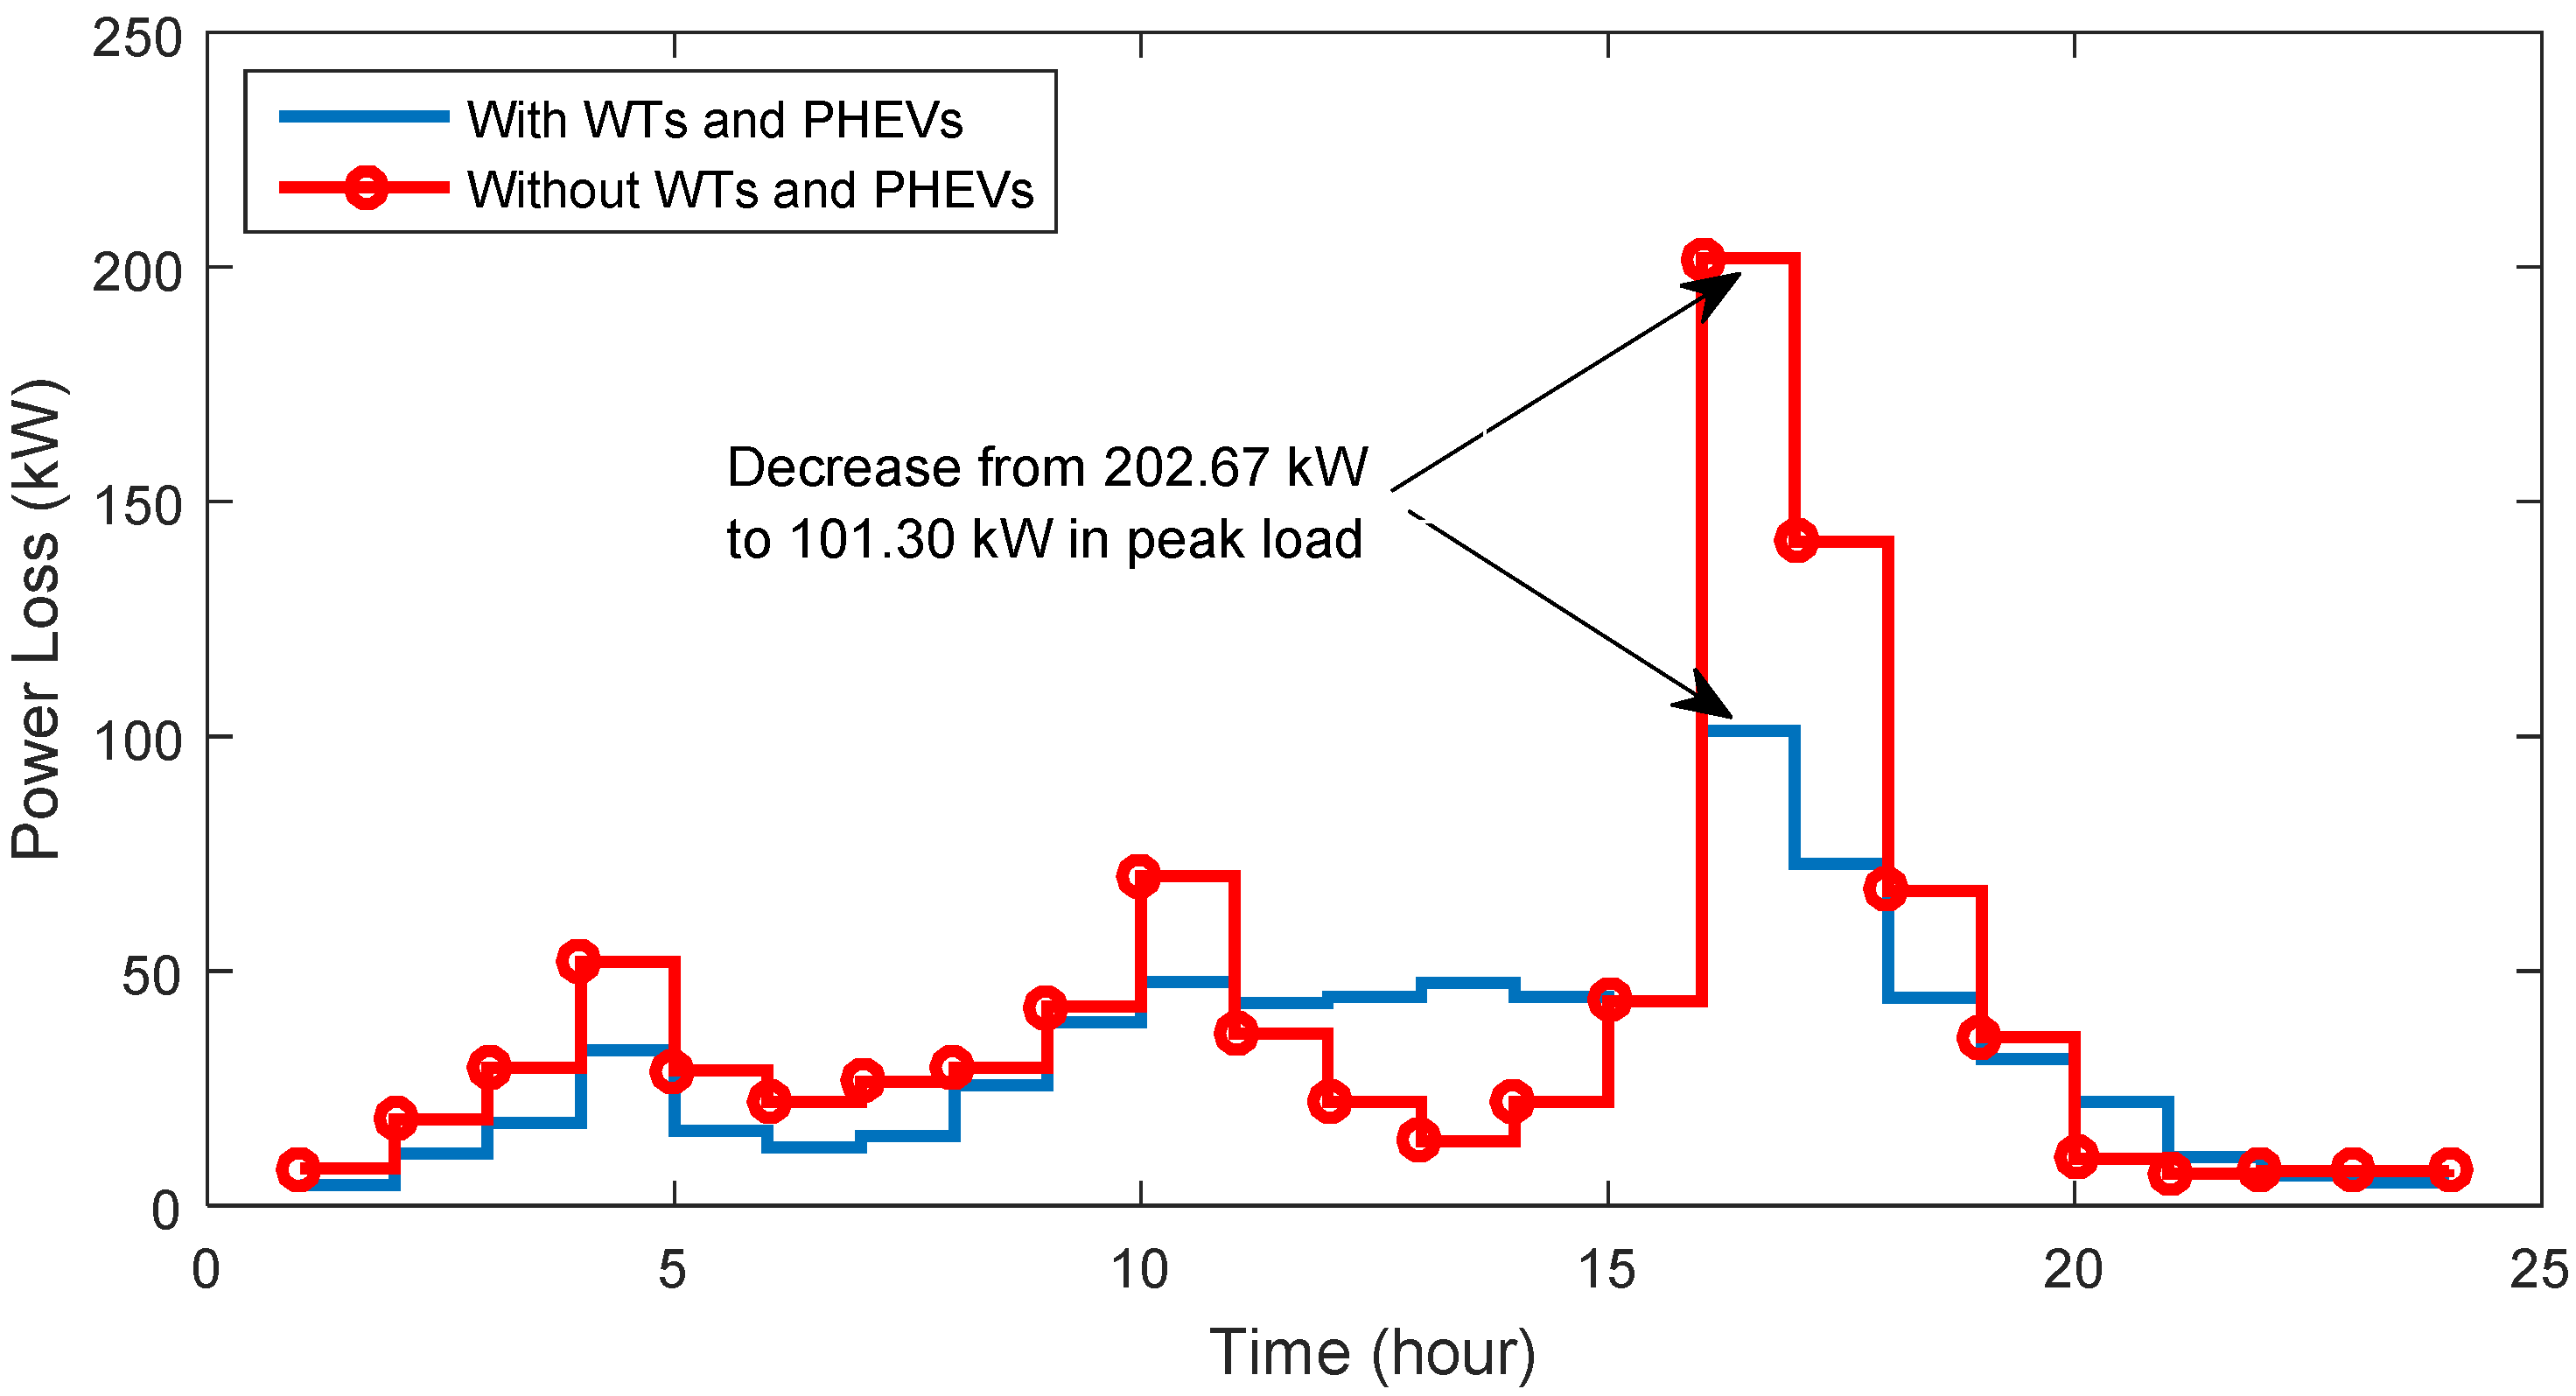
4.3.1. Power Loss

In the base network without wind resources and parking, the amount of network losses in the 24-h peak period is equal to 950.39 kW, and after the sizing and placement of electric parking lots and wind resources in case 3, the value of losses is reduced to 743.33 kW (21.78% reduction). The variation in the active power loss per hour is also plotted in Figure 10. It can be seen that with the optimal use of electric parking lots and wind resources, the amount of losses in peak load hour has been reduced from 202.67 kW to 101.30 kW.

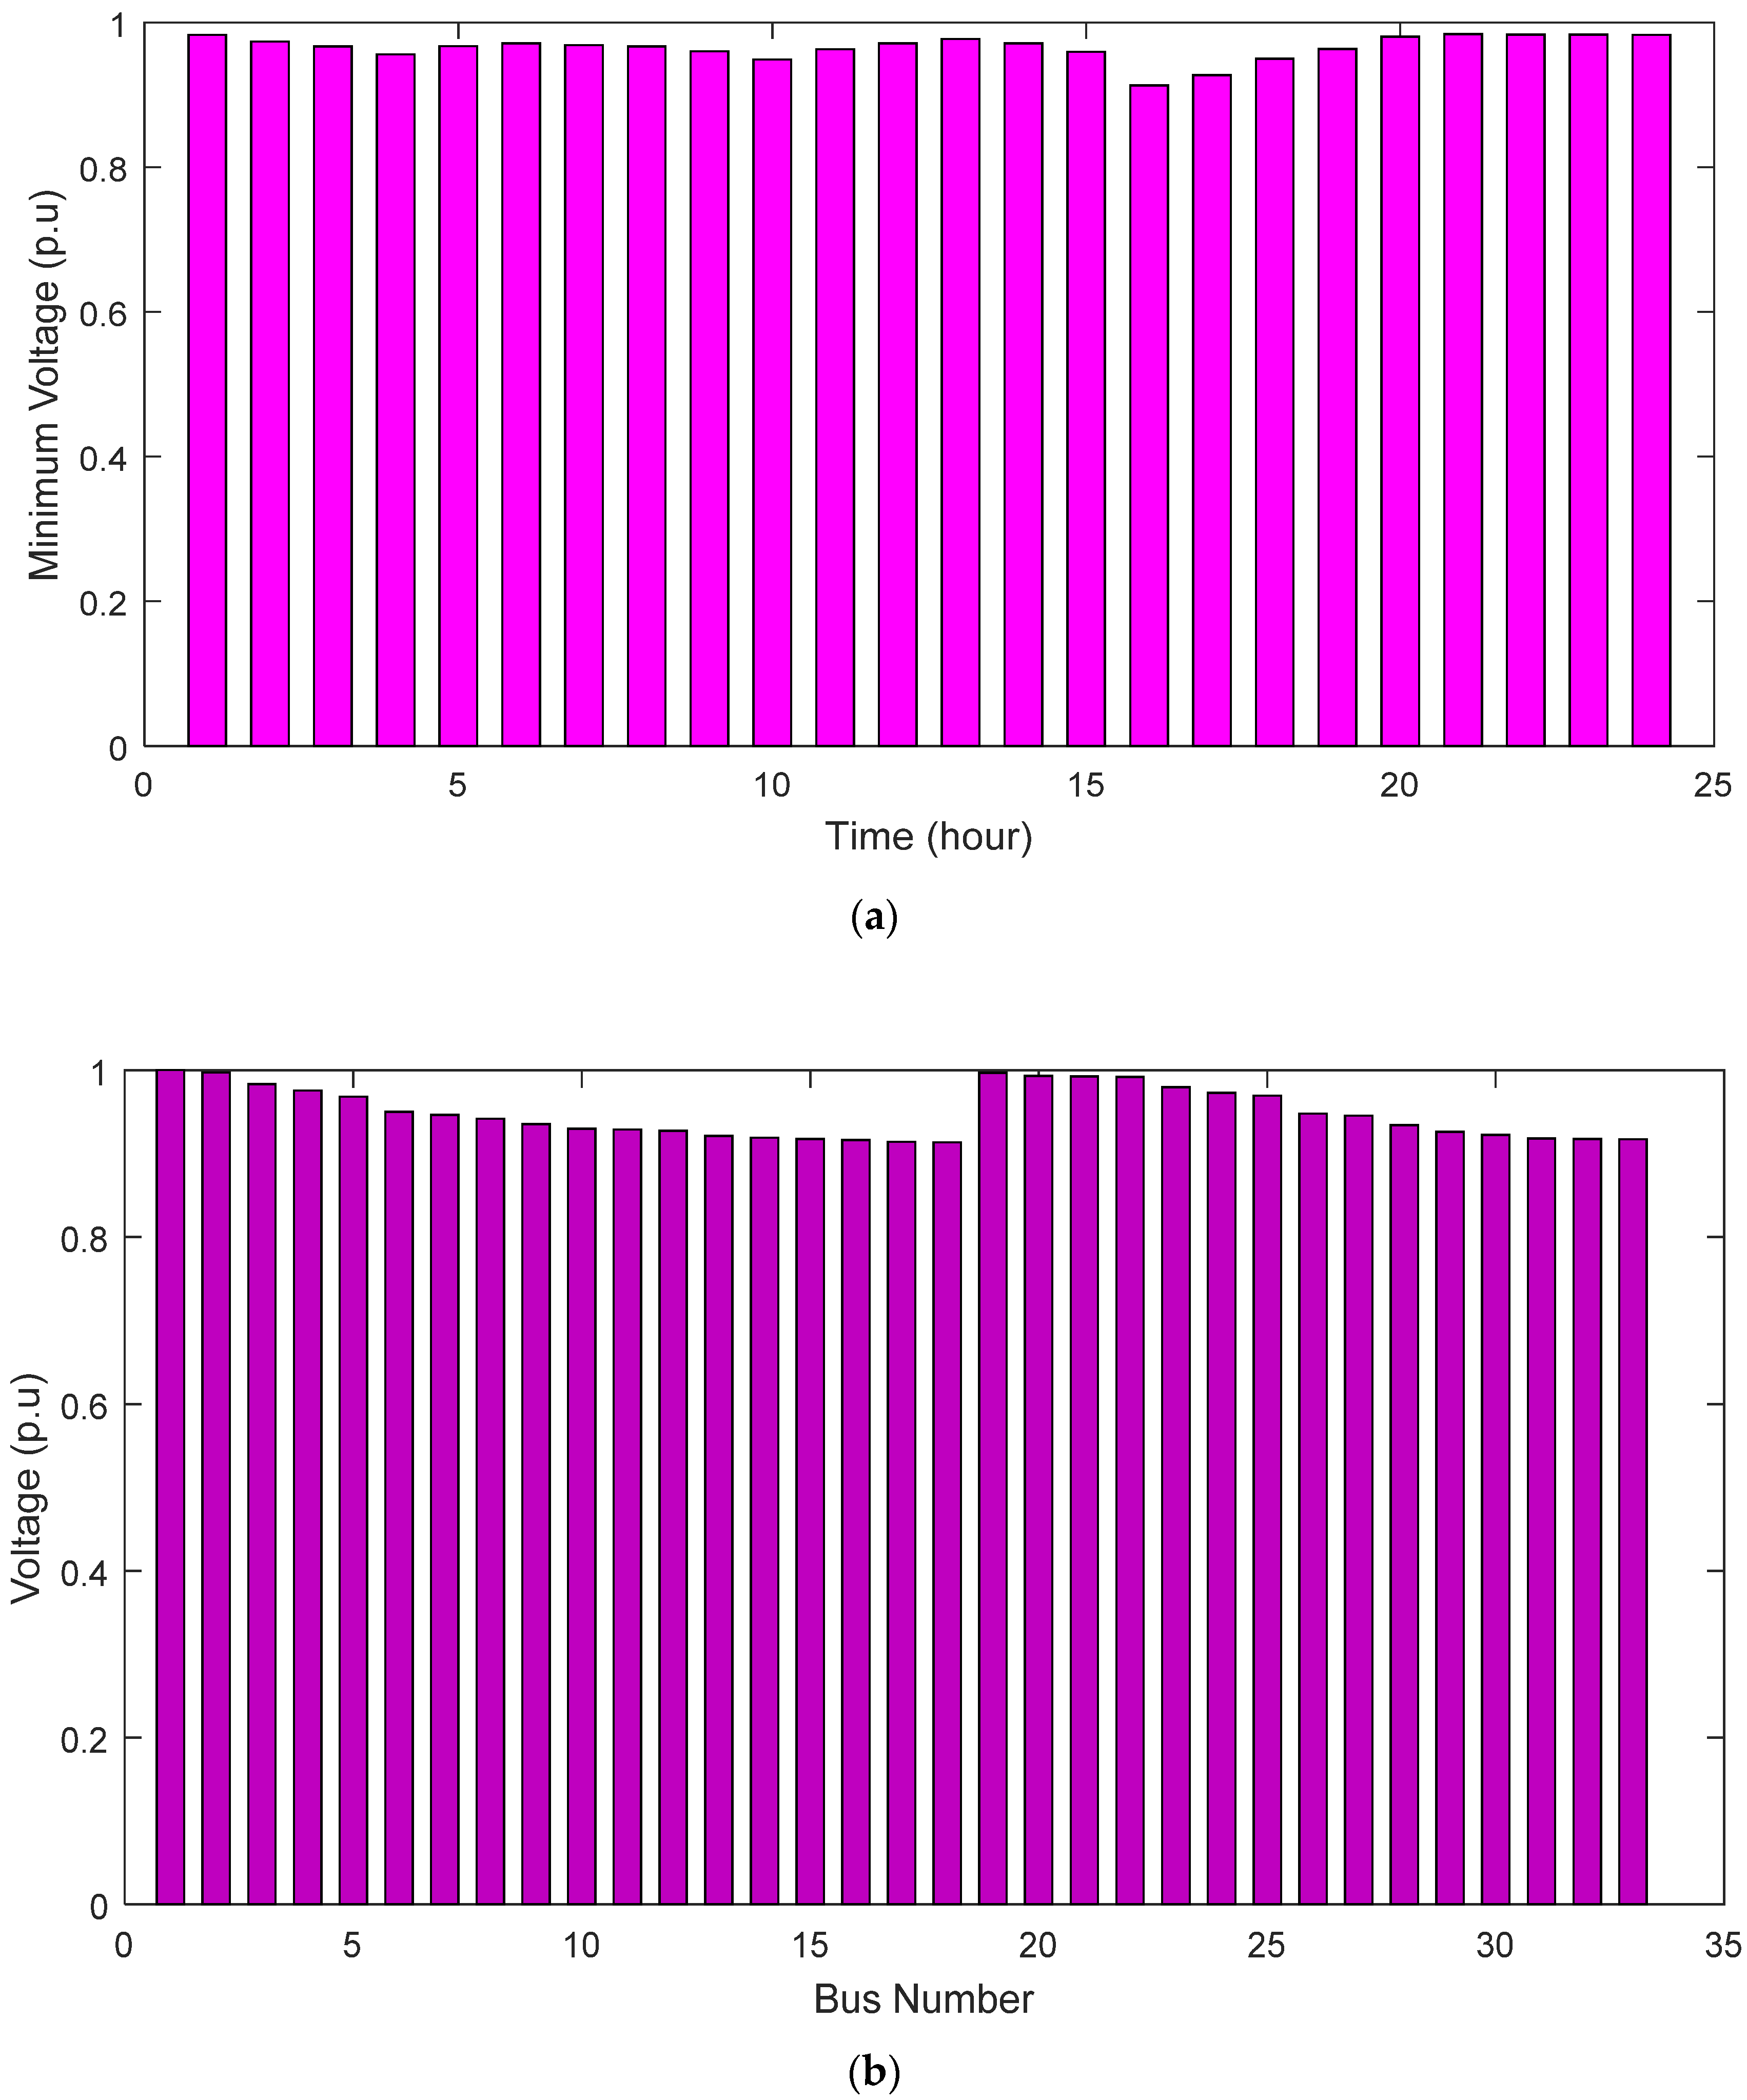
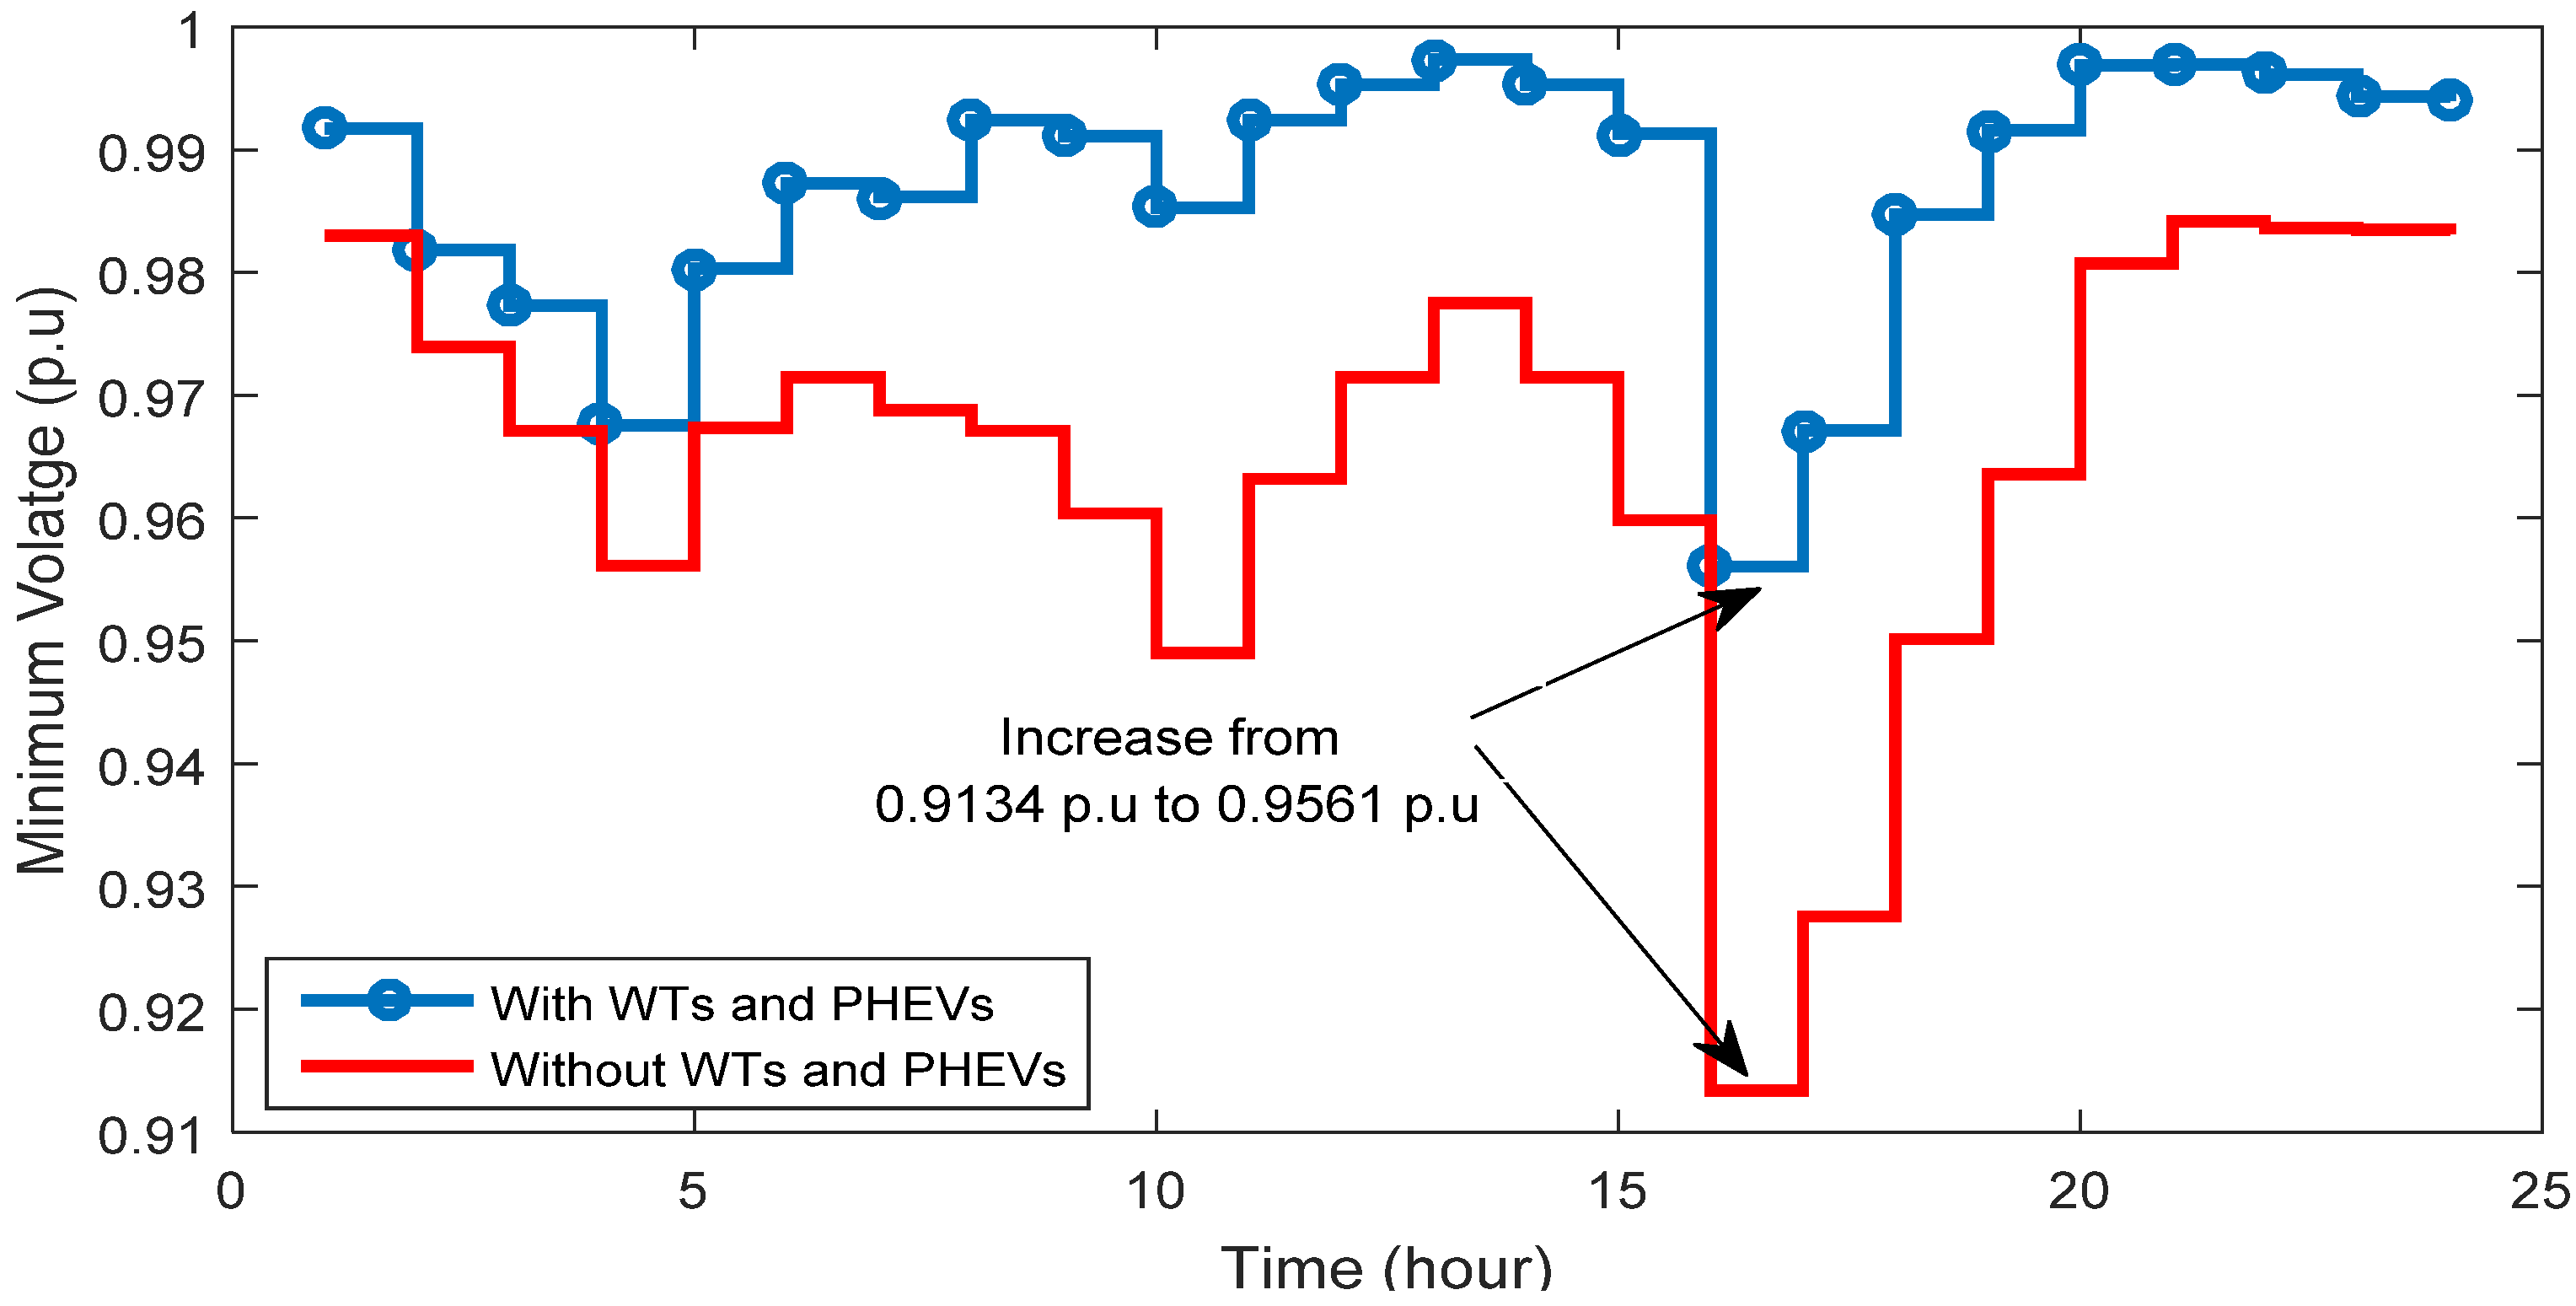
4.3.2. Minimum Voltage
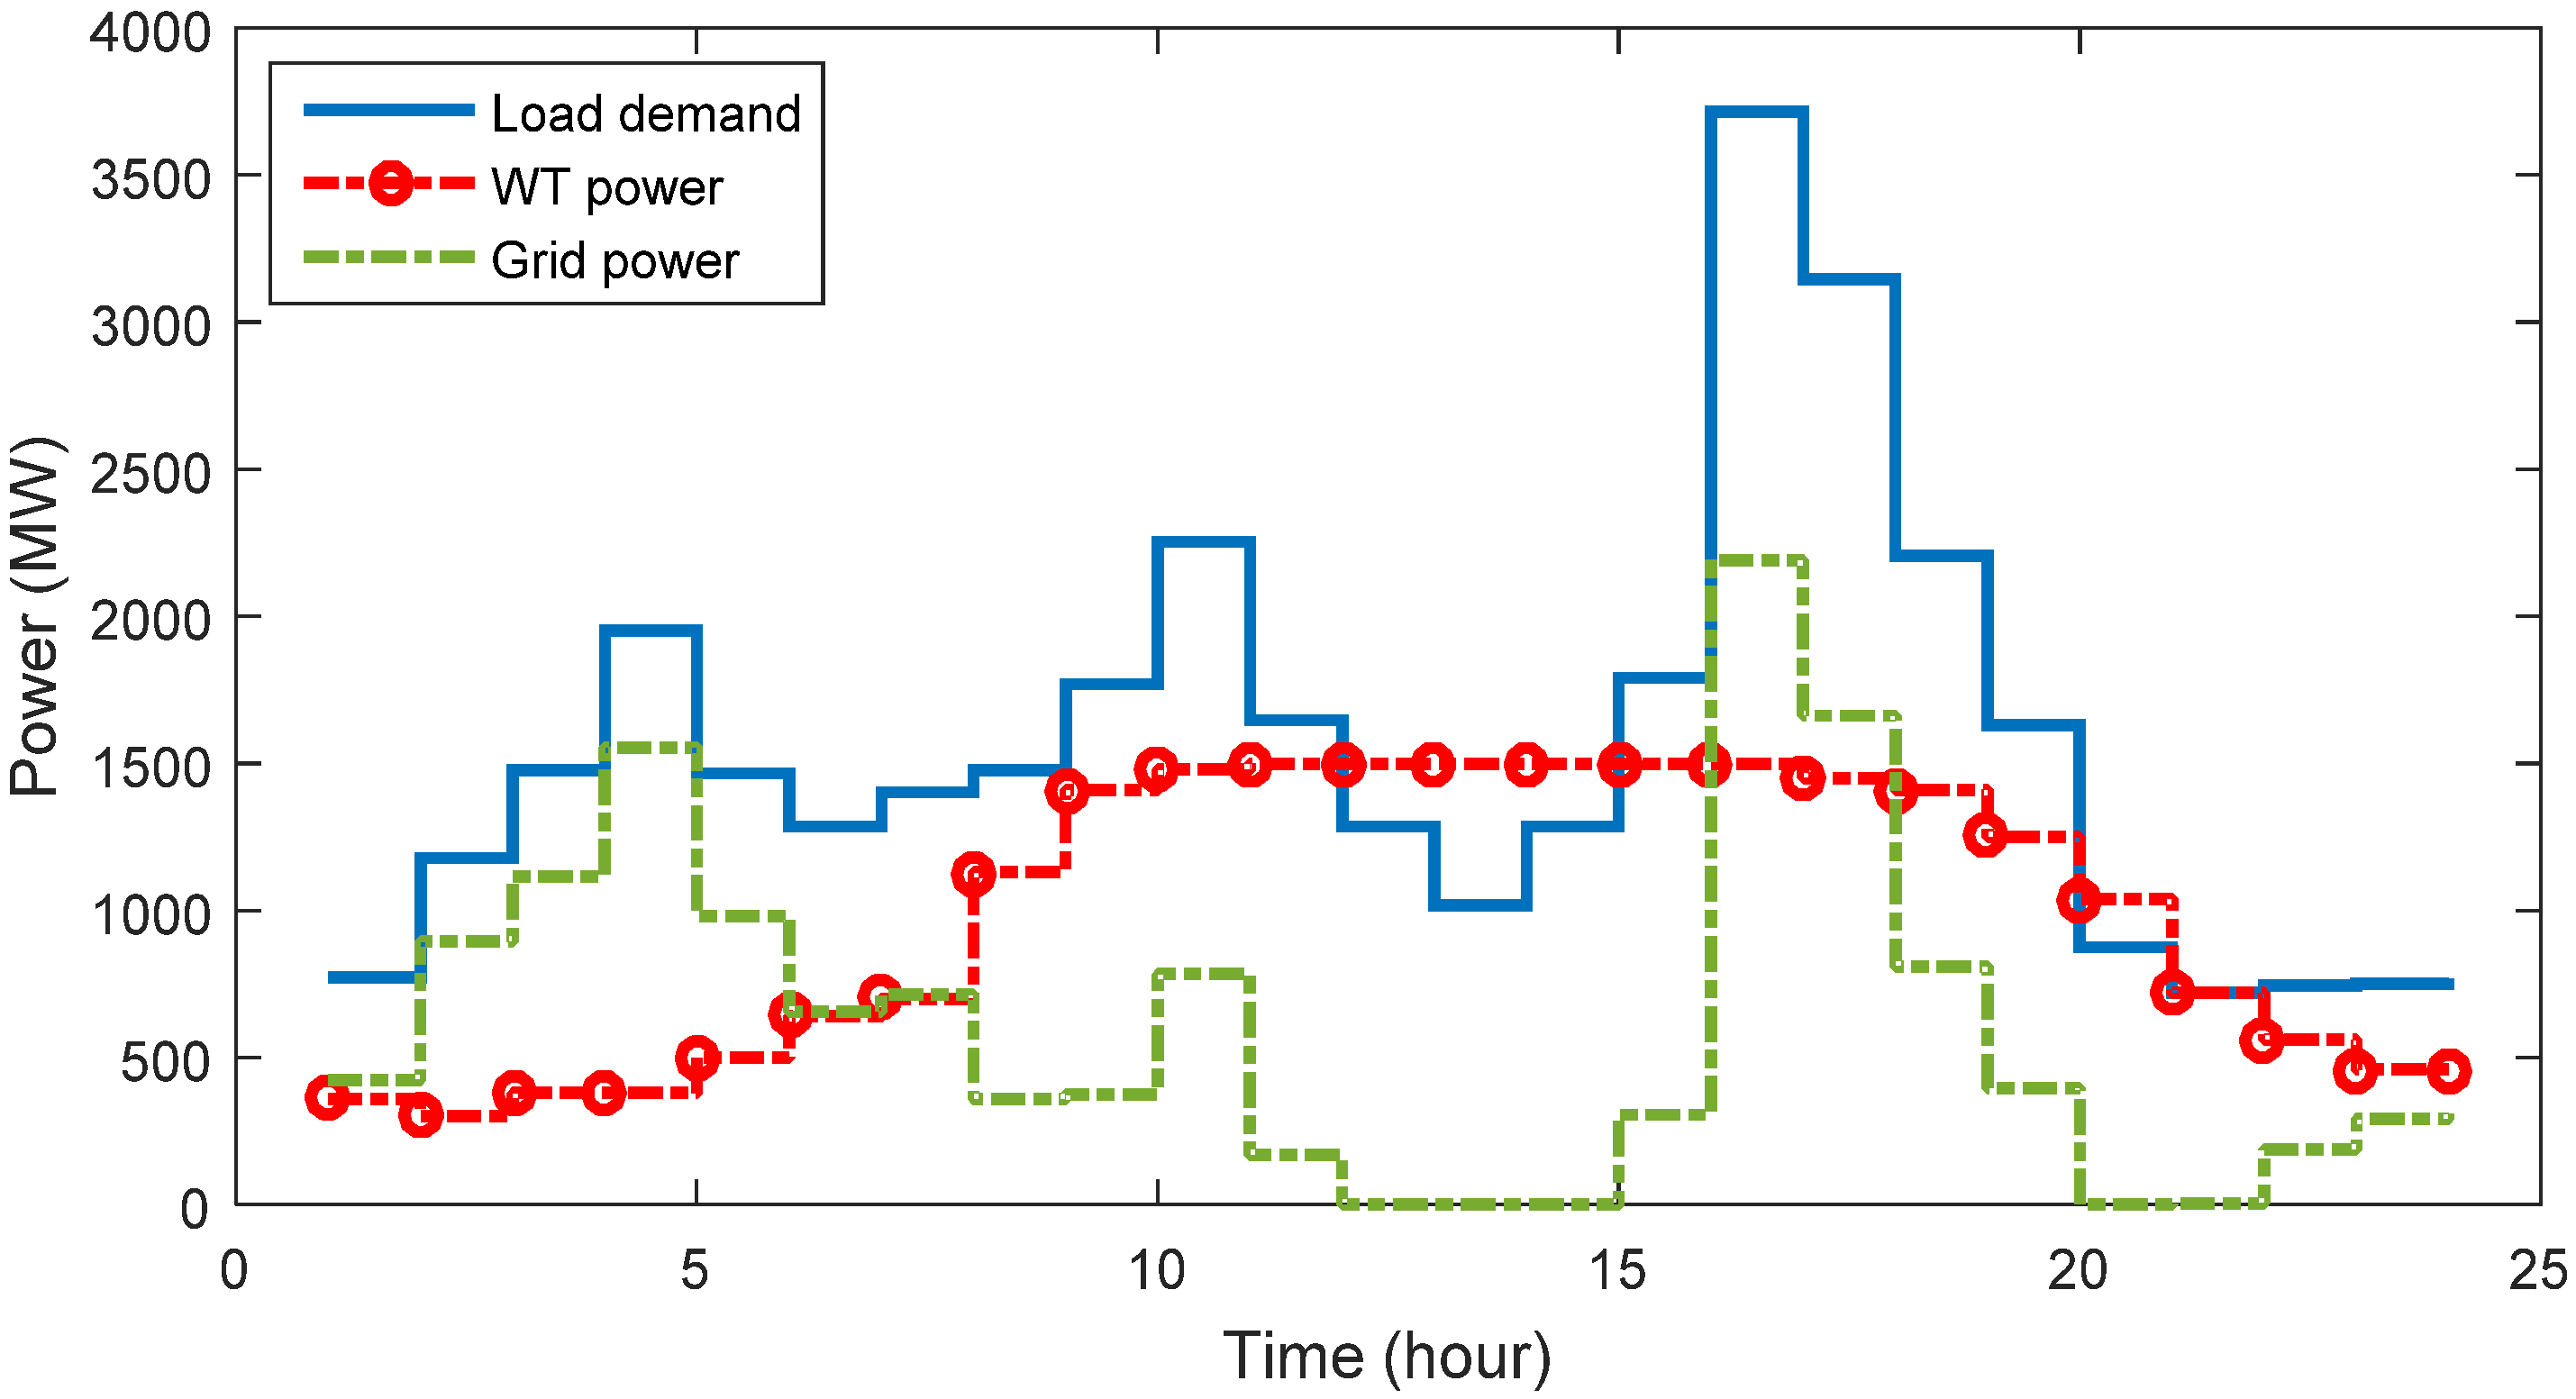
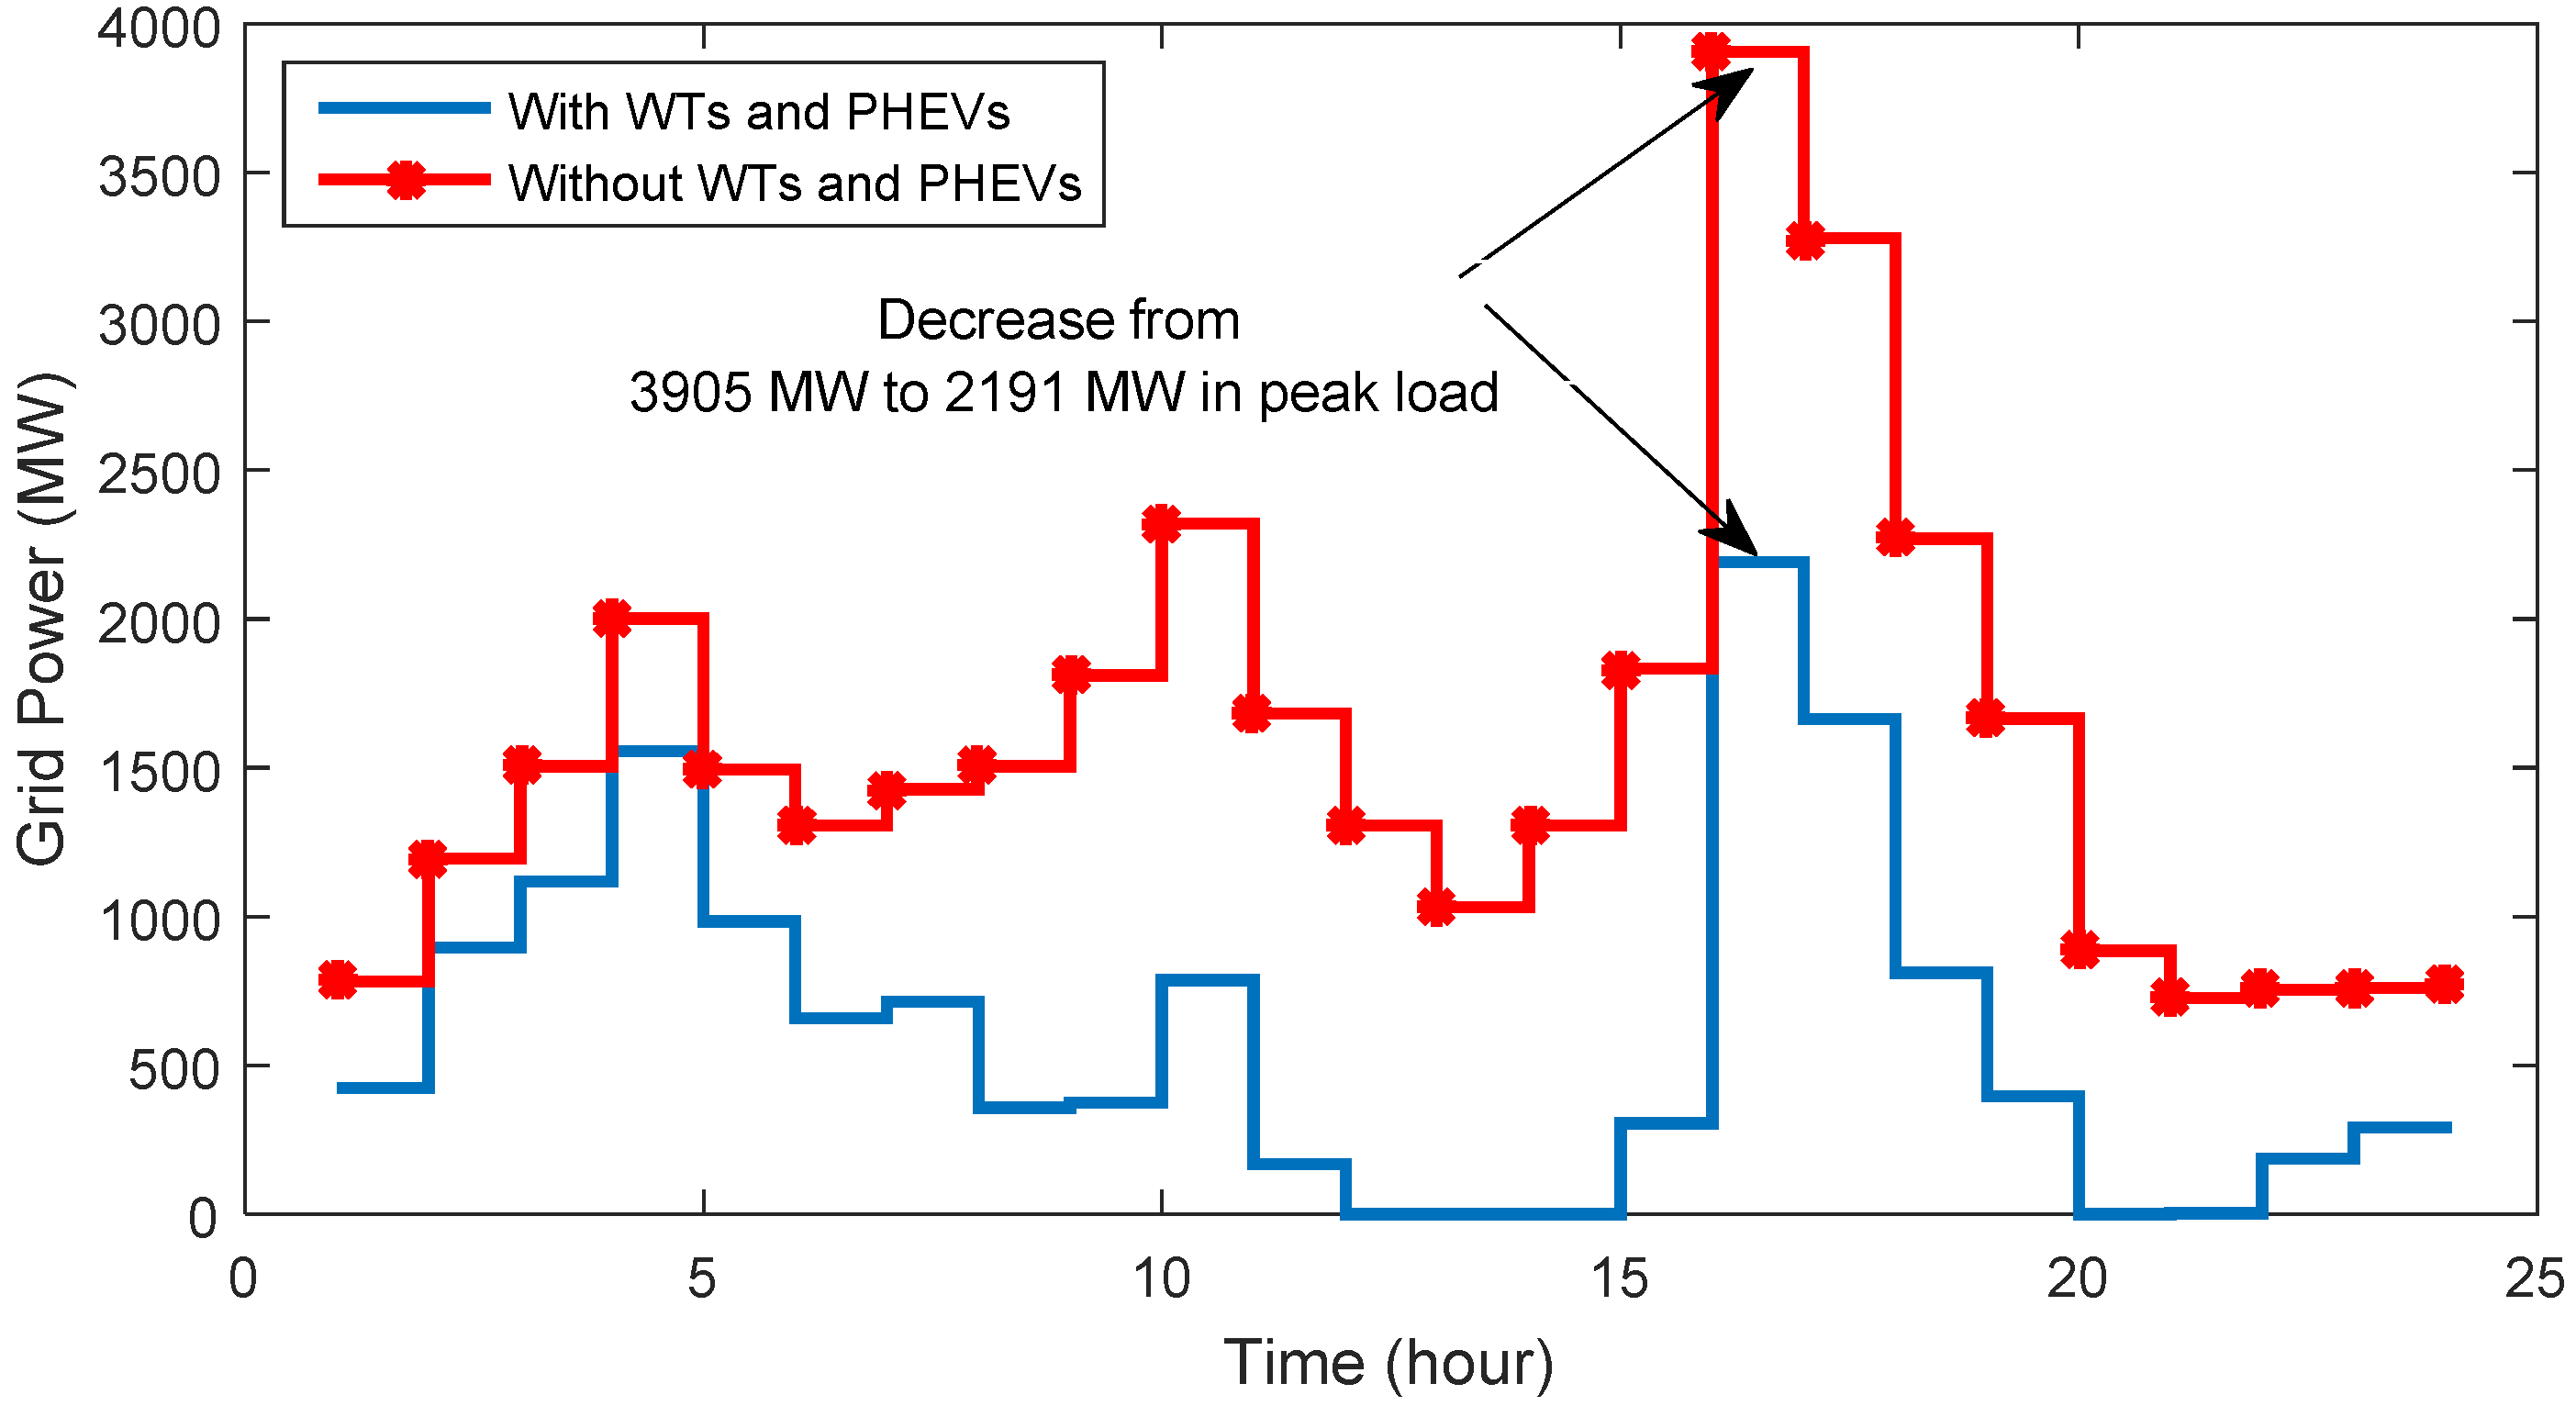
The minimum voltage curve of the 33-bus network is shown in Figure 11, which shows that the minimum voltage of the buses is out of range at 16:00 and this voltage is equal to 0.9134 p.u. According to Figure 11, using the OSPF, the voltage is placed in the allowable range at all hours and the voltage is never less than 0.95 p.u. The minimum voltage is increased from 0.9134 p.u to 0.9561 p.u at 16:00 using the multi-objective OSPF via the AOA.

4.3.3. Grid Power

Figure 12 illustrates the power purchased from the main grid. Without the OSPF in the base network, in 71% of the hours, the allowable level of power received from the main feeder is not observed and all network loads and system losses are supplied from the main grid. After using the multi-objective OSPF, the purchased power is reduced from 3905 kW to 2191 kW in peak load hour (43.89% reduction).

4.3.4. Contribution of the Wind Resources and Grid

In this section, changes in the generated power of wind resources along with changes in the power purchased from the grid to supply the load demand are demonstrated in Figure 13. The grid power is intended as a backup to supply the load.

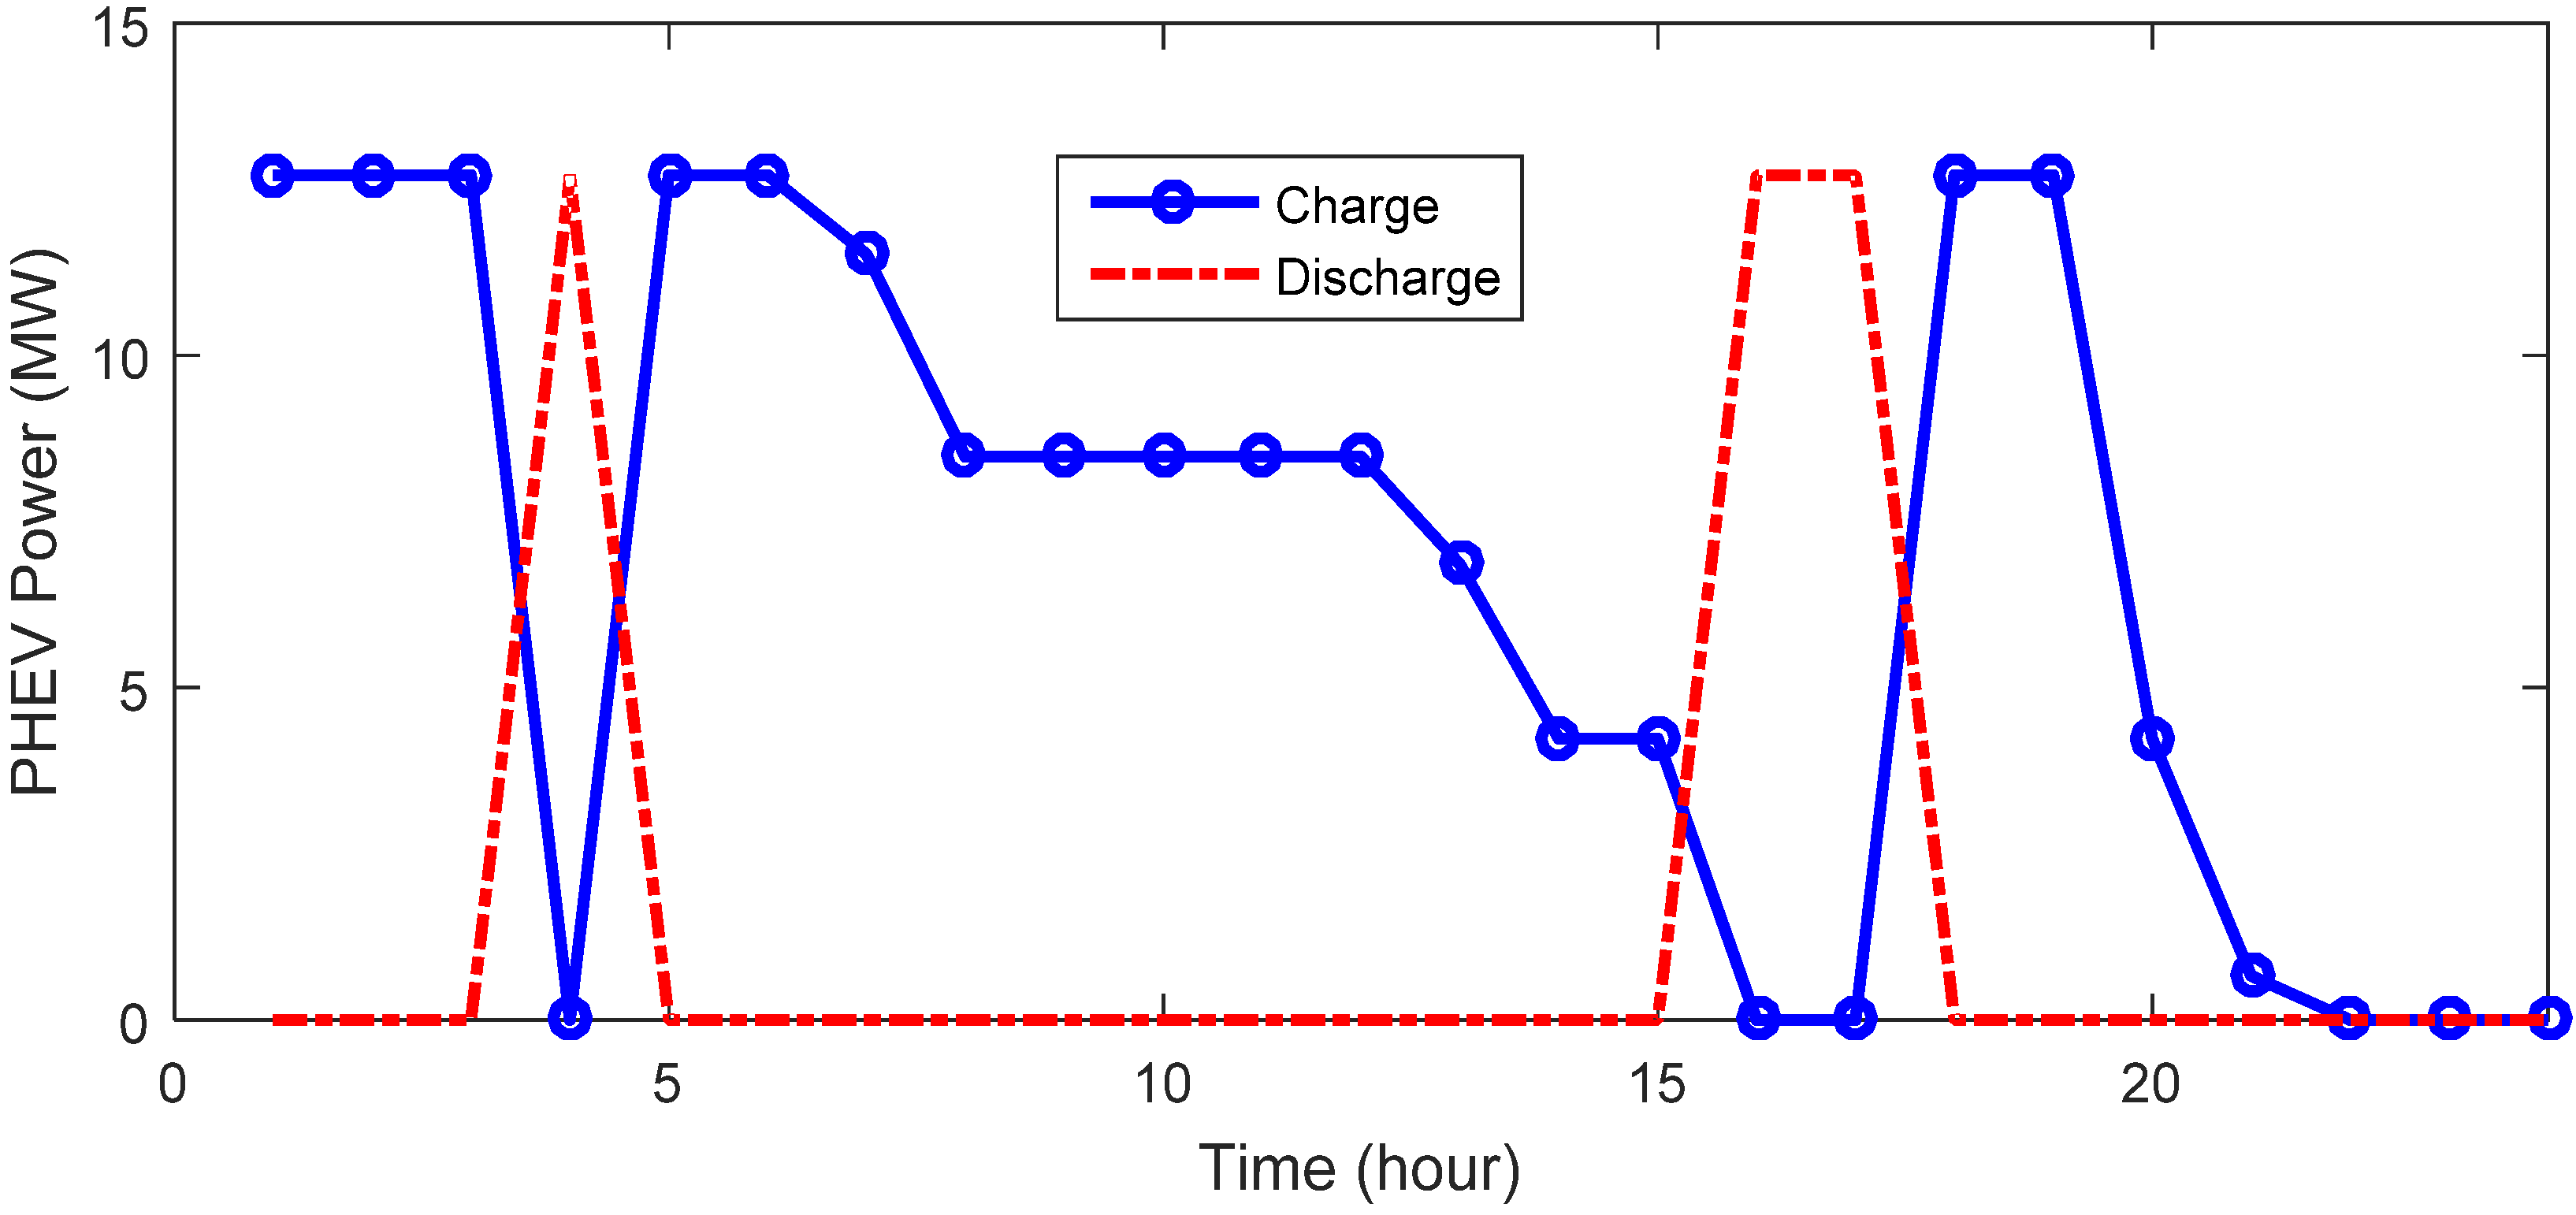
4.3.5. Charge and Discharge of the Batteries

Figure 14 shows the power batteries of the electric parking lots in the 33-bus network. In different network loading conditions, vehicles are charged and discharged at different hours, and especially at peak consumption hours (16:00), parking lots inject power as a DG source (discharge to the network). At 17:00, with the reduction in the network loading coefficients, the batteries of the electric parking lots are charged and the charging process continues until 22:00. Therefore, in the network load peaks, the charge level is decreased and the discharge level of the batteries is increased.

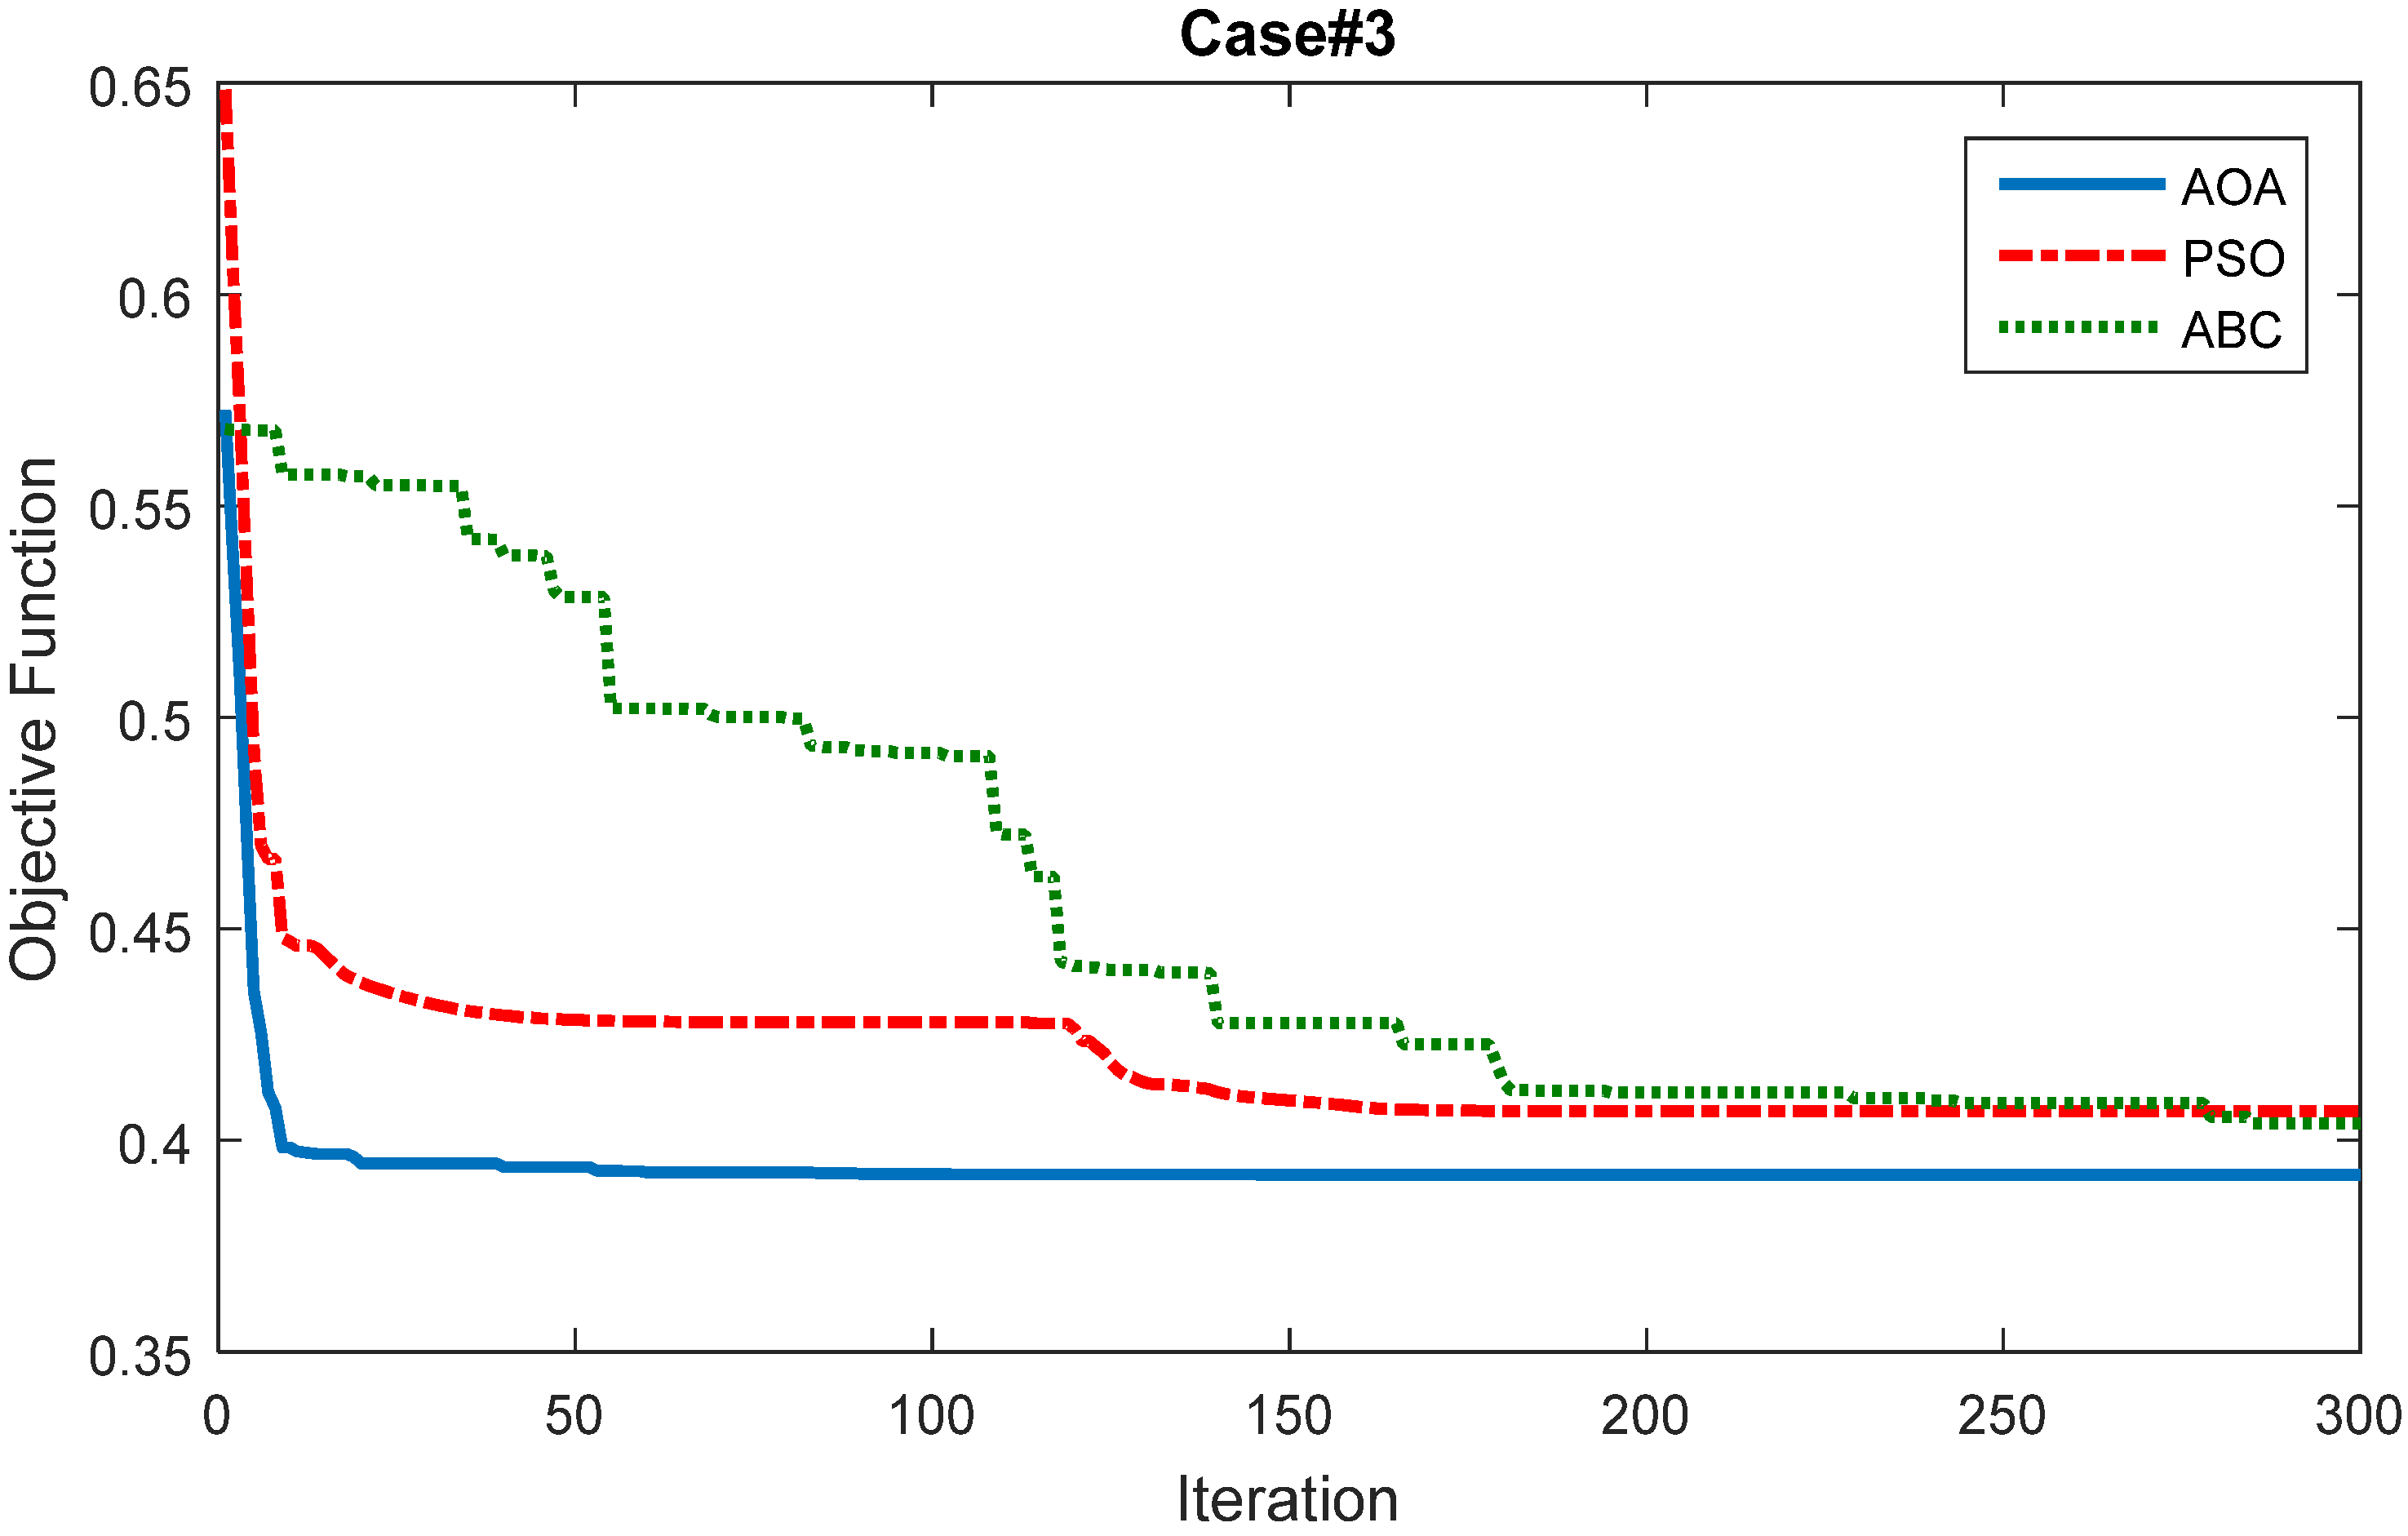
4.4. Comparison of the AOA Results with PSO and ABC

In this section, the performance of the OSPF via the AOA in case 3 is compared with the well-known PSO and ABC algorithms. The convergence curve of different methods is presented in Figure 15. As shown in Figure 15, the proposed AOA achieved a better objective function (lower value) with a higher convergence speed and lower convergence tolerance. The optimal size and installation location of the wind turbines and also parking lots are given in Table 5 and Table 6, respectively. Additionally, the comparison results of the different algorithms, including the cost values and voltage deviations, are given in Table 7. The total cost using the AOA, PSO, and ABC is USD 31,123, USD 31,264, and USD 32,480, respectively. According to Table 7, the total cost of the system is lower than the other algorithms. Additionally, the cost of grid power obtained by the AOA is the lowest value compared with the PSO and ABC methods. Therefore, the results prove the superiority of the OSPF via the AOA.

4.5. Comparison Results of the AOA with Previous Studies

The results of the OSPF solved via AOA are compared with previous studies as presented in Table 8. In [30], the sizing and placement of renewable energy resources with the size of 3 MW are evaluated to minimize the losses and voltage deviation reduction with an ant lion optimizer (ALO). Additionally, in [36], the multi-objective optimization of renewable energy resources with the size of 3 MW is studied to minimize the losses and reliability improvement in the 33-bus distribution network using the multi-objective hybrid teaching–learning optimizer-grey wolf optimization method (MOHTLBOGWO). The results confirmed the better performance of the OSPF via AOA in the operation of the distribution network compared with the ALO [36] and MOHTLBOGWO [30] in achieving lower power loss and more minimum voltage.

5. Conclusions

In this paper, the OSPF was presented for the allocation of electric parking lots and wind turbines in a distribution network with the load following strategy. In the OSPF, the multi-criteria objective function was formulated as the minimization of the energy generation cost as well as voltage deviation reduction. The optimization variables were selected as the location and size of the number of vehicles in the parking lots and wind resource size in the 33-bus distribution network. The AOA was applied to find the optimal variables in the OSPF. The simulations were implemented in different cases of objective functions. The simulation results of the 33-bus distribution network showed that the proposed OSPF based on the AOA in the third case obtained the lowest energy cost, the minimum cost of grid power, and also the lowest voltage deviation compared to the cases without device costs. The results showed that with the optimal sizing and placement of the electric parking lots and optimal contribution of wind resources, the losses and voltage deviations of the electrical network are considerably reduced. Additionally, based on the OSPF, purchased power from the main grid was decreased by injecting power using parking lots and wind units into the network. The losses were reduced from 950.39 kW to 743.33 kW with a 21.78% reduction, the minimum voltage improved from 0.9134 p.u to 0.9561 p.u, and the cost of grid power reduced from 3905 kW to 2191 kW in peak load hour with a 43.89% reduction using the multi-objective OSPF via the AOA. The optimal sizing and placement of parking lots and renewable energy resources with the objective of power quality enhancement considering uncertainty are suggested for future work.

Author Contributions

Conceptualization, S.S. and F.M.; methodology, S.S. and F.M.; software, A.E.-S. and F.M.; validation, F.H.G., A.E.-S. and S.H.E.A.A.; formal analysis, F.H.G., A.E.-S. and S.H.E.A.A.; investigation, S.S. and F.M.; writing—original draft preparation, S.S. and F.M. and A.E.-S.; writing—review and editing, F.H.G., A.E.-S. and S.H.E.A.A.; visualization, S.S. and F.M. All authors have read and agreed to the published version of the manuscript.

Funding

The authors received no financial support for the research, authorship, and/or publication of this article.

Institutional Review Board Statement

Not applicable.

Informed Consent Statement

Not applicable.

Data Availability Statement

The data presented in this study are available upon request from the corresponding author. The data are not publicly available due to their large size.

Conflicts of Interest

The authors declare no potential conflict of interest with respect to the research, authorship, and/or publication of this article.

References

  1. Turan, M.T.; Ates, Y.; Erdinc, O.; Gokalp, E.; Catalão, J.P. Effect of electric vehicle parking lots equipped with roof mounted photovoltaic panels on the distribution network. Int. J. Electr. Power Energy Syst. 2019, 109, 283–289. [Google Scholar] [CrossRef]
  2. Fathy, A.; Abdelaziz, A.Y. Competition over resource optimization algorithm for optimal allocating and sizing parking lots in radial distribution network. J. Clean. Prod. 2020, 264, 121397. [Google Scholar] [CrossRef]
  3. Zeng, B.; Zhu, Z.; Xu, H.; Dong, H. Optimal Public Parking Lot Allocation and Management for Efficient PEV Accommodation in Distribution Systems. IEEE Trans. Ind. Appl. 2020, 56, 5984–5994. [Google Scholar] [CrossRef]
  4. Naderipour, A.; Abdul-Malek, Z.; Nowdeh, S.A.; Ramachandaramurthy, V.K.; Kalam, A.; Guerrero, J. Optimal allocation for combined heat and power system with respect to maximum allowable capacity for reduced losses and improved voltage profile and reliability of microgrids considering loading condition. Energy 2020, 196, 117124. [Google Scholar] [CrossRef]
  5. Savari, G.F.; Krishnasamy, V.; Sathik, J.; Ali, Z.; Aleem, S.H.A. Internet of Things based real-time electric vehicle load forecasting and charging station recommendation. ISA Trans. 2020, 97, 431–447. [Google Scholar] [CrossRef] [PubMed]
  6. Moradijoz, M.; Moghaddam, M.P.; Haghifam, M.; Alishahi, E. A multi-objective optimization problem for allocating parking lots in a distribution network. Int. J. Electr. Power Energy Syst. 2013, 46, 115–122. [Google Scholar] [CrossRef]
  7. Shariatpanah, H.; Sabourikenari, M.; Mohammadian, M.; Rashidinejad, M. Optimal placement and determine parking capacity of electric vehicles to improve VSM and congestion. In Proceedings of the Iranian Conference on Smart Grids, Mashhad, Iran, 14–16 May 2012; pp. 1–6. [Google Scholar]
  8. Moradijoz, M.; Ghazanfarimeymand, A.; Moghaddam, M.P.; Haghifam, M.R. Optimum placement of distributed generation and parking lots for loss reduction in distribution networks. In Proceedings of the 2012 17th Conference on Electrical Power Distribution, Tehran, Iran, 2–3 May 2012; pp. 1–5. [Google Scholar]
  9. Rahman, I.; Vasant, P.M.; Singh, B.S.M.; Abdullah-Al-Wadud, M. On the performance of accelerated particle swarm optimization for charging plug-in hybrid electric vehicles. Alex. Eng. J. 2016, 55, 419–426. [Google Scholar] [CrossRef] [Green Version]
  10. Clement-Nyns, K.; Haesen, E.; Driesen, J. The impact of vehicle-to-grid on the distribution grid. Electr. Power Syst. Res. 2011, 81, 185–192. [Google Scholar] [CrossRef]
  11. Sousa, T.; Morais, H.; Soares, J.; Vale, Z. Day-ahead resource scheduling in smart grids considering Vehicle-to-Grid and network constraints. Appl. Energy 2012, 96, 183–193. [Google Scholar] [CrossRef] [Green Version]
  12. Torres, J.; Gonzalez, R.; Gimenez, A.; Lopez, J. Energy management strategy for plug-in hybrid electric vehicles. A comparative study. Appl. Energy 2013, 113, 816–824. [Google Scholar] [CrossRef]
  13. Hutson, C.; Venayagamoorthy, G.K.; Corzine, K.A. Intelligent scheduling of hybrid and electric vehicle storage capacity in a parking lot for profit maximization in grid power transactions. In Proceedings of the 2008 IEEE Energy 2030 Conference, Atlanta, GA, USA, 17–18 November 2008; pp. 1–8. [Google Scholar]
  14. Fazelpour, F.; Vafaeipour, M.; Rahbari, O.; Rosen, M.A. Intelligent optimization to integrate a plug-in hybrid electric vehicle smart parking lot with renewable energy resources and enhance grid characteristics. Energy Convers. Manag. 2013, 77, 250–261. [Google Scholar] [CrossRef]
  15. Han, S.; Han, S.; Sezaki, K. Development of an optimal vehicle-to-grid aggregator for frequency regulation. IEEE Trans. Smart Grid 2010, 1, 65–72. [Google Scholar]
  16. Mohsenzadeh, A.; Pazouki, S.; Ardalan, S.; Haghifam, M.-R. Optimal placing and sizing of parking lots including different levels of charging stations in electric distribution networks. Int. J. Ambient. Energy 2017, 39, 743–750. [Google Scholar] [CrossRef]
  17. Mohsenzadeh, A.; Pazouki, S.; Haghifam, M.R.; Pang, C. Optimal planning of parking lots and demand response programs in distribution network considering power loss and voltage profile. 2015 IEEE Power & Energy Society Innovative Smart Grid Technologies Conference (ISGT), Bangko, Thailand, 17–20 February 2015; pp. 1–5. [Google Scholar]
  18. Sattarpour, T.; Farsadi, M. Parking lot allocation with maximum economic benefit in a distribution network. Int. Trans. Electr. Energy Syst. 2016, 27, e2234. [Google Scholar] [CrossRef]
  19. Chen, L.; Xu, C.; Song, H.; Jermsittiparsert, K. Optimal sizing and sitting of EVCS in the distribution system using metaheuristics: A case study. Energy Rep. 2020, 7, 208–217. [Google Scholar] [CrossRef]
  20. Naderipour, A.; Abdul-Malek, Z.; Nowdeh, S.A.; Kamyab, H.; Ramtin, A.R.; Shahrokhi, S.; Klemeš, J. Comparative evaluation of hybrid photovoltaic, wind, tidal and fuel cell clean system design for different regions with remote application considering cost. J. Clean. Prod. 2021, 283, 124207. [Google Scholar] [CrossRef]
  21. Jafar-Nowdeh, A.; Babanezhad, M.; Arabi-Nowdeh, S.; Naderipour, A.; Kamyab, H.; Abdul-Malek, Z.; Ramachandaramurthy, V.K. Meta-heuristic matrix moth–flame algorithm for optimal reconfiguration of distribution networks and placement of solar and wind renewable sources considering reliability. Environ. Technol. Innov. 2020, 20, 101118. [Google Scholar] [CrossRef]
  22. Moghaddam, M.J.H.; Kalam, A.; Shi, J.; Nowdeh, S.A.; Gandoman, F.H.; Ahmadi, A. A New Model for Reconfiguration and Distributed Generation Allocation in Distribution Network Considering Power Quality Indices and Network Losses. IEEE Syst. J. 2020, 14, 3530–3538. [Google Scholar] [CrossRef]
  23. Abualigah, L.; Diabat, A.; Mirjalili, S.; Abd Elaziz, M.; Gandomi, A.H. The arithmetic optimization algorithm. Comput. Methods Appl. Mech. Eng. 2021, 376, 113609. [Google Scholar] [CrossRef]
  24. Premkumar, M.; Jangir, P.; Kumar, B.S.; Sowmya, R.; Alhelou, H.H.; Abualigah, L.; Yildiz, A.R.; Mirjalili, S. A New Arithmetic Optimization Algorithm for Solving Real-World Multiobjective CEC-2021 Constrained Optimization Problems: Diversity Analysis and Validations. IEEE Access 2021, 9, 84263–84295. [Google Scholar] [CrossRef]
  25. Karaboga, D.; Basturk, B. On the performance of artificial bee colony (ABC) algorithm. Appl. Soft Comput. 2008, 8, 687–697. [Google Scholar] [CrossRef]
  26. Kennedy, J.; Eberhart, R. Particle swarm optimization. In Proceedings of the ICNN’95-International Conference on Neural Networks, Perth, Australia, 7 November–1 December 1995; Volume 4, pp. 1942–1948. [Google Scholar]
  27. El-Zonkoly, A.; dos Santos Coelho, L. Optimal allocation, sizing of PHEV parking lots in distribution system. Int. J. Electr. Power Energy Syst. 2015, 67, 472–477. [Google Scholar] [CrossRef]
  28. Naderipour, A.; Abdul-Malek, Z.; Nowdeh, S.A.; Gandoman, F.H.; Moghaddam, M.J.H. A Multi-Objective Optimization Problem for Optimal Site Selection of Wind Turbines for Reduce Losses and Improve Voltage Profile of Distribution Grids. Energies 2019, 12, 2621. [Google Scholar] [CrossRef] [Green Version]
  29. Arabi-Nowdeh, S.; Nasri, S.; Saftjani, P.B.; Naderipour, A.; Abdul-Malek, Z.; Kamyab, H.; Jafar-Nowdeh, A. Multi-criteria optimal design of hybrid clean energy system with battery storage considering off- and on-grid application. J. Clean. Prod. 2021, 290, 125808. [Google Scholar] [CrossRef]
  30. Nowdeh, S.A.; Davoudkhani, I.F.; Moghaddam, M.H.; Najmi, E.S.; Abdelaziz, A.; Ahmadi, A.; Razavi, S.; Gandoman, F. Fuzzy multi-objective placement of renewable energy sources in distribution system with objective of loss reduction and reliability improvement using a novel hybrid method. Appl. Soft Comput. 2019, 77, 761–779. [Google Scholar] [CrossRef]
  31. Sun, H.; Ebadi, A.G.; Toughani, M.; Nowdeh, S.A.; Naderipour, A.; Abdullah, A. Designing framework of hybrid photovoltaic-biowaste energy system with hydrogen storage considering economic and technical indices using whale optimization algorithm. Energy 2022, 238, 121555. [Google Scholar] [CrossRef]
  32. Jahannoush, M.; Nowdeh, S.A. Optimal designing and management of a stand-alone hybrid energy system using meta-heuristic improved sine–cosine algorithm for Recreational Center, case study for Iran country. Appl. Soft Comput. 2020, 96, 106611. [Google Scholar] [CrossRef]
  33. Baran, M.; Wu, F. Network reconfiguration in distribution systems for loss reduction and load balancing. IEEE Trans. Power Deliv. 1989, 4, 1401–1407. [Google Scholar] [CrossRef]
  34. Organization of Renewable Energy and Electricity Energy Efficiency, Tehran, Iran. Available online: http://www.satba.gov.ir/ (accessed on 10 October 2021).
  35. Taylor, M.; Ralon, P.; Anuta, H.; Al-Zoghoul, S. Renewable Power Generation Costs in 2019; International Renewable Energy Agency: Masdar City, United Arab Emirates, 2020. [Google Scholar]
  36. Ali, E.; Abd-Elazim, S.; Abdelaziz, A. Ant Lion Optimization Algorithm for optimal location and sizing of renewable distributed generations. Renew. Energy 2017, 101, 1311–1324. [Google Scholar] [CrossRef]
  37. Diaaeldin, I.; Abdel Aleem, S.; El-Rafei, A.; Abdelaziz, A.; Zobaa, A.F. Optimal network reconfiguration in active distribution networks with soft open points and distributed generation. Energies 2019, 12, 4172. [Google Scholar] [CrossRef] [Green Version]
Figure 1. Hierarchy of AOs in AOA with exploration and operation phases adopted from [23].
Energies 14 06755 g001
Figure 2. How to update AOA operators to the optimal region adopted from [23].
Energies 14 06755 g002
Figure 3. The OSPF for parking lots and wind turbines via AOA in the distribution network.
Energies 14 06755 g003
Figure 4. The 33-bus distribution network [33].
Energies 14 06755 g004
Figure 5. Wind speed profile for 24 h [34].
Energies 14 06755 g005
Figure 6. Wind turbine power in terms of wind speed.
Energies 14 06755 g006
Figure 7. Loading coefficients of the distribution network for 24 h [34].
Energies 14 06755 g007
Figure 8. (a) Minimum voltage of base network for 24 h; (b) Voltage profile of base network.
Energies 14 06755 g008
Figure 9. Convergence curve of the AOA in the OSPF solving (a) Case#1, (b) Case#2, and (c) Case#3.
Energies 14 06755 g009
Figure 10. Power losses with and without OSPF via the AOA for 24 h.
Energies 14 06755 g010
Figure 11. Minimum voltage with and without OSPF via the AOA for 24 h.
Energies 14 06755 g011
Figure 12. Purchased power from the main grid with and without OSPF via the AOA for 24 h.
Energies 14 06755 g012
Figure 13. Contribution of wind power, grid power, and load demand for 24 h.
Energies 14 06755 g013
Figure 14. Charging and discharging of electric parking lot batteries with and without OSPF via the AOA for 24 h.
Energies 14 06755 g014
Figure 15. Convergence curve of different optimization methods in solving the OSPF.
Energies 14 06755 g015
Table 1. Numerical results of base 33-bus distribution network for 24 h.
ItemCost of Power Loss (USD)Cost of Grid Power (USD)Total Cost (USD)Min Voltage (p.u)
Value57.0275,01175,0680.9134
Table 2. Size and installation location of WTs in the 33-bus distribution network.
Size/@BusWT 1WT 2WT 3
Case#1429/@6--/--500/@30
Case#2500/@8--/--500/18
Case#3500/@6500/@18500/@30
@ denotes at bus
Table 3. Size and installation location of PHEVs in the 33-bus distribution network.
Size/@BusPHEV 1PHEV 2PHEV 3PHEV 4PHEV 5PHEV 6PHEV 7PHEV 8
Case#12000/@122000/@152000/@172000/@282000/@322000/@21--/--2000/@24
Case#2--/--1601/@17--/--1974/@21--/--1697/@24--/--1204/@32
Case#3--/--1059/@8--/--1789/@16--/-1195/@281059/@32--/--
Table 4. Numerical results of PV and PHEV sizing and placement in the 33-bus distribution network.
Item/CaseCase#1Case#2Case#3
Cost of power loss (USD)29.6831.2544.60
Cost of grid (USD)4701245,87629,271
Cost of PHEV (USD)547.16312.84201.28
Cost of WTs (USD)995.171071.221606.84
Total cost (USD)48,58447,29131,123
Voltage deviation (p.u)0.17790.05040.0631
Table 5. Size and installation location of WTs in 33-bus distribution network using different methods.
Method/Size/@Bus WT 1WT 2WT 3
AOA500/@6500/@18500/@30
PSO500/@8500/@16500/@29
ABC495/@6467/@18495/@28
Table 6. Size and installation location of PHEVs in 33-bus distribution network using different methods.
Method/Size/@Bus PHEV 1PHEV 2PHEV 3PHEV 4PHEV 5PHEV 6PHEV 7PHEV 8
AOA--/@--1059/@8--/@--1789/@16--/@-1195/@281059/@32--/@--
PSO--/@--2000/@12--/@--2000/@17--/@----/@--2000/@282000/@32
ABC--/@--1536/@15--/@--1962/@21--/@-1006/@30--/@----/@--
Table 7. Numerical results of PV and PHEV sizing and placement in the 33-bus distribution network.
Item/CaseAOAPSOABC
Cost of power loss (USD)44.6044.8145.07
Cost of grid (USD)29,27129,36430,690
Cost of PHEV (USD)201.28238.50184.33
Cost of WTs (USD)1606.841617.351560.77
Total cost (USD)31,12331,26432,480
Voltage deviation (p.u)0.06310.06480.0726
Table 8. Comparison of the results with previous studies.
Item/MethodAOAALO [36]MOHTLBOGWO [30]
Power loss (kW)101.30103.053111.56
Minimum voltage (p.u)0.95610.95030.9478
Publisher’s Note: MDPI stays neutral with regard to jurisdictional claims in published maps and institutional affiliations.

