Abstract
The achievement of a carbon-free emissions economy is one of the main goals to reduce climate change and its negative effects. Scientists and technological improvements have followed this trend, improving efficiency, and reducing carbon and other compounds that foment climate change. Since the main contributor of these emissions is transportation, detaching this sector from fossil fuels is a necessary step towards an environmentally friendly future. Therefore, an evaluation of alternative fuels will be needed to find a suitable replacement for traditional fossil-based fuels. In this scenario, hydrogen appears as a possible solution. However, the existence of the drawbacks associated with the application of H2-ICE redirects the solution to dual-fuel strategies, which consist of mixing different fuels, to reduce negative aspects of their separate use while enhancing the benefits. In this work, a new combustion modelling approach based on machine learning (ML) modeling is proposed for predicting the burning rate of different mixtures of methane () and hydrogen (). Laminar flame speed calculations have been performed to train the ML model, finding a faster way to obtain good results in comparison with actual models applied to SI engines in the virtual engine model framework.
1. Introduction
The increased public awareness about climate change led countries to establish greenhouse gas (GHG) emission reduction targets. In this context, hydrogen (H2) is a possible energy vector to decarbonize the economy and society. The absence of carbon dioxide (CO2) emissions on hydrogen combustion and its high heating value make its use attractive for a future fuel substitute. Moreover, hydrogen could help countries to reach energy independence, to avoid a vulnerable position in diplomatic relationships due to the unequal distribution of fossil fuel reservoirs around the Earth.
Furthermore, the fast development of renewable energies, such as wind power or solar energy, is helping to redistribute the energy sources. These methods offer an irregular energy generation since they depend on external factors which change sharply throughout the day (i.e., the wind intensity or the number of daylight hours). Therefore, the control of energy production remains the main disadvantage of these generation methods, highlighting the need for an energy carrier to manage the irregular distribution of energy production.
According to the Hydrogen Council, the cost of hydrogen production will be reduced by approximately 60% in 2030 if they are compared with the predicted levels of 2020 [1]. This prediction considers the most relevant aspects of hydrogen production: reduction in Capital Expenditures (CapEx) requirements, cheaper renewable energy, and increase in system optimization.
For all these reasons, hydrogen is a fundamental piece to achieve Conference of the Parties (COP21) Paris agreement objectives [2]. The European Union (EU), framing itself in the pact to keep the increase in the global temperature below 2 degrees Celsius concerning pre-industrial levels, has developed a roadmap in the economy’s decarbonization. In particular, some sectors, such as gas grid decarbonization for industrial high-grade heat purposes and transport, must be completely adapted. Transport emissions, which are 32% of total emissions in the EU, have to be reduced by 72% [3] though renewable energy systems, green hydrogen, energy supply systems, hydrogen pipelines or power-to-hydrogen [4].
The implementation of hydrogen on internal combustion engines (ICE) could help to reduce GHG emissions in two ways: during the production process (well-to-tank) and the vehicle operation (tank-to-wheel). Lean combustion is one of the most interesting strategies for decreasing tank-to-wheel emissions. Fuel consumption can be improved by increasing the specific heat ratio as the percentage of the fuel is reduced in the intake mixture [5]. Maintaining combustion stability in a lean environment requires high-energy ignition systems [6]. Long-duration sparks, multiple spark plugs in one cylinder, or pre-chamber ignition systems [7,8,9] are recently on the scope.
However, there are some disadvantages of applying hydrogen to ICEs. Its low density reduces the operating range of the vehicle due to the size of the tanks for fuel storage. In addition, abnormal combustion problems due to the high flammability properties of H2 demand other strategies to control the combustion stability (i.e., combining H2 with other less reactive fuels).
Hydrogen mixed with Compressed Natural Gas (CNG), which is mostly based on methane fuel, is one of the most promising fuel blends, pointing to reach a fully developed decarbonized hydrogen economy. Although methane combustion produces CO2, its low carbon content makes it very attractive as a partial solution to the problem of GHG emission [7]. Moreover, the production of CNG is also interesting due to its low carbon cost. Animal waste, landfills, waste of the food industry, aquatic biomass, or agricultural waste are some examples of feedstock for the CNG generation from renewable sources (also known as biogas). The two larger biogas producers in the world are Brazil and the USA. However, the lack of investment policies to enhance production procedures hinders the substantial growth of this technology. Despite this, Brazilian biogas production may increase from 5.3 million m/day in 2030 to 19.7 million by 2050 [10].
In addition, several works investigated the safety concerns about the hydrogen-enriched premixed flames. Law et al. [11] studied the effects of partial hydrocarbon substitution on hydrogen–air flames. Motivated by security considerations, the authors identified propane, methane and ethylene as suitable hydrocarbon substitutes, based on storage and combustion performance considerations. The explosion behaviour of methane/hydrogen/air mixtures was experimentally characterized by Li et al. [12] and Salzano et al. [13], in an attempt of enhancing the security of its use. To this end, the flame behavior of premixed hydrogen-enriched fuel blends was also studied [13,14] considering a turbulent flow field.
Engine experiments using hydrogen are expensive due to the needs of specific experimental equipment, safety considerations, time, and qualified personnel. To reduce the number of experiments, virtual engine modelling is a useful tool. These modelling approaches, mostly based on coupling 0D and 1D simulations, help to perform exploratory studies to choose the best medium/long-term strategy while defining the path towards the objectives set for 2050. These are especially helpful in the development of new technologies where the high number of variables leads to a huge amount of experiments and related costs.
In the past, several investigations tried to predict the combustion process inside the combustion chamber of ICEs, including the turbulence-combustion interaction [15,16]. In this framework, 1D simulations based on two-zone quasi-dimensional models [17,18,19] are the most extended ones. The flame development inside the cylinder during the combustion process is described by different theoretical approaches. For instance, some models use Wiebe functions to model the mass burned fraction [20,21,22,23]. Despite being extremely fast, the accuracy of these models is not good enough when changing the fuel or air-fuel mixture conditions. The fractal combustion models are based on the hypothesis that turbulence increases the burning rate as the flame surface is also increased. They are extensively used in several research works [24,25] since they allow to improve the accuracy in a wide range of operating conditions. However, problems in estimating the laminar properties of the flame when switching the fuel or when mixtures of several fuels are used, limit the application of these models in exploratory studies.
Currently, data-driven modelling, specifically based on Artificial Neural Networks (ANN), is being implemented in many fields of science and technology [26,27,28], opening up a new dimension to data analysis and prediction algorithms. Using machine learning, the ANN will get the laminar flame speed from the thermo-chemical conditions existing inside the combustion chamber on run time, eliminating one of the main limitations of the fractal combustion models.
The main objective of this investigation is to implement a modelling approach that allows estimating the burning rate of the air-fuel blend inside the combustion chamber using a combination of an existing combustion model, ANN, and virtual engine modelling. The target is to find a new way to enhance the accuracy of combustion modelling in a wide range of operating conditions, air-fuel dilutions, and fuels while maintaining the computational time.
2. Experimental Setup
2.1. Engine and Test Cell Configuration
The experimental data were obtained from a single-cylinder research version of a 4 cylinder light-duty vehicle, whose specifications and relevant geometrical features are presented in Table 1. The engine was assembled in a test cell in which a high number of instruments measure and control every relevant variable. For instance, a dedicated compressor controls pressure conditions at the intake, the low-pressure EGR system controls the mixture reactivity in the cylinder recirculating part of the combustion products, and independent oil and water cooling circuits manage the temperature of the fluids. The fuel is injected in the manifold, 270 mm away from the cylinder to ensure a suitable mixing between air and fuel, using a port fuel injection system and measured by a BRONKHORST F-113AC-M50-AAD-44-V flowmeter. The experimental setup is widely described in previous research works [7,8,9].

Table 1.
Main engine specifications.
All relevant combustion parameters, such as the indicated gross mean effective pressure (IMEP), start of combustion (CA10), combustion duration (CA10-90), combustion phasing (CA50), maximum cylinder pressure, heat release rate (HRR), combustion stability, and in-cylinder gas temperature were calculated from the cylinder pressure signal by an in-house 0D combustion diagnostics software [29,30].
2.2. Properties of Fuels
Table 2 summarizes the main properties of the fuels used in this investigation. As explained, hydrogen could be applied to the transport sector to reduce the percentage of emissions. The low auto-ignition properties point out that spark-ignition engines fueled with hydrogen should be more feasible than compression-ignition ones. The hydrogen wide flammability range allows combustion in ultra-lean conditions, increasing thermal efficiency by reducing heat transfer losses. Also, to avoid abnormal combustion phenomena such as backfiring, it is highly recommended to operate in a lean environment. The low ignition energy and high burning speed of hydrogen reduce misfire.
Table 2.
Hydrogen and methane fuel properties.
Methane appears as a good candidate to complement hydrogen as fuel. Mixing hydrogen with other fuels, such as gasoline, alcohol, diesel or methane enhances the ignition and burning control. Methane also shares with hydrogen a high auto-ignition temperature reducing the possibility of reaching knocking conditions. The low number of carbon atoms per methane molecule and the possibility to produce biogas also contribute to reducing GHG emissions.
3. Methodology
In pursuit of the objective of this investigation, several simulations will be performed considering different fuel blends and air dilution levels in one operating point. This operating point corresponds to a high engine speed (4000 rpm) and mid-to-high engine load (14 bar of IMEP). For the reference point, CNG fuel is used in stoichiometric conditions while using a Spark Timing (ST) that guarantees the Maximum Brake Torque (MBT) conditions.
Using this point as a baseline for the study, the fuel sharing and dilution conditions were modified as in the simulation plan presented in Figure 1. In all these simulations, the amount of energy injected was kept constant by adjusting the total amount of fuel and fixing the desired mixture conditions (air-to-fuel ratio). The ST was shifted to reach MBT conditions by optimizing the combustion phasing.
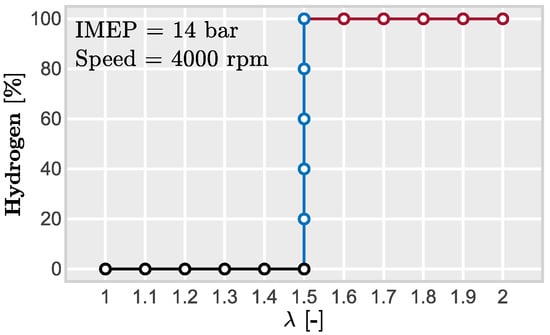
Figure 1.
Simulations plan. The black line corresponds with the CNG simulation plan, sweeping the air dilution until . The blue line sweeps the amount of hydrogen in the fuel from 0% to 100%. The red line considers pure hydrogen combustion varying from 1.5 to 2.
In order to account for the different thermo-chemical conditions that modify the combustion process of each simulation, a database of 10,000 situations was generated using a 1D laminar flamelet code with the input ranges detailed in Table 3. All these values were selected to gather all possible situations achieved in the simulations.
Table 3.
Range of variables for the flame speed simulation table to feed the ANN model.
Once this database was created, several architectures of ANN were tested to get the best modelling approach for this particular application. The inputs for the ANN are the in-cylinder pressure and temperature, the air-to-fuel ratio, the amount of EGR, and the percentage of H2 in the fuel blend.
The turbulent properties of the in-cylinder flow required for mimicking the turbulent flame characteristics were obtained from Computational Fluid Dynamics (CFD) simulations. Several calculations of the complete engine cycle were performed considering different engine speeds (1350, 2500 and 4500 rpm) and fuel compositions (25%, 50%, 75% and 100% of H2). The CFD model setup was obtained from previous works [31,32] that consider the same engine hardware.
Finally, and before proceeding with the analysis of the results, the model was validated in two stages. First, the new combustion modelling approach coupled with the virtual engine was validated in a steady operating condition: the reference condition (4000@14) using a stoichiometric CNG/air mixture. Then, the basis of the combustion model, that is the laminar flame speed, is validated at several lean conditions considering pure CNG, pure hydrogen, and a set of mixtures of them.
4. Numerical Setup
4.1. Virtual Model of the Engine
A numerical tool based on a 1D Wave Action Model was used. The engine simulations were performed by Gamma Technologies GT-SUITE v2020 software whereas the ANN training was performed using the different machine learning tools available in the same software. The geometrical information of the single-cylinder engine was implemented to create a model as closely as the experimental setup, recreating the different parts; intake, exhaust, exhaust gas recirculation (EGR), and fuel injection systems. The original model of the test bench layout was developed in previous work [9] and adapted to implement the new combustion model. This model was also used in previous research works [7,8].
4.2. Combustion Modelling
The combustion process is simulated by the phenomenological combustion model developed by Wahiduzzaman et al. [33] and later refined by Mirzaeian et al. [34]. The basis of this modelling approach can be summarized by the evolution of the entrained mass rate of the unburned gas and the rate of burnup described in Equations (1) and (2).
The rate of the unburned gas depends on the unburned gas density (), the flame front area () computed by a geometric sub-model detailed in [33] and the sum of the laminar and turbulent flame speeds ( and ).
The rate of burnup () is related to the unburned mass behind the flame front () as in Equation (2).
The parameter, expressed in Equation (3), represents the time needed by the laminar flame to cover the Taylor microscale () of turbulence. This parameter can be obtained by Equations (4) and (5) if considering isotropic turbulence. is a calibration parameter.
The laminar flame speed is traditionally obtained from empirical correlations adjusted for a specific fuel blend. For instance, Huang et al. [35] established a relationship for mixtures of methane and hydrogen whereas Ömer et al. [36] got a correlation for light hydrocarbons. Di Sarli et al. [37] obtained a good prediction by means of a Le Chatelier’s Rule-like formula, this correlation together with the laminar flame speed expression obtained by Ma et al. [38] were implemented with success in the quasi-dimensional combustion model proposed by Perini et al. [39]. However, the accuracy of this method over a wide range of dilution and/or thermodynamic conditions is rather limited. Therefore, in recent years there has been growing interest in developing new methods to obtain the laminar burning velocity while maintaining the calculation speed and improving the accuracy over a wide range of conditions to increase the flexibility of the model.
The transition from laminar to turbulent flame is accounted by the Equation (6). In this equation three turbulent characteristics are included: the flame radius (), the fluctuation of the velocity field (), and turbulent length scale (). In addition, the flame kernel growth multiplier () scales the flame structure from a smooth surface (characteristic of the laminar conditions) to a fully developed turbulent wrinkled surface. Finally, the turbulent flame speed multiplier () is a scaling parameter for calibration.
4.2.1. Modelling Laminar Flame Speed
In the present work, an ANN to estimate the laminar flame speed for the combustion modelling is used. The basis of ANNs relies on the data used for its training. These data can be obtained from experiments, as did Huang et al. [35] for mixtures of hydrogen and methane, or from simulations. In this case, the database was generated by a 1D laminar flamelet code that calculates the flame speed of the combustion reaction using a freely propagating flame in a simulated channel with a fixed cross-sectional area. To extend the range of application, simulations included multiple situations on hydrogen and methane mixtures in numerous conditions of pressure, temperature, air, and exhaust gases dilution.
For these simulations, a chemical kinetic mechanism is required, several of them are available in the literature. According to Ji et al. [40] in a recent investigation, the GRI-Mech mechanism [41] has the best performance when simulating the combustion process of methane and hydrogen mixtures for different air dilution () conditions. This mechanism contains 325 chemical reactions with 53 species and the possibility of using it in a wide range of conditions, especially in the case of light hydrocarbon fuels (, , CO and ).
This mechanism was validated in relevant conditions for this investigation: pure methane combustion, pure hydrogen combustion, and different blends of both fuels. This wide validation was done to increase the reliance on the results obtained.
Figure 2 shows a comparison of the laminar flame speed obtained by the flamelet code and measured by Dong et al. [42] for different air-to-fuel ratios of methane. As it can be seen, results are reasonably close to experiments in the whole dilution range.
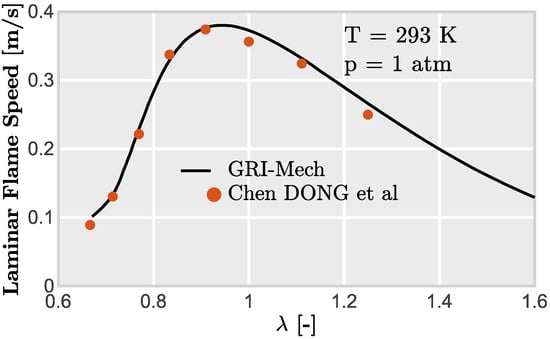
Figure 2.
Validation of CNG laminar flame speed for different air-to-fuel ratios.
Experimental results of pure hydrogen combustion obtained by Ravi and Petersen [43] for different dilution cases are presented in Figure 3. Again good results are obtained for the whole range of dilution.
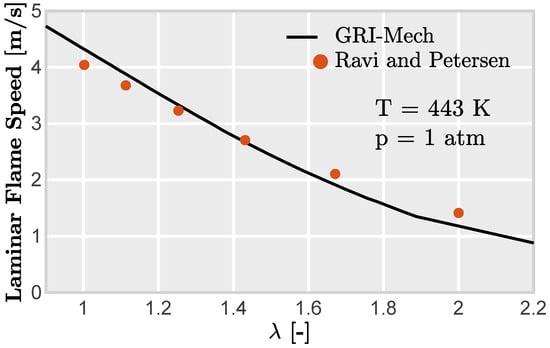
Figure 3.
Validation of H2 laminar flame speed for different air-to-fuel ratios.
Finally, results for the validation of different mixtures of methane and hydrogen are included in Figure 4. Trends are well captured by the model in the whole range of H2 substitution percentage.
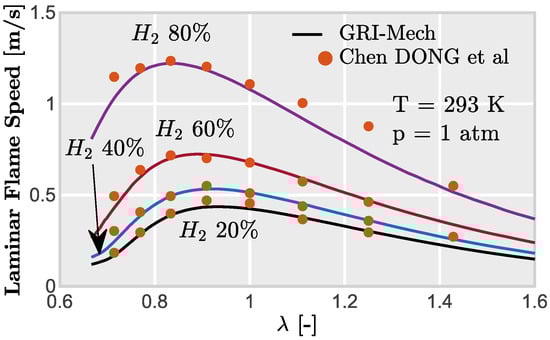
Figure 4.
Validation of methane-H2 laminar flame speed for different air-to-fuel ratios. The hydrogen percentage is expressed in the volume percentage of the total fuel volume.
A database was generated considering the input ranges summarized in Table 3. These ranges were specifically defined to gather all the possible conditions simulated by the virtual engine model. A 26-neuron 3-Layer Feedforward ANN was chosen after an optimization and selection procedure. This ANN architecture is represented in Figure 5 where the three layers of output nodes are fed directly via a series of weights applied to the inputs.
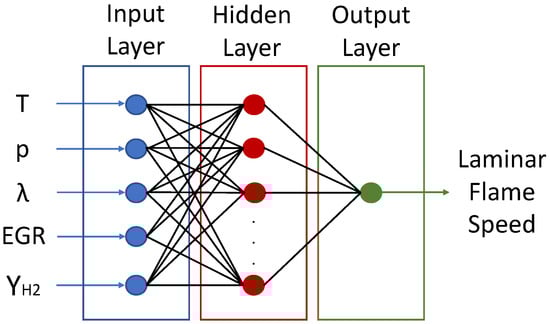
Figure 5.
Artificial Neural Network architecture used for the laminar flame speed modelling.
This ANN calculates the outputs (y) using the equation Equation (7).
where u is the input data. (v and a), (z and b) and (w and c) are the weights and biases of input, hidden and output layers respectively. Functions and are the activation functions for the input and hidden layers, being both expressed by Equation (8).
Lastly, is the activation function for the output layer which corresponds with the identity function presented in Equation (9).
25% of the data is randomly selected to validate the neural network after the training process. These data points were not used in the training process. The training process is based on the Levenberg-Marquardt algorithm. The performance of the ANN is presented in Figure 6. The RMS training error is 5.63 and the RMS testing error is 6.04 , both values can be considered acceptable for this investigation.
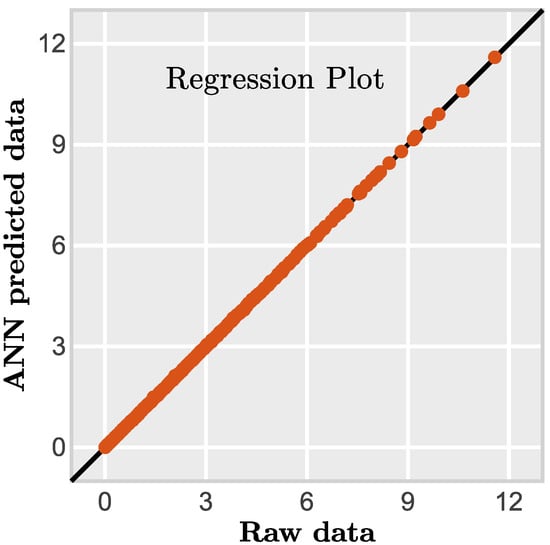
Figure 6.
Training results for the ANN used for the laminar flame speed modeling.
4.2.2. Modelling Turbulent Flame Speed
The turbulence properties needed for calculating the turbulent flame properties were estimated from a Computational Fluid Dynamics model. Although the turbulent length scale and the velocity fluctuation can be obtained by simpler models (such as the energy cascade method [44]), CFD offers improved accuracy and further information about the turbulence field.
The CFD model used for this purpose has been widely used in other investigations [31,32]. Using this configuration, several simulations were performed to obtain the evolution of and along the engine cycle for different engine speeds. Results of these simulations are presented in Figure 7, where the turbulent length scale and the velocity fluctuation are shown for three different engine speeds. Data from this figure was used to approximate the temporal evolution of both parameters as a function of the engine speed in the virtual engine model. The profiles were normalized and later customized to obtain the turbulent values for the combustion modelling. It was found, after calculating multiple simulations with different CNG/hydrogen mixtures, that fuel composition does not affect the turbulent length scale nor the velocity fluctuation, being equally valid these parameters for CNG as for hydrogen.
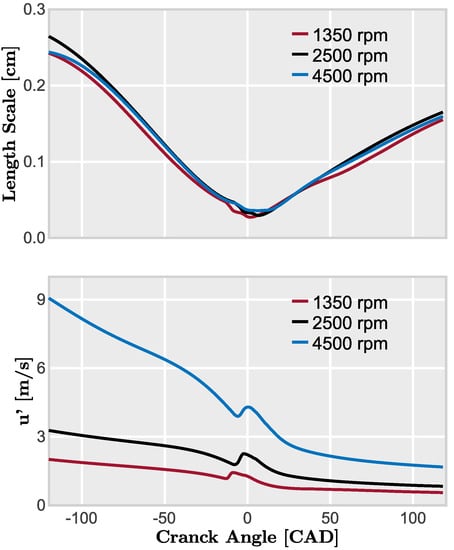
Figure 7.
Temporal evolution of the turbulent length scale () and the velocity fluctuation () inside the combustion chamber for three engine speeds.
4.3. Validation of the Virtual Engine Model
The virtual engine model was validated using the operating condition defined in Section 3. This operation condition consists of an engine speed of 4000 rpm and 14 bar of IMEP operating with pure methane fuel in stoichiometric conditions.
Figure 8 shows the comparison between the instantaneous signals obtained by the model and measured in the engine. In the case of simulations, two different cases are included to compare the performance of the proposed model against the more conventional combustion modelling approaches (i.e., empirical models based on flame speed correlations). The top graph shows the good agreement observed when contrasting the in-cylinder pressure signal. Similarly, the accuracy of the model to predict the combustion process is depicted in the bottom graph through the instantaneous evolution of the heat release rate (HRR). Although there are more differences than in the pressure, the characteristic values, such as combustion onset (CA10), combustion duration (CA90-10), and maximum HRR peak are well captured. All these parameters, included in Table 4, show an acceptable scatter from the experiments. Similarly, some of the most relevant engine outputs (indicated) are also included for verifying the model response to engine-related parameters. The difference in the CA50 estimation comes from the limitations of the model. As will explain later, the model cannot predict the cycle-to-cycle variation which is critical in this operating condition. That means that the dispersion observed in the HRR profiles and then, in the CA50 estimation, is significant. The difference observed in CA50 between the simulation and the experiments can be explained by a combination of modelling limitations and experimental uncertainties due to CCV.
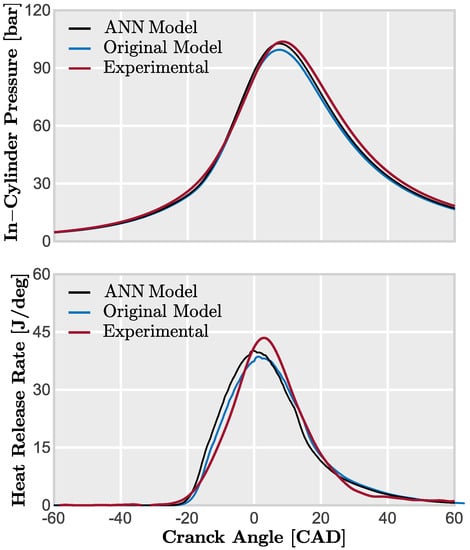
Figure 8.
Validation of the virtual engine model coupled with the combustion model. In-cylinder pressure and HRR signals are compared with the results measured in the test bench.
Table 4.
Validation of the virtual engine model coupled with the combustion model. Combustion-related parameters are included together with other engine outputs.
Figure 8, a shows a comparison between the ANN and the empirical model. The ANN model presents a better accuracy. The empirical model shows in-cylinder pressure and heat release rate profiles that are further from the experimental results. Not only accuracy, also flexibility make, the ANN model, a more attractive approach.
5. Results and Discussion
After explaining the numerical methodology, this section discusses the results obtained from the virtual model simulations. The analysis is focused on the combustion process itself and the engine performance when the dilution ratio and the fuel composition are modified.
5.1. Combustion of Methane
Results from pure CH4 combustion are summarized in this section. The combustion process is analyzed in Figure 9, where the HRR profiles are plotted for different air dilution rates. These curves evince how the combustion process degrades as the dilution rate increases. While the curves scarcely differ between cases gathered by and , they significantly change for values above : the leaner condition, the wider HRR profile. In addition, the peak of the energy released is reduced approximately 12% from to . The drop of the burning velocity due to the leaner conditions increases the combustion duration as it is shown in Figure 9. The combustion phasing is delayed towards the expansion stroke, moving from a CA50 of 1.5 CAD aTDC to 7.5 CAD aTDC.
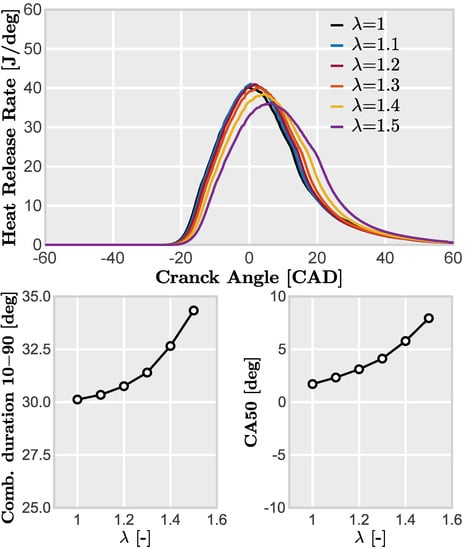
Figure 9.
Trends of the main characteristics of the combustion process. Heat release rate profiles (top), combustion duration (bottom-left), and combustion phasing (bottom-right) for different air-to-fuel ratios considering methane fuel.
In-cylinder pressure profiles simulated by the virtual model are shown in Figure 10. As observed for the HRR trends, the maximum peak of the in-cylinder pressure is similar from to , reaching a maximum value at . Moreover, the decreased flame speed due to leaner combustion conditions produces a distributed energy release that also affects the maximum pressure change rate. Since combustion noise is strongly related to this parameter [45,46], it can be claimed that increasing air dilution could contribute to reducing noise, vibration, and harshness (NVH).
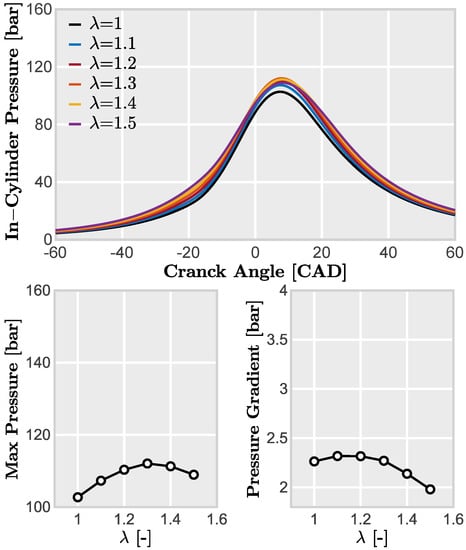
Figure 10.
In-cylinder pressure evolution. Pressure profiles (top), maximum peak pressure (bottom-left), and maximum pressure change rate (bottom-right) for different air-to-fuel ratios considering methane fuel.
Inspecting the indicated efficiency trends plotted in Figure 11, it can be seen the efficiency gains obtained as the dilution rate is increased. Here, no maximum is reached for indicated efficiency, despite the reduction in the growth rate observed after . Considering the iso-energy assumption, the IMEP trend is equal to the indicated efficiency, reaching at a maximum value of approximately 13.4 bar.
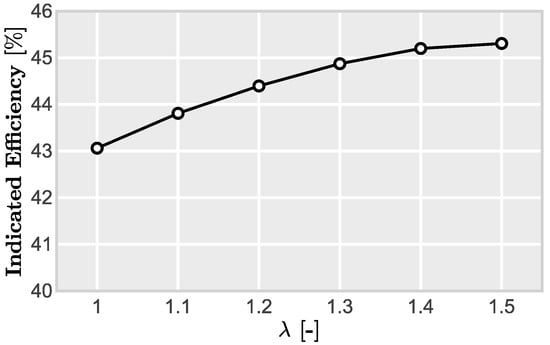
Figure 11.
Indicated efficiency trends when the air dilution rate is increased from to using methane as fuel.
Although these trends make sense from a theoretical point of view, other research works based on engine experiments [8,47] showed that the indicated efficiency slightly decrease before reaching the maximum dilution rate. In both investigations, the maximum dilution rate achieved before facing excessive misfiring is gathered between and depending on the operating condition. Considering a similar operating condition, the indicated efficiency reaches a maximum around and then decreases with higher dilution rates. This behavior can be explained by the increased cycle-to-cycle variability (CCV) experienced when the dilution rate reaches . As the proposed combustion model does not take into account this cyclic variability, it is not possible to capture this trend.
5.2. Combustion of Methane-Hydrogen Blends
In this section, the simulated results obtained when changing the fuel blend composition from pure methane to pure hydrogen are presented. For this study, the fuel composition is varied by 20% of hydrogen and the air dilution rate is fixed at . As shown in Figure 12, the heat release rate profile does not change proportionally with the addition of hydrogen. The maximum peak value increases with the amount of in the fuel blend, reaching a maximum value when the fuel blend sharing is between 40% and 60% of hydrogen. The combustion duration is reduced as hydrogen percentage increases and the optimum CA50 is advanced towards the compression stroke. This trend of decreasing combustion duration as the hydrogen percentage increase is also reported in previous research works [38,48].
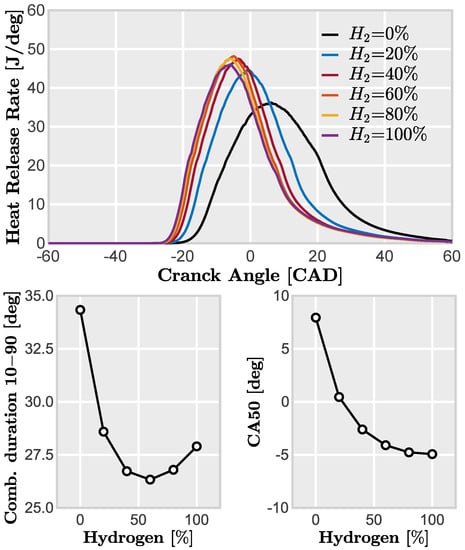
Figure 12.
Trends of the main characteristics of the combustion process. Heat release rate profiles (top), combustion duration (bottom-left), and combustion phasing (bottom-right) for different fuel compositions.
Focusing on in-cylinder pressure profiles, Figure 13 shows the same parameters studied in the previous section for methane combustion. Pressure profiles indicate that the maximum peak pressure increases with the amount of H2 present in the fuel. The maximum is achieved around 80% and then, it is maintained for further increments of H2. Moreover, pressure profiles practically overlap from 40% to 100% of . Similarly, the pressure rise rate also increases with the amount of H2, suggesting an increase of the combustion noise when switching from 0% of H2 to 60%.
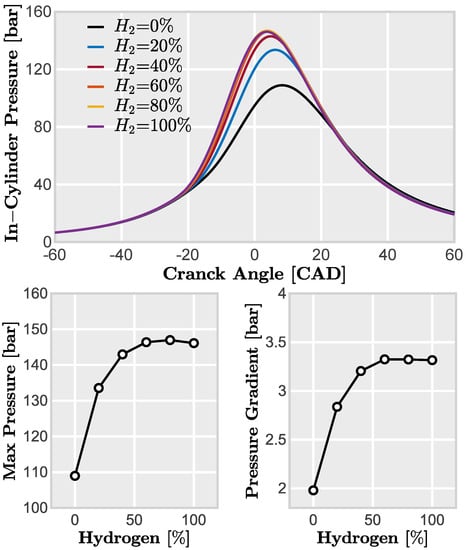
Figure 13.
In-cylinder pressure evolution. Pressure profiles (top), maximum peak pressure (bottom-left), and maximum pressure change rate (bottom-right) for different fuel compositions.
Figure 14 shows the evolution of the indicated efficiency as the H2 amount increases in the fuel. This parameter is progressively reduced from 45.4% to 42.1%, showing a relevant efficiency loss related to the hydrogen addition. Referring to previous research studies, it is possible to qualitatively validate the trends obtained using the current modelling approach. In the work of Nagalingam et al. [49], different methane-hydrogen mixtures were used to compare the most relevant engine outputs, such as IMEP or indicated efficiency. The experimental results were obtained under the iso-energy assumption also considered in the current study. In this investigation, the reference methane fuel was supplemented with , showing a reduction of the engine power and the indicated efficiency.
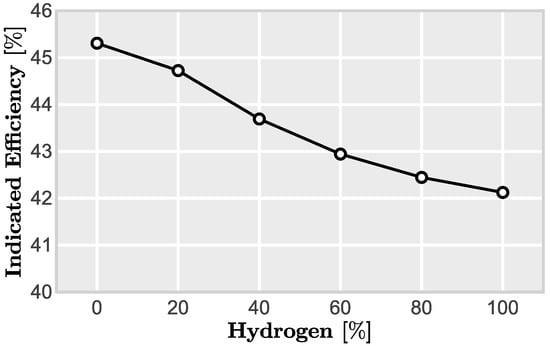
Figure 14.
Indicated efficiency trends when the amount of hydrogen is increased in the fuel blend at .
This research work [49] also evinced that the optimum spark timing has to be delayed as more and more methane is replaced by . The high knock resistance of methane is reduced with the addition of hydrogen, favouring the end-gas auto-ignition while compromising the engine integrity due to severe knocking combustion. This phenomenon limits the spark advance in the search of MBT conditions as also shown by Lim et al. [50].
Contrary to these results, the proposed modelling approach shows the opposite effect when increasing the percentage of H2 in the fuel: the optimum spark timing is advanced as the burning rate is increased due to H2 addition. Thus, this trend cannot be captured without a knocking combustion model that predicts the end-gas auto-ignition of the mixture.
In absence of a knock limitation, the spark timing can be freely advanced to optimize the indicated efficiency, predicting higher efficiency values than expected. Therefore, the proposed approach tends to advance the combustion process as the burning rate increases due to the H2 addition. Consequently, the results in this section should be treated with care, although the physics related to flame propagation shows consistent results, an additional model needs to be implemented to account for the knock phenomenon.
5.3. Combustion of Hydrogen
This section discusses the results of changing air dilution using hydrogen as fuel. As in Figure 9, results of Figure 15 show the effect of increasing the air dilution on combustion-related parameters. In this case, the air-to-fuel ratio is increased from 1.5 to 2. Similar to what we observed for the methane combustion, the HRR profile becomes wider and its peak is reduced as the air dilution increases. However, this trend is slightly different: the combustion duration is reduced until reaching a minimum around which coincides with the maximum peak on the HRR profiles. Then, the combustion process is extended again when increasing the dilution ratio. At condition, the combustion duration reach similar values as conditions. The combustion phasing is progressively delayed due to this effect.
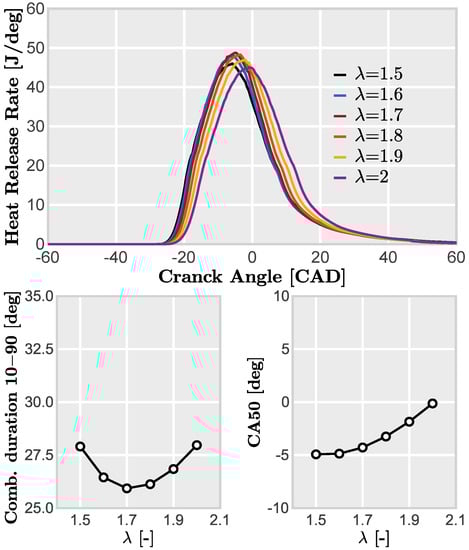
Figure 15.
Trends of the main characteristics of the combustion process. Heat release rate profiles (top), combustion duration (bottom-left), and combustion phasing (bottom-right) for different air-to-fuel ratios considering hydrogen fuel.
The in-cylinder pressure increases with the air dilution until is reached, as Figure 16 shows. Pressure profiles almost collapse in all cases between and . The differences observed during the compression and expansion strokes are a direct consequence of the physical properties of the air-fuel mixture. Regarding the maximum pressure rate of change, results show a maximum around following the inverse trend as the combustion duration.
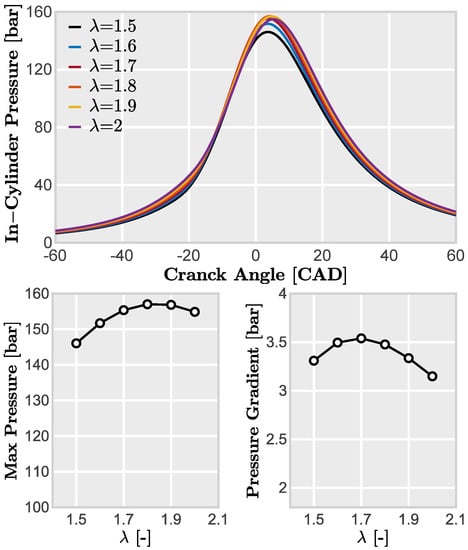
Figure 16.
In-cylinder pressure evolution. Pressure profiles (top), maximum peak pressure (bottom-left), and maximum pressure change rate (bottom-right) for different air-to-fuel ratios considering hydrogen fuel.
Values of indicated efficiency are shown in Figure 17. Increasing the air dilution, indicated efficiency increase, recovering similar levels to those obtained when operating with methane. Therefore, this confirms the potential of lean hydrogen combustion to reduce the CO2 footprint of internal combustion engines.
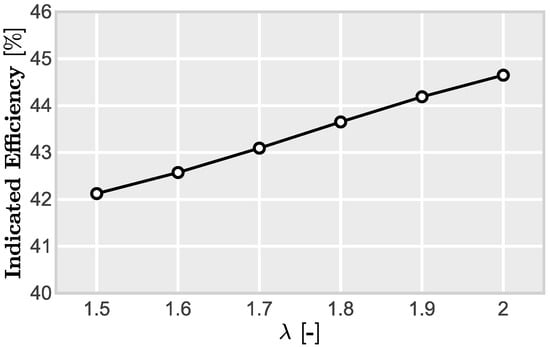
Figure 17.
Indicated efficiency trends when the air dilution rate is increased from to using hydrogen as fuel.
5.4. Effects on Fuel Consumption
In this final section, a comparison between all simulated cases is performed to identify the benefits of using hydrogen as partial or complete fuel in gas-powered engines. In addition, this section could be considered as a small flavor of the potential applications of this modelling approach, being extended to more complex and interesting studies in the future.
Results of the Indicated Specific Fuel Consumption (ISFC) are presented in Figure 18. The positive impact of including hydrogen in the fuel is evident in this figure. The ISFC decreases from almost 170 g/kWh to 70 g/kWh if the methane is completely replaced by H2. The effect of the dilution is not so marked in both fuels.
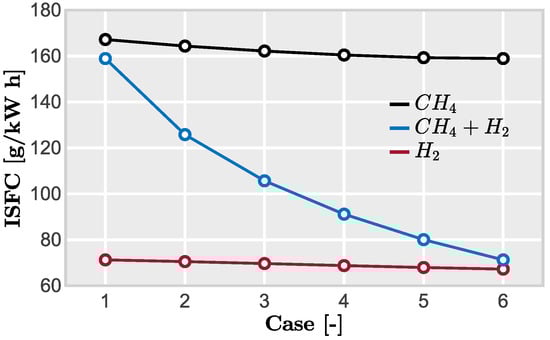
Figure 18.
Specific fuel economy of all simulated conditions. The black line corresponds with the CNG simulation plan, sweeping the air dilution from to . The blue line sweeps the amount of hydrogen in the fuel from 0% to 100%. The red line considers pure hydrogen combustion varying from 1.5 to 2.
These results can be qualitatively validated with the experiments performed by Singh et al. [51]. They operated an SI engine with methane and methane-hydrogen blends (18% ), observing an important gain in terms of specific fuel consumption (SFC).
6. Conclusions
A new modelling approach for methane-hydrogen combustion in SI engines has been proposed in this paper. This model has been implemented and coupled with a virtual model of a light-duty engine version for automotive applications. The combustion model estimates the flame propagation from the laminar flame speed predicted by an ANN. The ANN was trained by a set of data that considers a wide range of operating conditions including both air and exhaust gases dilution.
The model has been widely validated, from the most fundamental aspects (laminar flame speed) to the most complex ones (real engine experiments), including different dilution and blend sharing conditions.
Results demonstrate how machine learning and data-driven modelling techniques, can be implemented in several science fields reducing time calculation while allowing more complex and interesting studies which contribute to finding new solutions for the most relevant problems of society.
Modelling results indicate that hydrogen addition helps to increase the burning rate, overcoming the negative effects of lean mixture environments on combustion. However, there are some thermodynamic losses due to the physical properties of the fuel blend when adding hydrogen. Nevertheless, the potential advantages of using H2 as fuel for internal combustion engines have been evidenced.
Despite the benefits of this modelling approach, several limitations have been identified that need to be corrected in the future to improve the model accuracy. The cycle-to-cycle variation should be estimated to correctly predict the losses due to excessive misfiring at high dilution rates. Moreover, the auto-ignition of the mixture must be considered in a dedicated submodel to predict the efficiency losses due to severe knocking combustion. To this end, several submodels available in the literature will be evaluated and validated in relevant engine conditions with hydrogen-enriched CNG fuel blends. Finally, a quantitative validation is required in a wider range of operating conditions, including other engine speeds and loads, and dilution conditions using exhaust gases.
Author Contributions
Conceptualization, S.M., R.N. and J.G.-S.; Data curation, M.O.-G.; Funding acquisition, S.M. and R.N.; Investigation, J.G.-S. and M.O.-G.; Methodology, R.N. and J.G.-S.; Resources, R.N.; Supervision, S.M. and R.N.; Validation, M.O.-G.; Visualization, M.O.-G.; Writing—original draft, M.O.-G.; Writing—review & editing, J.G.-S. All authors have read and agreed to the published version of the manuscript.
Funding
This research received no external funding.
Institutional Review Board Statement
Not applicable.
Informed Consent Statement
Not applicable.
Data Availability Statement
The data that support the findings of this study are available from the corresponding author upon reasonable request.
Conflicts of Interest
The authors declare no conflict of interest.
References
- McKinsey & Company. Hydrogen Insights Report 2021 Hydrogen Council. 2021. Available online: www.hydrogencouncil.com (accessed on 25 August 2021).
- Höhne, N.; Kuramochi, T.; Warnecke, C.; Röser, F.; Fekete, H.; Hagemann, M.; Day, T.; Tewari, R.; Kurdziel, M.; Sterl, S.; et al. The Paris Agreement: Resolving the inconsistency between global goals and national contributions. Clim. Policy 2017, 17, 16–32. [Google Scholar] [CrossRef]
- Fuel Cells and Hydrogen Joint Undertaking (FCH). Hydrogen Roadmap Europe: A Sustainable Pathway for the European Energy Transition; Publications Office of the European Union: Luxembourg, 2019; p. 70. [Google Scholar] [CrossRef]
- Caglayan, D.G.; Heinrichs, H.U.; Robinius, M.; Stolten, D. Robust design of a future 100% renewable european energy supply system with hydrogen infrastructure. Int. J. Hydrogen Energy 2021, 46, 29376–29390. [Google Scholar] [CrossRef]
- Germane, G.J.; Wood, C.G.; Hess, C.C. Lean Combustion in Spark-Ignited Internal Combustion Engines—A Review; SAE Technical Papers: Warrendale, PA, USA, 1983. [Google Scholar] [CrossRef]
- Dale, J.; Checkel, M.; Smy, P. Application of high energy ignition systems to engines. Prog. Energy Combust. Sci. 1997, 23, 379–398. [Google Scholar] [CrossRef]
- López, J.; Novella, R.; Gomez-Soriano, J.; Martinez-Hernandiz, P.; Rampanarivo, F.; Libert, C.; Dabiri, M. Advantages of the unscavenged pre-chamber ignition system in turbocharged natural gas engines for automotive applications. Energy 2021, 218, 119466. [Google Scholar] [CrossRef]
- Novella, R.; Gomez-Soriano, J.; Martinez-Hernandiz, P.; Libert, C.; Rampanarivo, F. Improving the performance of the passive pre-chamber ignition concept for spark-ignition engines fueled with natural gas. Fuel 2021, 290, 119971. [Google Scholar] [CrossRef]
- Benajes, J.; Novella, R.; Gomez-Soriano, J.; Martinez-Hernandiz, P.; Libert, C.; Dabiri, M. Evaluation of the passive pre-chamber ignition concept for future high compression ratio turbocharged spark-ignition engines. Appl. Energy 2019, 248, 576–588. [Google Scholar] [CrossRef]
- Borges, C.P.; Sobczak, J.C.; Silberg, T.R.; Uriona-Maldonado, M.; Vaz, C.R. A systems modeling approach to estimate biogas potential from biomass sources in Brazil. Renew. Sustain. Energy Rev. 2021, 138, 110518. [Google Scholar] [CrossRef]
- Law, C.K.; Kwon, O.C. Effects of hydrocarbon substitution on atmospheric hydrogen-air flame propagation. Int. J. Hydrogen Energy 2004, 29, 867–879. [Google Scholar] [CrossRef]
- Li, Y.; Bi, M.; Li, B.; Zhou, Y.; Gao, W. Effects of hydrogen and initial pressure on flame characteristics and explosion pressure of methane/hydrogen fuels. Fuel 2018, 233, 269–282. [Google Scholar] [CrossRef]
- Salzano, E.; Cammarota, F.; Di Benedetto, A.; Di Sarli, V. Explosion behavior of hydrogen-methane/air mixtures. J. Loss Prev. Process Ind. 2012, 25, 443–447. [Google Scholar] [CrossRef]
- Di Sarli, V.; Di Benedetto, A.; Long, E.J.; Hargrave, G.K. Time-Resolved Particle Image Velocimetry of dynamic interactions between hydrogen-enriched methane/air premixed flames and toroidal vortex structures. Int. J. Hydrogen Energy 2012, 37, 16201–16213. [Google Scholar] [CrossRef] [Green Version]
- Sjeric, M.; Kozarac, D.; Bogensperger, M. Implementation of a Single Zone k-ϵ Turbulence Model in a Multi Zone Combustion Model; SAE Technical Papers: Warrendale, PA, USA, 2012. [Google Scholar] [CrossRef]
- Borgnakke, C.; Arpaci, V.S.; Tabaczynski, R.J. A Model for the Instantaneous Heat Transfer and Turbulence in a Spark Ignition Engine; SAE Technical Papers: Warrendale, PA, USA, 1980. [Google Scholar] [CrossRef]
- Matthews, R.D.; Chin, Y.W. A Fractal-Based SI Engine Model: Comparisons of Predictions with Experimental Data; SAE Technical Papers: Warrendale, PA, USA, 1991. [Google Scholar] [CrossRef] [Green Version]
- Poulos, S.G.; Heywood, J.B. The Effect of Chamber Geometry on Spark-Ignition Engine Combustion; SAE Technical Papers: Warrendale, PA, USA, 1983. [Google Scholar] [CrossRef]
- Bozza, F.; Gimelli, A.; Senatore, A.; Caraceni, A. A Theoretical Comparison of Various VVA Systems for Performance and Emission Improvements of SI-Engines; SAE Technical Papers: Warrendale, PA, USA, 2001. [Google Scholar] [CrossRef]
- Torregrosa, A.J.; Broatch, A.; Olmeda, P.; Aceros, S. Numerical Estimation of Wiebe Function Parameters Using Artificial Neural Networks in SI Engine; SAE Technical Papers: Warrendale, PA, USA, 2021; pp. 1–10. [Google Scholar] [CrossRef]
- Giglio, V.; di Gaeta, A. Novel regression models for wiebe parameters aimed at 0D combustion simulation in spark ignition engines. Energy 2020, 210, 118442. [Google Scholar] [CrossRef]
- Lindström, F.; Ångström, H.E.; Kalghatgi, G.; Möller, C.E. An Empirical SI Combustion Model Using Laminar Burning Velocity Correlations; SAE Technical Papers: Warrendale, PA, USA, 2005. [Google Scholar] [CrossRef]
- Liu, J.; Dumitrescu, C.E. Single and double Wiebe function combustion model for a heavy-duty diesel engine retrofitted to natural-gas spark-ignition. Appl. Energy 2019, 248, 95–103. [Google Scholar] [CrossRef]
- De Bellis, V.; Severi, E.; Fontanesi, S.; Bozza, F. Hierarchical 1D/3D Approach for the Development of a Turbulent Combustion Model Applied to a VVA Turbocharged Engine. Part II: Combustion Model. Energy Procedia 2014, 45, 1027–1036. [Google Scholar] [CrossRef] [Green Version]
- Daniela, T. A quasi-dimensional SI combustion model: A bi-fractal approach. Energy Procedia 2017, 126, 931–938. [Google Scholar] [CrossRef]
- Guijo-Rubio, D.; Durán-Rosal, A.; Gutiérrez, P.; Gómez-Orellana, A.; Casanova-Mateo, C.; Sanz-Justo, J.; Salcedo-Sanz, S.; Hervás-Martínez, C. Evolutionary artificial neural networks for accurate solar radiation prediction. Energy 2020, 210, 118374. [Google Scholar] [CrossRef]
- Reese, K.M. Deep learning artificial neural networks for non-destructive archaeological site dating. J. Archaeol. Sci. 2021, 132, 105413. [Google Scholar] [CrossRef]
- Flores-Fernández, J.M.; Herrera-López, E.J.; Sánchez-Llamas, F.; Rojas-Calvillo, A.; Cabrera-Galeana, P.A.; Leal-Pacheco, G.; González-Palomar, M.G.; Femat, R.; Martínez-Velázquez, M. Development of an optimized multi-biomarker panel for the detection of lung cancer based on principal component analysis and artificial neural network modeling. Expert Syst. Appl. 2012, 39, 10851–10856. [Google Scholar] [CrossRef]
- Lapuerta, M.; Armas, O.; Hernández, J. Diagnosis of DI Diesel combustion from in-cylinder pressure signal by estimation of mean thermodynamic properties of the gas. Appl. Therm. Eng. 1999, 19, 513–529. [Google Scholar] [CrossRef]
- Payri, F.; Molina, S.; Martín, J.; Armas, O. Influence of measurement errors and estimated parameters on combustion diagnosis. Appl. Therm. Eng. 2006, 26, 226–236. [Google Scholar] [CrossRef]
- Benajes, J.; Novella, R.; Gomez-Soriano, J.; Barbery, I.; Libert, C.; Rampanarivo, F.; Dabiri, M. Computational assessment towards understanding the energy conversion and combustion process of lean mixtures in passive pre-chamber ignited engines. Appl. Therm. Eng. 2020, 178, 115501. [Google Scholar] [CrossRef]
- Benajes, J.; Novella, R.; Gomez-Soriano, J.; Barbery, I.; Libert, C. Advantages of hydrogen addition in a passive pre-chamber ignited SI engine for passenger car applications. Int. J. Energy Res. 2021, 45, 13219–13237. [Google Scholar] [CrossRef]
- Wahiduzzaman, S.; Morel, T.; Sheard, S. Comparison of Measured and Predicted Combustion Characteristics of a Four-Valve SI Engine; SAE Transactions: Warrendale, PA, USA, 1993; pp. 810–819. [Google Scholar]
- Mirzaeian, M.; Millo, F.; Rolando, L. Assessment of the Predictive Capabilities of a Combustion Model for a Modern Downsized Turbocharged SI Engine; SAE Technical Paper: Warrendale, PA, USA, 2016. [Google Scholar]
- Huang, Z.; Zhang, Y.; Zeng, K.; Liu, B.; Wang, Q.; Jiang, D. Measurements of laminar burning velocities for natural gas-hydrogen-air mixtures. Combust. Flame 2006, 146, 302–311. [Google Scholar] [CrossRef]
- Ömer, G. Correlations of Laminar Combustion Data for Alternative S.I. Engine Fuels; SAE Technical Paper 841000: Warrendale, PA, USA, 1984; p. 26. [Google Scholar] [CrossRef]
- Di Sarli, V.; Di Benedetto, A. Laminar burning velocity of hydrogen-methane/air premixed flames. Int. J. Hydrogen Energy 2007, 32, 637–646. [Google Scholar] [CrossRef]
- Ma, F.; Wang, Y.; Liu, H.; Li, Y.; Wang, J.; Ding, S. Effects of hydrogen addition on cycle-by-cycle variations in a lean burn natural gas spark-ignition engine. Int. J. Hydrogen Energy 2008, 33, 823–831. [Google Scholar] [CrossRef]
- Perini, F.; Paltrinieri, F.; Mattarelli, E. A quasi-dimensional combustion model for performance and emissions of SI engines running on hydrogen-methane blends. Int. J. Hydrogen Energy 2010, 35, 4687–4701. [Google Scholar] [CrossRef]
- Ji, C.; Wang, D.; Yang, J.; Wang, S. A comprehensive study of light hydrocarbon mechanisms performance in predicting methane/hydrogen/air laminar burning velocities. Int. J. Hydrogen Energy 2017, 42, 17260–17274. [Google Scholar] [CrossRef]
- Smith, G.P.; Golden, D.M.; Frenklach, M.; Moriarty, N.W.; Eiteneer, B.; Goldenberg, M.; Bowman, C.T.; Hanson, R.K.; Song, S.; Gardiner, W.C., Jr.; et al. Current and future releases of GRI-Mech. GRI-Mech 3.0. Available online: http://www.me.berkeley.edu/gri_mech/ (accessed on 25 August 2021).
- Dong, C.; Zhou, Q.; Zhang, X.; Zhao, Q.; Xu, T.; Hui, S. Experimental study on the laminar flame speed of hydrogen/natural gas/air mixtures. Front. Chem. Eng. China 2010, 4, 417–422. [Google Scholar] [CrossRef]
- Ravi, S.; Petersen, E.L. Laminar flame speed correlations for pure-hydrogen and high-hydrogen content syngas blends with various diluents. Int. J. Hydrogen Energy 2012, 37, 19177–19189. [Google Scholar] [CrossRef]
- Bozza, F.; Gimelli, A.; Strazzullo, L.; Torella, E.; Cascone, C. Steady-State and Transient Operation Simulation of a “Downsized” Turbocharged SI Engine; SAE Technical Paper: Warrendale, PA, USA, 2007. [Google Scholar]
- Broatch, A.; Novella, R.; García-Tíscar, J.; Gomez-Soriano, J.; Pal, P. Analysis of combustion acoustic phenomena in compression–ignition engines using large eddy simulation. Phys. Fluids 2020, 32, 085101. [Google Scholar] [CrossRef]
- Broatch, A.; Novella, R.; García-Tíscar, J.; Gomez-Soriano, J.; Pal, P. Investigation of the effects of turbulence modeling on the prediction of compression-ignition combustion unsteadiness. Int. J. Engine Res. 2021, 1468087421990478. [Google Scholar] [CrossRef]
- Benajes, J.; Novella, R.; Gomez-Soriano, J.; Martinez-Hernandiz, P.; Libert, C.; Dabiri, M. Performance of the passive pre-chamber ignition concept in a spark-ignition engine for passenger car applications. In Proceedings of the SIA Powertrain Electronics, Paris, France, 12–13 June 2019. [Google Scholar]
- Experimental study on thermal efficiency and emission characteristics of a lean burn hydrogen enriched natural gas engine. Int. J. Hydrogen Energy 2007, 32, 5067–5075. [CrossRef]
- Performance study using natural gas, hydrogen-supplemented natural gas and hydrogen in AVL research engine. Int. J. Hydrogen Energy 1983, 8, 715–720. [CrossRef]
- Lim, G.; Lee, S.; Park, C.; Choi, Y.; Kim, C. Knock and Emission Characteristics of Heavy-Duty HCNG Engine with Modified Compression Ratios; SAE Technical Papers: Warrendale, PA, USA, 2013; Volume 2. [Google Scholar] [CrossRef]
- Singh, S.; Mishra, S.; Mathai, R.; Sehgal, A.K.; Suresh, R. Comparative Study of Unregulated Emissions on a Heavy Duty CNG Engine using CNG & Hydrogen Blended CNG as Fuels. SAE Int. J. Engines 2016, 9, 2292–2300. [Google Scholar] [CrossRef]
Publisher’s Note: MDPI stays neutral with regard to jurisdictional claims in published maps and institutional affiliations. |
© 2021 by the authors. Licensee MDPI, Basel, Switzerland. This article is an open access article distributed under the terms and conditions of the Creative Commons Attribution (CC BY) license (https://creativecommons.org/licenses/by/4.0/).