
Demand Side Management Based Power-to-Heat and Power-to-Gas Optimization Strategies for PV and Wind Self-Consumption in a Residential Building Cluster


Abstract
:1. Introduction
- Single building: Optimization of PV self-consumption.
- Cluster: Optimization of PV self-consumption.
- Cluster: Optimization of PV and small wind turbine self-consumption.
- Cluster: Autarky and increased carbon dioxide emission saving with the application of a hydrogen system.
1.1. State of the Art
1.1.1. Building Demand Prediction
1.1.2. Metaheuristic Optimization in the Field of HVAC Systems
1.1.3. Seasonal Hydrogen Storage
2. Methodology
2.1. Pilot Site
2.2. Modelling Approach
2.2.1. Building Model
2.2.2. Decentral Energy Supply System
2.2.3. Central Hydrogen System for Seasonal Energy Storage
- PEM Electrolyzer.
- Multi-stage (isothermal) hydrogen compressor.
- Hydrogen storage tank.
- PEM Fuel Cell.
Electrolyzer
Compressor
Storage Cylinder
Fuel Cell
2.2.4. Small Wind Turbines
2.3. Household Electricity Demand
2.4. Domestic Hot Water Demand
2.5. Building Model Calibration
- Preprocessing of monitoring and weather data (filling of measurement gaps, unification of time steps).
- Application of a (genetic) optimization algorithm to the building parameters such as operating limit temperature, air exchange rate, room set point temperature, hysteresis of the buffer storage (heating and DHW) as well as the room heating hysteresis.
- The calibration takes place as INSEL-Python co-simulation using the DEAP (Distributed Evolutionary Algorithms in Python [27]) toolbox. The simulation is performed in one minute time steps, but the results and measured values are averaged to 60 min, otherwise a calibration is sometimes not possible due to the high fluctuation of the heat pump operation.
- As last step an assessment of the calibration results is carried out for a validation period that differs from the calibration period with a with a different data set.
2.6. Optimization of Scheduled Heat Pump Operation
- Mode -1: Normal operation.
- Mode 0: No heat pump operation. The optimization algorithm cannot select this mode directly, as this would cause the heat pump to go out of operation at every possibility, e.g., in a cost optimization scenario. This mode is used to realize possible blocking times by a sub script.
- Mode 1: Forced heat pump operation to load the space heating thermal buffer storage.
- Mode 2: Forced heat pump operation to load the DHW thermal buffer storage.
- Mode 3: Forced heating of the buildings thermal mass. Thereby the heat pump can operate reguarly and load the thermal buffer storages according to demand.
2.6.1. PV Self-Consumption
2.6.2. PV and Wind Self-Consumption
2.7. Calculation of Carbon Dioxide Emission Savings and Prevention Costs
2.8. Weather Data
3. Results
3.1. Building Model Calibration Outcome
3.2. Impact of Weather Prediction Inaccuracy
3.2.1. Building Heat Demand
3.2.2. PV Power Generation
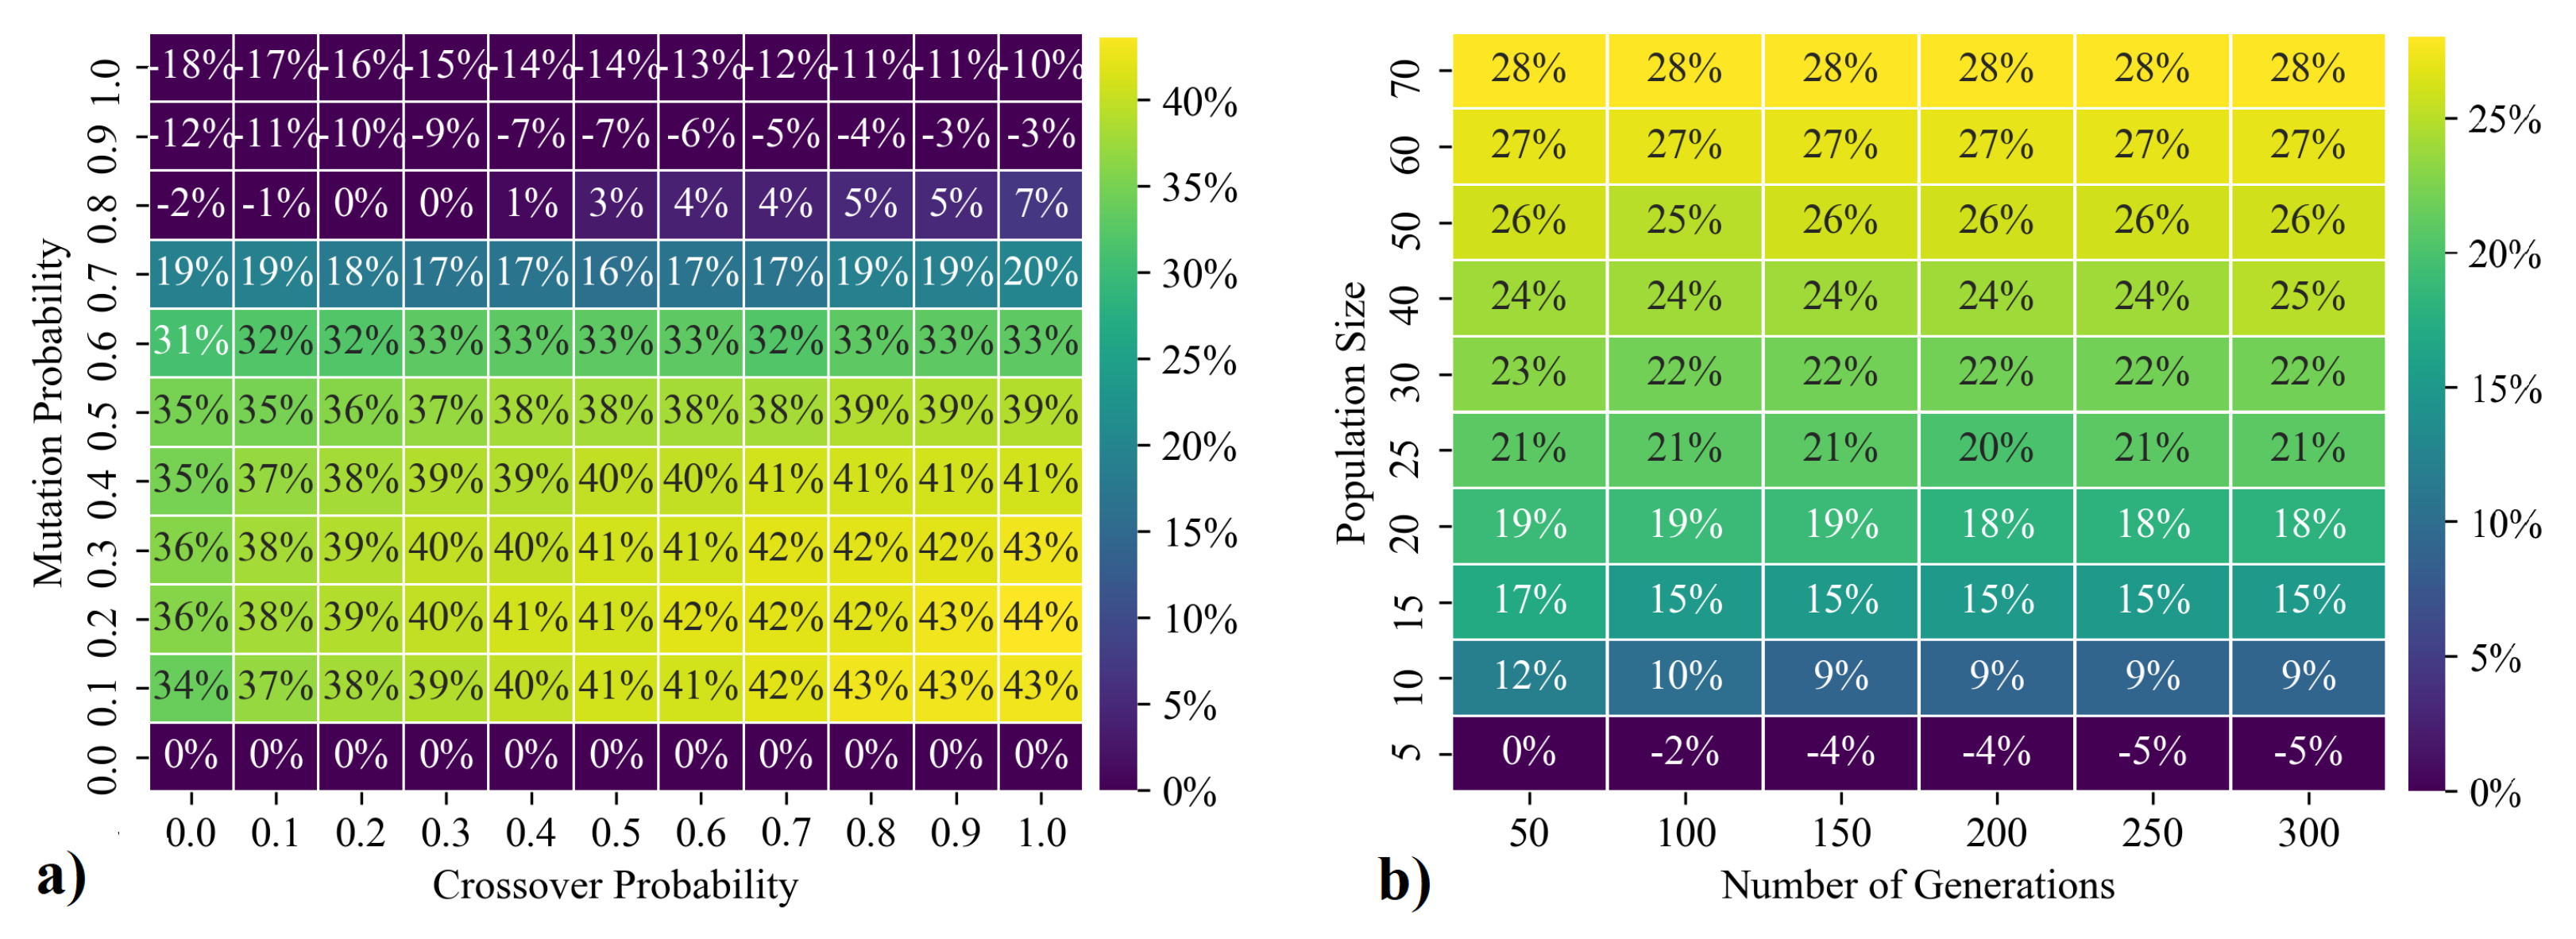
3.3. Best Parameters for Schedule Optimization
3.4. Single Building Operation
Optimized Self-Consumption
3.5. Building Cluster Operation
3.5.1. Optimized PV Self-Consumption
3.5.2. Optimized PV and Wind Self-Consumption
3.6. Adding of Hydrogen Systems with and without Small Wind Turbines
- Base Scenario: Decentral PV and Heat Pumps.
- Optimization: Optimized Heat Pump operation to increase PV self-consumption based on weather forecast data.
- Optimization + Hydrogen System: Seasonal hydrogen storage system with electricity-driven fuel cell to operate the heat pumps with surplus PV power stored from the summer months. Heat recovery from the electrolyzer and the fuel cell and heat injection into a district heating network are considered.
- Optimization + Hydrogen System + Small Wind Turbines (SWT): Additional small wind turbines to increase the power production throughout the year.
4. Discussion
4.1. Modelling
4.2. Optimization Case Studies
4.3. Hydrogen System Potential
5. Conclusions
Author Contributions
Funding
Institutional Review Board Statement
Informed Consent Statement
Data Availability Statement
Conflicts of Interest
Abbreviations
| Roughness exponent [-] | |
| Ant colony optimization | |
| Artificial neural network | |
| Broyden-Fletcher-Goldfarb-Shanno | |
| C | Cost [€] |
| c | Cost factor [-] |
| Capital expenditures | |
| Copper indium gallium selenide solar cell | |
| Distributed evolutionary algorithms in python | |
| Domestic hot water | |
| e | CO emission factor [kg/kWh] |
| E | Energy [kWh] |
| Evolutionary algorithm | |
| Electric vehicle | |
| Fuel cell | |
| Genetic algorithm | |
| h | Height [m] |
| Heating, ventilation, and air conditioning | |
| I | Current [A] |
| k-nearest neighbors | |
| Local energy management system | |
| Mass flow [kg/s] | |
| m | Mass [kg] |
| Mean absolute percentage error | |
| Model predictive control | |
| Maximum power point tracking | |
| Normalized root mean square error | |
| P | Power [kW] |
| Crossover probability [-] | |
| Mutation probability [-] | |
| Polymer electrolyte membrane | |
| Particle swarm optimization | |
| Photovoltaic | |
| Resistor–capacitor | |
| Renewable energy sources | |
| Residential load factor | |
| Support vector machine | |
| Small Wind Turbine | |
| Lifecycle [a] | |
| v | Speed [m/s] |
| Predicted value [kW] | |
| y | Measured value [kW] |
Appendix A. Calibration Results


Appendix B. Prediction Error Due to Weather Forecast Inaccuracy


References
- Burger, B. Öffentliche Nettostromerzeugung in Deutschland im Jahr 2018; Technical Report; Fraunhofer ISE: Freiburg, Germany, 2019. [Google Scholar]
- Umwelt Bundesamt. Erneuerbare Energien in Zahlen. 2018. Available online: https://www.umweltbundesamt.de/themen/klima-energie/erneuerbare-energien/erneuerbare-energien-in-zahlen#statusquo (accessed on 15 October 2019).
- Agora Energiewende. Wärmewende 2030. 2017. Available online: https://www.agora-energiewende.de/veroeffentlichungen/waermewende-2030-1 (accessed on 14 October 2021).
- Ahmad, M.W.; Mourshed, M.; Yuce, B.; Rezgui, Y. Computational intelligence techniques for HVAC systems: A review. Build. Simul. 2016, 9, 359–398. [Google Scholar] [CrossRef] [Green Version]
- Mourshed, M.M.; Kelliher, D.; Keane, M. Integrating Building Energy Simulation in the design process. IBPSA News 2003, 13, 21–26. [Google Scholar]
- Wei, Y.; Zhang, X.; Shi, Y.; Xia, L.; Pan, S.; Wu, J.; Han, M.; Zhao, X. A review of data-driven approaches for prediction and classification of building energy consumption. Renew. Sustain. Energy Rev. 2018, 82, 1027–1047. [Google Scholar] [CrossRef]
- Peña, J. Heuristic Optimization: Introduction and Simple Heuristics. 2015. Available online: https://mat.uab.cat/~alseda/MasterOpt/ (accessed on 10 February 2021).
- Buttelmann, M.; Lohmann, B. Optimierung mit Genetischen Algorithmen und eine Anwendung zur Modellreduktion. At-Automatisierungstechnik 2004, 52, 151–163. [Google Scholar] [CrossRef]
- Kumar, A.; Karma, B.; Sherpa, S.; Kalam, A.; Chae, G.S. Green Energy and Technology Advances in Greener Energy Technologies; Springer-Verlag GmbH: Heidelberg, Germany, 2020. [Google Scholar]
- Zhou, G.; Ihm, P.; Krarti, M.; Liu, S.; Henze, G.P. Integration of an Internal Optimization Module within EnergyPlus. In Proceedings of the Eighth International IBPSA Conferencen, Eindhoven, Netherlands, 11–14 August 2003. [Google Scholar]
- Xu, Y.; Ji, K.; Lu, Y.; Yu, Y.; Liu, W. Optimal Building Energy Management using Intelligent Optimization. In Proceedings of the IEEE International Conference on Automation Science and Engineering (CASE), Madison, WI, USA, 17–20 August 2013; pp. 95–99. [Google Scholar] [CrossRef]
- Kajl, S.; Sabourin, R. Optimization of HVAC Control System Strategy Using Two-Objective Genetic Algorithm. HVAC&R Res. 2005, 11, 459–486. [Google Scholar]
- Sun, C.; Shu, S.; Ding, G.; Zhang, X.; Hu, X. Investigation of time lags and decrement factors for different building outside temperatures. Energy Build. 2013, 61, 1–7. [Google Scholar] [CrossRef]
- Seo, J.; Ooka, R.; Kim, J.T.; Nam, Y. Optimization of the HVAC system design to minimize primary energy demand. Energy Build. 2014, 76, 102–108. [Google Scholar] [CrossRef]
- Bee, E.; Prada, A.; Baggio, P. Optimization of Air Source Heat Pump Systems over the Heating Season through the Use of Renewable Energy Sources. 2016. Available online: https://docs.lib.purdue.edu/ihpbc/205/ (accessed on 14 October 2021).
- Petkov, I.; Gabrielli, P. Power-to-hydrogen as seasonal energy storage: An uncertainty analysis for optimal design of low-carbon multi-energy systems. Appl. Energy 2020, 274, 115197. [Google Scholar] [CrossRef]
- Wang, C.; Nehrir, M.H. Power management of a stand-alone wind/photovoltaic/fuel cell energy system. IEEE Trans. Energy Convers. 2008, 23, 957–967. [Google Scholar] [CrossRef]
- Sun, L.; Jin, Y.; Shen, J.; You, F. Sustainable Residential Micro-Cogeneration System Based on a Fuel Cell Using Dynamic Programming-Based Economic Day-Ahead Scheduling. ACS Sustain. Chem. Eng. 2021, 9, 3258–3266. [Google Scholar] [CrossRef]
- Knosala, K.; Kotzur, L.; Röben, F.T.; Stenzel, P.; Blum, L.; Robinius, M.; Stolten, D. Hybrid Hydrogen Home Storage for Decentralized Energy Autonomy. Int. J. Electr. Power Energy Syst. 2021, 46, 21748–21763. [Google Scholar] [CrossRef]
- Brennenstuhl, M.; Zeh, R.; Otto, R.; Pesch, R.; Stockinger, V.; Pietruschka, D. Report on a Plus-Energy District with Low- Temperature DHC Network, Novel Agrothermal Heat Source, and Applied Demand Response. Appl. Sci. 2019, 9, 5059. [Google Scholar] [CrossRef] [Green Version]
- Pietruschka, D.; Pietzsch, U.; Monien, D. Vision 2020 Die Plusenergiegemeinde Wüstenrot; Fraunhofer IRB Verlag: Stuttgart, Germany, 2017; p. 142. [Google Scholar]
- Monsalvete Alvarez de Uribarri, P. A Multiscale Framework for Predicting Distributed Renewable Thermal Energy Integration. Ph.D. Thesis, University of Nottingham, Nottingham, UK, 2020. [Google Scholar]
- Christensen, A. Assessment of Hydrogen Production Costs from Electrolysis: United States and Europe; Technical Report; The International Council of Clean Transportation: Berlin, Germany, 2020. [Google Scholar]
- Bai, Q.; Liu, C.; Chen, J.; Fan, Y.X.; Wang, H.T. Manufacturing Cost Analysis of 100 and 250 kW Fuel Cell Systems for Primary Power and Combined Heat and Power Applications. Appl. Phys. B Lasers Opt. 2010, 98, 681–684. [Google Scholar] [CrossRef]
- Kleemann, M.; Meliß, M. Regenerative Energiequellen; Springer: Berlin/Heidelberg, Germany, 1993. [Google Scholar]
- Pflugradt, N. Loadprofile Generator. 2020. Available online: https://www.loadprofilegenerator.de/ (accessed on 23 July 2020).
- DEAP. DEAP—Distributed Evolutionary Algorithms in Python. 2021. Available online: https://deap.readthedocs.io/en/master/ (accessed on 22 July 2021).
- Green, R. The Effects of Cycling on Heat Pump Performance; Technical Report November; EA Technology Ltd.: Capenhurst, UK, 2012. [Google Scholar]
- Curtis, R.; Pine, T. Effects of Cycling on Domestic GSHPs. Supporting Analysis to EA Technology Simulation/Modelling; Technical Report; Mimer Geoenergy: Falmouth, UK, 2012. [Google Scholar]
- Bundesnetzagentur. EEG-Re gis ter da ten und-För der sät ze. 2021. Available online: https://www.bundesnetzagentur.de/DE/Sachgebiete/ElektrizitaetundGas/Unternehmen_Institutionen/ErneuerbareEnergien/ZahlenDatenInformationen/EEG_Registerdaten/EEG_Registerdaten_node.html (accessed on 14 June 2021).
- Statista GmbH. Index zur Entwicklung des Strompreises* für Haushalte in Deutschland in den Jahren 1998 bis 2021. 2021. Available online: https://de.statista.com/statistik/daten/studie/234370/umfrage/entwicklung-der-haushaltsstrompreise-in-deutschland/ (accessed on 14 October 2021).
- Umweltbundesamt. Spezifische Emissionsfaktoren für den Deutschen Strommix. 2021. Available online: https://www.umweltbundesamt.de/themen/luft/emissionen-von-luftschadstoffen/spezifische-emissionsfaktoren-fuer-den-deutschen (accessed on 14 October 2021).
- Großklos, M. Kumulierter Energieaufwand und CO2-Emissionsfaktoren Verschiedener Energieträger und—Versorgungen; Technical Report; Insitut Wohnen und Umwelt: Darmstadt, Germany, 2020. [Google Scholar]
- IRENA. Electricity Storage and Renewables: Costs and Markets to 2030; Technical Report May; International Renewable Energy Agency: Abu Dhabi, United Arab Emirates, 2017. [Google Scholar]


| Method | Required | Typical | User- | Computational | Model |
|---|---|---|---|---|---|
| Input Data | Applications | Friendliness | Demand | Accuracy | |
| White Box (Detailed) | Detailed physical information | DOE-2, EnergyPlus, TRYSYS, ESP-r INSEL | Low | High | High |
| White Box (Simplified) | Physical information | Heating degree day method, temperature frequency method, RLF (Residential Load Factor) | Average | Average | Relativly high |
| Grey Box | Physical information and historical data | RC Network | Low, average | Low, average | Relatively high |
| Black Box | Historical data | ANN, SVM, Regression- analysis, Clustering | Low | Low, average | High except regression |
| Wind Speed [m/s] | 1 | 2 | 3 | 4 | 5 | 6 | 7 | 8 | 9 | 10 | 11 | 12 | 13 | 14 |
|---|---|---|---|---|---|---|---|---|---|---|---|---|---|---|
| Power [kW] | 0 | 0.05 | 0.2 | 0.4 | 0.6 | 0.8 | 1.3 | 2.0 | 3.0 | 3.9 | 4.5 | 5.0 | 5.2 | 5.3 |
| Source | Emission Factor | Source |
|---|---|---|
| Power From Grid | [32] | |
| District Heating | [33] |
| Component | Specific Costs | Unit | Source |
|---|---|---|---|
| PEM Electrolyzer | €−1 | [19] | |
| Compressor | €−1 | [23] | |
| Hydrogen Storage | €−1 | [19] | |
| PEM Fuel Cell | €−1 | [19] | |
| Battery | €−1 | [34] | |
| Small Wind Turbine (5 kW) | 24,000 | € | own assumption |
| Hydrogen Delivery | 9 | €−1 | own assumption |
| Building ID | Indoor | Hyst Space | Hyst DHW | Hyst Room | Heating Stop | Air Ex |
|---|---|---|---|---|---|---|
| Temp [°C] | [°C] | [°C] | [°C] | Temp [°C] | Rate [1/h] | |
| Initial Param. | 20.0 | 5.0 | 5.0 | 2.0 | 10.0 | 0.30 |
| Param. Range | 15.0–25.0 | 0.01–10.0 | 0.01–10.0 | 0.01–3.0 | 8.0–18.0 | 0.00–0.60 |
| Building ID | NRMSE | NRMSE | E, Measured | E, Predicted |
|---|---|---|---|---|
| Original | Calibrated | [kWh] | [kWh] | |
| 01 | 30.8% | 18.4% | 105.1 | 100.0 |
| 02 | 40.6% | 26.1% | 81.1 | 72.4 |
| 09 | 49.8% | 47.6% | 92.4 | 92.6 |
| 10 | 68.3% | 32.9% | 62.8 | 62.0 |
| 12 | 32.2% | 29.7% | 138.1 | 133.4 |
| 19 | 41.7% | 32.7% | 117.1 | 103.1 |
| 20 | 19.0% | 19.0% | 83.6 | 83.0 |
| 22 | 45.4% | 23.8% | 53.2 | 46.8 |
| 24 | 45.8% | 28.3% | 68.7 | 56.1 |
| 25 | 36.5% | 20.8% | 61.7 | 57.2 |
| Building ID | Indoor | Hyst Space | Hyst DHW | Hyst Room | Heating Stop | Air Ex |
|---|---|---|---|---|---|---|
| Temp [°C] | [°C] | [°C] | [°C] | Temp [°C] | Rate [1/h] | |
| 01 | 16.7 | 2.3 | 0.01 | 0.7 | 17.0 | 0.20 |
| 02 | 16.7 | 1.7 | 0.1 | 0.01 | 14.0 | 0.04 |
| 09 | 20.3 | 7.0 | 7.3 | 2.2 | 11.0 | 0.02 |
| 10 | 15.7 | 0.3 | 0.3 | 0.3 | 14.0 | 0.00 |
| 12 | 19.3 | 7.7 | 8.3 | 0.7 | 13.0 | 0.32 |
| 19 | 20.0 | 4.0 | 4.7 | 0.4 | 9.0 | 0.10 |
| 20 | 20.3 | 0.7 | 4.7 | 0.4 | 15.0 | 0.60 |
| 22 | 16.7 | 5.0 | 0.3 | 0.8 | 17.0 | 0.12 |
| 24 | 16.0 | 1.3 | 0.3 | 0.3 | 14.0 | 0.04 |
| 25 | 17.3 | 0.1 | 0.1 | 0.4 | 15.0 | 0.00 |
| Measured Weather Data | 24 h Forecast | 48 h Forecast | |
|---|---|---|---|
| NRMSE | 14.2% | 16.7% | 20.6% |
| 24 h Forecast | 48 h Forecast | 72 h Forecast | |
|---|---|---|---|
| NRMSE | 9.7% | 9.6% | 10.6% |
| Jan | Feb | Mar | Apr | May | Jun | Jul | Aug | Sep | Oct | Nov | Dec | |
|---|---|---|---|---|---|---|---|---|---|---|---|---|
| Opt | 3.8% | 7.0% | 10.4% | 10.6% | 14.9% | 15.4% | 16.6% | 12.5% | 10.8% | 6.7% | 4.5% | 3.9% |
| Meas Opt | 0.9% | 4.6% | 4.0% | 6.6% | 5.0% | 1.6% | 0.6% | 3.1% | 3.3% | 3.9% | 1.4% | 1.1% |
| Ad Hoc | 1.2% | 5.2% | 4.8% | 8.0% | 8.1% | 5.0% | 5.9% | 6.8% | 5.8% | 4.7% | 1.7% | 1.5% |
| Jan | Feb | Mar | Apr | May | Jun | Jul | Aug | Sep | Oct | Nov | Dec | |
|---|---|---|---|---|---|---|---|---|---|---|---|---|
| Opt | 4.7% | 9.8% | 12.5% | 15.0% | 20.9% | 18.4% | 19.5% | 17.0% | 15.9% | 10.0% | 5.6% | 4.4% |
| Meas Opt | 1.1% | 5.8% | 3.0% | 4.9% | 2.2% | 7.0% | 2.6% | 5.9% | 5.4% | 2.9% | 2.1% | 1.7% |
| Ad Hoc | 1.8% | 6.0% | 4.1% | 6.9% | 5.7% | 9.4% | 8.5% | 8.8% | 7.0% | 4.9% | 2.7% | 2.1% |
| Jan | Feb | Mar | Apr | May | Jun | Jul | Aug | Sep | Oct | Nov | Dec | |
|---|---|---|---|---|---|---|---|---|---|---|---|---|
| Opt | 1.6% | 3.3% | 3.5% | 5.0% | 6.2% | 6.6% | 4.3% | 4.5% | 5.0% | 4.3% | 2.4% | 1.5% |
| Meas Opt | 0.0% | −0.1% | 0.1% | −0.2% | 0.2% | 0.4% | −0.4% | 0.8% | 0.3% | 0.0% | −0.4% | −0.1% |
| Ad Hoc | 0.3% | 0.5% | 0.9% | 0.6% | 1.1% | 1.4% | 0.6% | 1.2% | 1.2% | 1.1% | 0.5% | 0.3% |
| Jan | Feb | Mar | Apr | May | Jun | Jul | Aug | Sep | Oct | Nov | Dec | |
|---|---|---|---|---|---|---|---|---|---|---|---|---|
| Opt | 1.9% | 4.1% | 4.5% | 5.3% | 7.7% | 5.4% | 4.2% | 5.4% | 3.9% | 4.5% | 3.2% | 1.8% |
| Meas Opt | −0.2% | 1.6% | 0.7% | 1.3% | 1.0% | 1.0% | 0.5% | 1.1% | 0.4% | 0.1% | 0.5% | 0.1% |
| Ad Hoc | 0.3% | 1.9% | 1.5% | 1.5% | 2.0% | 1.7% | 0.9% | 1.7% | 0.8% | 1.0% | 0.7% | 0.4% |
| Jan | Feb | Mar | Apr | May | Jun | Jul | Aug | Sep | Oct | Nov | Dec | |
|---|---|---|---|---|---|---|---|---|---|---|---|---|
| Opt | 3.6% | 7.4% | 5.6% | 7.8% | 6.8% | 6.6% | 6.5% | 5.3% | 7.3% | 6.0% | 5.3% | 0.0% |
| Meas Opt | −0.2% | 2.2% | −0.6% | 0.5% | −0.3% | −0.4% | −0.1% | −0.2% | 1.1% | −0.3% | −1.9% | 0.1% |
| Ad Hoc | 0.4% | 2.8% | 0.9% | 1.3% | 1.4% | 1.3% | 0.8% | 1.3% | 1.6% | 0.9% | 0.9% | 0.4% |
| Parameter | Hydrogen System | SWT and Hydrogen System |
|---|---|---|
| Electrolyzer Power | 78 kW | 107 kW |
| Electrolyzer Cells | 45 | 62 |
| ELectrolyzer Cell Area | 300 cm2 | 300 cm2 |
| Max. Hydrogen prod. Rate | −1 | −1 |
| Storage Volume | ||
| Initial Storage Tank Filling | 35 | 15 |
| FC Power | 37.5 kW | 37.4 kW |
| FC Cells | 345 | 344 |
| FC Area | 400 cm2 | 400 cm2 |
| Compressor Power | 17.75 kW | 24.5 kW |
| Parameter | w/o SWT | With SWT |
|---|---|---|
| w/o | 48,385 kWh | 36,974 kWh |
| w/ | 59 kWh | 70 kWh |
| Parameter | Hydrogen System | SWT and Hydrogen System |
|---|---|---|
| Estimated System CAPEX | € | € |
| Annual Hydrogen Refill Costs | € | € |
| €−1 | €−1 | |
| (Heat Recovery) | €−1 | €−1 |
Publisher’s Note: MDPI stays neutral with regard to jurisdictional claims in published maps and institutional affiliations. |
© 2021 by the authors. Licensee MDPI, Basel, Switzerland. This article is an open access article distributed under the terms and conditions of the Creative Commons Attribution (CC BY) license (https://creativecommons.org/licenses/by/4.0/).
Share and Cite
Brennenstuhl, M.; Lust, D.; Pietruschka, D.; Schneider, D. Demand Side Management Based Power-to-Heat and Power-to-Gas Optimization Strategies for PV and Wind Self-Consumption in a Residential Building Cluster. Energies 2021, 14, 6712. https://doi.org/10.3390/en14206712
Brennenstuhl M, Lust D, Pietruschka D, Schneider D. Demand Side Management Based Power-to-Heat and Power-to-Gas Optimization Strategies for PV and Wind Self-Consumption in a Residential Building Cluster. Energies. 2021; 14(20):6712. https://doi.org/10.3390/en14206712
Chicago/Turabian StyleBrennenstuhl, Marcus, Daniel Lust, Dirk Pietruschka, and Dietrich Schneider. 2021. "Demand Side Management Based Power-to-Heat and Power-to-Gas Optimization Strategies for PV and Wind Self-Consumption in a Residential Building Cluster" Energies 14, no. 20: 6712. https://doi.org/10.3390/en14206712
APA StyleBrennenstuhl, M., Lust, D., Pietruschka, D., & Schneider, D. (2021). Demand Side Management Based Power-to-Heat and Power-to-Gas Optimization Strategies for PV and Wind Self-Consumption in a Residential Building Cluster. Energies, 14(20), 6712. https://doi.org/10.3390/en14206712