Article

The Effect of Crankshaft Phasing and Port Timing Asymmetry on Opposed-Piston Engine Thermal Efficiency

1
Institute for Advanced Automotive Propulsion Systems (IAAPS), University of Bath, Claverton Down, Bath BA2 7AY, UK
2
Clean Combustion Research Center (CCRC), King Abdullah University of Science and Technology (KAUST), Jeddah 23955-6900, Saudi Arabia
*
Author to whom correspondence should be addressed.
Energies 2021, 14(20), 6696; https://doi.org/10.3390/en14206696
Submission received: 1 September 2021 / Revised: 28 September 2021 / Accepted: 4 October 2021 / Published: 15 October 2021
(This article belongs to the Special Issue Recent Advances in Internal Combustion Engines)

Abstract

:
Opposed-piston, two-stroke engines reveal degrees of freedom that make them excellent candidates for next generation, highly efficient internal combustion engines for hybrid electric vehicles and power systems. This article reports simulation results that explore the influence of key control and geometrical parameters, specifically crankshaft phasing and intake and exhaust port height-to-stroke ratios, in obtaining best thermal efficiency. A model of a 0.75 L, single-cylinder opposed-piston two-stroke engine is exercised to predict fuel consumption as engine speed, load, crankshaft phasing, intake and exhaust port height-to-stroke ratios, and stoichiometry are varied for medium-duty truck and range extender applications. Under stoichiometric operation, optimal crankshaft phasing is seen at 0–5°, lower than reported in the literature. If stoichiometric operation is not mandated, best fuel consumption is achieved at an air-to-fuel equivalence ratio λ = 1.25 and 5–10° crankshaft phase angle, enabling a ~10 g/kWh (~4%) improvement in average brake-specific fuel consumption across medium-duty truck operating points. In range extender form, the engine provides 30 kW output power in accordance with a survey of range extender engines. In this role, there is a clear distinction between low-speed, high-load operation and vice versa. The decision as to which is more appropriate would be based on minimizing total owning and operating cost, itself a trade-off between better thermal efficiency (and thus lower fuel cost) and greater durability.

1. Introduction

1.1. Context

Decarbonization of power and propulsion systems (i.e., a reduction in their carbon intensity) has a major role to play in mitigating anthropogenic greenhouse gas (GHG) emissions and their impact on global climate change. Most forecasts agree that the decarbonization of energy systems (i.e., energy generation, storage, transmission, etc.) will take place at a much faster rate than in the end users they supply, such as the transport and industry sectors. For example, the transport sector was responsible for approximately 23% of global anthropogenic CO2 emissions in 2010 [1], but its decarbonization is more challenging than other sectors considering increasing worldwide demand for personal transport and its link to GDP growth in general. Lowering the energy intensity of transport by enhancing vehicle and engine performance is a key factor in reducing GHG emissions and offers the potential for high levels of GHG mitigation [1]. The electrification of transport is currently receiving much attention, with battery and fuel cell electric vehicles (EVs) being favoured on propulsion technology roadmaps (e.g., [2]). However, concerns over range anxiety and high upfront costs continue to restrict their uptake, and the vast majority of vehicles continue to be powered by the internal combustion engine (ICE). Indeed, of the 15.5 million passenger cars manufactured in the EU in 2019, 90% used a conventional (i.e., non-hybrid) gasoline or diesel engine [3]. Meanwhile, in Germany for example, the average lifespan of a passenger car is approx. 18 years [4], a figure which is representative of the EU as a whole. So, despite the potential of EVs to enable significant GHG reductions, their impact is hindered by the slow rate at which the fleet is replaced. This emphasizes the need to continue developing highly efficient ICEs, since they remain the incumbent propulsion technology in the near term and will exist in one form or another even beyond 2050 [2].

1.2. Review of Range Extender Engines

The range-extended electric vehicle (REEV) offers some of the advantages of electric propulsion but eliminates range anxiety and could therefore smooth the transition to electrification and promote faster renewal of the vehicle parc. Numerous examples of dedicated range extender combustion engines have been developed to meet this need, and a non-exhaustive survey (see Table 1) reveals a broad range of types, ranging from conventional reciprocating engines [5,6,7,8,9], to Wankel rotary engines [10,11,12,13,14,15], gas turbines [16,17,18,19,20,21], and free piston engines [22,23,24]. While opposed-piston two-stroke engines (OP2S) have in the past found application at higher power levels in medium-duty trucks [25], tanks [26] and other heavy military ground vehicles [27], more recently they have been proposed for range extender powertrains as well [28]. OP2S engines have some notable advantages over conventional (four-stroke piston) engines. These include lower heat losses (since there is no cylinder head), which promotes greater thermal efficiency (and thus vehicle range), as well as fewer and less complex components (thus reducing cost) by virtue of simpler engine design (e.g., piston-ported, rather than valvetrain-controlled gas exchange events). Irrespective of the underlying chemical energy converter technology, Table 1 suggests consensus for a range extender power requirement of approx. 30 kW. The present study therefore includes simulations of an OP2S engine operating in a range extender application with a nominal 30 kW brake power output.

1.3. Scavenging in OP2S Engines

Applying a range of computational tools to a two-stroke, free piston engine, Goldsborough and Van Blarigan [29] at Sandia National Laboratories used 0D, 1D and 3D CFD models to compare three different scavenging configurations (loop, hybrid-loop, and uniflow) and explored the impact of various operating conditions and geometric parameters on the scavenging process, leading to the adoption of the uniflow arrangement. Moving to OP2S engines, Ma et al. [30] investigated uniflow OP2S engines across several works that consider the scavenging system configuration [30], the optimization of scavenging parameters [31], testing of an OP2S diesel engine and corresponding model validation [32]. In further uniflow scavenging simulations [33] they conclude that the intake port height-to-stroke ratio is the most important factor affecting delivery ratio, and the exhaust port height-to-stroke ratio affects engine delivery ratio and scavenging efficiency. Yang et al. [34] also studied the effect of port height on the scavenging process in an OP2S diesel engine, using a 3D model validated against experiments. They emphasize the value of the scavenging curve in providing insight into the optimization of port height. Mattarelli et al. report a CFD study of an OP2S diesel engine [35], which optimizes the geometric configuration and analyses the effect of crankshaft phasing using a coupled 1D–3D CFD model. In fact, the interpolated scavenging profile given by Mattarelli et al. [35] (Figure 13) is gratefully employed in the present study. Work carried out by the University of Bath and Saudi Aramco considered OP2S uniflow and reverse uniflow scavenging arrangements for a medium-duty truck application [36]. This identified a significant limitation of conventional loop-scavenged arrangements due to the need to have the intake and exhaust ports located at the same height in the cylinder, which compromised the effective compression and expansion ratios. More recent work at the University of Bath by the present authors also considered the thermal efficiency benefits of turbocompounding the OP2S engine [37].

1.4. Research Aim

The aim of the present study is to explore the interrelated effects of crankshaft phasing and intake and exhaust port height-to-stroke ratios on OP2S engine performance, in order to better understand its transport decarbonization potential as a highly efficient power source for conventional or hybrid electric vehicles. A full factorial analysis of the effects of port heights and crankshaft phasing on the brake-specific fuel consumption (BSFC) of OP2S engines will provide new information by examining a broader range of port height ratios and other parameters than previously considered in the literature. Furthermore, the study aims to identify the optimal phasing, and the benefits of variable phasing and lean operation, for a selection of speed–load conditions relevant to both medium-duty truck and range extender operation.

2. Method

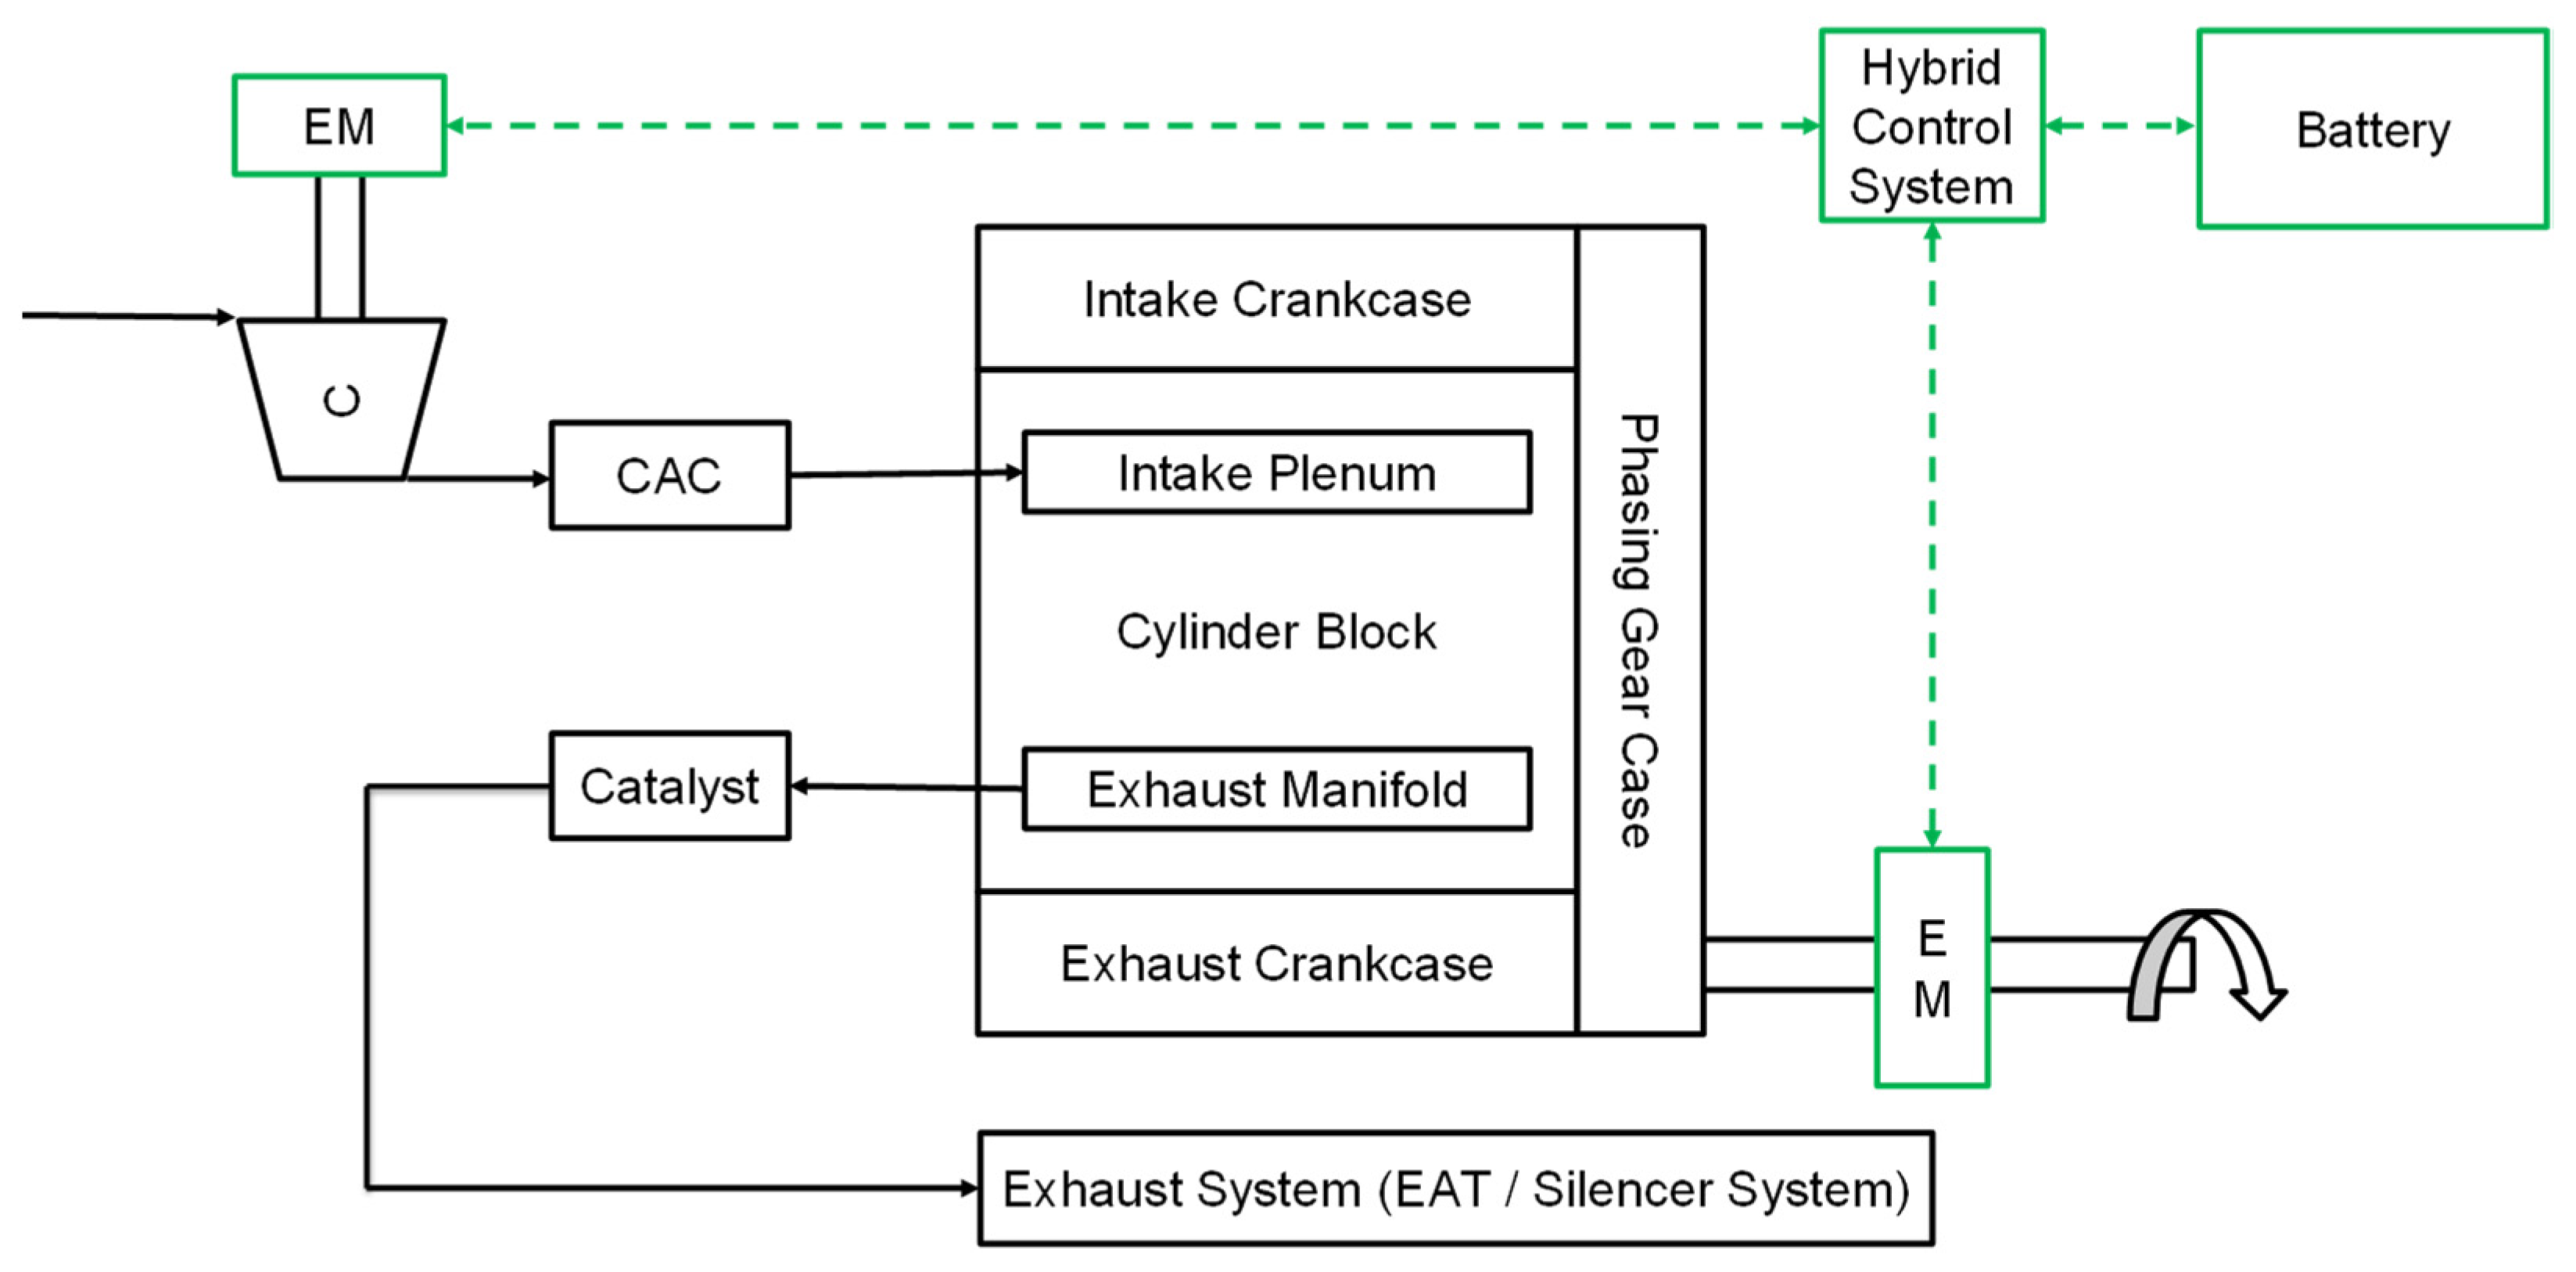
2.1. OP2S Engine Model
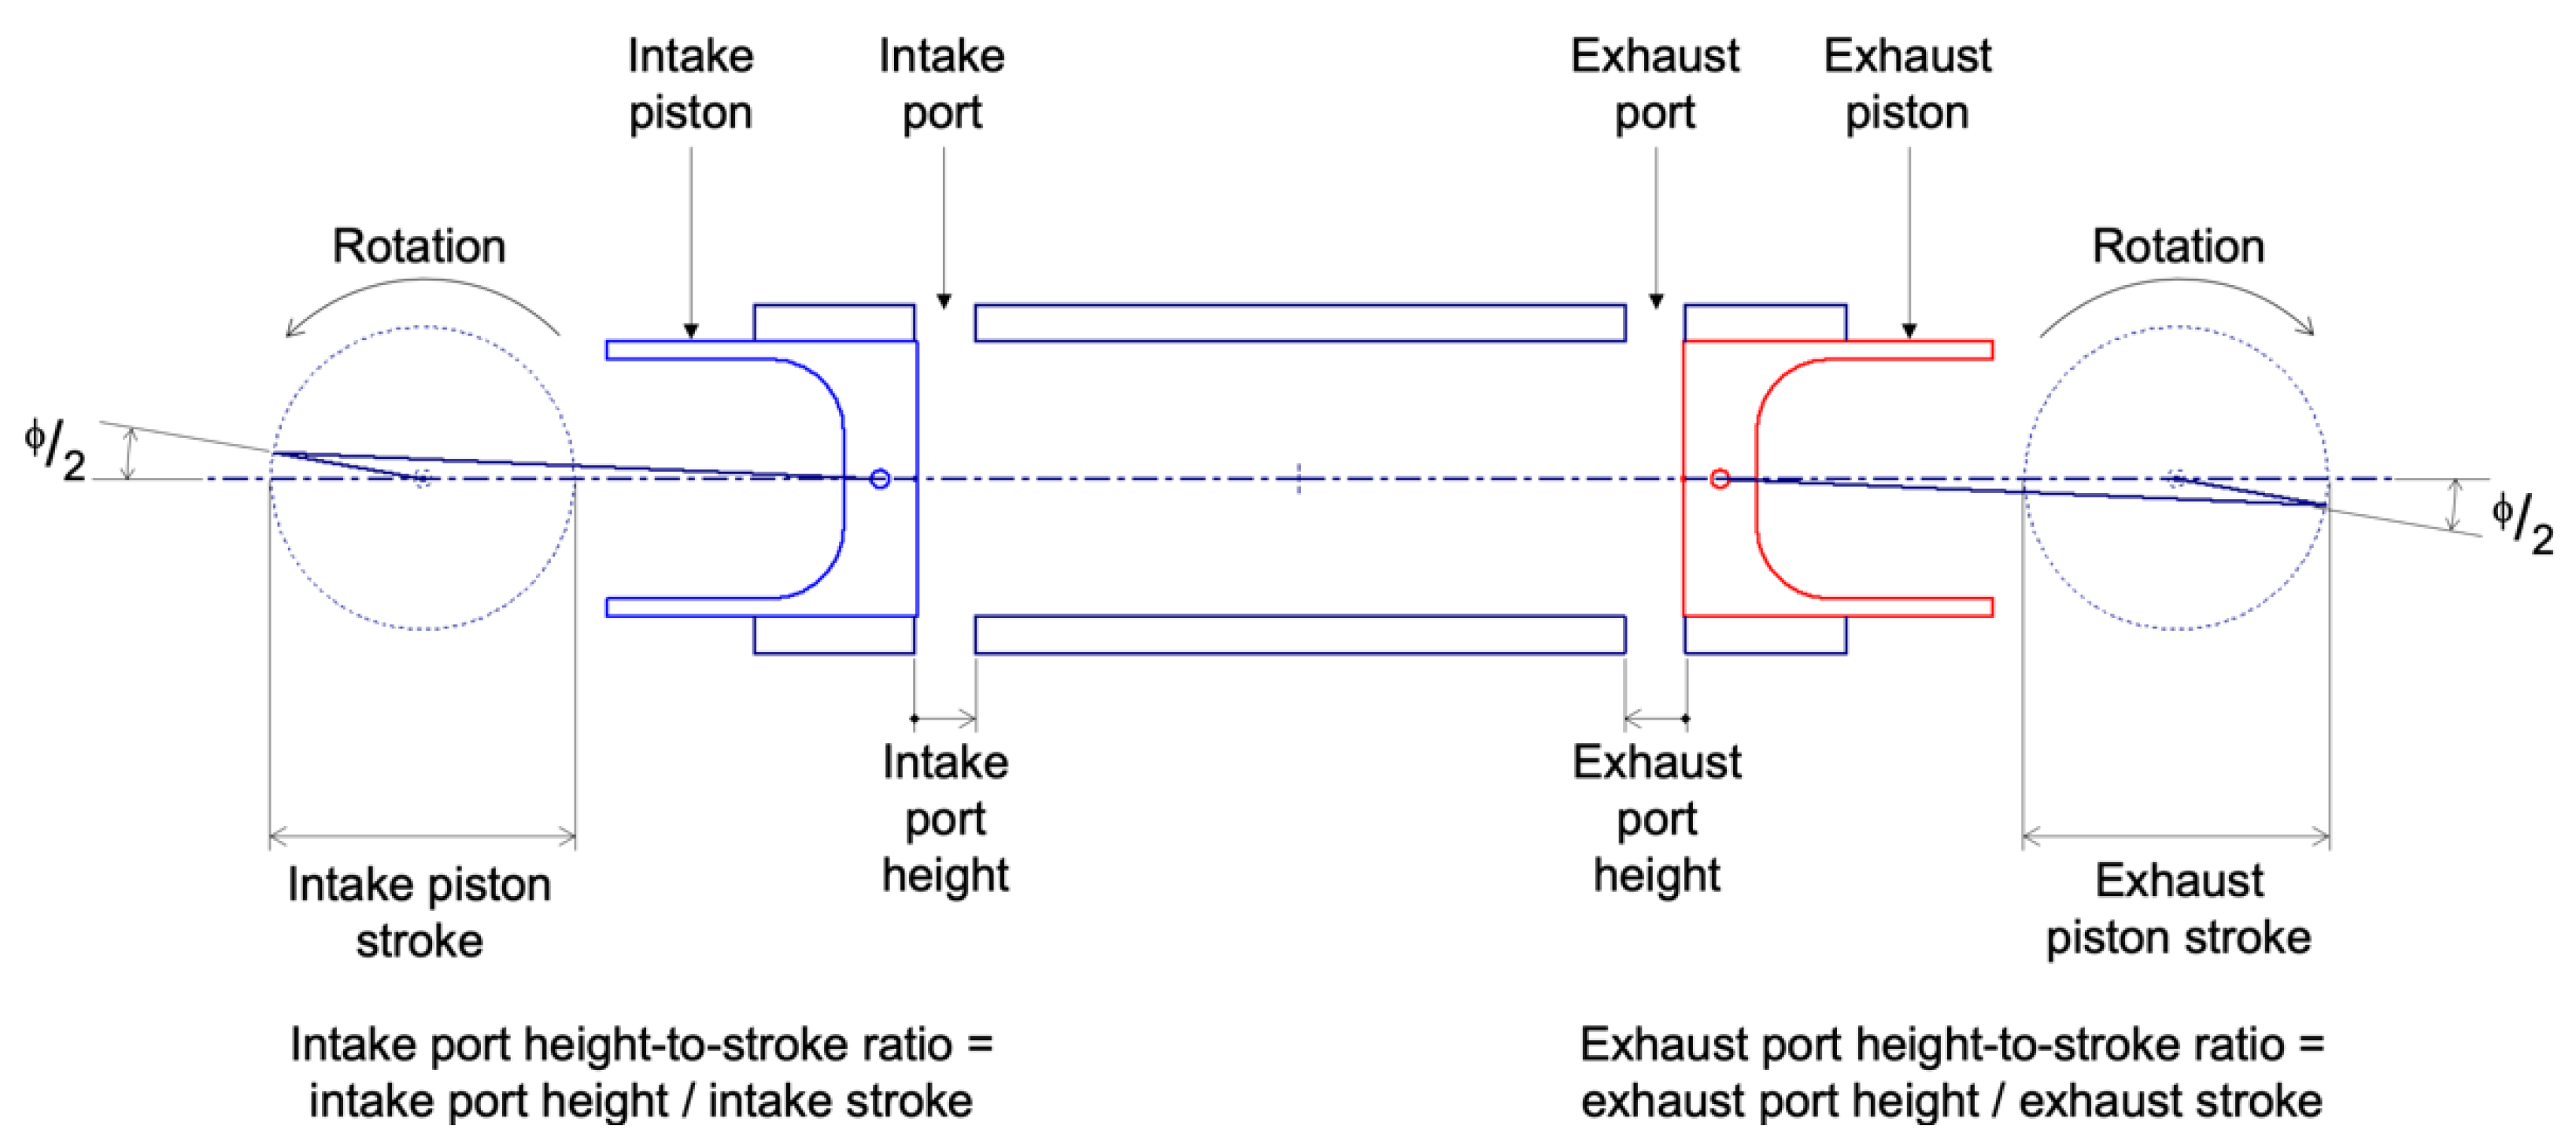
A single-cylinder OP2S engine is modelled in this study, building on previous modelling work carried out at the University of Bath [36,37]. The overall engine geometry (listed in Table 2), scavenging system, and combustion heat release profiles were carried over into this work, with modifications to allow simulation of the effects of crankshaft phasing and port geometries on BSFC, the accepted automotive industry metric for thermal efficiency. The commercial engine simulation software GT-SUITE (v.2020) (Gtisoft, Westmont, IL, USA) [38] was employed for the present study.
The opposed piston arrangement is represented as an equivalent single-piston cylinder of stroke equal to the total stroke of the two opposed pistons, and a piston surface area corresponding to that of the two opposed pistons combined. The motion of this equivalent piston mimics the motion of the exhaust piston, as seen from the intake piston. In opposed-piston engines, the crankshafts connected to each of the pistons do not need to rotate in phase. Often, there is a phase angle difference of 5–10°CA and the exhaust piston typically leads the intake piston, which is also the case in this study. Such “crankshaft phasing” can be varied in the model; the range explored here is 0–20°CA.
The piston-ported valve events are simulated by overriding the flow area multiplier of a standard ported valve connection. The crank angle is used to calculate the respective positions of the intake and exhaust pistons, which are then used to calculate the open port areas, at said crank angle. The combustion heat release profile (Figure 1) is carried over from the earlier work [36,37], which was itself adopted from previous work performed by Saudi Aramco and KAUST on gasoline compression ignition (GCI) engines [39]. The fuel properties for gasoline used throughout the present study were also carried over from the prior work; the headline specifications are given in Table 3.
The scavenge profile applied herein is shown in Figure 2. This is carried over from the original OP2S engine model, itself based on the interpolated profile inferred from 3D CFD simulations of a OP2S diesel engine performed by Mattarelli et al. [35]. This scavenge profile and the GCI heat release profile were applied throughout the simulations reported in the current work. This combination of a GCI heat release profile and OP2S diesel engine scavenge profile is applied throughout the simulations reported in the current work. It is justified since testing of GCI and diesel combustion in the same medium-duty opposed-piston engine showed comparable burn duration and thermal efficiency results for similar boundary conditions [40].
To obtain realistic brake performance quantities, a Chen-Flynn mechanical friction model is specified in the engine model. The model was parameterized using the approach recommended in the GT-SUITE manual, to match friction mean effective pressure (FMEP) values typical of this style of OP2S engine, based on the authors’ collective experience.
Figure 3 shows a schematic representation of the engine configuration modelled in this work. The air and exhaust paths are purposely simplified as intake and exhaust plenums, thereby removing the influence of particular ducting geometry and any corresponding gas dynamic or tuning effects. Boost pressure is provided by an electric compressor (“e-compressor” or “e-supercharger”). To avoid the influence of choosing a particular compressor design, it is modelled as an adiabatic compression process with a user-defined isentropic efficiency (thereby revealing the possibility of a sensitivity study on this parameter). Fixed electromechanical conversion and compressor shaft mechanical efficiencies of 95% and 98%, respectively, are applied.

2.2. OP2S Geometry

Figure 4 provides a scale drawing of the OP2S single-cylinder arrangement, defining crankshaft phase angle ϕ, as well as the intake and exhaust port heights and piston strokes, which respectively determine the intake and exhaust port height-to-stroke ratios. However, in the engine model the motion of the two opposing pistons is captured by implementing user-defined equations to dictate the time-varying combustion chamber geometry of an equivalent single piston-in-cylinder arrangement, instead of two separate pistons. Nonetheless, intake and exhaust piston motion may still be distinguished; Figure 5 shows intake (blue) and exhaust (red) piston displacement as a function of crank angle across the cycle, and the resulting effective (i.e., inter-piston) displacement (black).
As previously mentioned, the impact of crankshaft phasing (in conjunction with intake and exhaust port geometry) will be investigated in this paper. The phase angle difference between the intake and exhaust crankshafts is controlled by a parameter in the user-defined equations for the effective cylinder geometry. The inset plot in Figure 5 illustrates the very small change in maximum effective (inter-piston) displacement when the crankshaft phase angle is varied between the minimum (0°, solid line) and maximum (20°, broken line) values investigated. Figure 6 shows the impact of crankshaft phasing on geometric compression ratio when the same dimensions, including the distance between the two crankshaft axes, are used.
Next, Figure 7 illustrates intake and exhaust piston motion over a complete engine cycle for the minimum and maximum crankshaft phase angles (0° and 20°, respectively). Meanwhile, the upper and lower bounds (horizontal dash-dot lines) represent the smallest and largest values of port height investigated. In combination, the diagrams in Figure 7 allow the intake and exhaust port opening durations to be visually compared.
Figure 8 reports the predicted blowdown, scavenge and intake durations as a function of crankshaft phasing and intake and exhaust port height-to-stroke ratio. As would be expected, increasing the intake port height-to-stroke ratio reduces blowdown duration, which conversely increases with exhaust port height. Intake duration responds in the opposite manner. Increasing the crankshaft phase angle will extend both the blowdown and intake durations. Scavenge duration is naturally maximized at maximum intake and exhaust port height-to-stroke ratios, but is impinged by the increasing crankshaft phase angle, which also acts to smooth out their individual influence.
At this point, it is worth mentioning that the format of the contour plots in Figure 8, viz. vertical and horizontal axes of intake and exhaust port height-to-stroke ratio, respectively, will continue to be employed throughout the remainder of the paper as a convenient way to present the impact of the engine design or operational parameters in question and thereby identify regions of preferred operation.
Having introduced the impact of crankshaft phasing and selection of intake and exhaust port height on combustion chamber geometry and corresponding metrics, the OP2S engine model can be used to simulate their effect on the gas exchange process. Figure 9 shows the predicted trapped expansion ratio, trapped compression ratio, and ratio of expansion to compression ratios, again as a function of crankshaft phasing and intake and exhaust port height-to-stroke ratio. Both the trapped compression and trapped expansion ratios are maximized at minimum intake and exhaust port height-to-stroke ratios, with identical results at a zero crankshaft phase angle, leading to a flat contour for the ratio of expansion to compression ratios. As crankshaft phasing increases, the trapped expansion ratio is increasingly dictated by the exhaust port height, while the trapped compression ratio is increasingly controlled by the intake port height. Combined, these manifest as the diagonal isolines observed on the ratio of expansion to compression ratios contour plots.

2.3. Design of Experiment

Table 4 lists the key engine speed–load combinations evaluated in this study and their corresponding brake power. Operating points A, B, and C were chosen to correspond to a medium-duty truck application, approximately in line with the previous investigation [36]. Point A represents part-load operation, while operating points B and C were chosen to represent engine operation at peak torque and peak power, respectively. In order to mitigate the propensity for knock, the target values of 12 and 10 bar BMEP, respectively at points B and C were purposely selected so as to constrain the maximum in-cylinder pressure rise rates to 12 and 6 bar/CA°, respectively; these values were justified in previous works [37]. Knock prediction is notoriously difficult to predict; Marseglia and Medaglia [41] provide a helpful summary of knock prediction and detection methods. Ultimately, operating points B and C correspond to entirely reasonable medium-duty specific outputs of 30 and 50 kW/l, respectively.
Operating points D and E were selected to provide two options (lower speed/higher load and higher speed/lower load) for obtaining 30 kW brake power output, previously identified as a sensible power level for range extender applications. At 16-bar BMEP, point D is set to a very high load (at least for range extender applications) but should offer lower (engine speed-related) frictional losses. On the other hand, and in alignment with the strategy applied to MAHLE’s range extender engine [6], the 8-bar BMEP at point E should be attainable without recourse to more complex intake and exhaust systems, while a speed of 3000 min−1 would not create too many NVH (Noise, Vibration, Harshness) problems.
Table 4 also gives the exhaust system back pressure applied in each case to imitate the presence of aftertreatment. In brief, this is estimated by treating the aftertreatment as an orifice and calculating a pressure drop as a function of engine speed-related flow rate.
Table 5 lists the engine design and control parameters varied in this study and the corresponding range of variation explored. Recall that the aim of this study is to investigate how crankshaft phasing and port height-to-stroke ratios affect thermal efficiency across the selected operating points. In terms of crankshaft phasing, the 0–20° range in Table 5 is an extension of the 8–12° exhaust crank angle lead range investigated by Achates Power on their opposed-piston GCI engine [42] (p. 3, Table 1), while the earlier Achates Power OP2S diesel engine employed a fixed 13.5° crankshaft phase angle [43].
Regarding port heights, Yang et al. suggest the optimal port height-to-stroke ratio should lay in the range 0.11–0.15 for most engines [34] (p. 345, Figure 23), while ranges of approx. 0.08–0.12 and 0.12–0.17 were investigated, respectively, for intake and exhaust port height-to-stroke ratios in the work by Ma et al. [33] (p. 9, Table 3). Note that exhaust port heights are generally larger than those of the intake since increasing the former has the greater effect in improving the scavenging process [34], hence the different ranges stated.
In any case, coarse preliminary simulations (not reported here) were performed by the current authors to establish approximate ranges of crankshaft phase angle and intake and exhaust port height-to-stroke ratios in which the optimal values should lay, and upon which the ranges specified in Table 5 are based. These broadly align with, but extend further than, those covered in the aforementioned literature examples. Additionally, while the automotive industry might be expecting the impending Euro 7 regulations [44] to require stochiometric operation across the entire engine operating map (an outcome is expected in Q4 2021 [45]), a range of air-to-fuel equivalence ratios will be simulated in some cases to reveal whether there are efficiency gains to be had if lean operation can be accommodated.

3. Results and Discussion

Simulation results are now reported and reviewed separately by application, i.e., medium-duty truck or range extender, as listed in Table 4.

3.1. Medium-Duty Application

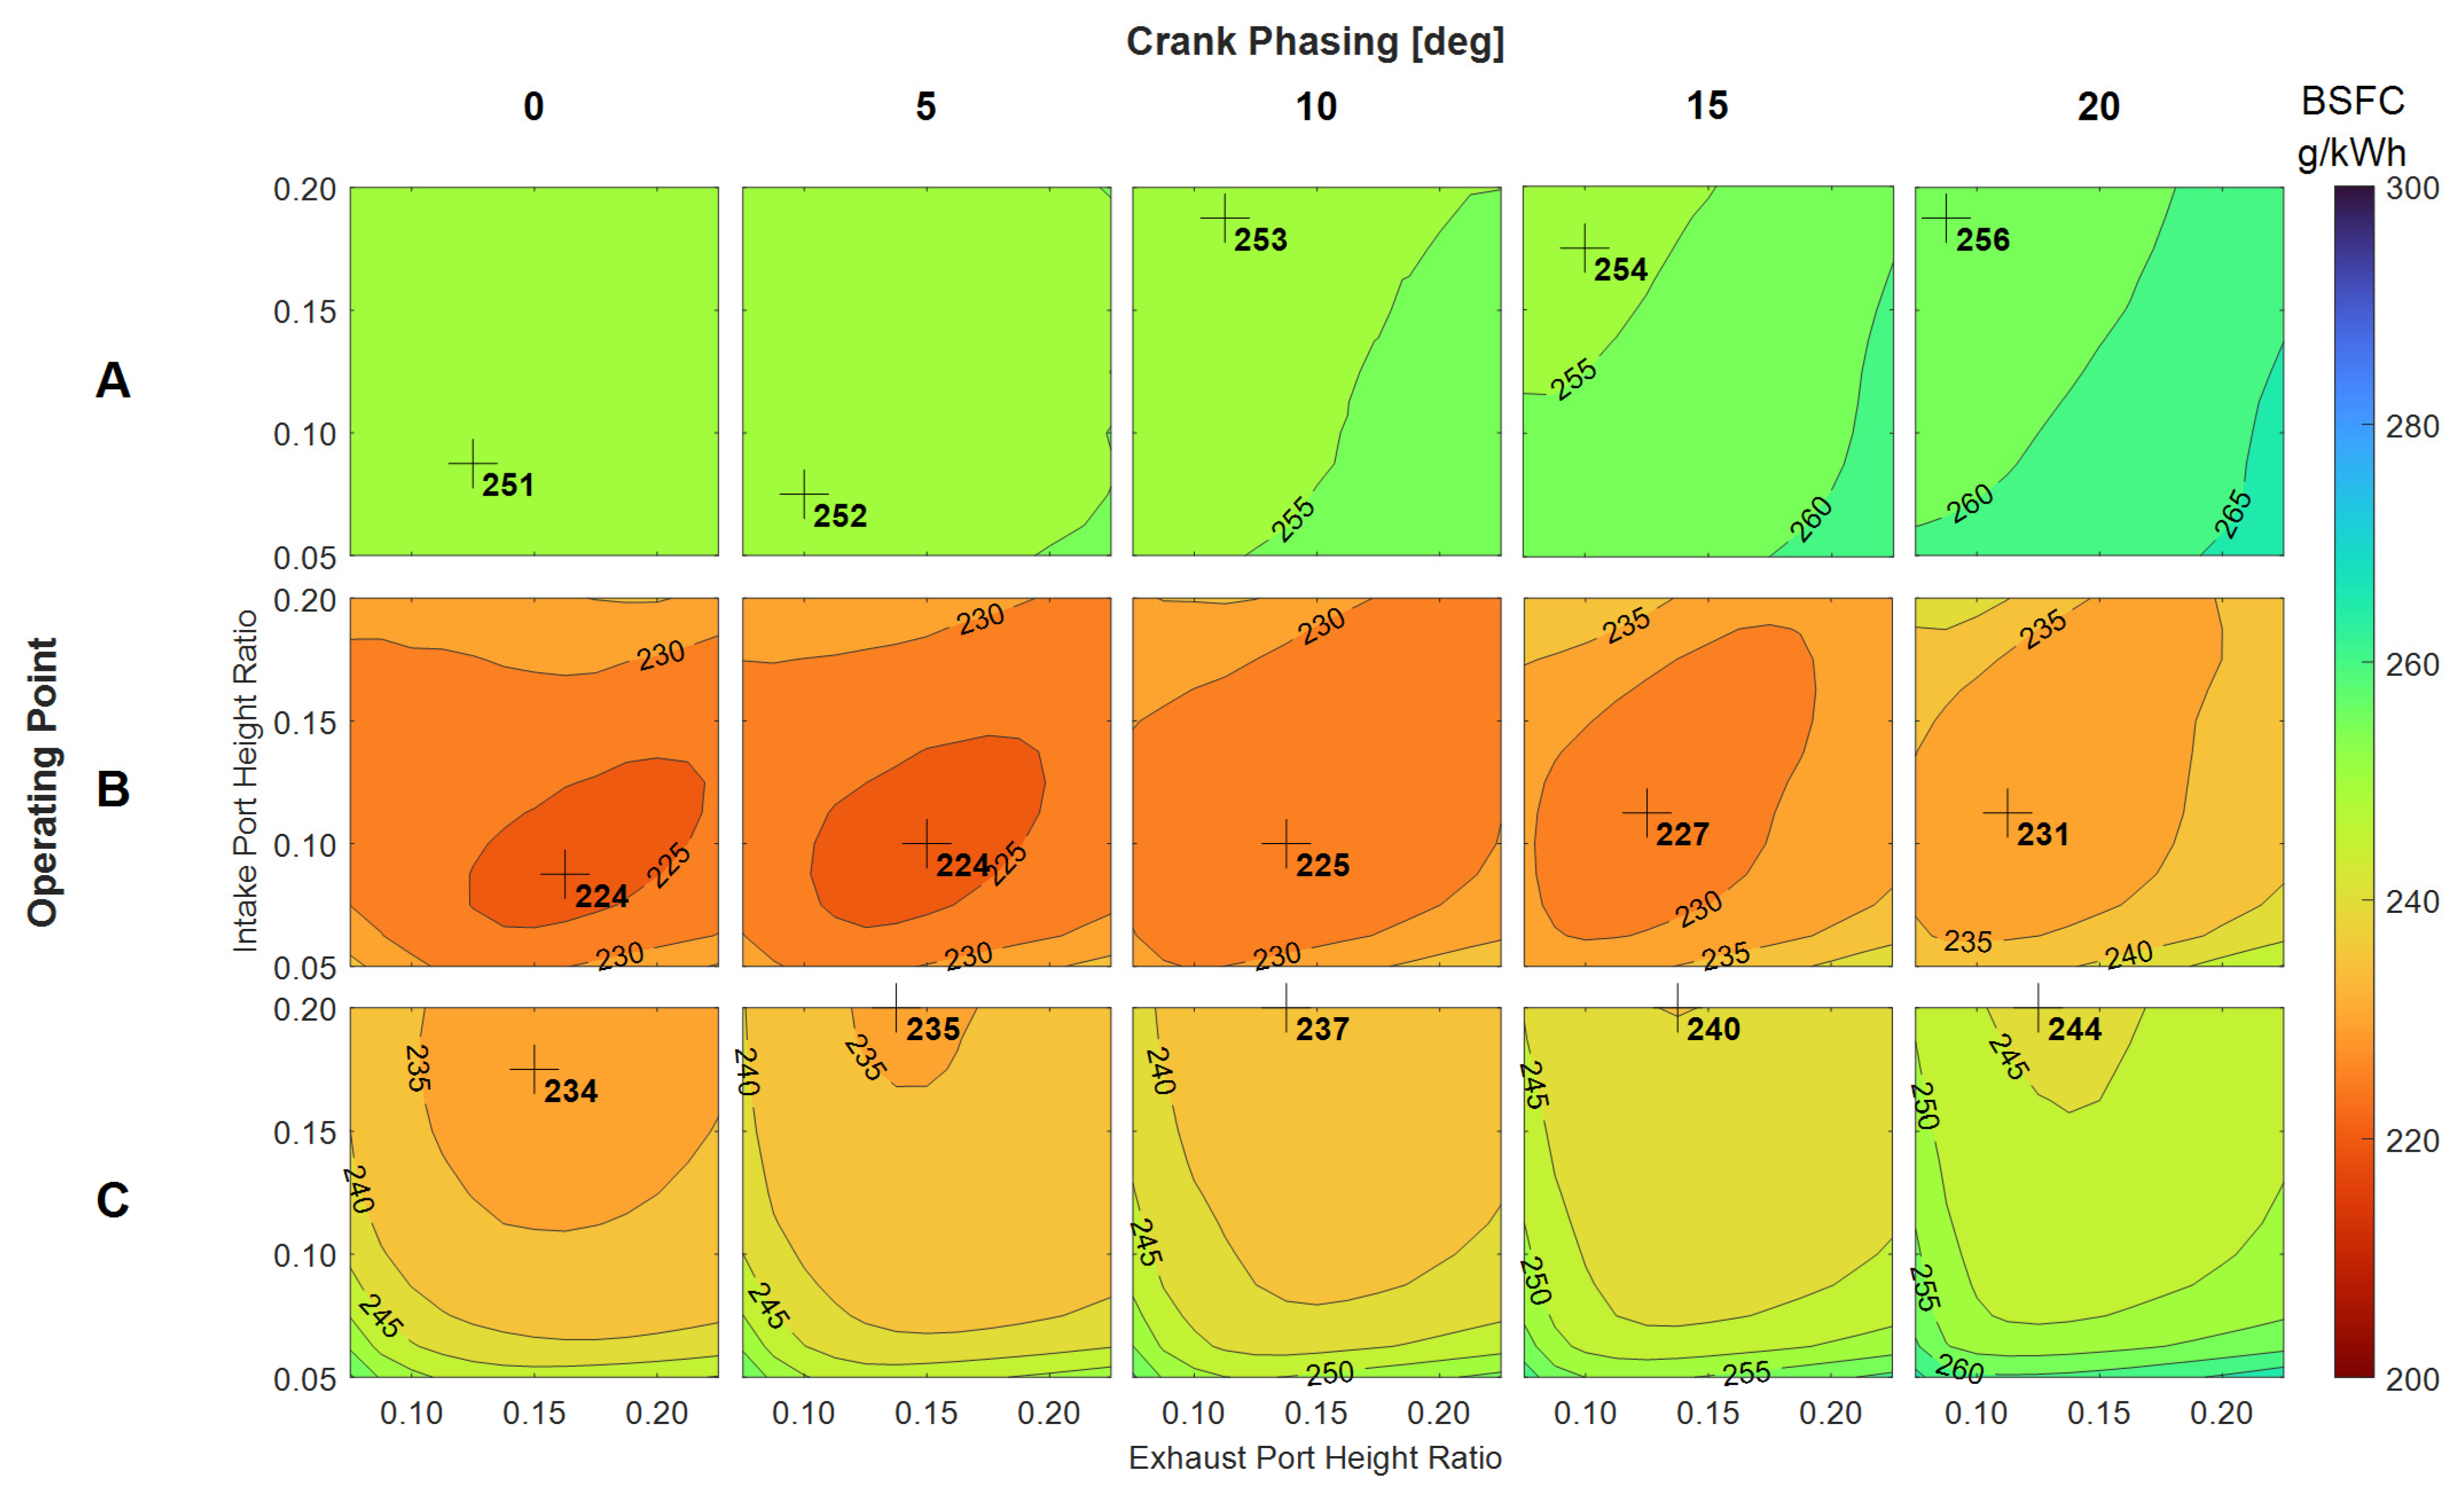
3.1.1. Effect of Crankshaft Phasing and Port Height on BSFC for Stoichiometric Operation

Figure 10 shows the contours of BSFC as a function of crankshaft phasing and intake and exhaust port height-to-stroke ratio at operating points A, B, and C. Simulations in this section were constrained to operate at the stoichiometric air-to-fuel equivalence ratio (λ = 1), with the target BMEP value achieved by adjusting intake pressure. Within each contour, the most efficient point is marked by crosshairs and labelled with the corresponding BSFC value in g/kWh. At this point, it is worth noting that the BSFC contour plots presented in this work all use the same legend colour bar and contour intervals (i.e., ranging 200–300 g/kWh and gradations of 5 g/kWh) to enable ease of comparison throughout.
It can be immediately seen from Figure 10 that operating point B (1500 min−1, 12-bar BMEP) is the most efficient of the three, indicating a best BSFC of 224 g/kWh at 0° and 5° of crankshaft phase angle. This range of phase angle is somewhat lower than quoted elsewhere in the literature, e.g., 10–15° [35]. Operating point C (3000 min−1, 10 bar BMEP) shows a 10–15 g/kWh increase in BSFC compared to point B. Operating point A (1500 min−1, 3 bar BMEP) is the least efficient of the three with a BSFC increase of 20–25 g/kWh compared to point B. All three operating points show BSFC increasing with crankshaft phasing (at least over the 0–20° range evaluated); this effect is quite minor at operating point A, and strongest at operating point C. Operating point A is seen to be the least sensitive to changes in intake and exhaust port height-to-stroke ratios, emphasized by the flat contour at 0° crankshaft phase angle. The best efficiency points for A are all at lower exhaust port height-to-stroke ratios, whereas the same is only true for intake port height-to-stroke ratios at low values of crankshaft phase angle. At higher crankshaft phasing, best efficiency is found at higher intake port height-to-stroke ratios.
Operating point B efficiencies at 0° and 5° crankshaft phase angles are similar, demonstrating an insensitivity to crankshaft phasing in this range. However, as the level of crankshaft phasing increases, the BSFC contours start to flatten and increase in value. While the best efficiency points at B are all relatively central within the range of intake and exhaust port height-to-stroke ratios explored, they tend to move to slightly higher intake port height-to-stroke ratios and slightly lower exhaust port height-to-stroke ratios as crankshaft phasing increases. The BSFC contours of operating point C maintain a roughly constant shape with increased crankshaft phasing, although the average BSFC value increases. Here, crankshaft phasing has little impact on the location of best efficiency, with all points (with the small exception of the 0° crankshaft phase angle case) lying on the upper bound of the intake port height-to-stroke ratio. No correlation between crankshaft phasing and optimal intake port height-to-stroke ratio could therefore be determined from these data; however, one could extrapolate the trend of an increased intake port height-to-stroke ratio yielding the best efficiency when crankshaft phasing is increased, as demonstrated from the 0° and 5° crankshaft phase angles. On the other hand, the best efficiencies are generally to be found at decreasing port height-to-stroke ratios as crankshaft phasing is increased.

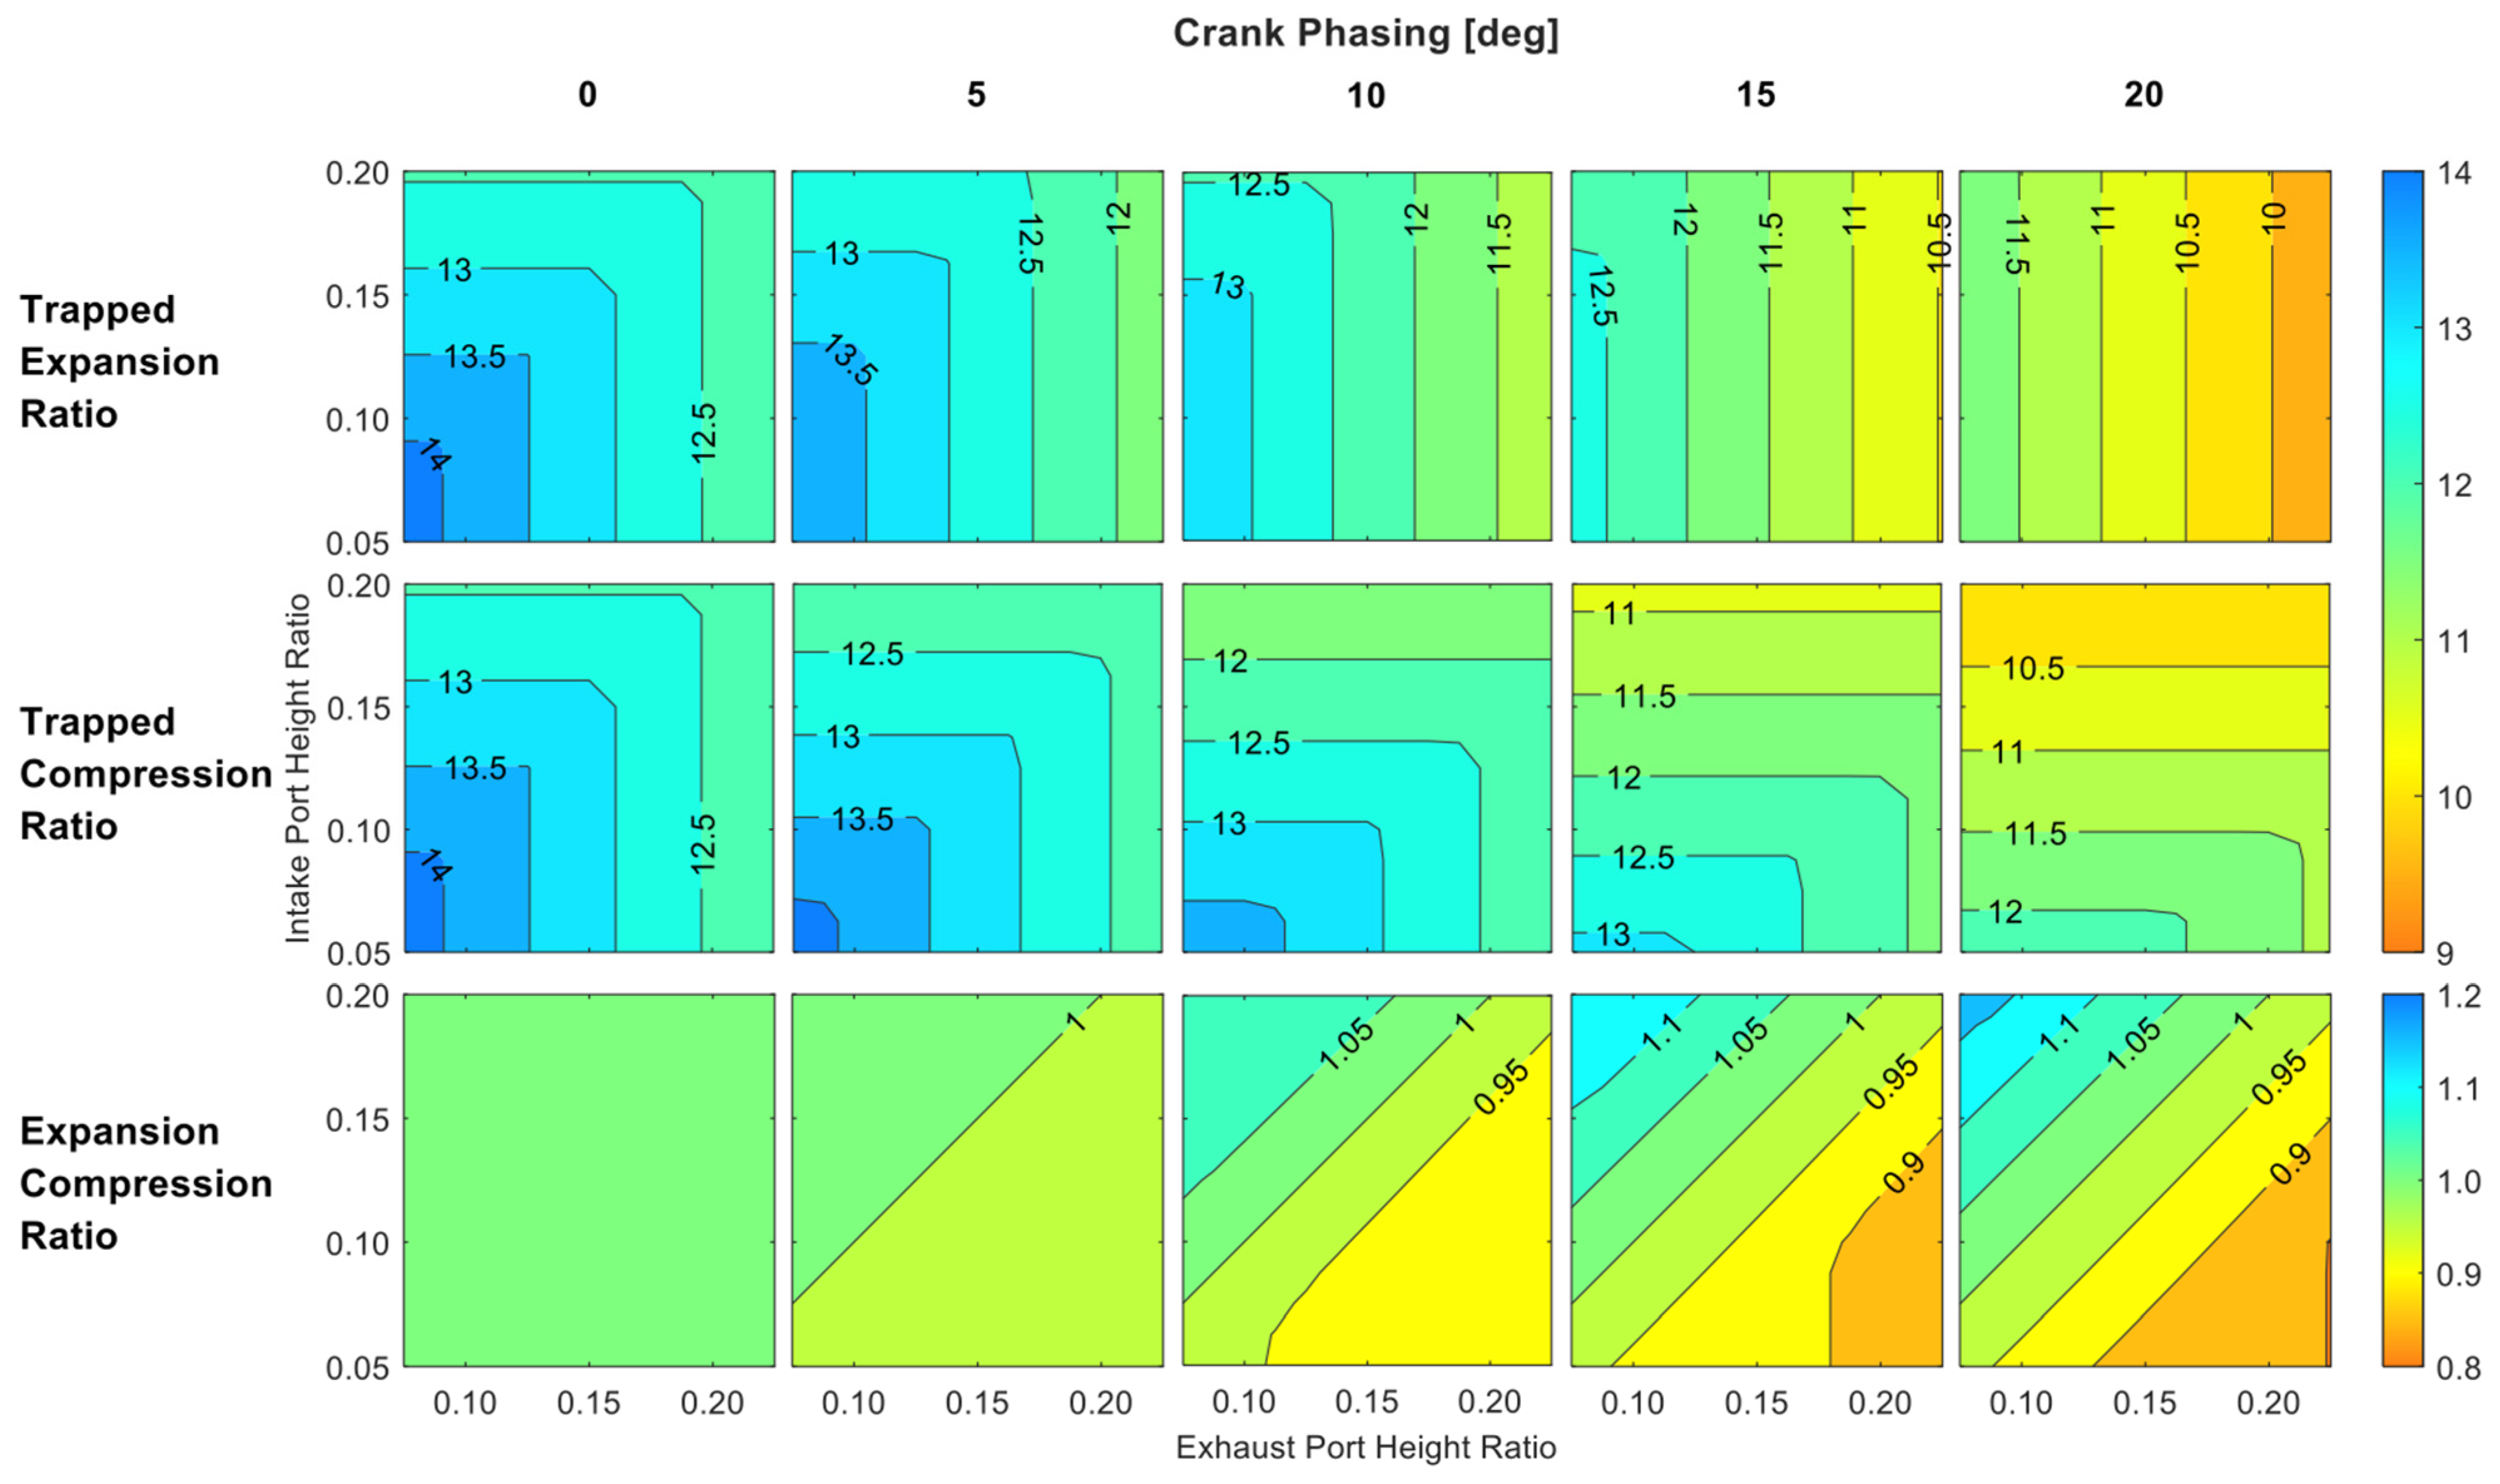
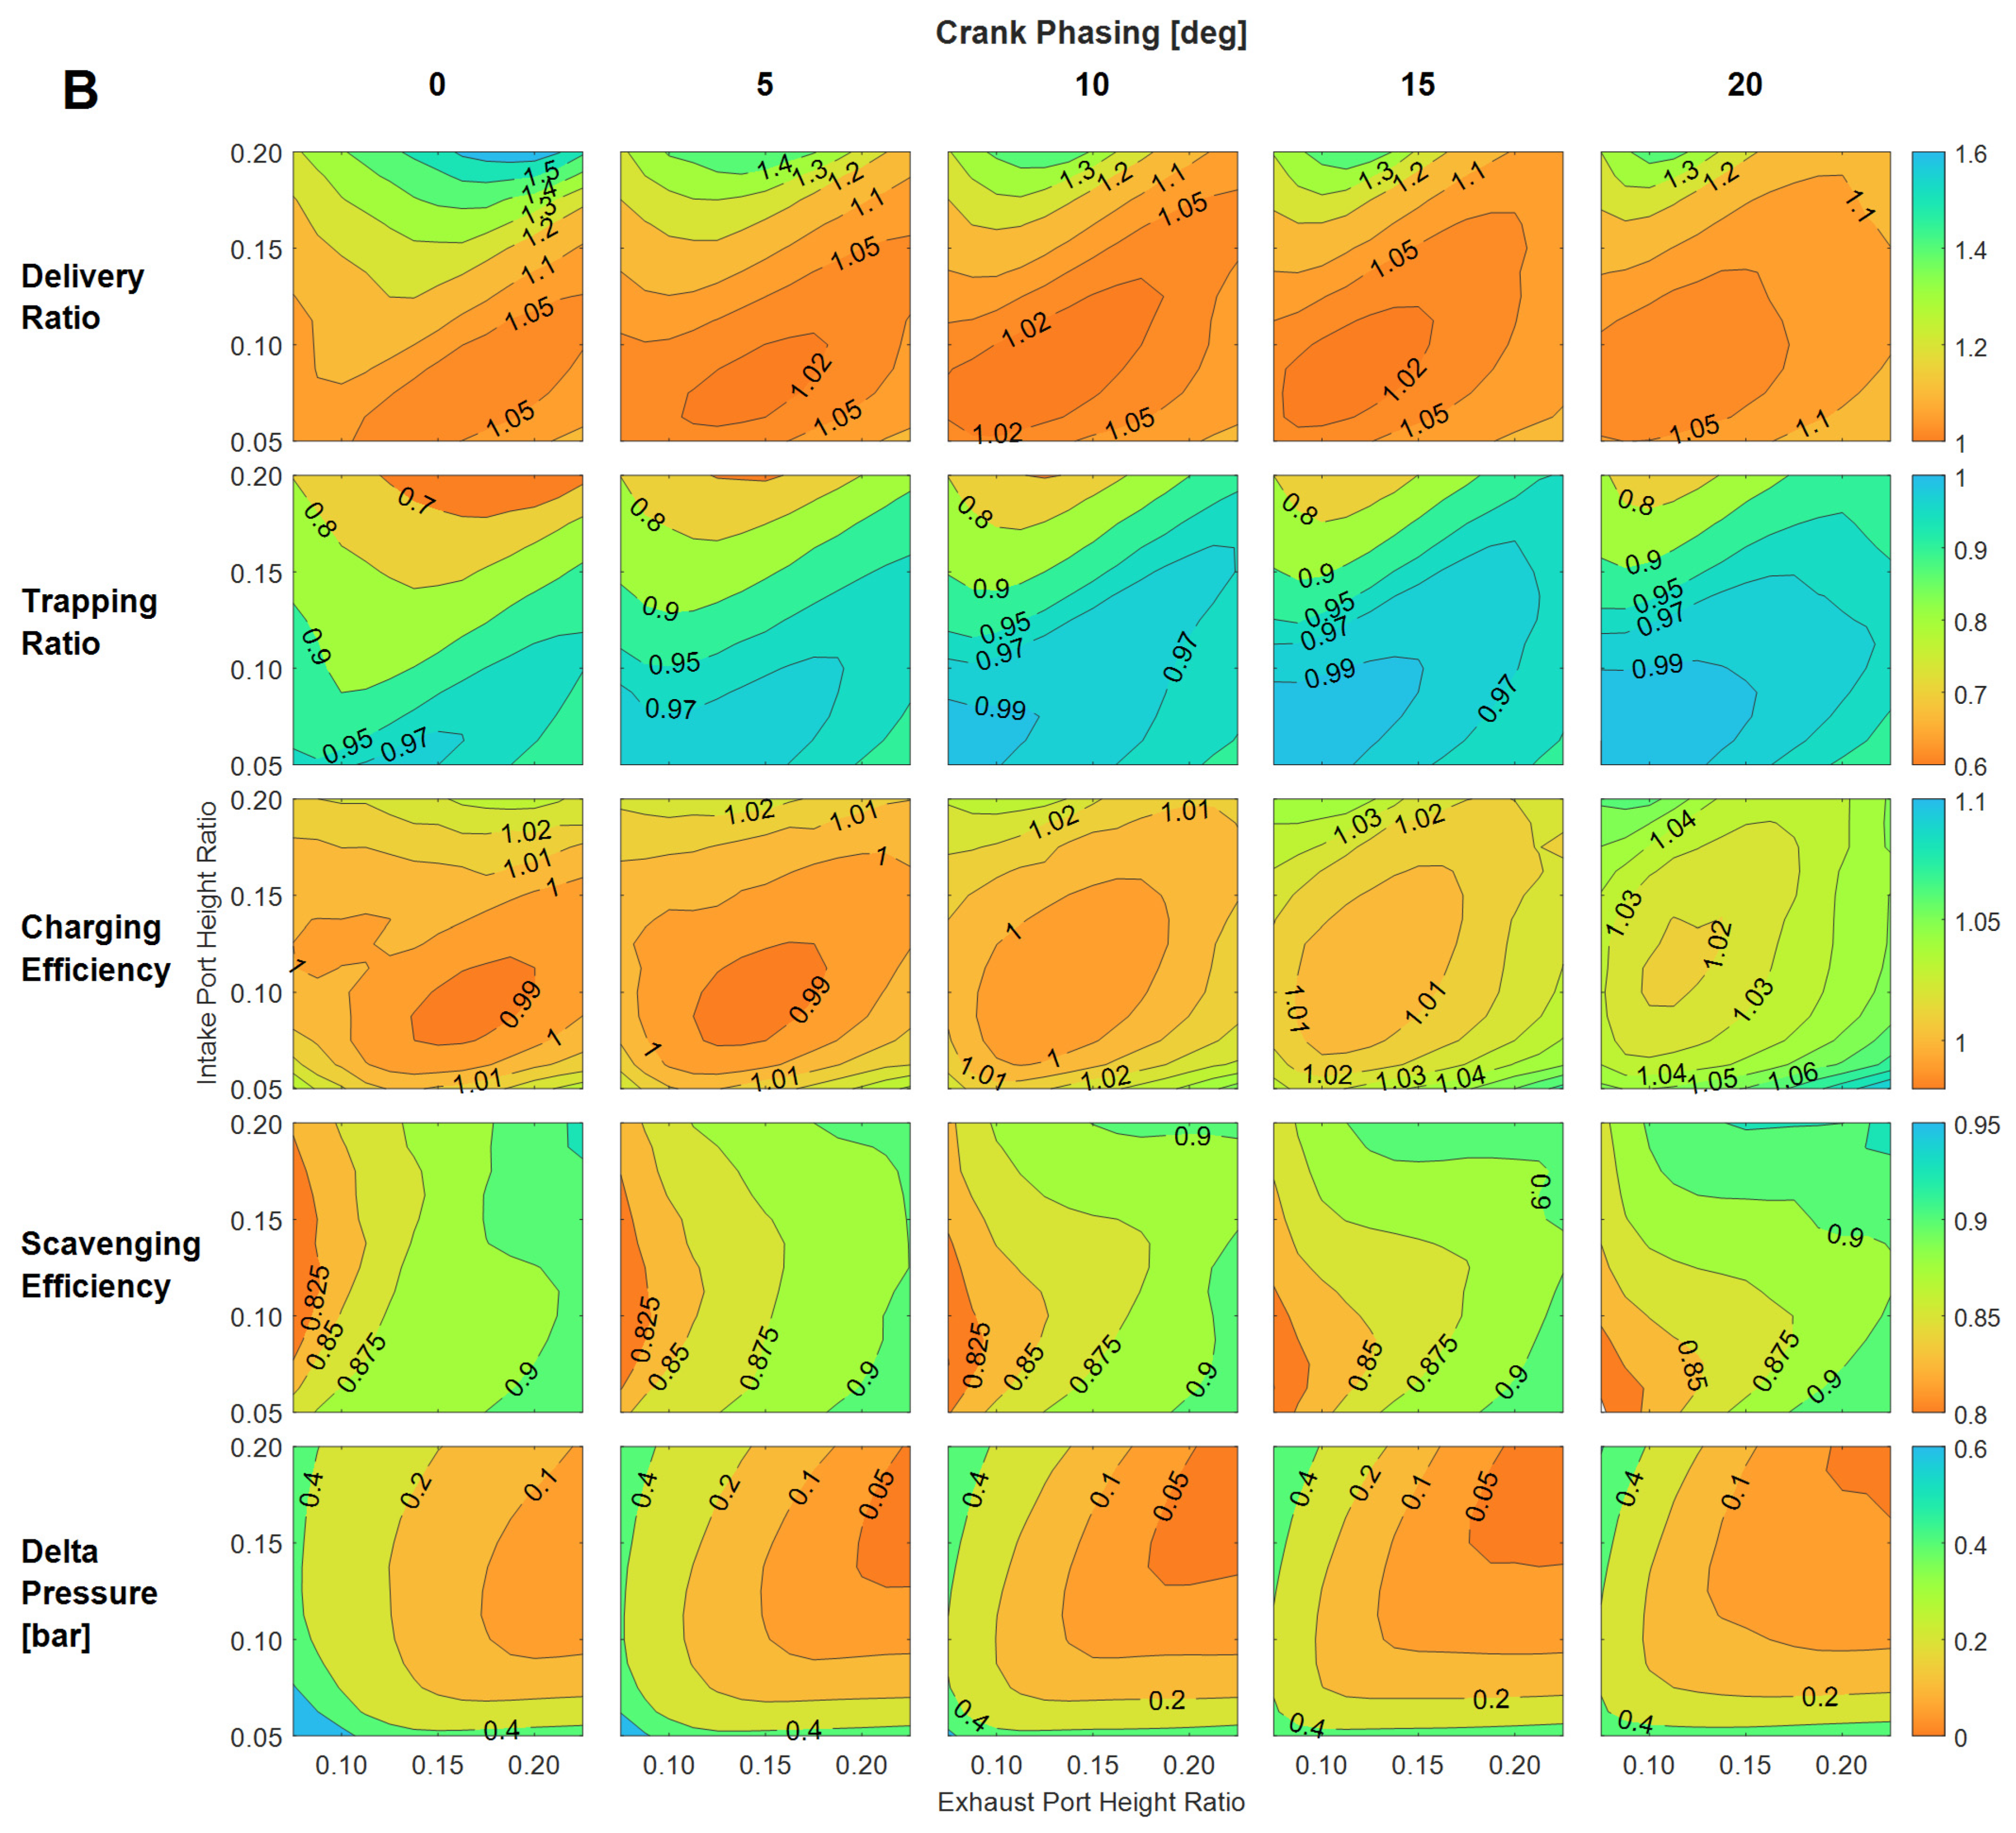
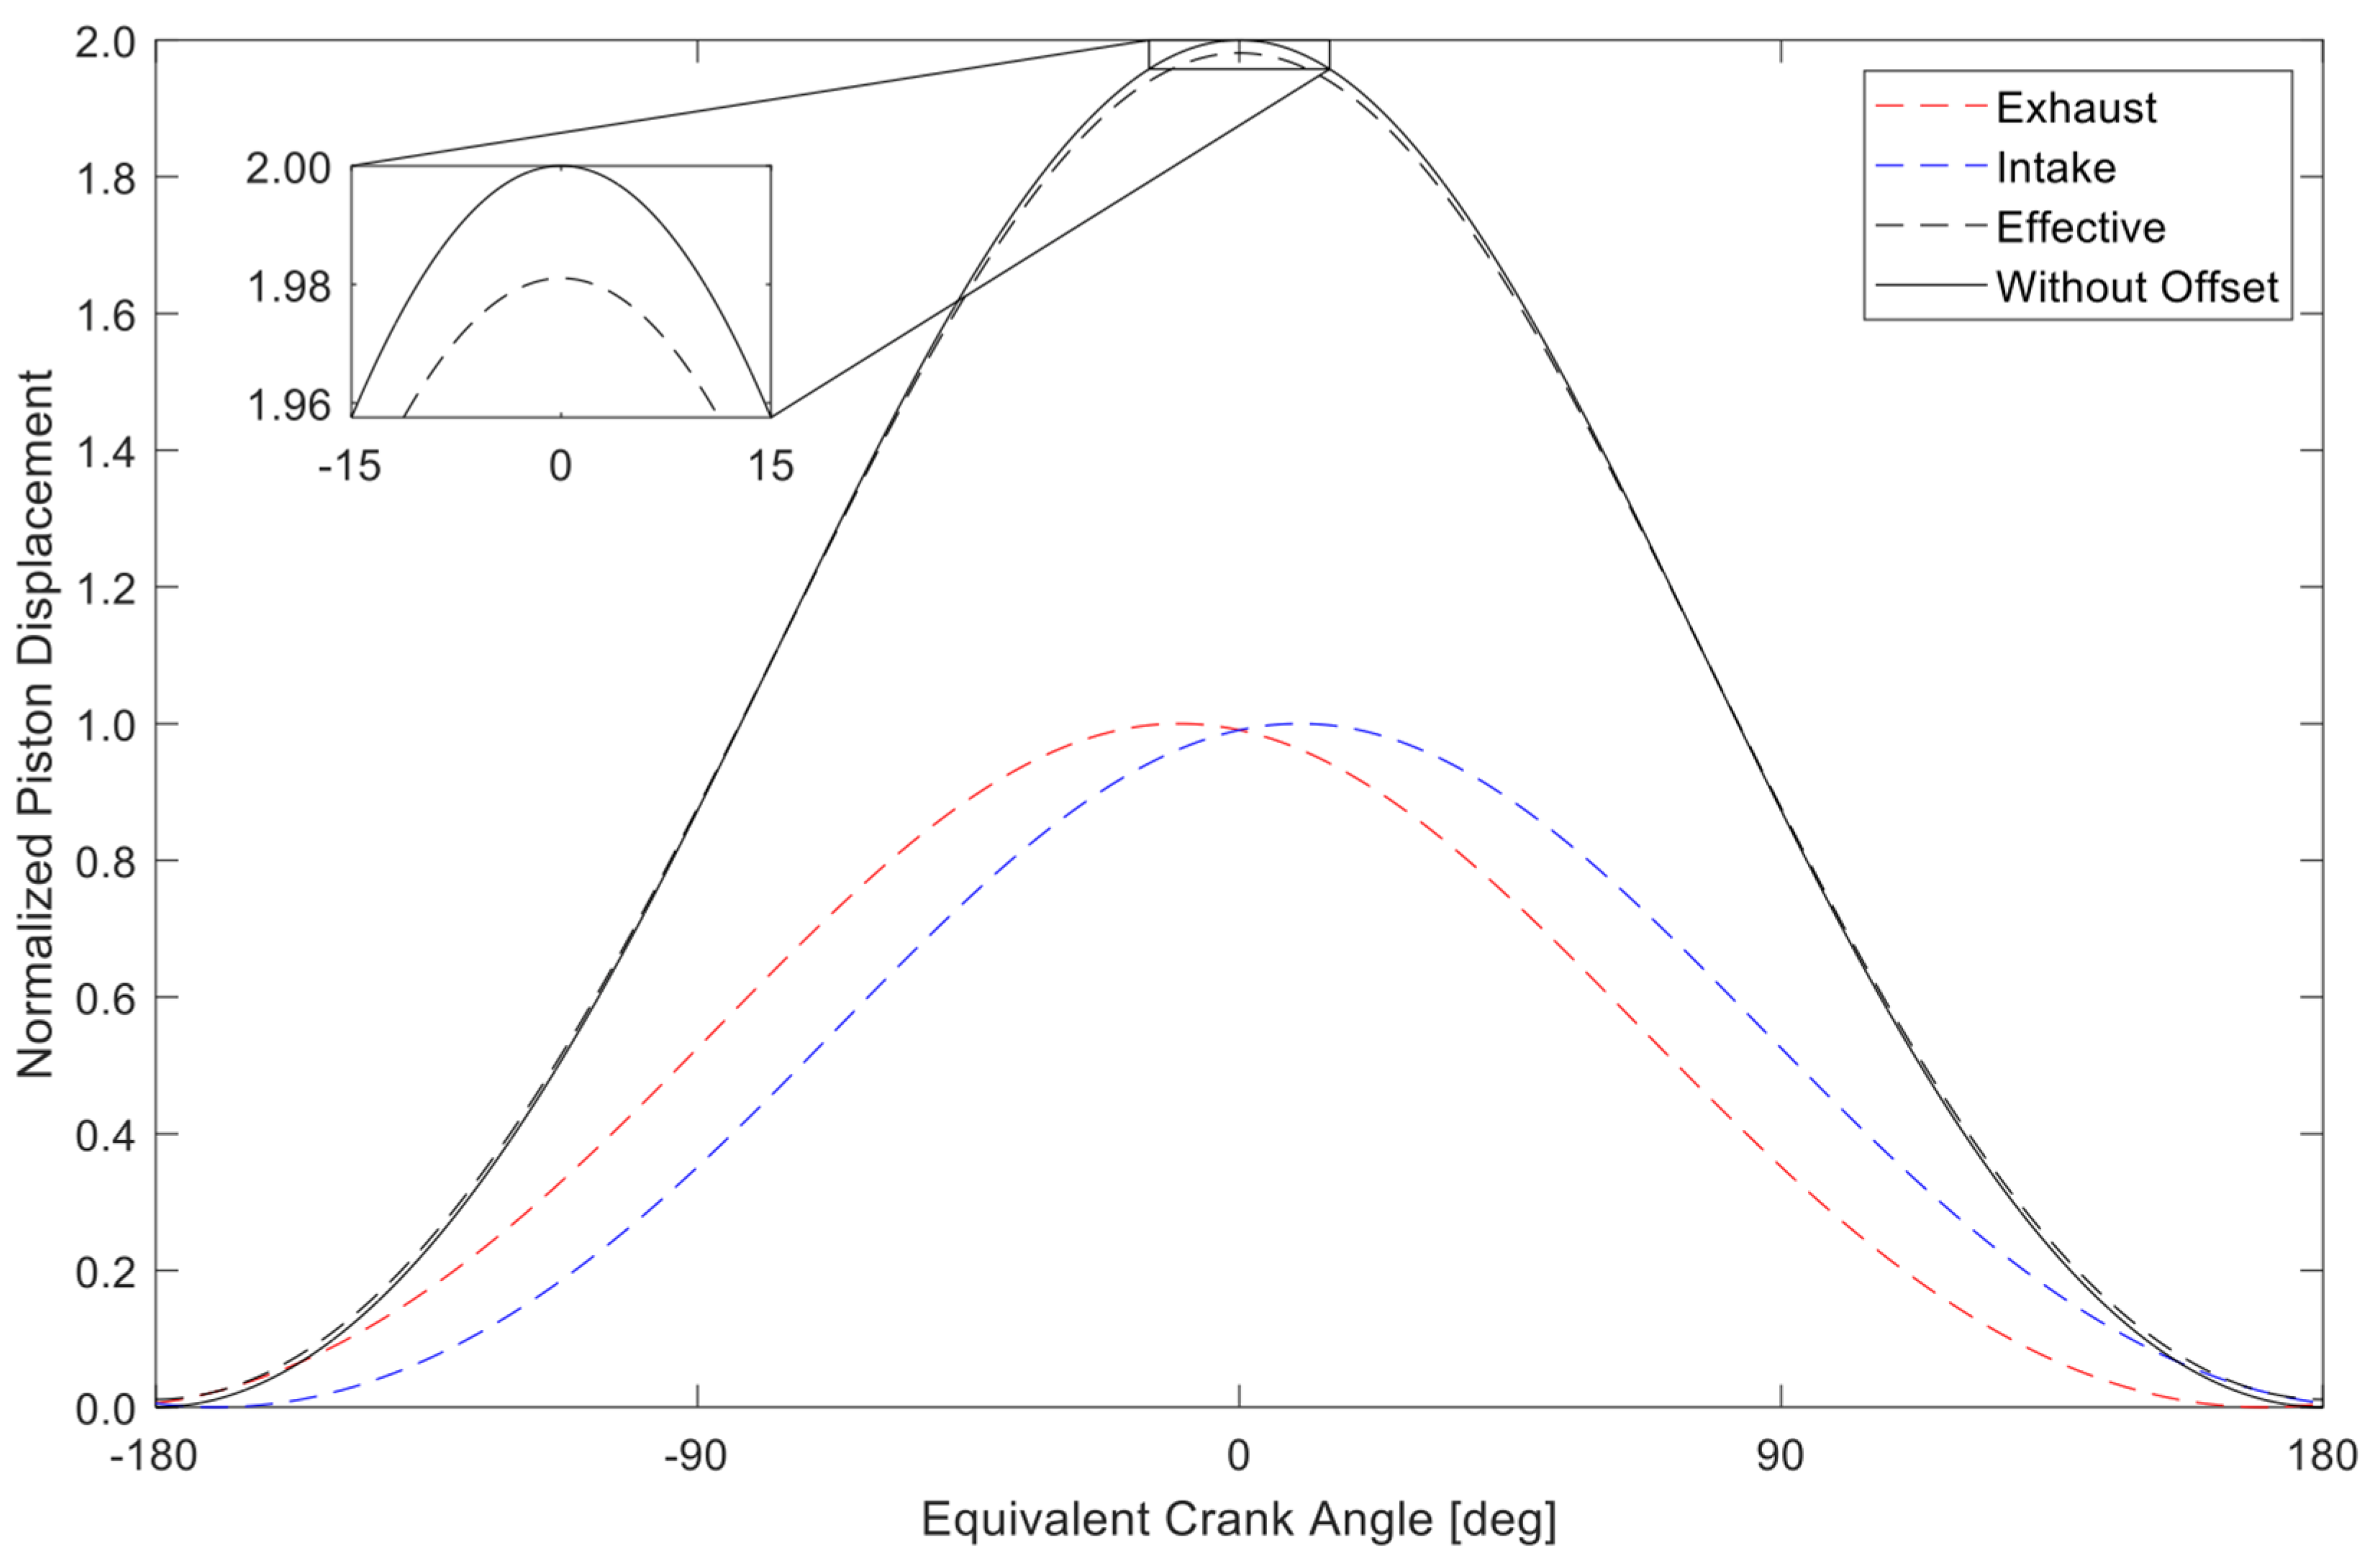
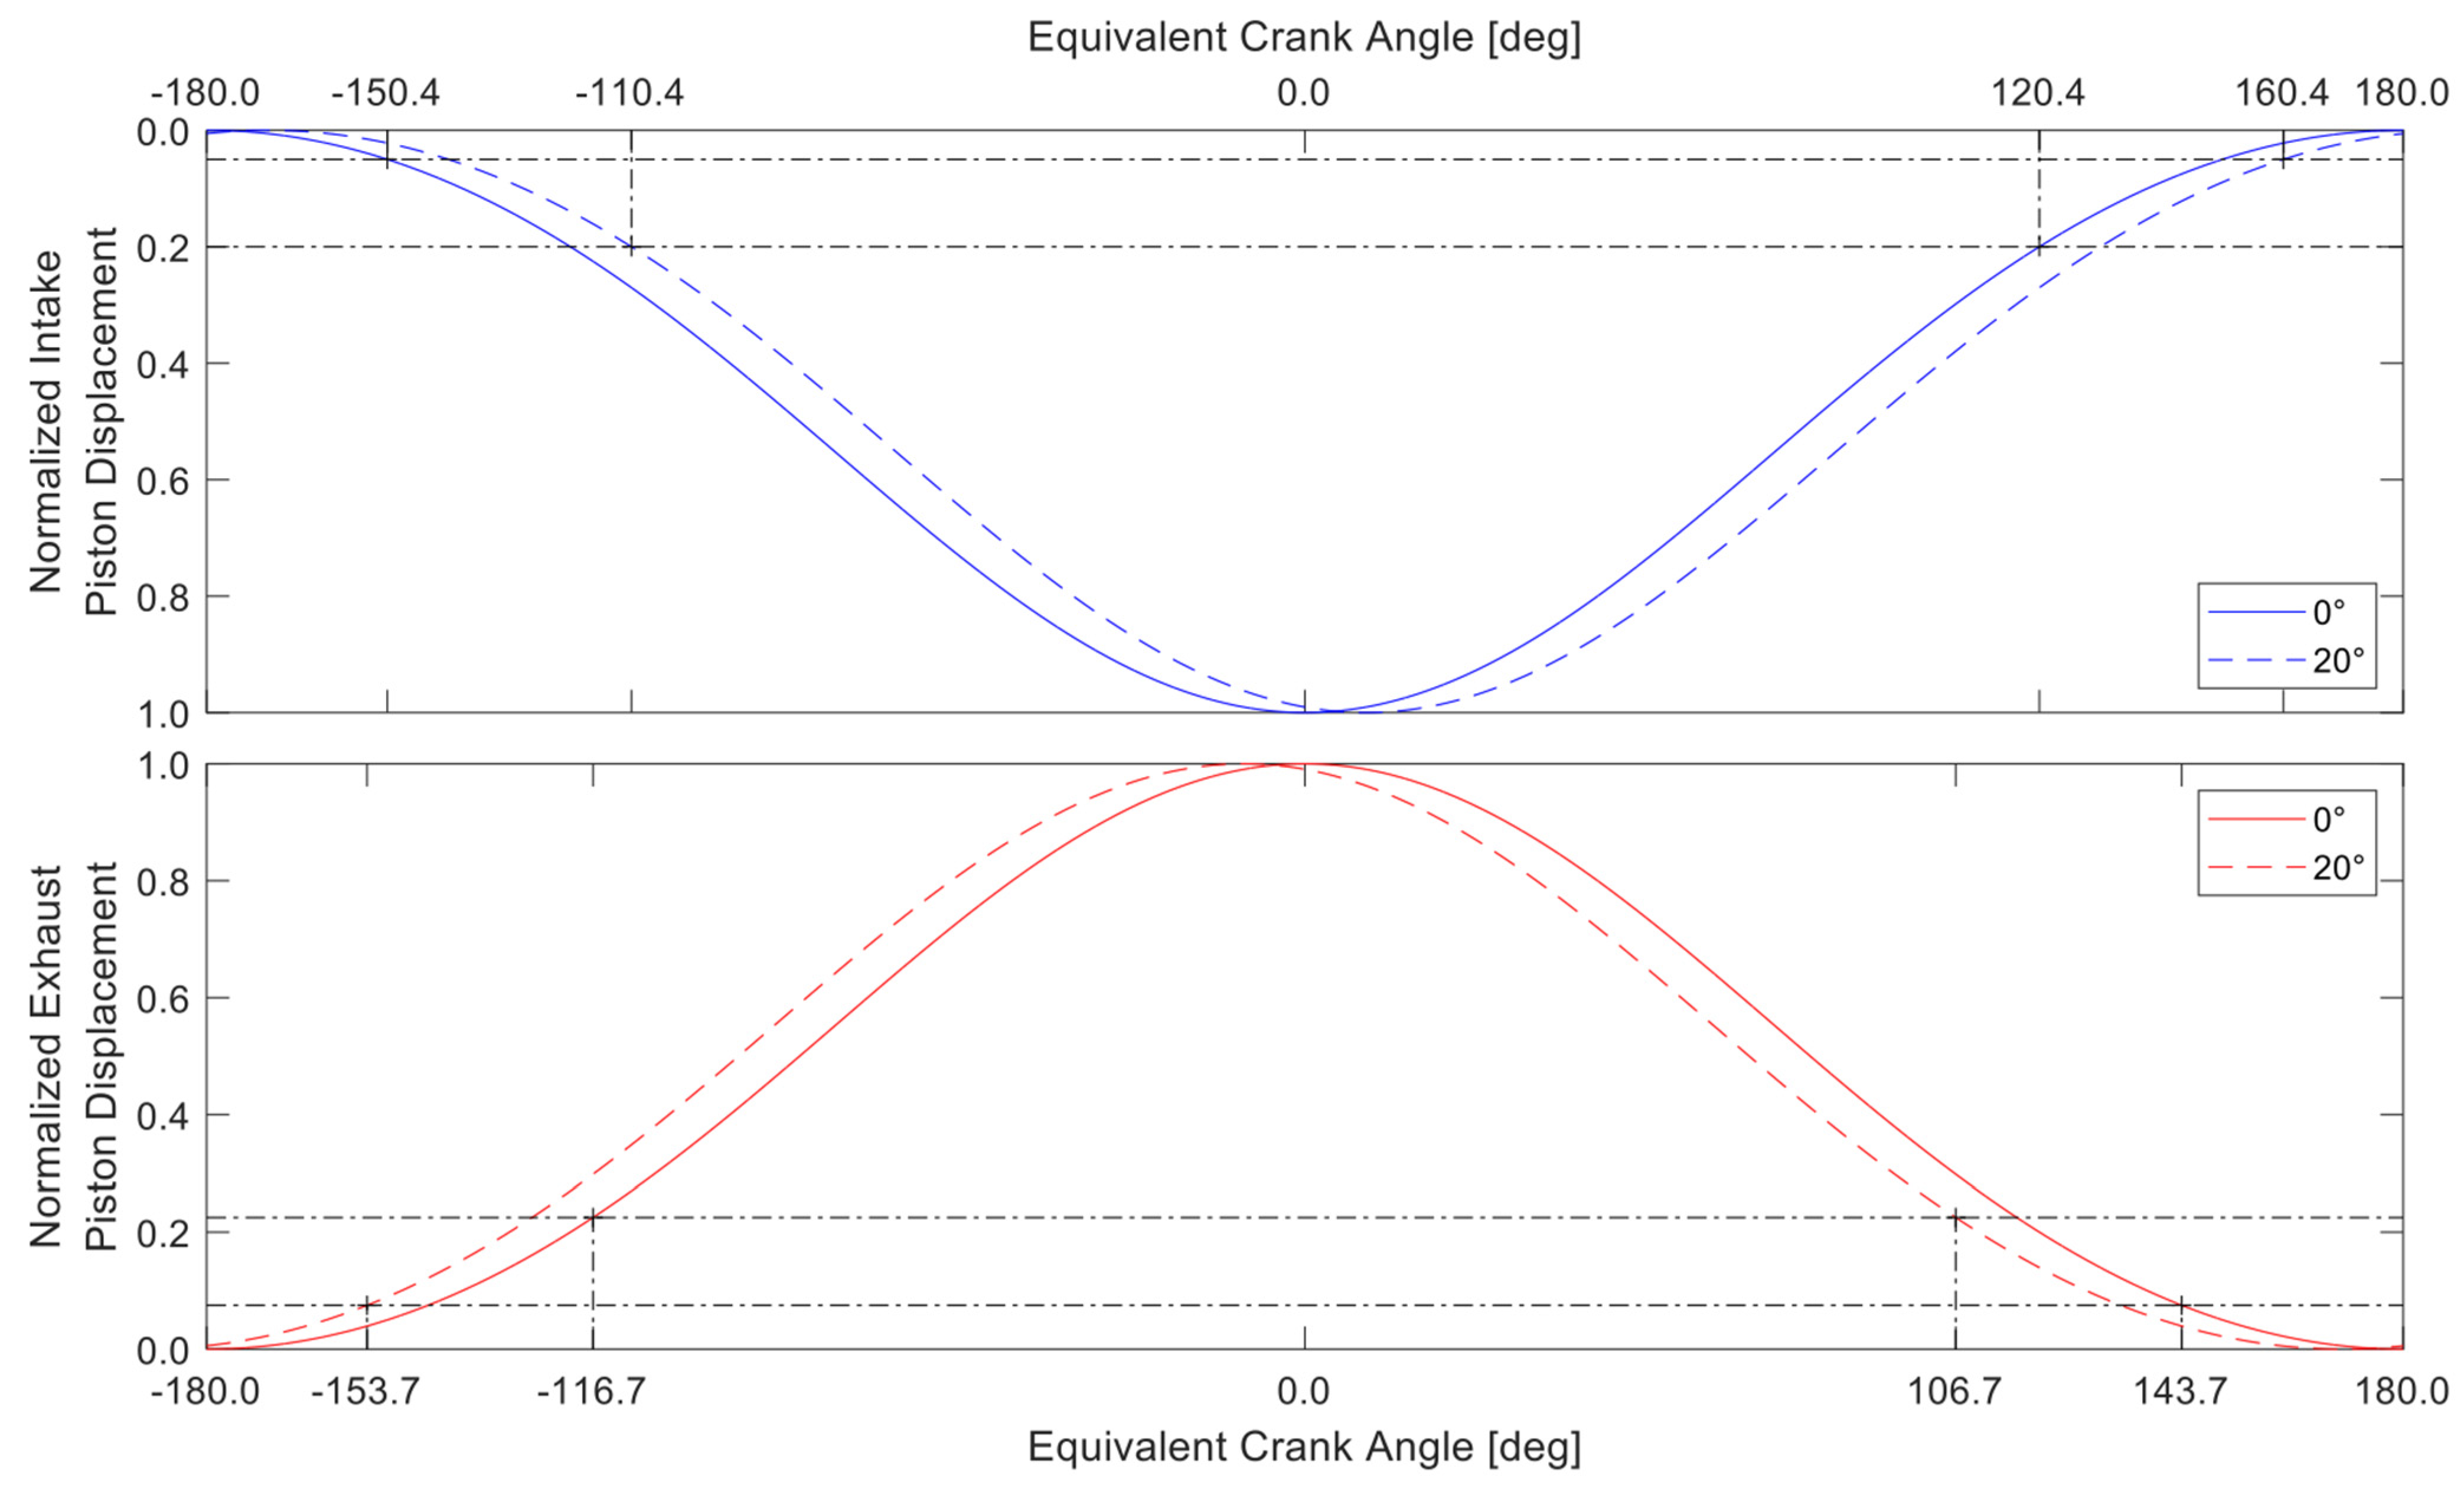
3.1.2. Examining the Effect of Crankshaft Phasing and Port Height on Gas Exchange

Figure 11 examines the effect of crankshaft phasing and intake and exhaust port height-to-stroke ratios on several gas exchange metrics, again limited to operating point B under stoichiometric conditions (which is viable since trapping ratio is close to unity over large regions of the contours), to explain the causes of the BSFC variation so far described. Figure 10 shows that the best BSFC of 224 g/kWh occurs somewhere between 0 and 5° crankshaft phase angles, and at intake and exhaust port height-to-stroke ratios of approximately 0.1 and 0.15, respectively. In Figure 11, this aligns with the lowest regions of delivery ratio (1.02) and charging efficiency (0.99). As the intake pressure is being varied to target the required BMEP, a lower value of charging efficiency represents better efficiency as the engine can produce the desired BMEP with the least amount of fresh charge. The increasing trend in charging efficiency with increased crankshaft phasing represents the decreasing thermal efficiency due to the decreased compression ratio. The increasing trend in trapping ratio with increased crankshaft phasing is one of the main factors of the improved scavenging caused by asymmetric timing. It is these two opposing phenomena that cause the optimum crankshaft phasing to vary depending on operating conditions.

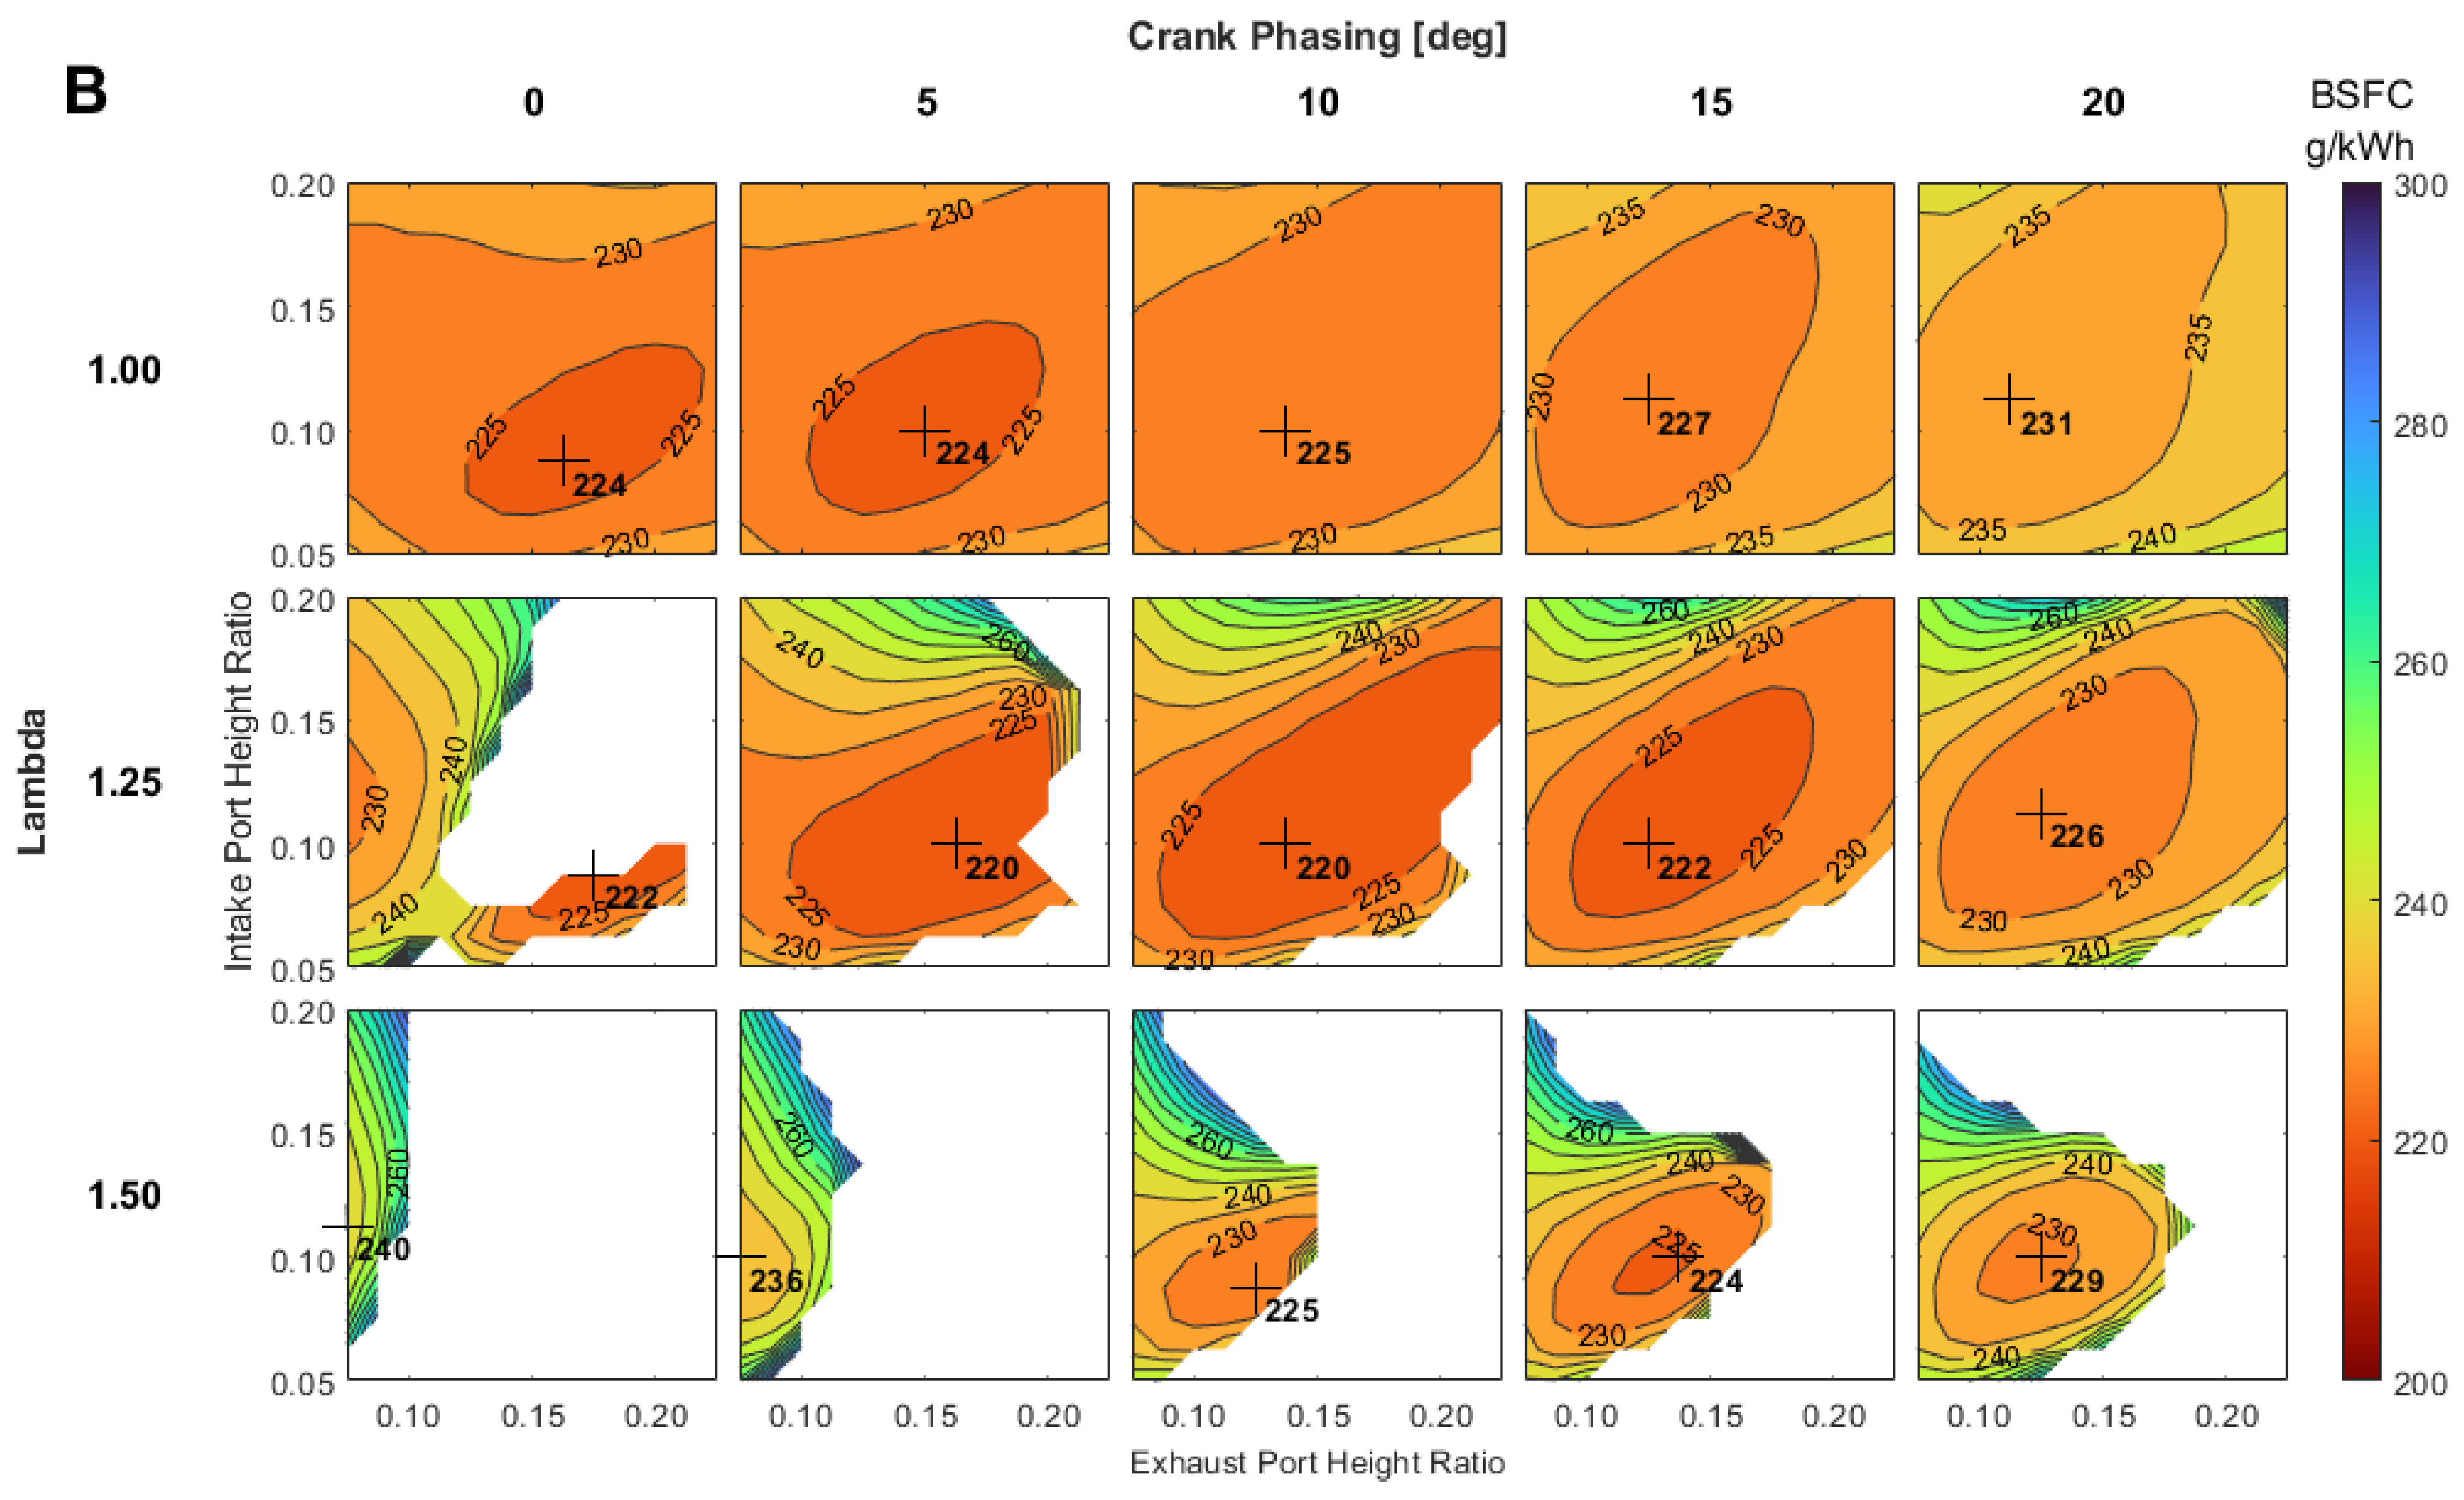
3.1.3. Effect of Crankshaft Phasing and Port Height on BSFC under Lean Conditions

To reiterate, the overall aim of this study is to identify the port geometry and operational specifications that enable best thermal efficiency in an OP2S engine. While the previous section explored the overall impact of crankshaft phasing and port heights on BSFC for the medium-duty operating points A, B, and C, it was restricted to stoichiometric operation. Since it may be the case that absolute best efficiency is to be found away from stoichiometric conditions, this section explores the impact of varying the air-to-fuel equivalence ratio, λ, on the optimal crankshaft phasing and port height ratios. To keep this article to a reasonable length, only the results for operating point B will be reported here.
Figure 12 shows the effects of varying λ in the range of 1–1.5, alongside crankshaft phasing, intake and exhaust port height-to-stroke ratios, for point B. The top row (λ = 1) is the same as the middle row from Figure 10 but is included here for ease of comparison. As λ increases, the contours show increasing areas of white space. These represent inoperable regions where the simulation could not converge due to poor scavenging, yielding insufficient fresh charge to achieve the target BMEP while respecting the corresponding λ setting. This narrows the potential operating region, especially at low levels of crankshaft phasing and high λ values. For instance, the bottom left contour plot in Figure 12 (0° crankshaft phasing, λ = 1.5) only converges at very low exhaust port height-to-stroke ratios. The size of converged regions within the contours at higher λ increase with crankshaft phasing, demonstrating the improved scavenging that occurs due to the asymmetrical port events.
The intake and exhaust port height-to-stroke values of the best efficiency points remain relatively constant with changes in crankshaft phasing and λ, suggesting that the optimal port heights (at point B) are independent of these parameters. However, the best efficiency point moves from 0–5° crankshaft phase angle to 5–10° when moving from stoichiometric to lean operation (λ = 1.25), with an accompanying 4 g/kWh (1.8%) reduction in BSFC. Increasing λ further to 1.5 causes the best efficiency point to shift to a 15° crankshaft phase angle, but with a BSFC value similar to the best shown under stoichiometric operation. So, for overall best efficiency (at operating point B), lean operation coupled with increased crankshaft phasing is recommended. More specifically, this requires a λ value of around 1.25 and 5–10° degrees of crankshaft phasing.

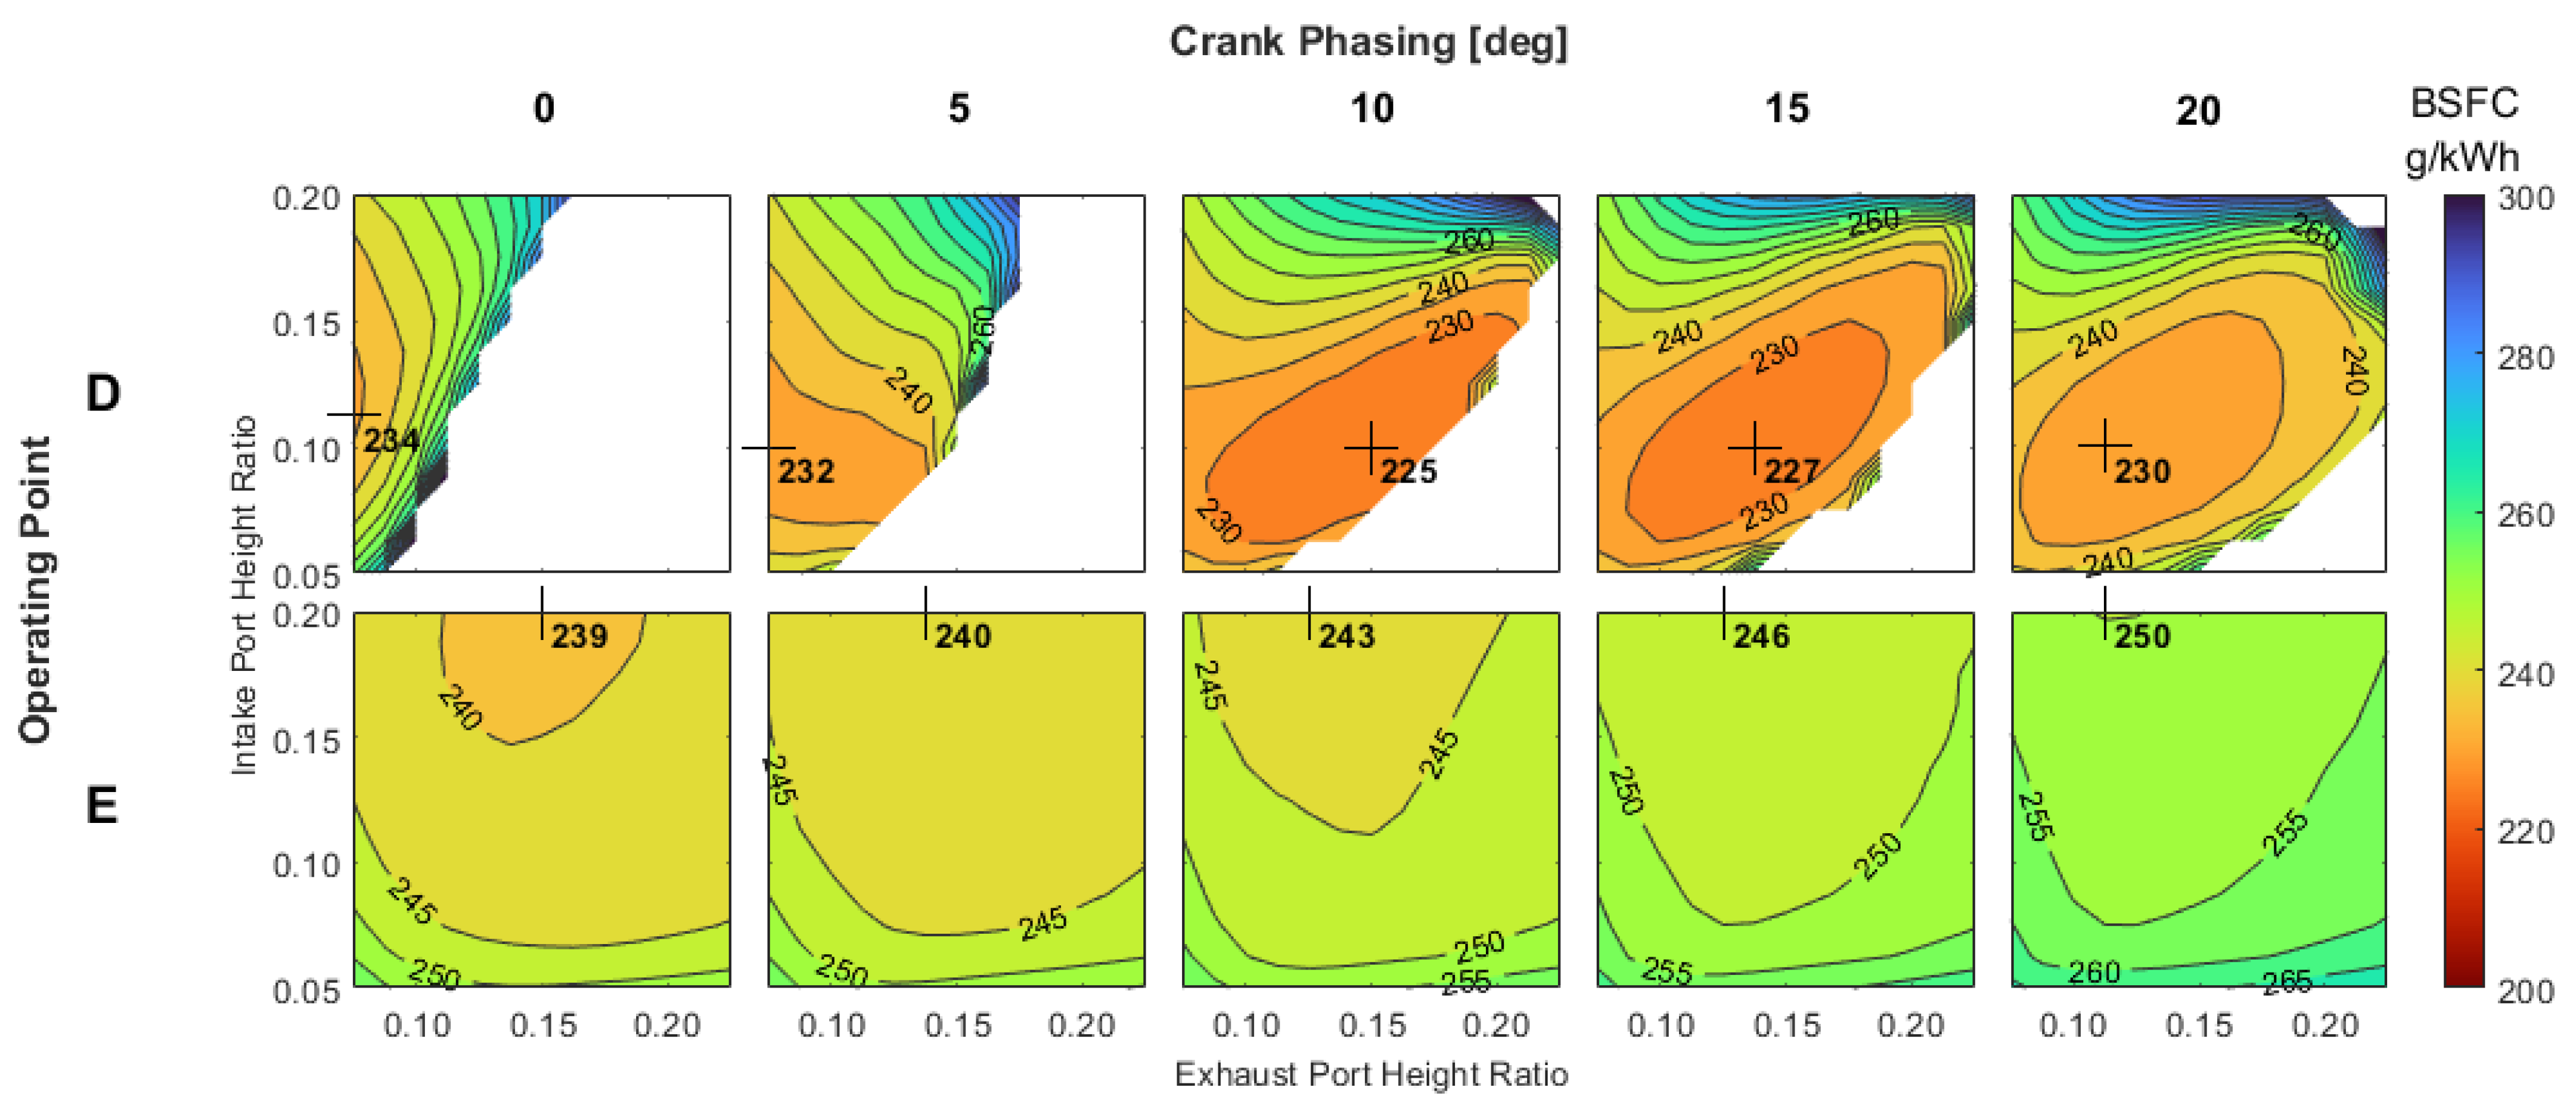
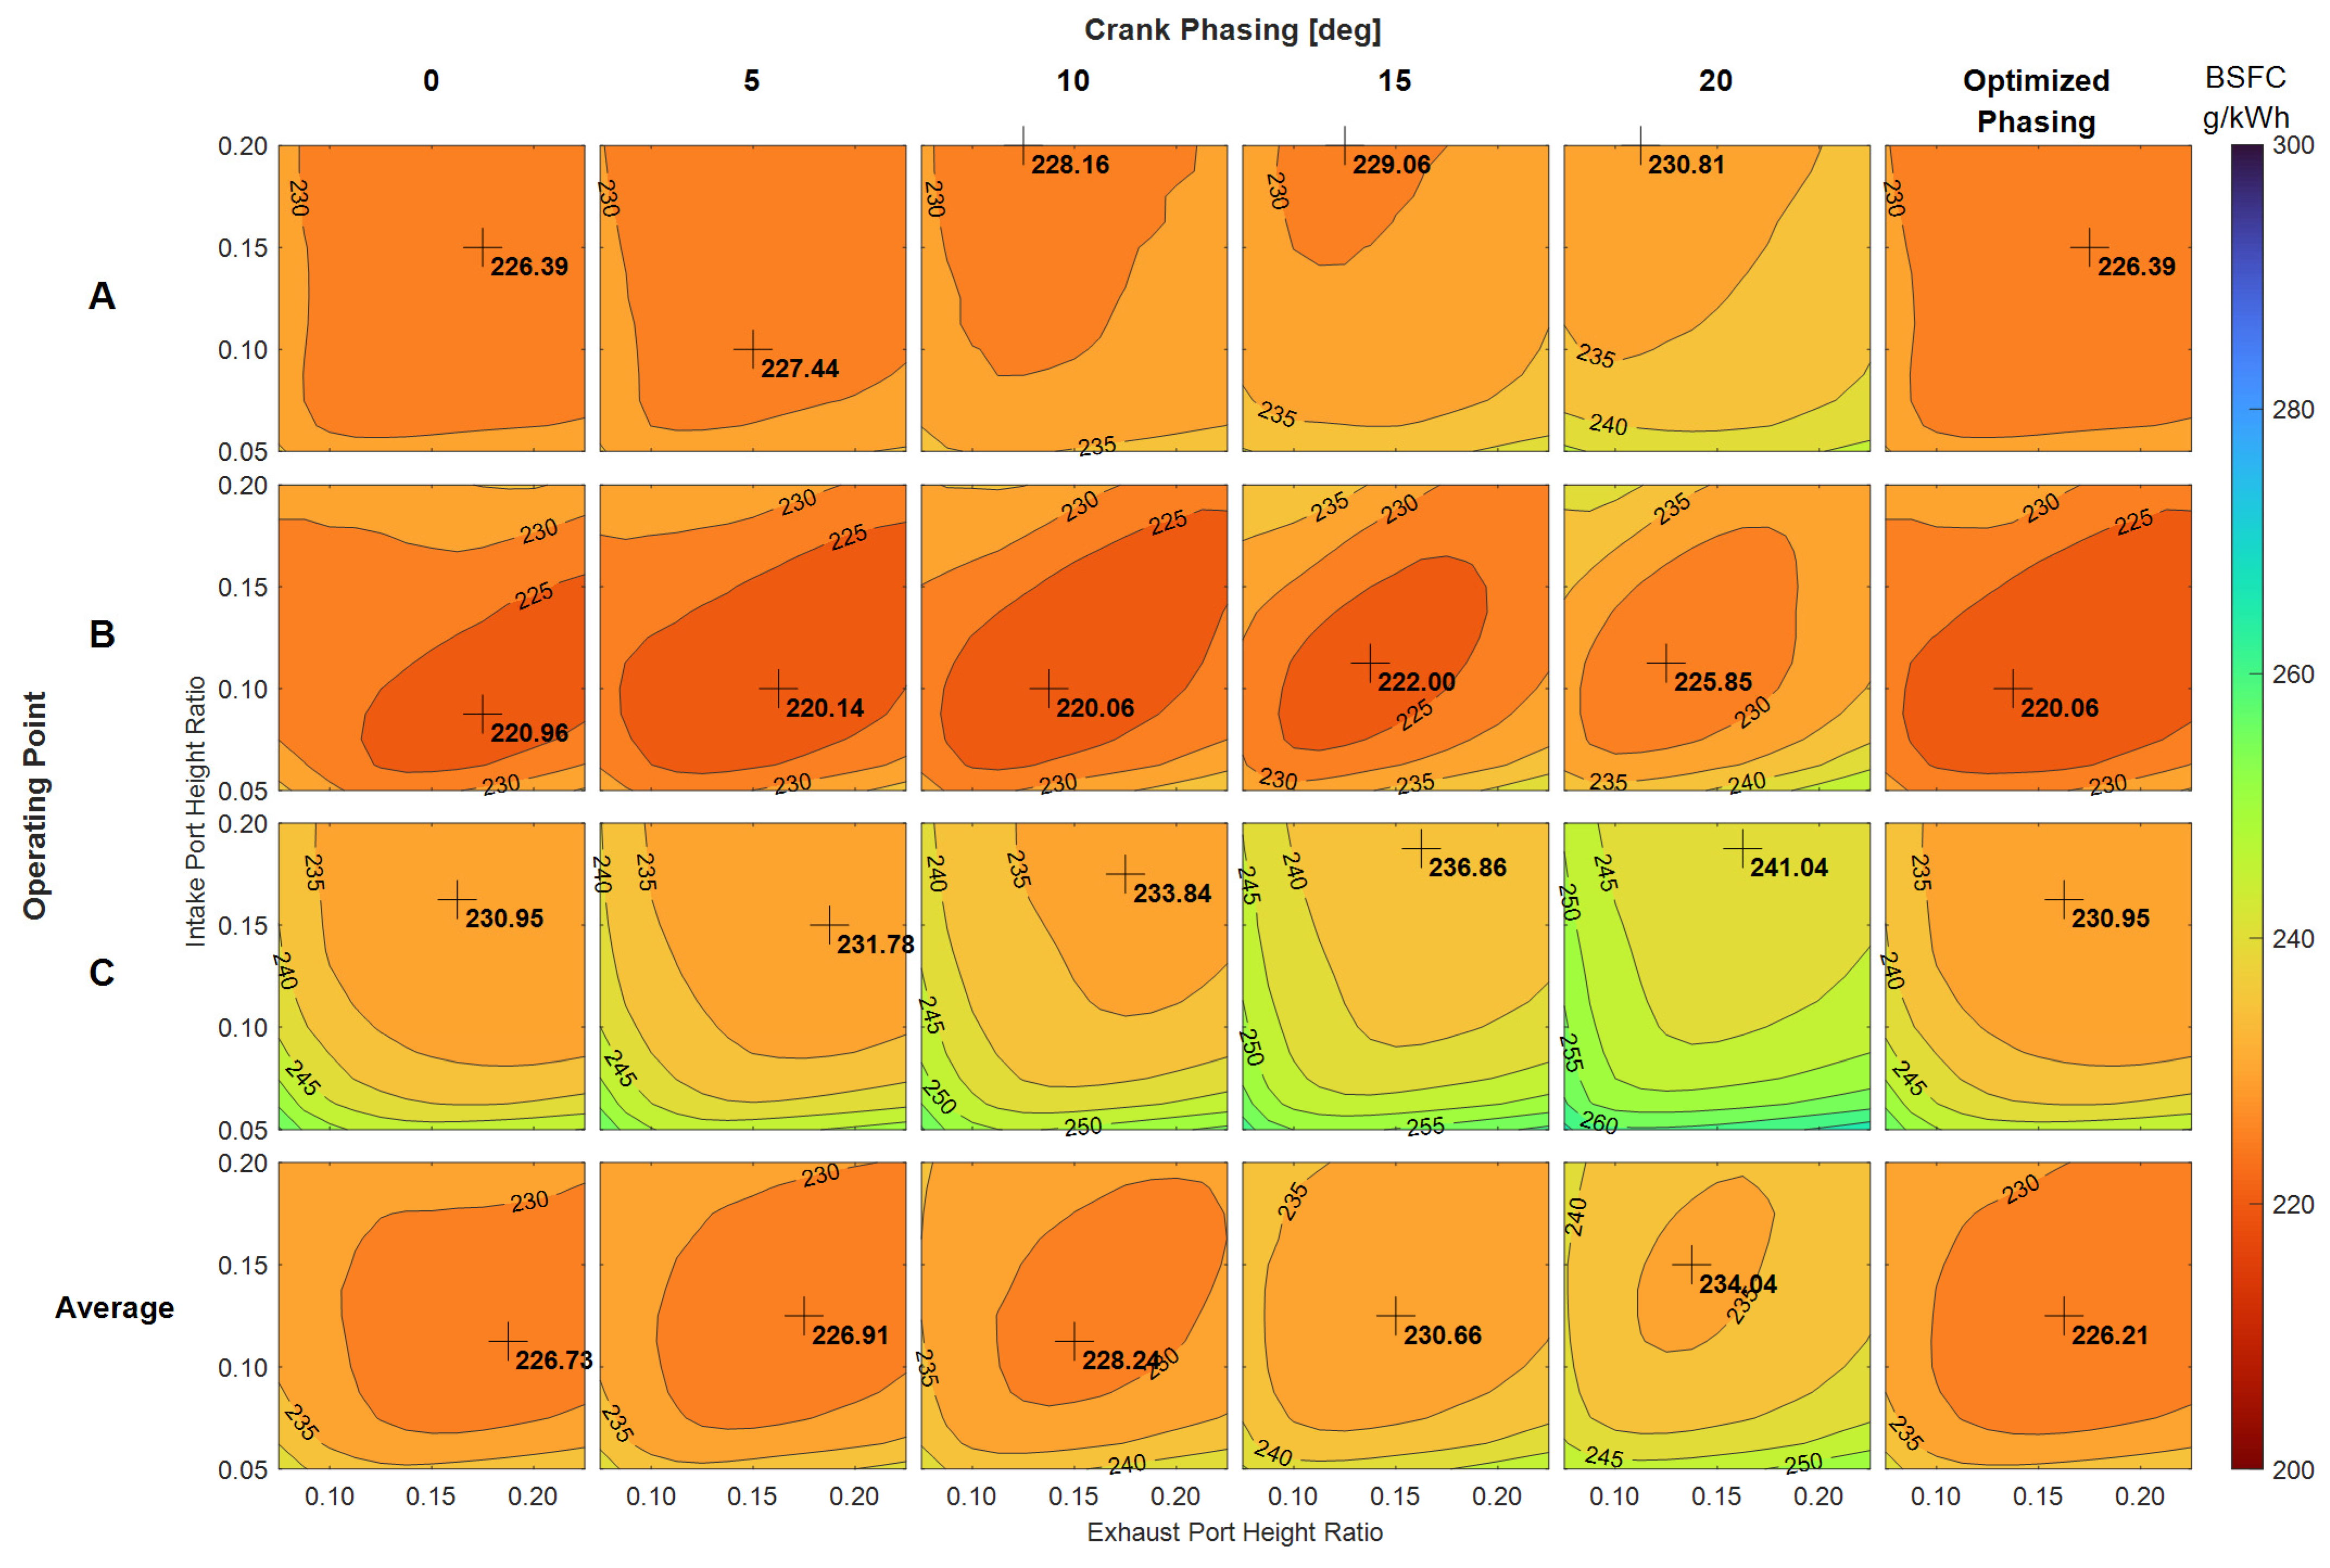
3.1.4. Effect of Crankshaft Phasing and Port Height on BSFC for Optimal λ Conditions

Now that it has been confirmed that it would be beneficial to run lean to obtain best thermal efficiency, Figure 13 records the overall picture across all operating points A, B, and C, i.e., with λ values set to the optimal condition for each operating point. Figure 13 also provides the BSFC contour corresponding to an optimal crankshaft phase angle for each operating point in the right-most column. It shows that if lean operation is allowed, variable crankshaft phasing would enable thermal efficiency to be fully optimized, although only a relatively narrow range (approximately 10°) of crankshaft phase angle adjustment would be required. The bottom row in Figure 13 gives the arithmetic mean BSFC contour across the three operating points for different levels of phasing. The bottom right-most contour suggests that, if the operating points are equally weighted, the optimal intake and exhaust port height-to-stroke ratios would be 0.1250 and 0.1625, respectively. Of course, this recommendation would change if different weightings (e.g., corresponding to a particular duty cycle) were instead applied.

3.1.5. Optimal Port Height-To-Stroke Ratios for Medium-Duty Truck Applications

Table 6 summarizes the results of the simulation study for the engine operating points corresponding to the medium-duty truck application. It states the optimal combination of intake and exhaust port height-to-stroke ratios and the resulting BSFC value, depending on whether operation must be stoichiometric or can be permitted to run lean, and whether crankshaft phasing needs to be fixed to a particular value or can be varied according to the operating point. In the absence of a defined duty cycle, the average BSFC values quoted in Table 6 are calculated by taking the arithmetic mean of the best BSFC points at A, B, and C (i.e., from Figure 13). In other words, these operating points are equally weighted.
If lean operation is permitted, Table 6 states a significant improvement in average BSFC of 10.3 g/kWh (or 4.3%) can be attained with a fixed level of crankshaft phasing, and a similar improvement in the case of variable phasing (10.6 g/kWh or 4.5%). However, despite some changes in optimal port height settings, Table 6 suggests there is little to be gained by introducing (presumably at significant cost) variable crankshaft phasing, whether under stoichiometric or lean operation, with just a 0.2–0.5 g/kWh (0.1–0.2%) improvement in average BSFC, respectively. This outcome was to be expected for stoichiometric operation, where Figure 10 indicates that best efficiency is obtained near to the 0° crankshaft phase angle for all operating points A, B, and C, increasing only slightly to 5–10° for lean operation at point B. However, this observation does not align with the 10–15° optimal crankshaft phase angle range put forward by other works (e.g., [35]).

3.2. Range Extender Application

Moving on to the range extender application and the corresponding engine operating points D and E (refer to Table 4), Figure 14 shows the variation in BSFC as a function of crankshaft phasing and intake and exhaust port height-to-stroke ratios. Once again, the simulations were constrained to operate at a stoichiometric air-to-fuel ratio (λ = 1), with the target BMEP value achieved by adjusting the intake pressure.
It is clear from Figure 14 that point D (1500 min−1, 16 bar-BMEP) is more efficient than point E (3000 min−1, 8-bar BMEP), giving the best BSFC results of 225 g/kWh at a 10° crankshaft phase angle and 239 g/kWh at 0° crankshaft phase angle, respectively. Whilst point E shows BSFC increasing with crankshaft phasing (at least over the 0–20° range evaluated), point D shows increasing BSFC if crankshaft phasing moves away from 10°.
Operating point D shows increasing areas of white space as crankshaft phasing decreases, indicating large inoperable regions at low crankshaft phase angles, whereas point E demonstrates no such inoperability within the evaluated range. Further, point E shows low sensitivity to changes in intake and exhaust port height-to-stroke ratios, with wide, flat contours. Conversely, point D shows high sensitivity to both port heights with steep gradients and, in some cases, inoperable regions surrounding the best efficiency islands.
Crankshaft phasing has little impact on the location of best efficiency for operating point E, with all points lying on the upper bound of the intake port height-to-stroke ratio. However, a slight trend towards reduced exhaust port height-to-stroke ratios with increased crankshaft phasing can be seen. At low values of crankshaft phasing, the best efficiency locations for point D lie on the lower bound of exhaust port height-to-stroke ratios. For crankshaft phasing in the range of 10–20°, a slight trend towards reduced exhaust port height-to-stroke ratios with increased crankshaft phasing can be seen. Over the range of phasing evaluated, the optimal intake port height-to-stroke ratio remains almost constant for point D.
It is not surprising that operating point D is more efficient than point E since its lower engine speed will result in lower frictional losses. However, increased component stresses caused by greater peak cylinder pressures and temperatures that would be associated with the higher BMEP of point D could impact durability, leading to reduced service life and/or shorter maintenance intervals. For these reasons, it might be deemed preferable to accept the ~6% efficiency penalty and run the range extender at operating point E. The decision would likely depend on the specifics of the range extender application, its duty cycle, and the OEM’s preference between fuel economy and in-service life.

4. Conclusions

Opposed-piston two-stroke (OP2S) engines are strong contenders for the chemical energy converter in both medium-duty truck applications and hybrid powertrains within range-extended electric vehicles; a survey of the literature identifies consensus around a 30-kW power capability for the latter. An engine model is developed that correctly imitates the motion of two opposed pistons as an equivalent single piston through the use of user-defined geometrical equations. A simulation study of a 0.751 L single-cylinder OPS2 engine, specified for both medium-duty truck and range extender roles, demonstrates the effect of crankshaft phasing and intake and exhaust port height-to-stroke ratios on brake-specific fuel consumption under both stoichiometric and lean operation.
Simulations of engine operation corresponding to a medium-duty truck application (points A, B, and C) show that under stoichiometric operation, the optimal phasing can be found between 0 and 5° of crankshaft phase angle, lower than the 10–15° range quoted in the literature. When using intake pressure to target BMEP with a fixed λ, an inverse relationship between charging efficiency and thermal efficiency is seen. This is apparent during higher crankshaft phasing where the charging efficiency required to meet the desired BMEP is higher due to the reduced efficiency by virtue of lower compression ratios. The increasing trend in trapping ratio with increased crankshaft phasing is one of the main factors for the improved scavenging caused by asymmetric timing. It is these two opposing phenomena that cause the optimum crankshaft phasing to vary depending on operating conditions.
With regard to stoichiometry, the best thermal efficiency was shown under lean conditions. For overall best efficiency (at operating point B), lean operation coupled with increased crankshaft phasing is recommended. More specifically, this requires a λ value of around 1.25 and 5–10° of crankshaft phasing. Indeed, moving to variable λ would enable a ~10 g/kWh (or ~4%) improvement in the average BSFC across the three operating points, and corresponding reductions in other pollutant emissions (e.g., CO, HC, NOx), once the crankshaft phasing is fixed to its optimal value. If operating points are equally weighted, the optimal intake and exhaust port height-to-stroke ratios would be 0.1250 and 0.1625. However, once these have been selected, there appears little to be gained from implementing variable crankshaft phasing, particularly under stoichiometric operation where the optimal crankshaft phase angle lies at or close to 0°.
Results for the 30 kW range extender simulations (operating points D and E) highlighted that the lower speed, higher load combination (point D) is the better option in terms of outright thermal efficiency (and thus lower fuel costs), but that the reverse combination (point E) might well be the preferred choice in the interest of reducing peak pressures and temperatures, thereby extending in-service life. Ultimately, end users and operators make decisions based on the total owning and operating cost over the lifetime of the vehicle, which is a function of both fuel and maintenance costs.

Author Contributions

Conceptualization, J.W.G.T., A.G.Y. and A.W.C.; methodology, A.G.Y.; software, A.G.Y.; validation, A.G.Y.; formal analysis, A.G.Y., A.W.C. and D.C.; investigation, A.G.Y.; data curation, A.G.Y.; writing—original draft preparation, A.G.Y., A.W.C. and D.C.; writing—review and editing, J.W.G.T.; visualization, A.G.Y.; supervision, A.W.C., D.C. and J.W.G.T.; funding acquisition, J.W.G.T. All authors have read and agreed to the published version of the manuscript.

Funding

This research was funded by the EPSRC Centre for Doctoral Training in Advanced Automotive Propulsion Systems, grant number EP/S023364/1.

Institutional Review Board Statement

Not applicable.

Informed Consent Statement

Not applicable.

Data Availability Statement

The data presented in this study are openly available in the University of Bath Research Data Archive at https://researchdata.bath.ac.uk/id/eprint/1083 (accessed on 3 October 2021).

Conflicts of Interest

The authors declare no conflict of interest. The funders had no role in the design of the study; in the collection, analyses, or interpretation of data; in the writing of the manuscript; or in the decision to publish the results.

Nomenclature

Greek symbols
ϕCrankshaft phase angle
λAir-to-fuel equivalence ratio

Abbreviations

2S-ROPETwo-Stroke Rodless Opposed Piston Engine
BMEPBrake Mean Effective Pressure
BSFCBrake Specific Fuel Consumption
CCompressor
CACCharge Air Cooler
CFDComputational Fluid Dynamics
EATExhaust Aftertreatment
EMElectric Machine
EUEuropean Union
EVElectric Vehicle
FMEPFriction Mean Effective Pressure
FPEGFree Piston Engine Generator
GCIGasoline Compression Ignition
GDPGross Domestic Product
GHGGreenhouse Gas
HCCIHomogeneous Charge Compression Ignition
ICEInternal Combustion Engine
NANaturally Aspirated
NVHNoise, Vibration, Harshness
OP2SOpposed-Piston Two-Stroke
REEVRange-Extended Electric Vehicle

References

  1. Sims, R.; Schaeffer, R.; Creutzig, F.; Cruz-Núñez, X.; D’Agosto, M.; Dimitriu, D.; Figueroa Meza, M.J.; Fulton, L.; Kobayashi, S.; Lah, O.; et al. Transport. In Climate Change 2014: Mitigation of Climate Change. Contribution of Working Group III to the Fifth Assessment Report of the Intergovernmental Panel on Climate Change; Edenhofer, O., Pichs-Madruga, R., Sokona, Y., Farahani, E., Kadner, S., Seyboth, K., Adler, A., Baum, I., Brunner, S., Eickemeier, P., et al., Eds.; Cambridge University Press: Cambridge, UK; New York, NY, USA, 2014. [Google Scholar]
  2. Advanced Propulsion Centre. Light Duty Vehicle <3.5 t—Propulsion Technologies Roadmap; Automotive Council UK and Advanced Propulsion Centre UK 2020 Product Roadmaps. Available online: https://www.apcuk.co.uk/product-roadmaps (accessed on 5 July 2021).
  3. Mock, P.; Diaz, S. European Vehicle Market. Statistics—Pocketbook 2020/21; International Council on Clean Transportation Europe: Berlin, Germany, 2020; Available online: http://eupocketbook.theicct.org/ (accessed on 5 July 2021).
  4. Weymar, E.; Finkbeiner, M. Statistical analysis of empirical lifetime mileage data for automotive LCA. Int. J. Life Cycle Assess. 2016, 21, 215–223. [Google Scholar] [CrossRef]
  5. Turner, J.; Blake, D.; Moore, J.; Burke, P.; Pearson, R.; Patel, R.; Blundell, D.; Chandrashekar, R.; Matteucci, L.; Barker, P.; et al. The Lotus Range Extender Engine; SAE Technical Paper 2010-01-2208; SAE International: Detroit, MI, USA, 2010. [Google Scholar] [CrossRef]
  6. Bassett, M.; Hall, J.; OudeNijeweme, D.; Darkes, D.; Bisordi, A.; Warth, M. The Development of a Dedicated Range Extender Engine; SAE Technical Paper 2012-01-1002; SAE International: Detroit, MI, USA, 2012. [Google Scholar] [CrossRef] [Green Version]
  7. Bassett, M.; Hall, J.; Warth, M. Development of a Dedicated Range Extender Unit and Demonstration Vehicle. In Proceedings of the EVS27 International Battery, Hybrid and Fuel Cell Electric Vehicle Symposium, Barcelona, Spain, 17–20 November 2013. [Google Scholar]
  8. MAHLE Compact Range Extender Engine; MAHLE Product Information. 2021. Available online: https://www.mahle-powertrain.com/en/experience/mahle-compact-range-extender-engine/ (accessed on 28 August 2021).
  9. ENGIRO 40 kW Range Extender Prototype for Light and Heavy Duty Vehicles: Preliminary Datasheet; Engiro GmbH Datasheet. 2016. Available online: https://www.engiro.de/en/products/drive-systems/range-extender/all-range-extenders/re-40 (accessed on 28 August 2021).
  10. Kemper, H. Plug-in e-vehicle with and without range extender. FEV Spectr. 2008, 39, 1–3. [Google Scholar]
  11. Fischer, R.; Fraidl, G.K.; Hubmann, C.; Kapus, P.E.; Kunzemann, R.; Sifferlinger, B.; Beste, F. Range extender module—Enabler for electric mobility. ATZ Autotechnol. 2009, 9, 40–46. [Google Scholar] [CrossRef]
  12. Sams, T.; Sifferlinger, B. AVL Rotary Range Extender—A Rotary Engine Based Range Extender Concept. In Proceedings of the E-Mobility Conference 2013, Graz, Austria, 30 January 2013. [Google Scholar]
  13. Reducing Vehicle Carbon Emissions through Development of a Compact, Efficient, and Intelligent Powertrain. Available online: https://gtr.ukri.org/projects?ref=113127#/tabOverview (accessed on 28 August 2021).
  14. Vorraro, G.; Islam, R.; Turner, M.; Turner, J.W.G. Application of a Rotary Expander as an Energy Recovery System for a Modern Wankel Engine. In Proceedings of the IMechE Internal Combustion Engines and Powertrain Systems for Future Transport Conference, Birmingham, UK, 11–12 December 2019. [Google Scholar]
  15. Turner, J.; Turner, M.; Islam, R.; Shen, X.; Costall, A. Further Investigations into the Benefits and Challenges of Eliminating Port Overlap in Wankel Rotary Engines; SAE Technical Paper 2021-01-0638; SAE International: Detroit, MI, USA, 2021. [Google Scholar] [CrossRef]
  16. MicroTurbine Range Extender (MiTRE). Available online: https://gtr.ukri.org/projects?ref=101309 (accessed on 28 August 2021).
  17. HIPERCAR—High Performance Carbon Reduction Sports Car. Available online: https://gtr.ukri.org/projects?ref=101808 (accessed on 28 August 2021).
  18. HIPERCARII—Enhancing Manufacturability of a High Performance REEV with Microturbine Range Extender. Available online: https://gtr.ukri.org/projects?ref=113154 (accessed on 28 August 2021).
  19. Catalytic Generator—Cosworth. Available online: https://www.cosworth.com/capabilities/electrification/hybrid-solutions/catalytic-generator/ (accessed on 28 August 2021).
  20. Mitsubishi Turbocharger and Engine Europe Introduces RANGE+. Available online: https://www.mhi.com/news/grp170912.html (accessed on 28 August 2021).
  21. Mitsubishi Heavy Industries: Mitsubishi Turbocharger and Engine Europe Introduces RANGE+. Available online: http://www.publicnow.com/view/35C3A9B710EBD4E59CD7DEE8718E41959CC4F440 (accessed on 28 August 2021).
  22. Van Blarigan, P.; Paradiso, N.; Goldsborough, S. Homogeneous Charge Compression Ignition with A Free Piston: A New Approach to Ideal Otto Cycle Performance; SAE Technical Paper 982484; SAE International: Detroit, MI, USA, 1998. [Google Scholar] [CrossRef] [Green Version]
  23. Mikalsen, R.; Roskilly, A.P. Free-Piston Internal Combustion Engine. U.S. Patent 20,130,118,453, 19 May 2015. [Google Scholar]
  24. Andrew Smallbone, A.; Hanipah, M.R.; Jia, B.; Scott, T.; Heslop, J.; Towell, B.; Lawrence, C.; Roy, S.; Shivaprasad, K.V.; Roskilly, A.P. Realization of a novel free-piston engine generator for hybrid-electric vehicle applications. Energy Fuels 2020, 34, 12926–12939. [Google Scholar] [CrossRef] [PubMed]
  25. Regner, G.; Johnson, D.; Koszewnik, J.; Dion, E.; Redon, F.; Fromm, L. Modernizing the Opposed Piston, Two Stroke Engine for Clean, Efficient Transportation; SAE Technical Paper 2013-26-0114; SAE International: Detroit, MI, USA, 2013. [Google Scholar] [CrossRef] [Green Version]
  26. McGough, M.; Fanick, E. Experimental Investigation of the Scavenging Performance of a Two-Stroke Opposed-Piston Diesel Tank Engine; SAE Technical Paper 2004-01-1591; SAE International: Detroit, MI, USA, 2004. [Google Scholar] [CrossRef]
  27. Hofbauer, P. Opposed Piston Opposed Cylinder (Opoc) Engine for Military Ground Vehicles; SAE Technical Paper 2005-01-1548; SAE International: Detroit, MI, USA, 2005. [Google Scholar] [CrossRef]
  28. Serrano, J.R.; García, A.; Monsalve-Serrano, J.; Martínez-Boggio, S. High efficiency two stroke opposed piston engine for plug-in hybrid electric vehicle applications: Evaluation under homologation and real driving conditions. Appl. Energy 2020, 282 Pt A, 116078. [Google Scholar] [CrossRef]
  29. Goldsborough, S.S.; Van Blarigan, P. Optimizing the Scavenging System for a Two-Stroke Cycle, Free Piston Engine for High Efficiency and Low Emissions: A Computational Approach; SAE Technical Paper 2003-01-0001; SAE International: Detroit, MI, USA, 2013. [Google Scholar] [CrossRef] [Green Version]
  30. Ma, F.-K.; Zhao, C.; Zhang, F.; Zhao, Z.; Zhang, S. Effects of scavenging system configuration on in-cylinder air flow organization of an opposed-piston two-stroke engine. Energies 2015, 8, 5866–5884. [Google Scholar] [CrossRef] [Green Version]
  31. Ma, F.-K.; Wang, J.; Feng, Y.-N.; Zhang, Y.-G.; Su, T.-X.; Zhang, Y.; Liu, Y.-H. Parameter optimization on the uniflow scavenging system of an OP2S-GDI engine based on indicated mean effective pressure (IMEP). Energies 2017, 10, 368. [Google Scholar] [CrossRef] [Green Version]
  32. Ma, F.; Zhao, Z.; Zhang, Y.; Wang, J.; Feng, Y.; Su, T.; Zhang, Y.; Liu, Y. Simulation modeling method and experimental investigation on the uniflow scavenging system of an opposed-piston folded-cranktrain diesel engine. Energies 2017, 10, 727. [Google Scholar] [CrossRef] [Green Version]
  33. Ma, F.; Zhang, L.; Su, T. Simulation modeling and optimization of uniflow scavenging system parameters on opposed-piston two-stroke engines. Energies 2018, 11, 940. [Google Scholar] [CrossRef] [Green Version]
  34. Yang, Y.; Li, X.-R.; Kang, Y.-N.; Zuo, H.; Liu, F.-S. Evaluating the scavenging process by the scavenging curve of an opposed- piston, two-stroke (OP2S) diesel engine. Appl. Therm. Eng. 2019, 147, 336–346. [Google Scholar] [CrossRef]
  35. Mattarelli, E.; Rinaldini, C.; Savioli, T.; Cantore, G.; Warey, A.; Potter, M.; Gopalakrishnan, V.; Balestrino, S. Scavenge Ports Optimization of a 2-Stroke Opposed Piston Diesel Engine; SAE Technical Paper 2017-24-0167; SAE International: Detroit, MI, USA, 2017. [Google Scholar] [CrossRef]
  36. Turner, J.W.G.; Head, R.A.; Chang, J.; Engineer, N.; Wijetunge, R.; Blundell, D.W.; Burke, P. 2-Stroke Engine Options for automotive Use: A Fundamental Comparison of Different Potential Scavenging Arrangements for Medium-Duty Truck Applications; SAE Technical Paper 2019-01-0071; SAE International: Detroit, MI, USA, 2019. [Google Scholar] [CrossRef]
  37. Young, A.; Turner, J.; Head, R. Turbocompounding the Opposed-Piston 2-Stroke Engine; SAE Technical Paper 2021-01-0636; SAE International: Detroit, MI, USA, 2021. [Google Scholar] [CrossRef]
  38. GT-SUITE Overview. Available online: https://www.gtisoft.com/gt-suite/gt-suite-overview/ (accessed on 30 August 2021).
  39. Badra, J.A.; Sim, J.; Elwardany, A.; Jaasim, M.; Viollet, Y.; Chang, J.; Amer, A.; Im, H.G. Numerical simulations of hollow-cone injection and gasoline compression ignition combustion with naphtha fuels. J. Energy Resour. Technol. 2016, 138, 052202. [Google Scholar] [CrossRef]
  40. Hanson, R.; Salvi, A.; Redon, F.; Regner, G. Experimental comparison of gasoline compression ignition and diesel combustion in a medium-duty opposed-piston engine. J. Energy Resour. Technol. 2019, 141, 122201. [Google Scholar] [CrossRef]
  41. Marseglia, G.; Medaglia, C.M. Energy efficiency in gasoline direct injection engines. WIT Trans. Built. Environ. 2019, 182, 85–91. [Google Scholar] [CrossRef] [Green Version]
  42. Salvi, A.; Hanson, R.; Zermeno, R.; Regner, G.; Sellnau, M.; Redon, F. Initial Results on a New Light-Duty 2.7L Opposed-Piston Gasoline Compression Ignition Multi-Cylinder Engine. In Proceedings of the ASME 2018 Internal Combustion Engine Division Fall Technical Conference, San Diego, CA, USA, 4–7 November 2018. [Google Scholar] [CrossRef]
  43. Herold, R.; Wahl, M.; Regner, G.; Lemke, J. Thermodynamic Benefits of Opposed-Piston Two-Stroke Engines; SAE Technical Paper 2011-01-2216; SAE International: Detroit, MI, USA, 2011. [Google Scholar] [CrossRef] [Green Version]
  44. Development of Post-Euro 6/VI Emission Standards for Cars, Vans, Lorries and Buses. Available online: https://eur-lex.europa.eu/legal-content/EN/ALL/?uri=cellar:d2216ca0-704d-11ea-a07e-01aa75ed71a1 (accessed on 31 August 2021).
  45. European Vehicle Emissions Standards—Euro 7 for Cars, Vans, Lorries and Buses. Available online: https://ec.europa.eu/info/law/better-regulation/have-your-say/initiatives/12313-European-vehicle-emissions-standards-Euro-7-for-cars-vans-lorries-and-buses_en (accessed on 31 August 2021).
Figure 1. Combustion heat release profile adopted from previous work on GCI engines [39].
Energies 14 06696 g001
Figure 2. Scavenge profile based on 3D CFD predictions by Mattarelli et al. [35] (Figure 13).
Energies 14 06696 g002
Figure 3. Schematic representation of OP2S engine configuration with electric compressor (C, top left), using electrical power transmission as the method of variable-speed drive. CAC: charge air cooler; EM: electric machine; EAT: exhaust aftertreatment.
Energies 14 06696 g003
Figure 4. Scale diagram of the OP2S cylinder model drawn for a crankshaft phase angle ϕ of 20° at an instant when the intake and exhaust pistons lie 10° before and after bottom dead centre, respectively. The intake and exhaust port heights drawn here are at their maximum values (corresponding to port height-to-stroke ratios of 0.2 and 0.225, respectively).
Energies 14 06696 g004
Figure 5. Instantaneous displacements of the (leading) exhaust (red) piston and the intake (blue) piston for the maximum crankshaft phase angle ϕ of 20°, and the resultant effective (inter-piston) stroke-normalized displacement (black), over an engine cycle. Inset: difference in effective displacement between minimum (0°, solid) and maximum (20°, broken line) crankshaft phase angle.
Energies 14 06696 g005
Figure 6. Effect of crankshaft phasing on geometric compression ratio.
Energies 14 06696 g006
Figure 7. Normalized intake (top, blue) and exhaust (bottom, red) displacement profiles for 0° (minimum) and 20° (maximum) crankshaft phasing. Horizontal dash-dot lines indicate the range of port heights investigated.
Energies 14 06696 g007
Figure 8. Impact of crankshaft phasing and intake and exhaust port height-to-stroke ratio on blowdown, scavenge and intake durations (in CA°).
Energies 14 06696 g008
Figure 9. Impact of crankshaft phasing and intake and exhaust port height-to-stroke ratio on trapped expansion ratio, trapped compression ratio, and ratio of expansion to compression ratios.
Energies 14 06696 g009
Figure 10. Variation of BSFC with crankshaft phasing and intake and exhaust port height-to-stroke ratio at operating points A, B, and C (1500 min−1, 3-bar BMEP; 1500 min−1, 12-bar BMEP; and 3000 min−1, 10-bar BMEP, respectively); λ = 1.
Energies 14 06696 g010
Figure 11. Effect of crankshaft phasing and intake and exhaust port height-to-stroke ratio on delivery ratio, trapping ratio, charging efficiency, scavenging efficiency, and delta pressure, at operating point B (1500 min−1, 12-bar BMEP); λ = 1.
Energies 14 06696 g011
Figure 12. Variation in BSFC with crankshaft phasing and intake and exhaust port height-to-stroke ratio at operating point B (1500 min−1, 12-bar BMEP), for air-to-fuel equivalence ratios λ = 1–1.5. White space indicates inoperable regions. All BSFC contours are drawn at intervals of 5 g/kWh.
Energies 14 06696 g012
Figure 13. Variation in BSFC with crankshaft phasing and intake and exhaust port height-to-stroke ratios at points A, B, and C (1500 min−1, 3-bar BMEP; 1500 min−1, 12-bar BMEP; and 3000 min−1, 10-bar BMEP, respectively), with each operating at its optimal λ setting. The right-most column shows the BSFC contour for best crankshaft phasing at each operating point. The bottom row shows the mean BSFC across the three operating points (i.e., assuming equal weightings).
Energies 14 06696 g013
Figure 14. Variation in BSFC with crankshaft phasing and intake and exhaust port height-to-stroke ratio at operating points D and E (1500 min−1, 16-bar BMEP and 3000 min−1, 8-bar BMEP, respectively); λ = 1. White space indicates inoperable regions. All BSFC contours are drawn at intervals of 5 g/kWh.
Energies 14 06696 g014
Table 1. Non-exhaustive survey of combustion-based power systems for range extender applications in the literature.
OrganizationProject/ProductTimeframeSpecificationsTarget PowerRef.
Lotus EngineeringLotus Range Extender Engine2010
  • Configuration: 1.2 L, 3-cyl.
  • Rated engine speed: 3500 min−1
  • Max. engine speed: 4000 min−1
  • Rated output: 10.8 bar BMEP
38 kW[5]
MAHLE PowertrainCompact Range Extender Engine (‘REx’)2012
  • 4-stroke gasoline engine
  • Configuration: 0.9 L, 2-cyl.
  • Rated engine speed: 4000 min−1
  • Target output: 10 bar BMEP
  • Target BSFC: 240 g/kWh
  • Emissions: Euro 6
30 kW
(40 kW)
(50 kW supercharged)
[6,7,8]
Engiro GmbHRange Extender RE 402016
  • 4-stroke gasoline engine
  • Configuration: 1.2 L, 3-cyl., NA
  • Rated engine speed: 4000 min−1
  • Emissions: Euro 6
40 kW
(45 kW max.)
[9]
FEVRange Extender Module2008
  • Wankel rotary engine
20 kW[10]
AVLFUEREX2009
  • Wankel rotary engine
  • 0.254 L
  • 7.1 bar BMEP
15 kWe[11,12]
Advanced Innovative Engineering (UK) Ltd.ADAPT/AIE 225CS Gen 22017–2021
  • Wankel rotary engine
  • 0.225 L, NA
30 kW[13,14,15]
Delta Motorsport LimitedMiTRE2012–2016
  • Turbocharger-based gas turbine
  • Recuperated
17 kW[16]
HiPERCAR2015–201735 kW[17]
HiPERCAR 22017–2021[18]
Delta-CosworthCatalyticGeneratorCurrent[19]
MitsubishiRange+2017–
  • Turbocharger-based gas turbine
  • Recuperated
35 kWe[20,21]
Sandia National Lab.Free piston linear alternator1998–
  • 2-stroke cycle
  • HCCI (homogeneous charge compression ignition)
30 kWe[22]
Durham UniversityFPEG (Free Piston Engine Generator2013–
  • Twin-opposed free pistons
  • Boosted (1.2 barA)
24 kWe[23,24]
INNengine company &CMT, Universitat Politècnica de València2S-ROPE (2-stroke rodless opposed piston engine)2020–
  • 0.5 L, 4-cyl.
  • Variable compression ratio
33 kW[28]
Table 2. Summary of the modelled OP2S engine specifications based on previous work [36,37].
ParameterUnitsValue
Boremm75.75
Total strokemm166.65
Bore-to-stroke ratio-0.455
Cylinder swept volumeL0.75104
Compression ratio at 0° phase-15.3:1
Con-rod lengthmm166.65
Scavenging system-Uniflow
Table 3. Fuel properties for gasoline applied in the OP2S engine model.
ParameterUnitsValue
Average ratio of H:C atoms-2.009
Lower Heating ValueMJ/kg42.1
Densitykg/m3721
Table 4. Engine operating points for medium-duty truck and range extender applications.
ParameterUnitsOperating Point
Medium-Duty TruckRange Extender
ABCDE
Engine speedmin−115001500300015003000
BMEPbar31210168
Power (per cylinder)kW5.6322.537.630.030.0
Power densitykW/l7.5030.050.040.040.0
Exhaust pressurebar1.051.502.001.502.00
Table 5. Design of experiment parameter ranges.
Operating PointUnitsMinimumMaximum
Crankshaft phase angle (exhaust leads intake)°CA020
Intake port height-to-stroke ratio-0.0500.200
Exhaust port height-to-stroke ratio-0.0750.225
Air-to-fuel equivalence ratio, λ
(N.B. max. value varies by op. point)
-1.02.0 (A), 1.5 (B, C)
1.0 (D, E)
Table 6. Optimal port heights for medium-duty operating points A, B, and C (1500 min−1, 3-bar BMEP; 1500 min−1, 12-bar BMEP; and 3000 min−1, 10-bar BMEP, respectively) for both stoichiometric and lean operation, and under both fixed- and variable-phasing scenarios. Average BSFC is calculated as an equally weighted mean of the best efficiency points at operating points A, B, and C.
PhasingParameterUnitsStoichiometric Operation
(λ = 1)
Variable Stoichiometry
(λ = 1–2)
FixedIntake port height-to-stroke ratio-0.11250.1125
Exhaust port height-to-stroke ratio-0.16250.1875
Average BSFCg/kWh236.98226.73
VariableIntake port height-to-stroke ratio-0.11250.1250
Exhaust port height-to-stroke ratio-0.15000.1625
Average BSFCg/kWh236.75226.21
Publisher’s Note: MDPI stays neutral with regard to jurisdictional claims in published maps and institutional affiliations.

