Article

Single-Phase Heat Transfer Characteristics of Water in an Industrial Plate and Shell Heat Exchanger under High-Temperature Conditions

1
Department of Mechanical Engineering, Korea University, Anam-ro, Seongbuk-gu, Seoul 02841, Korea
2
Thermal Conversion System Laboratory, Korea Institute of Energy Research, 152 Gajeong-ro, Yuseong-gu, Daejeon 34129, Korea
*
Authors to whom correspondence should be addressed.
Energies 2021, 14(20), 6688; https://doi.org/10.3390/en14206688
Submission received: 11 September 2021 / Revised: 24 September 2021 / Accepted: 12 October 2021 / Published: 15 October 2021
(This article belongs to the Special Issue Fluid Flow and Heat Transfer Analysis in Industrial Applications)

Abstract

:
This study investigates the single-phase heat transfer, pressure drop, and temperature distribution of water in an industrial plate and shell heat exchanger (PSHE) under high-temperature conditions. In this experiment, the hot fluid flows downward on the plate side, while the cold fluid flows upward on the shell side. In the single-phase heat transfer experiment on water, the Nu is in the range of 7.85–15.2 with a Re from 1200 to 3200, which is substantially lower than that on the plate heat exchanger (PHE) studied previously. The decrease in the Nu is attributed to the reduced cross-sectional heat transfer area from the flow imbalance in the PSHE. As the Re increases, the pressure drop on the plate side increases more rapidly than that on the shell side because of the difference in the port pressure drop, flow direction, and flow position on the plate. When the Re is 2620, the pressure drops on the plate and shell sides are 52.5 kPa and 25.5 kPa, respectively, a difference of 51.4%. The temperature deviation on the circular plate increases as the Re decreases, especially between the edge and bottom of the plate because of uneven flow distribution on the plate.

1. Introduction

Improvements in energy efficiency through technological advancement have the greatest effect, of 34%, on carbon neutrality. The industrial sector is the biggest contributor to CO2 emissions, amounting to 57% [1]. A heat exchanger is a representative energy efficiency device used in the industrial sector. There are various types of industrial heat exchangers used depending on their purpose and the environment. Shell and tube heat exchangers (STHEs) and plate heat exchangers (PHEs) have been widely used in the industrial sector. A plate and shell heat exchanger (PSHE), the structure of which has both the advantages of a STHE and a PHE, was introduced to replace conventional heat exchangers in 1990 [2].
Figure 1 is a schematic of a PSHE; it uses a circular plate enclosed in a shell structure. Moreover, there is no need for a gasket, which is called a cassette, by welding the inlet and outlet ports of the plate. The plate side is a closed system, which uses a fluid that needs to be prevented from leaking, such as a refrigerant, whereas the shell side is an open system, which can use a fluid such as water. The PSHE has similar efficiency to a PHE and can withstand high-temperature and high-pressure environments. Hence, the PSHE can be applied to various fluids with high-temperature and high-pressure conditions. Additionally, due to its washable characteristics, it has the advantage of being easily maintained against contamination that occurs during industrial processes [3].
Although PSHEs have been widely used in chemical, petroleum, and industrial processes, prior research on PSHEs is lacking compared to PHEs. Lim et al. [4] conducted an experimental study on the two-phase condensation heat transfer coefficient and pressure drop of R-245fa in the high-temperature region of the PHE, which has a similar heat transfer area to the PSHE. The two-phase condensation heat transfer coefficient of the PSHE was 5.9% lower on average than that of the PHE, and the pressure drop of the PSHE was 16.7% lower. Song et al. [5] studied the two-phase evaporative heat transfer coefficient and pressure drop of the PSHE using R-245fa according to the direction of fluid flow at temperatures of 60–80 °C. The heat transfer performance of the upward flow was better than that of the downward flow. Jo et al. [6] compared the two-phase evaporative heat transfer characteristics of R-1234ze(E) in the PHE and the PSHE by varying saturation temperature and heat flux. Park et al. [7] conducted a two-phase condensation heat transfer experiment in the PSHE with two different chevron angles using R-134a by varying mass flux, heat flux, and saturation temperature. Kwon et al. [8] studied the two-phase condensation heat transfer and pressure drop of R-1233zd(E) in two brazed heat exchangers with different shapes and the PSHE. Due to flow imbalance, the friction factor ratio to Nusselt number (Nu) in the PSHE was excessively higher than that in the PHE. Abbas et al. [9] performed a CFD analysis of water heat transfer and flow characteristics in the PSHE at low temperatures on a circular plate with two different chevron angles. The PSHE showed 12–35% higher thermal energy conversion efficiency (pumping power) than the PHE. Gherasim et al. [10] studied the single-phase heat transfer of the PHE for laminar and turbulent conditions.
Most previous studies have focused on heat transfer and pressure drop in the two-phase region using small plates. It is difficult to measure the performance of heat exchangers with a large heat transfer area under high-temperature conditions owing to the increased size in the experimental setup. Therefore, studies on single-phase heat transfer and pressure drop of water are very limited in a high-temperature range in PSHEs. Furthermore, studies on a plate with a large heat transfer area applied to industrial applications are insufficient. Additionally, the temperature distribution in PSHEs was not investigated at all. Therefore, in this study, the single-phase heat transfer coefficient and pressure drop of water in a PSHE with a large plate for industrial applications were measured and analyzed by varying operating conditions. Furthermore, the temperature distribution on the circular plate under down-flow was measured with respect to the Reynolds number (Re) and heat flux.

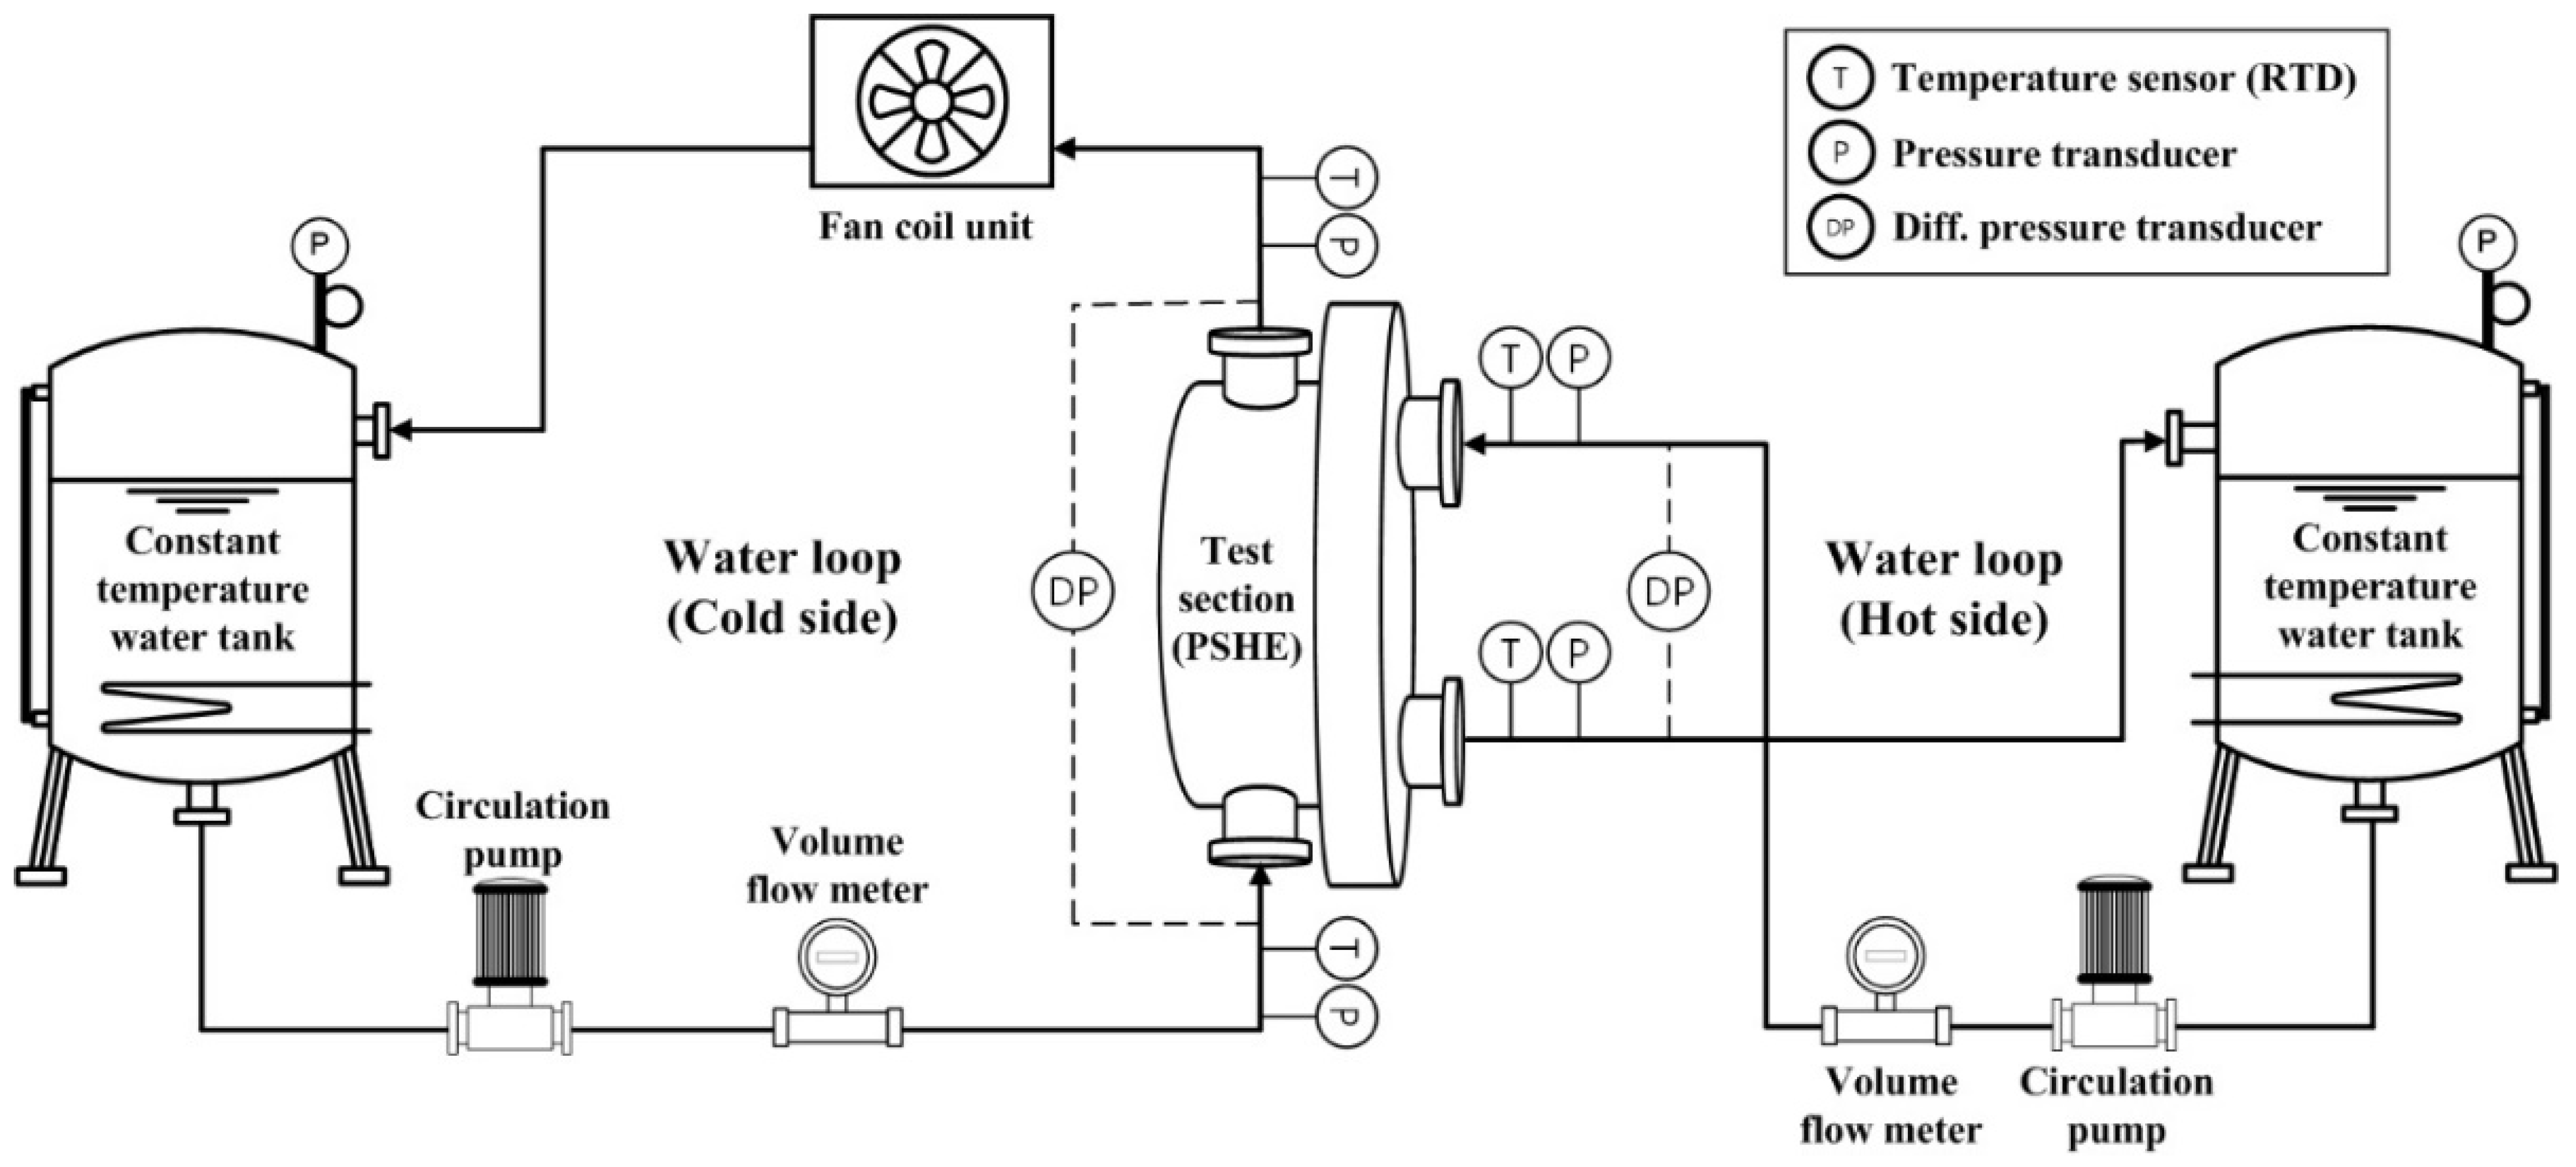
2. Experimental Apparatus and Test Procedure

2.1. Experimental Apparatus

Figure 2 is a schematic of the experimental equipment. The experimental setup consisted of a hot side that transmits heat and a cold side that receives heat. In both cases, a thermostat was installed to control the temperature of the test section, and an inverter was used to control the circulation flow rate. In addition, it was configured as a closed loop to enable the experiment in conditions over 100 °C so that the pressurized water circulates. In this experiment, the hot fluid flows down on the plate side, while the cold fluid flows upward on the shell side.
Figure 3 shows the shape of a circular plate for industrial applications, and Table 1 shows the specifications of the plate. In addition, Figure 4 shows the marked positions of the temperature sensors used to analyze the temperature distribution on the circular plate. The effective heat transfer area (Aeff) of the circular plate was calculated by Equation (1), and the enlargement factor and the hydraulic diameter (Dh) of the plate were calculated by Equations (2) and (3) [4,5,6,11], respectively.
A e f f = π 4 ( D 2 2 D p o r t 2 ) ϕ N p l a t e
ϕ = 1 6 ( 1 + 1 + α 2 + 4 1 + α 2 2 )
D h = 2 b ϕ
where,
α = π b λ
Table 2 shows the experimental conditions for the single-phase heat transfer of water. The average temperature of water varied at 90, 100, and 110 °C. The volumetric flow rate of the hot-side water varied in the range of 2.2–5.0 m3 h−1, while that of the cold-side water varied at 2.0 and 3.5 m3 h−1. Additionally, the heat flux varied in the range of 1.5–4.0 kW m−2. Meanwhile, the pressure drop experiments were conducted under no heat flux conditions. The test data were acquired for 5 min in a steady state using a data acquisition system (Yokogawa MX100).

2.2. Data Reduction

The heat transfer rates for the hot- and cold-water sides were calculated by Equations (5) and (6), respectively, and the average heat transfer rate was calculated by Equation (7). In addition, the heat flux was calculated by Equation (8).
Q ˙ w , h = C p , h m ˙ h ( T h , i n T h , o u t )
Q ˙ w , c = C p , c m ˙ c ( T c , o u t T c , i n )
Q ˙ a v g = ( Q ˙ w , h + Q ˙ w , c ) / 2
q = Q ˙ w , c A e f f
Since the PSHE has the same heat transfer area on both sides of the fluid, the overall heat transfer coefficient can be expressed by Equation (9) using the concept of thermal resistance. Additionally, the overall heat transfer coefficient can be determined by the effective heat transfer area and logarithmic mean temperature difference (LMTD) based on the average heat transfer rate, as shown in Equation (10).
1 U = 1 h w , h + 1 h w , c + t k w a l l
U = Q ˙ a v g A e f f L M T D
The LMTD was defined by Equation (11) based on the inlet and outlet temperatures of the countercurrent channels of the two fluids.
L M T D = ( Δ T 1 Δ T 2 ) ln ( Δ T 1 / Δ T 2 )
where,
Δ T 1 = T h , i n T c , o u t
Δ T 2 = T h , o u t T c , i n
The measured pressure drop across the PSHE was used to estimate the friction factor (f) of the plate and shell sides. Since the pressure drop was dominated by the frictional pressure drop, the port pressure drop at the inlet and outlet ports was not considered [12] in this study. The f on the plate and shell sides was calculated by Equation (14).
f = Δ P f D h 2 G 2 ν L p o r t
Uncertainty analyses were conducted based on the ASHRAE guidelines [13,14]. The uncertainties of the measured and reduced parameters are summarized in Table 3. The total uncertainties of the heat flux, U, and f were estimated as ±7.1%, ±7.5%, and ±6.1%, respectively.

3. Results and Discussion

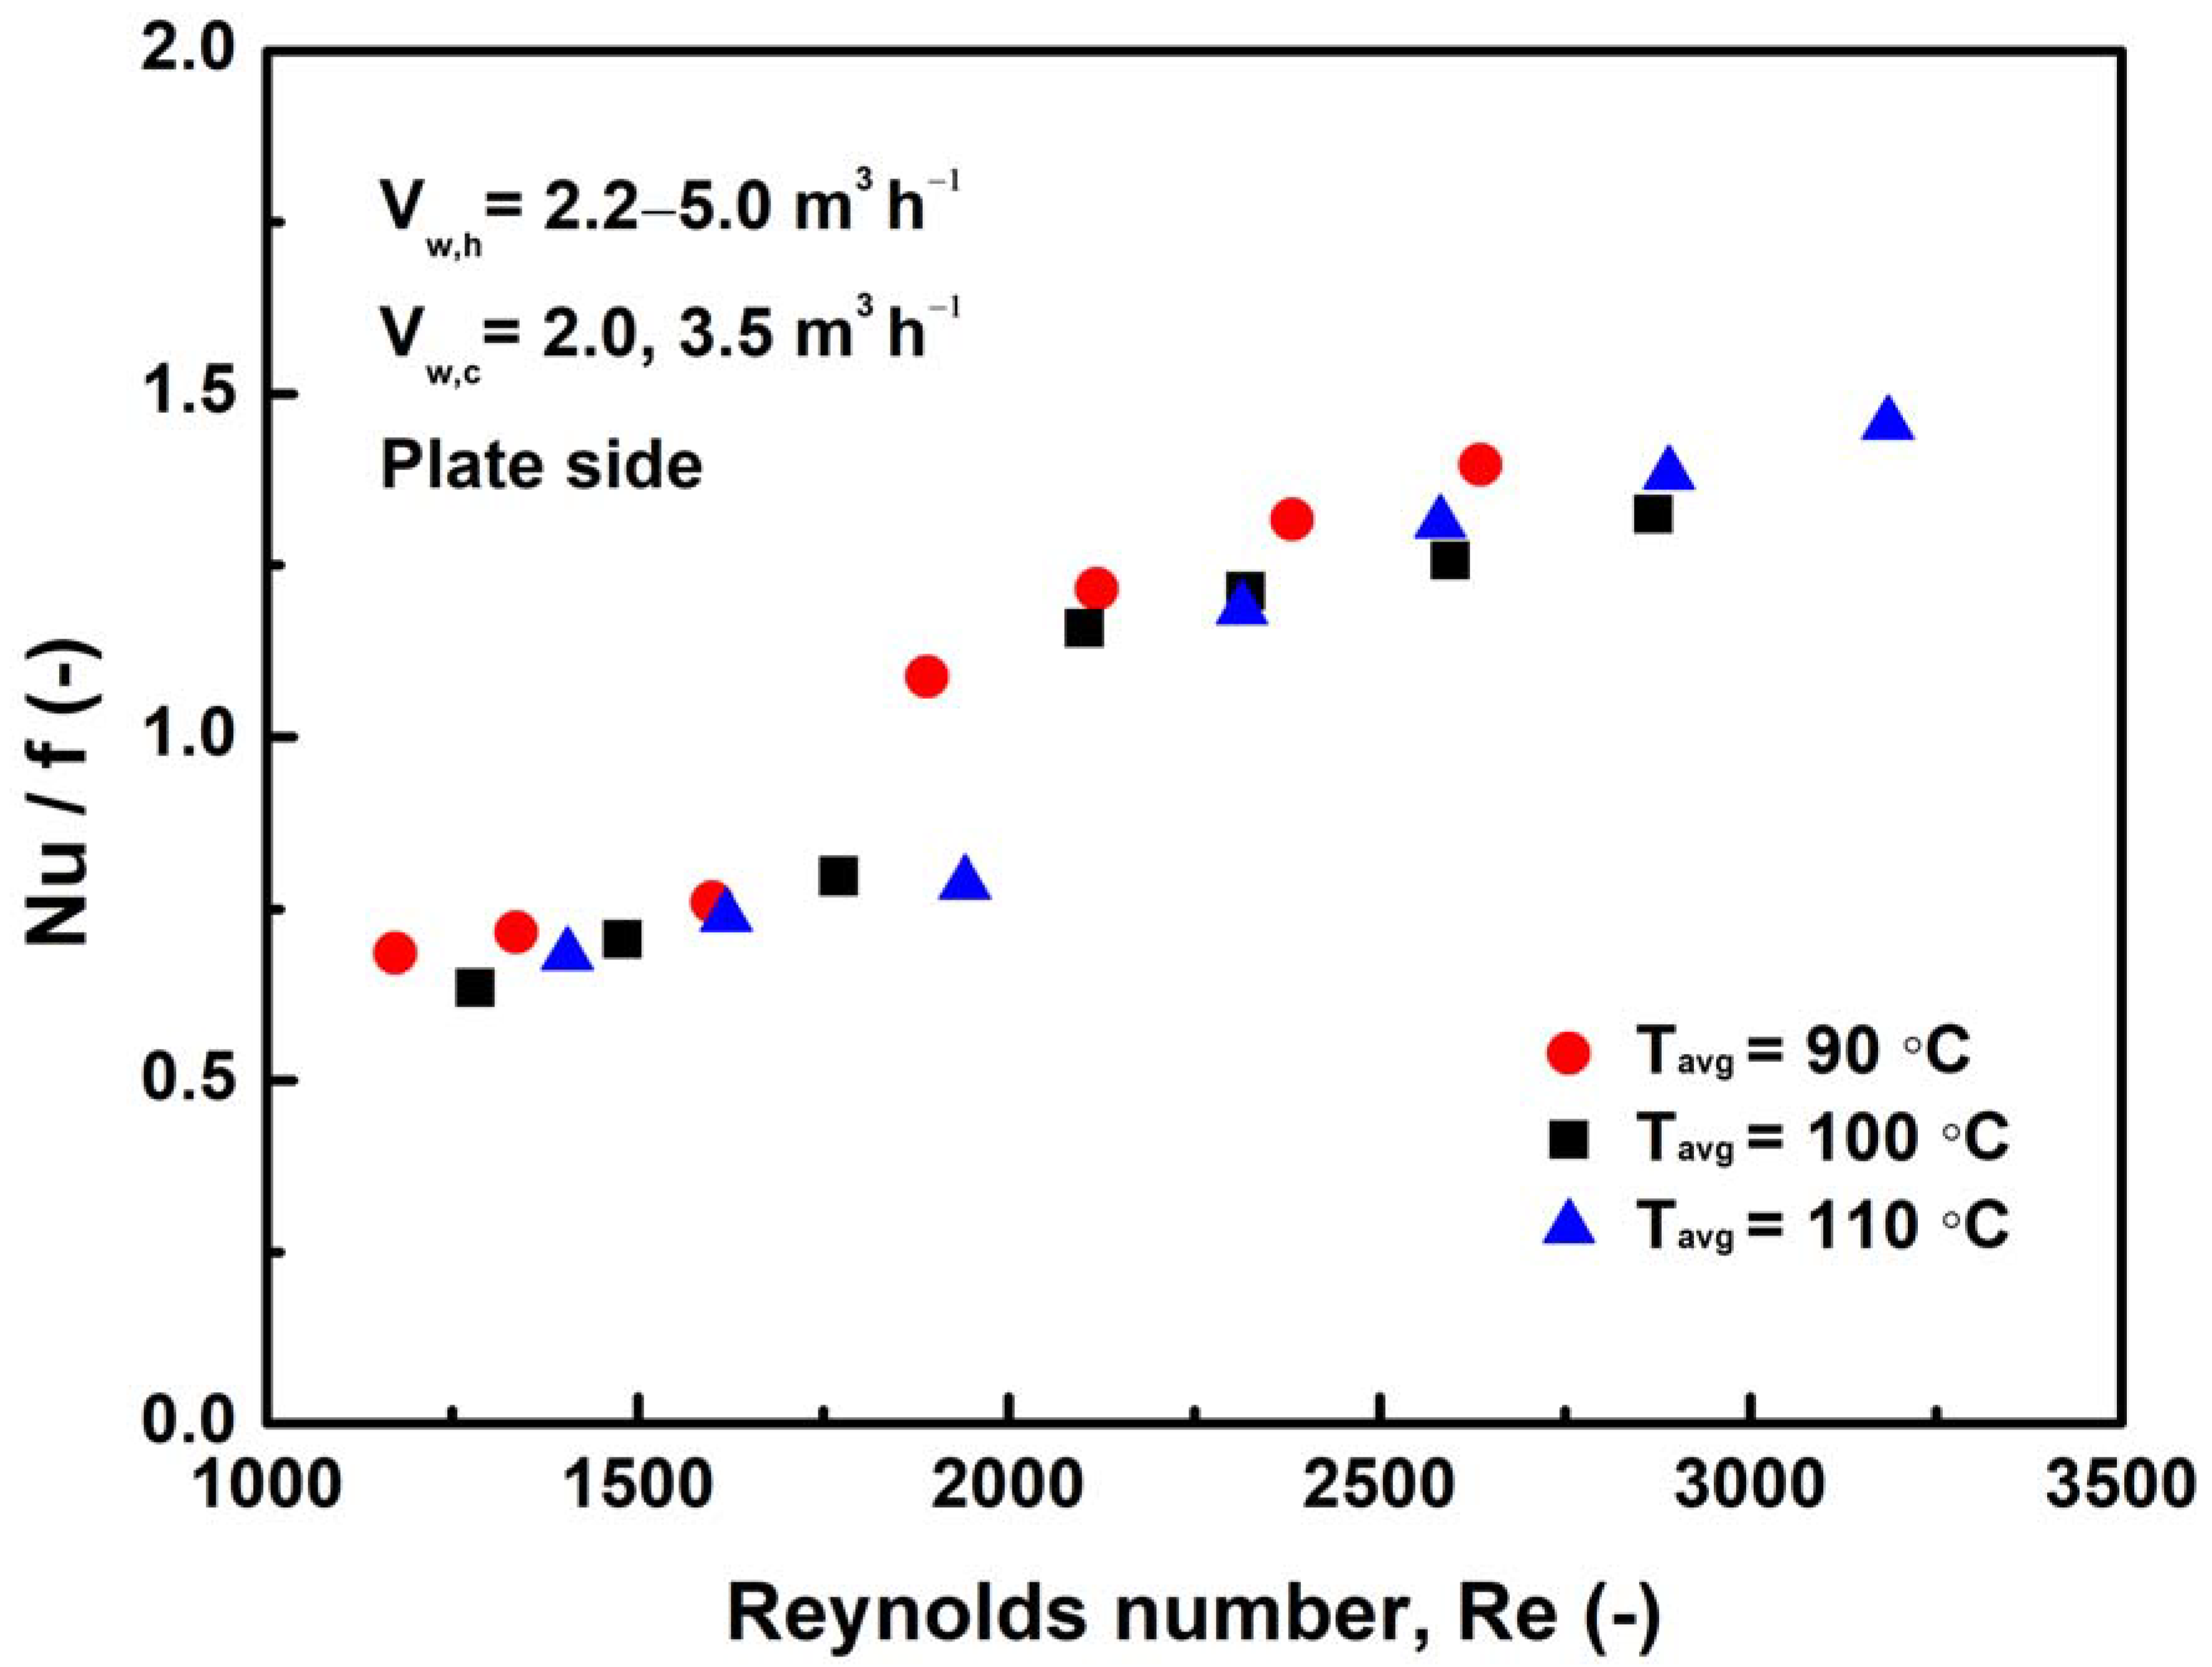
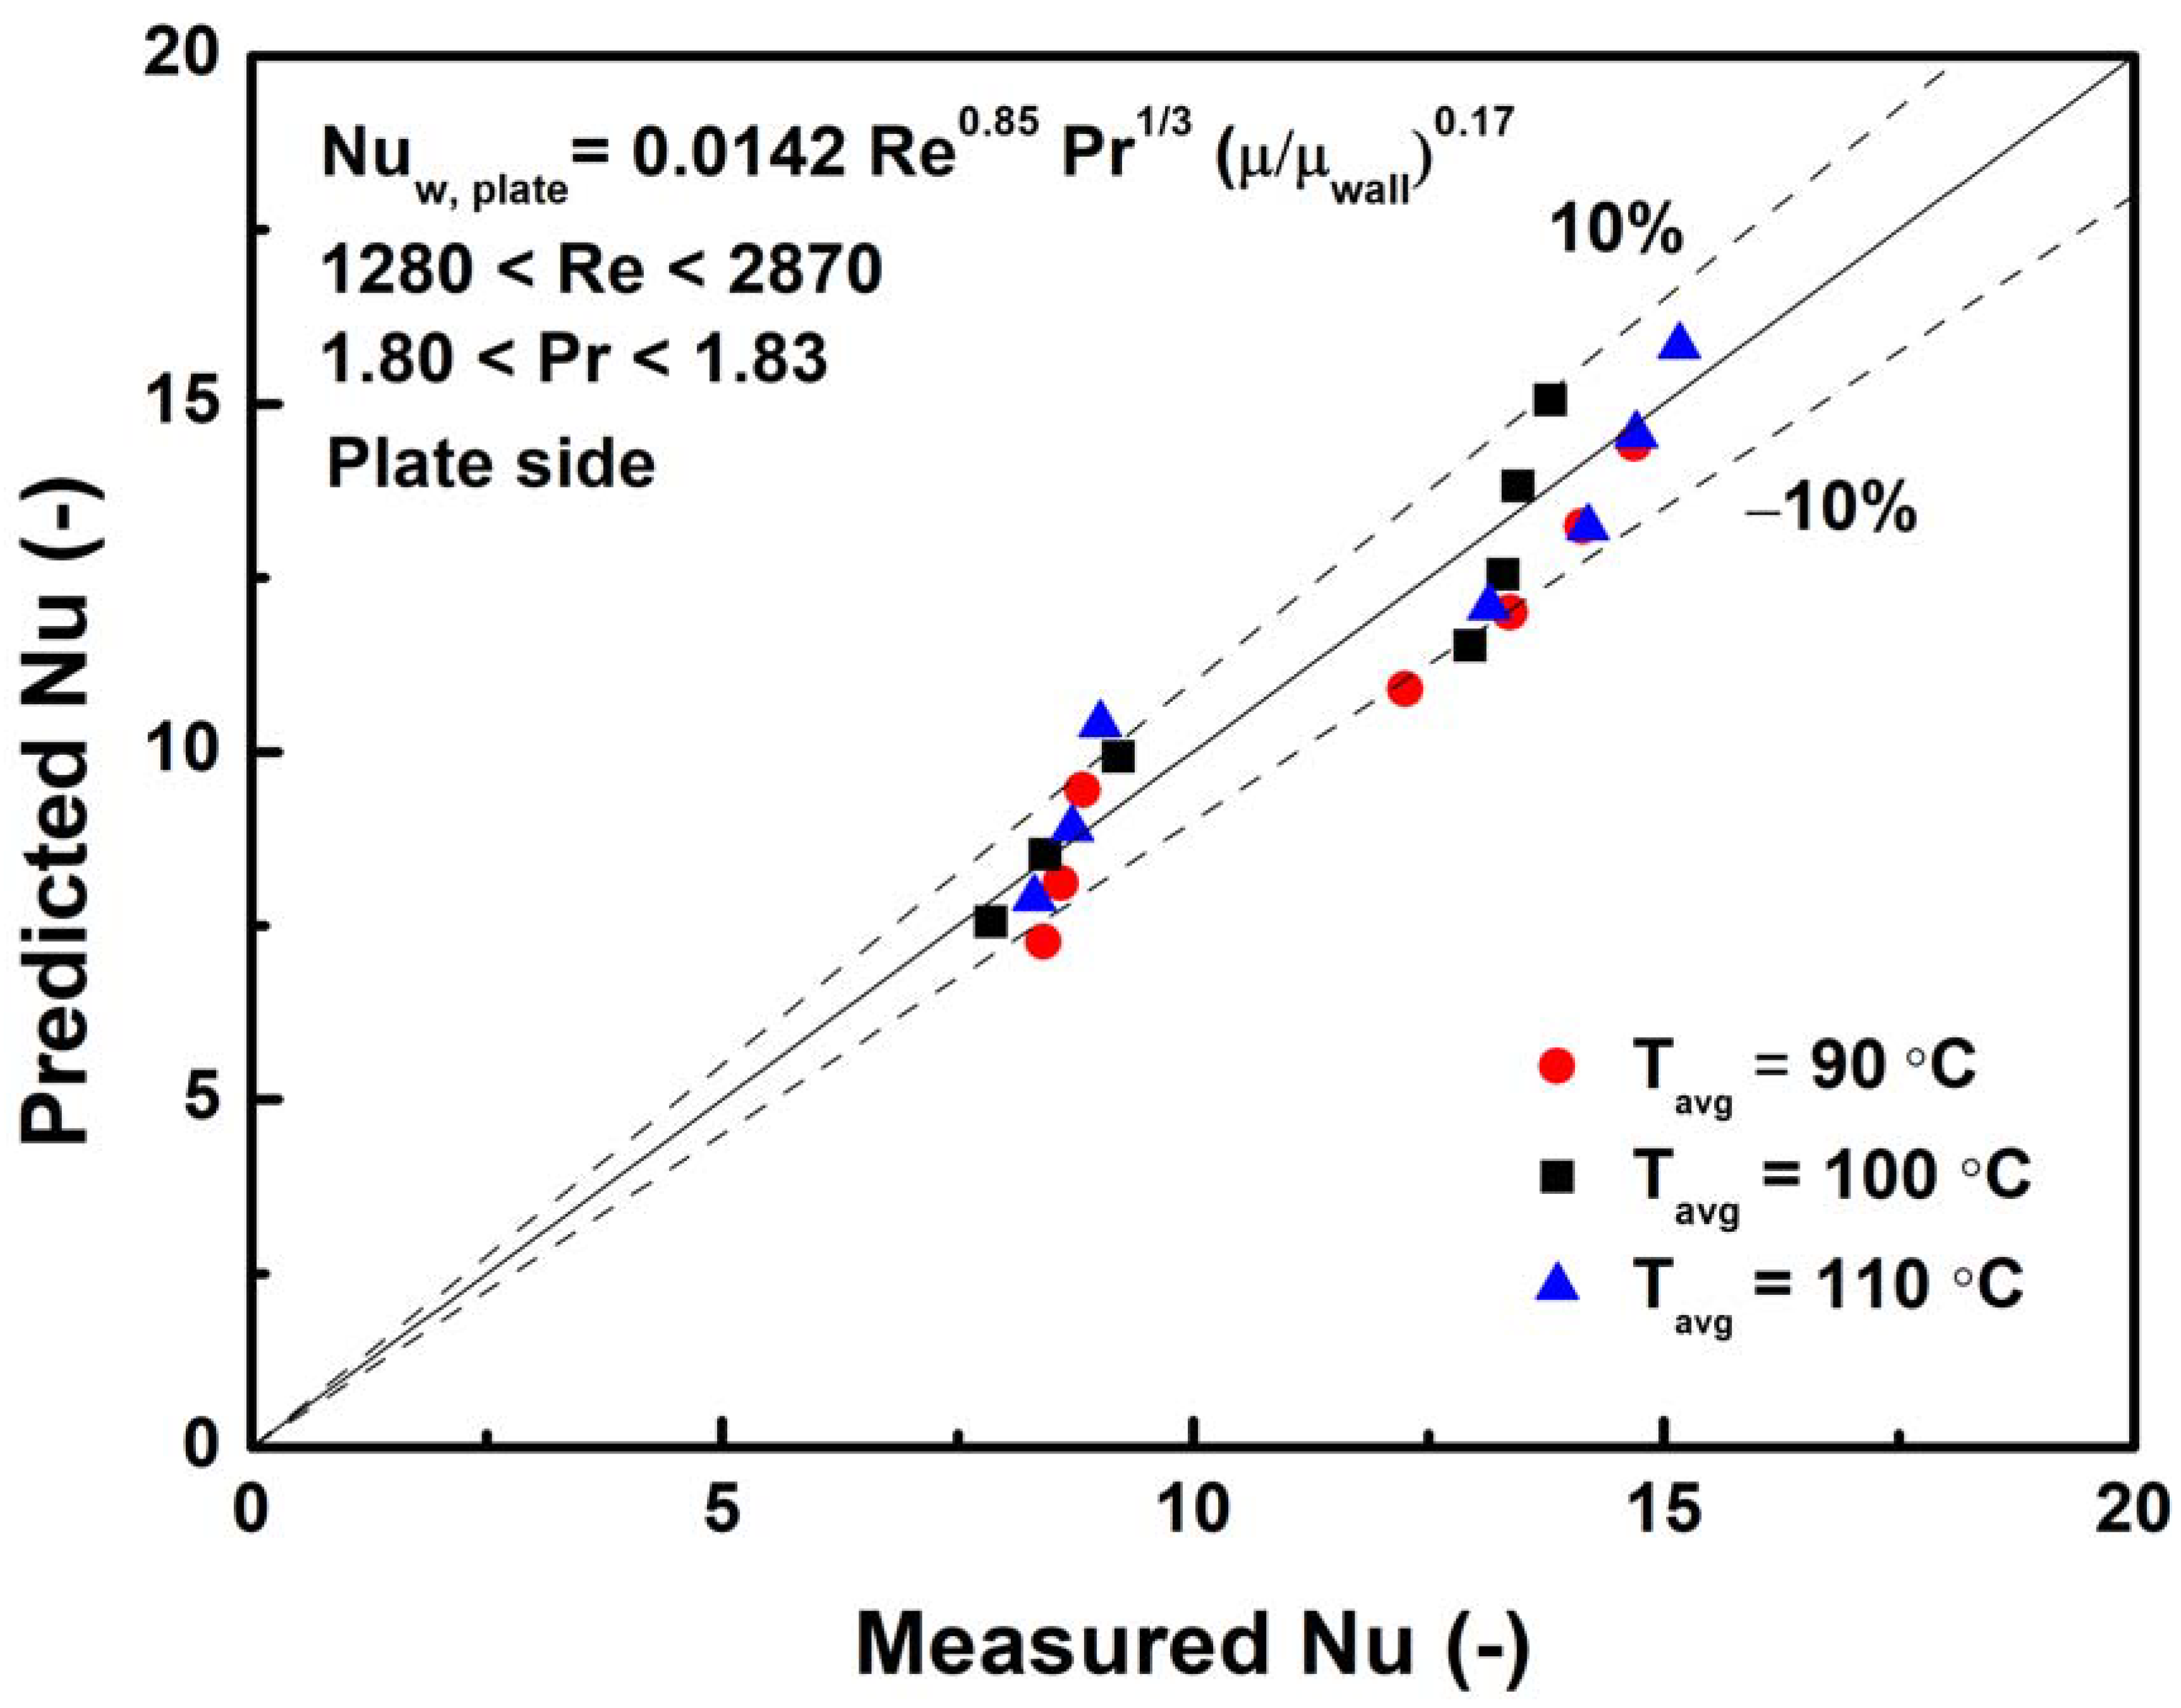
3.1. Convective Heat Transfer Coefficient
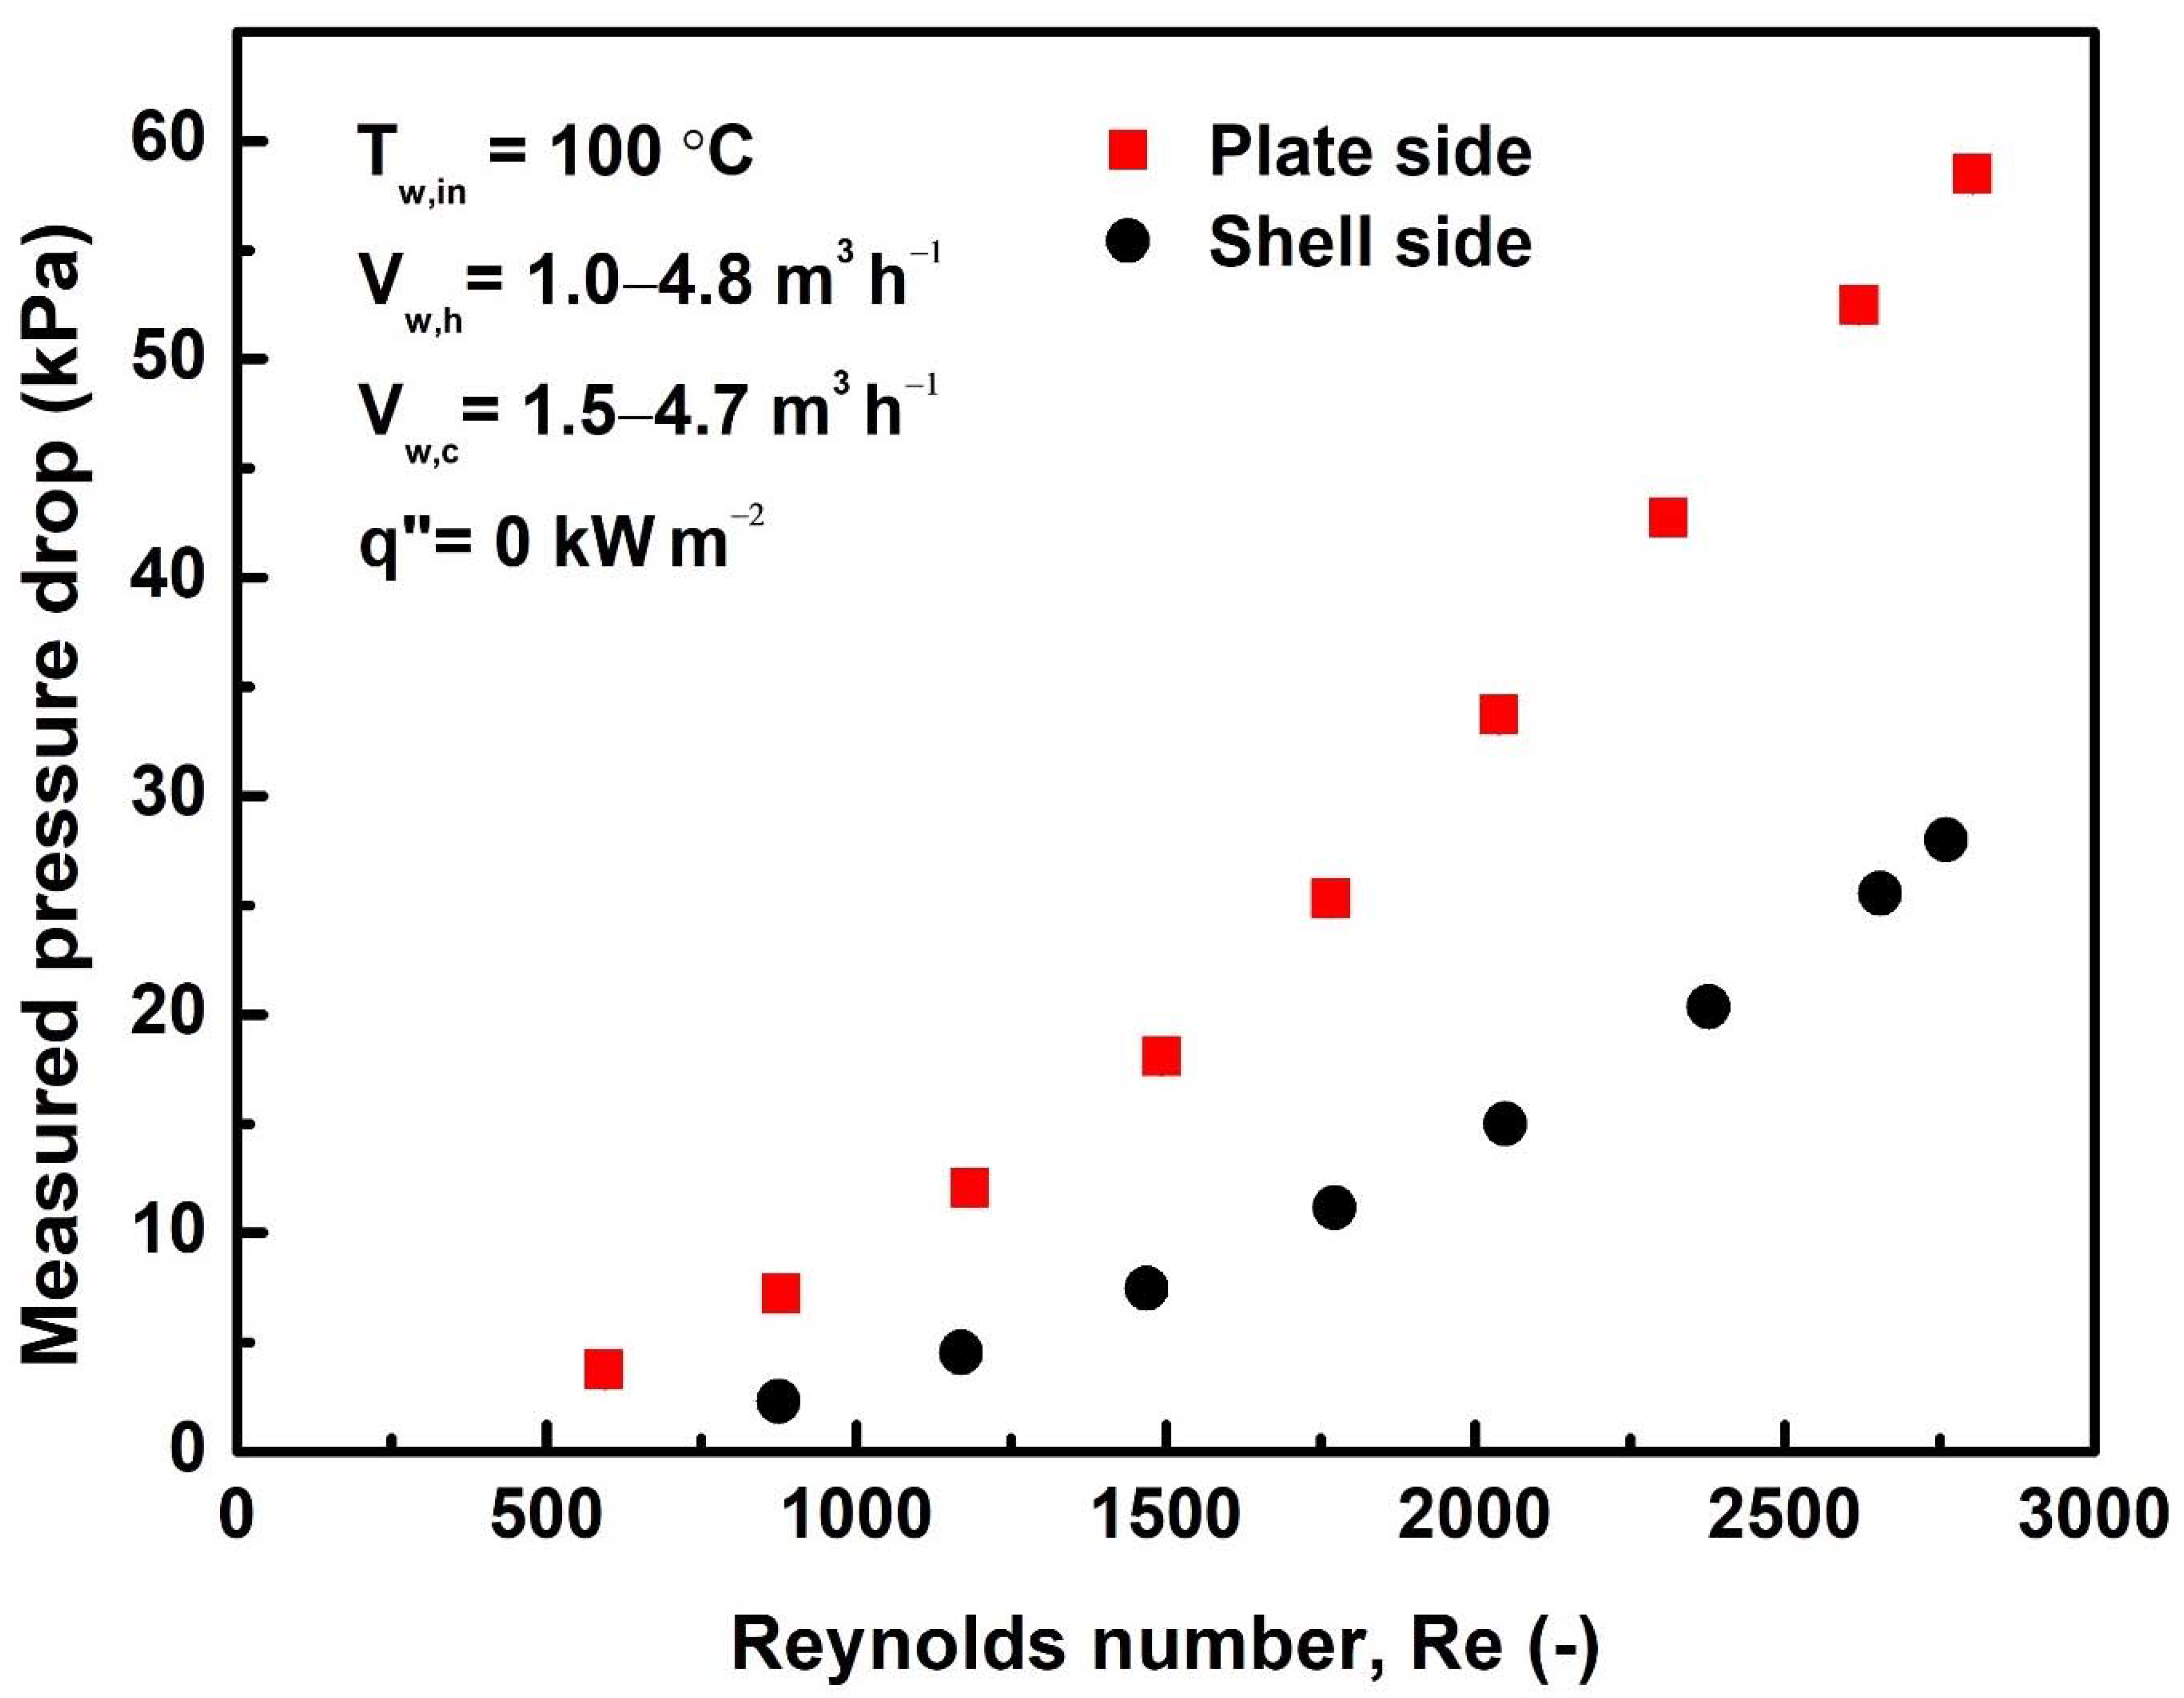
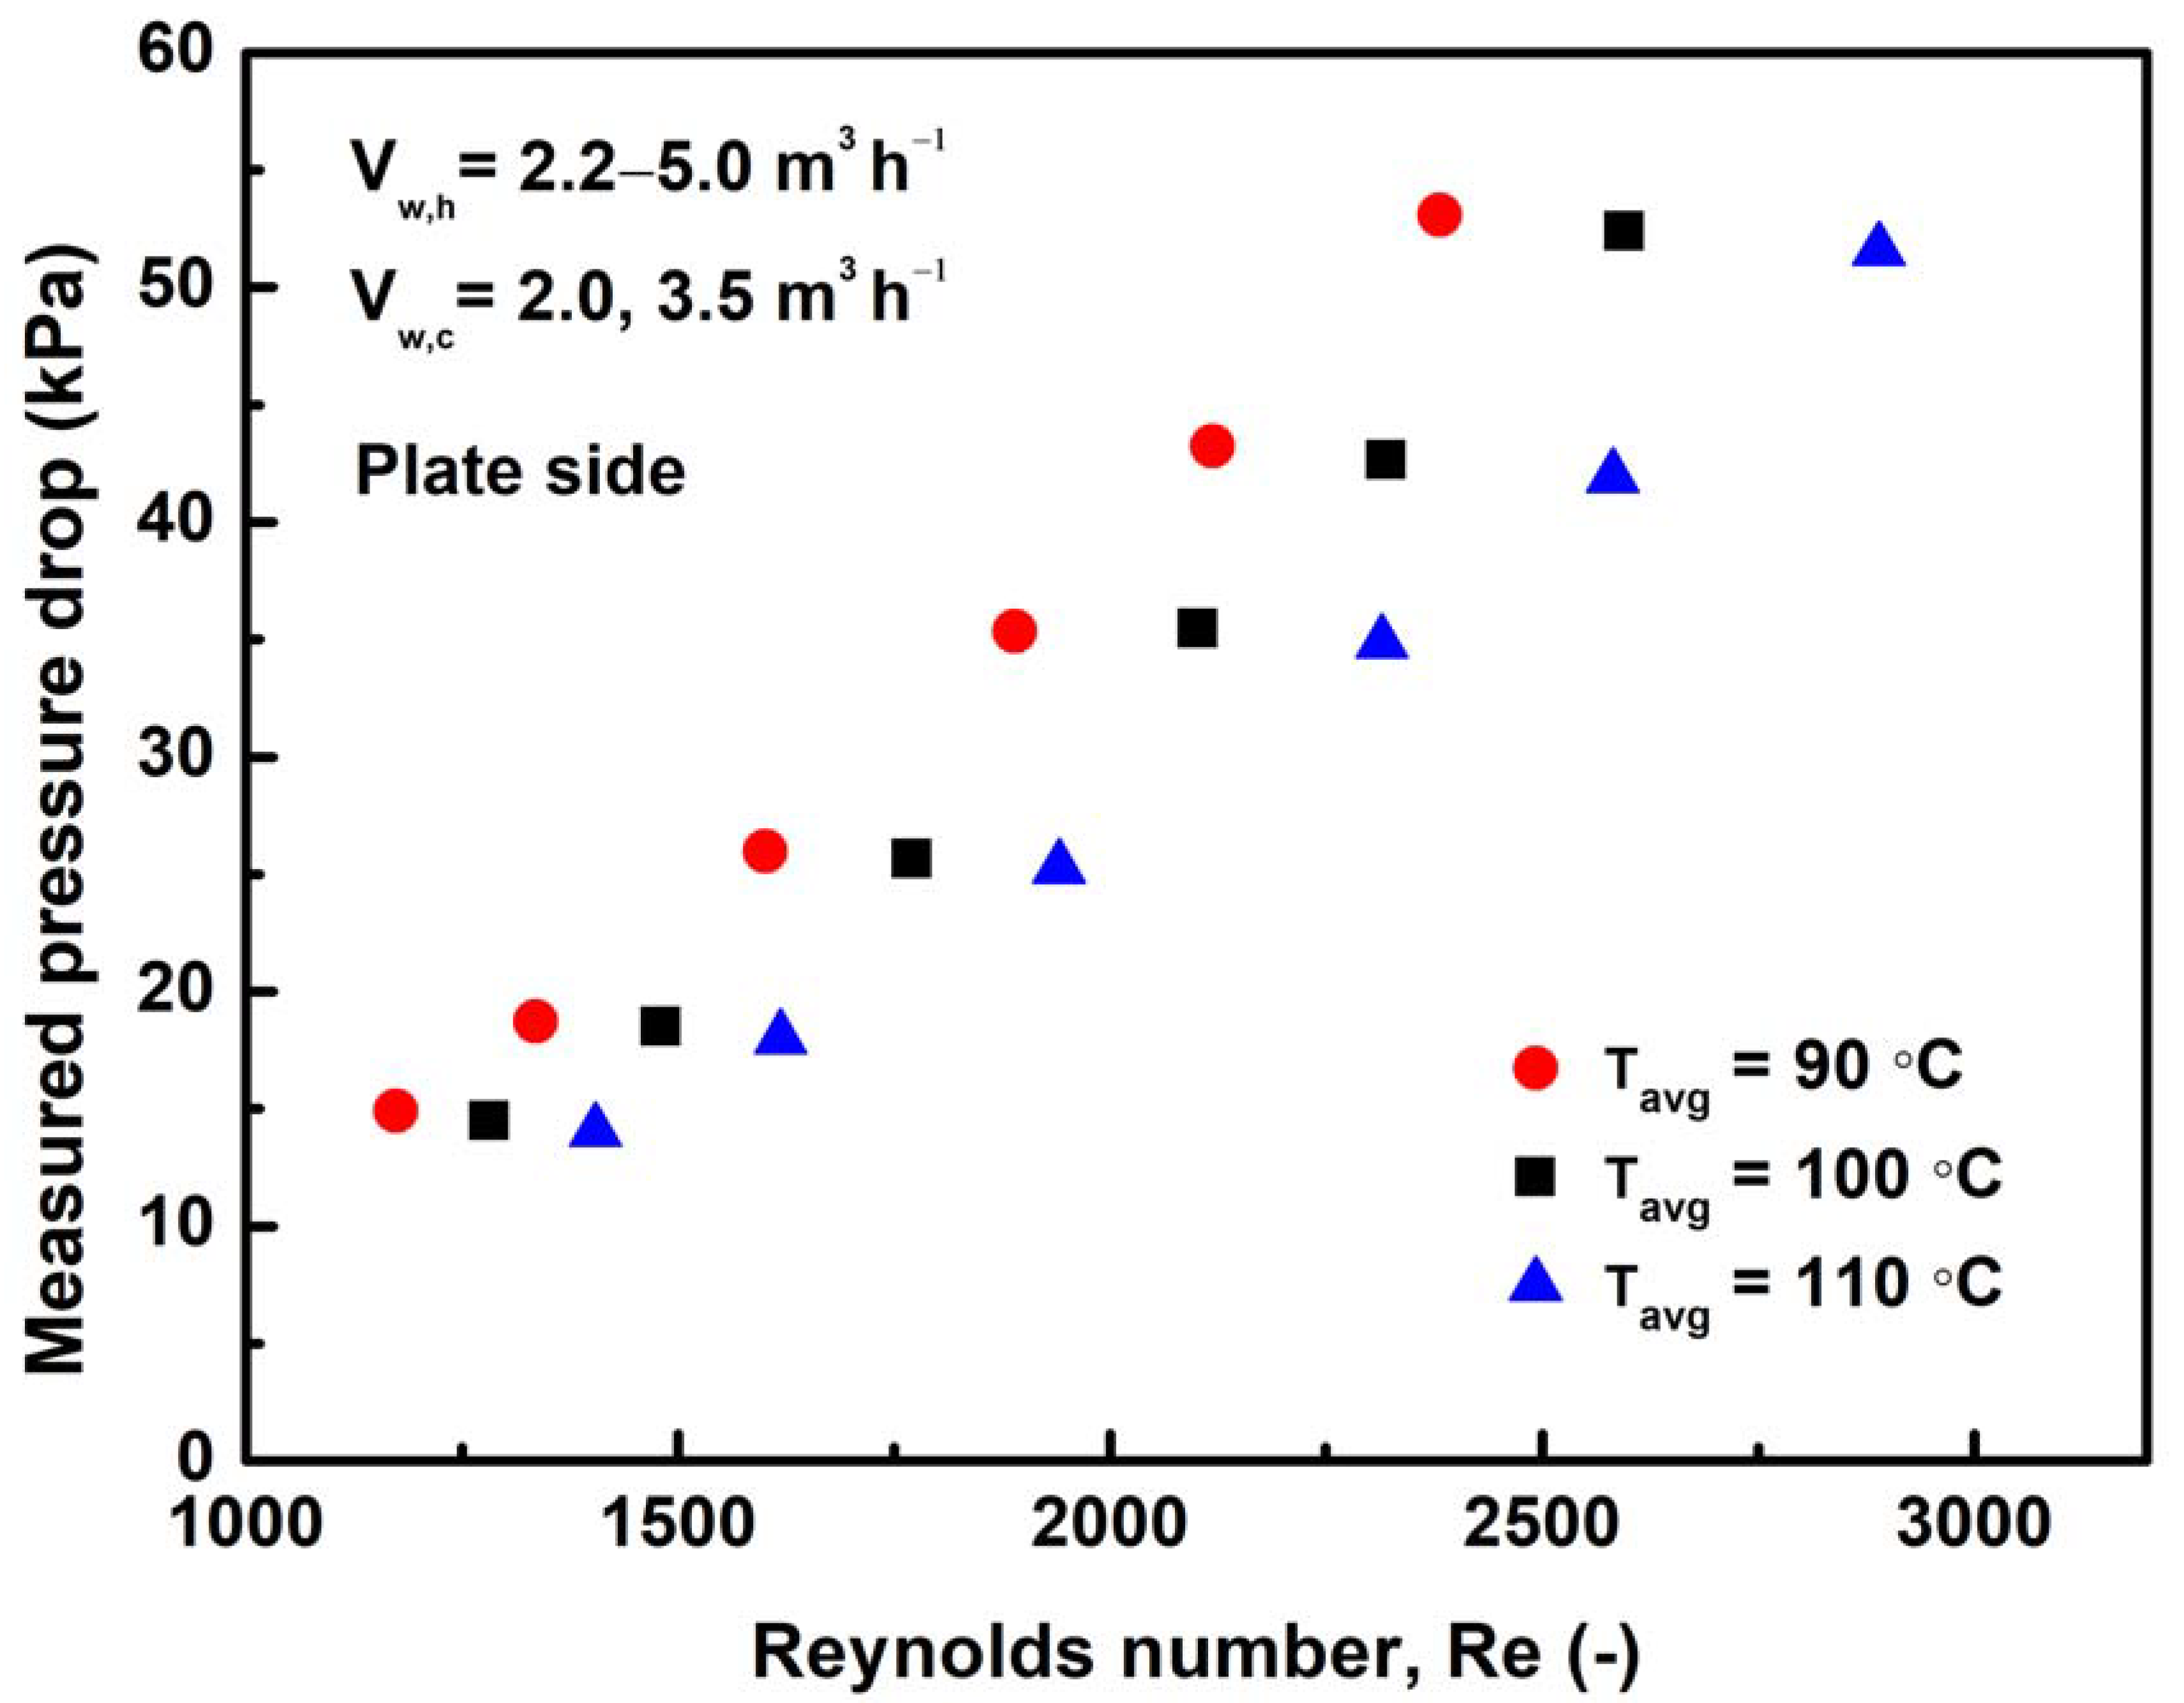
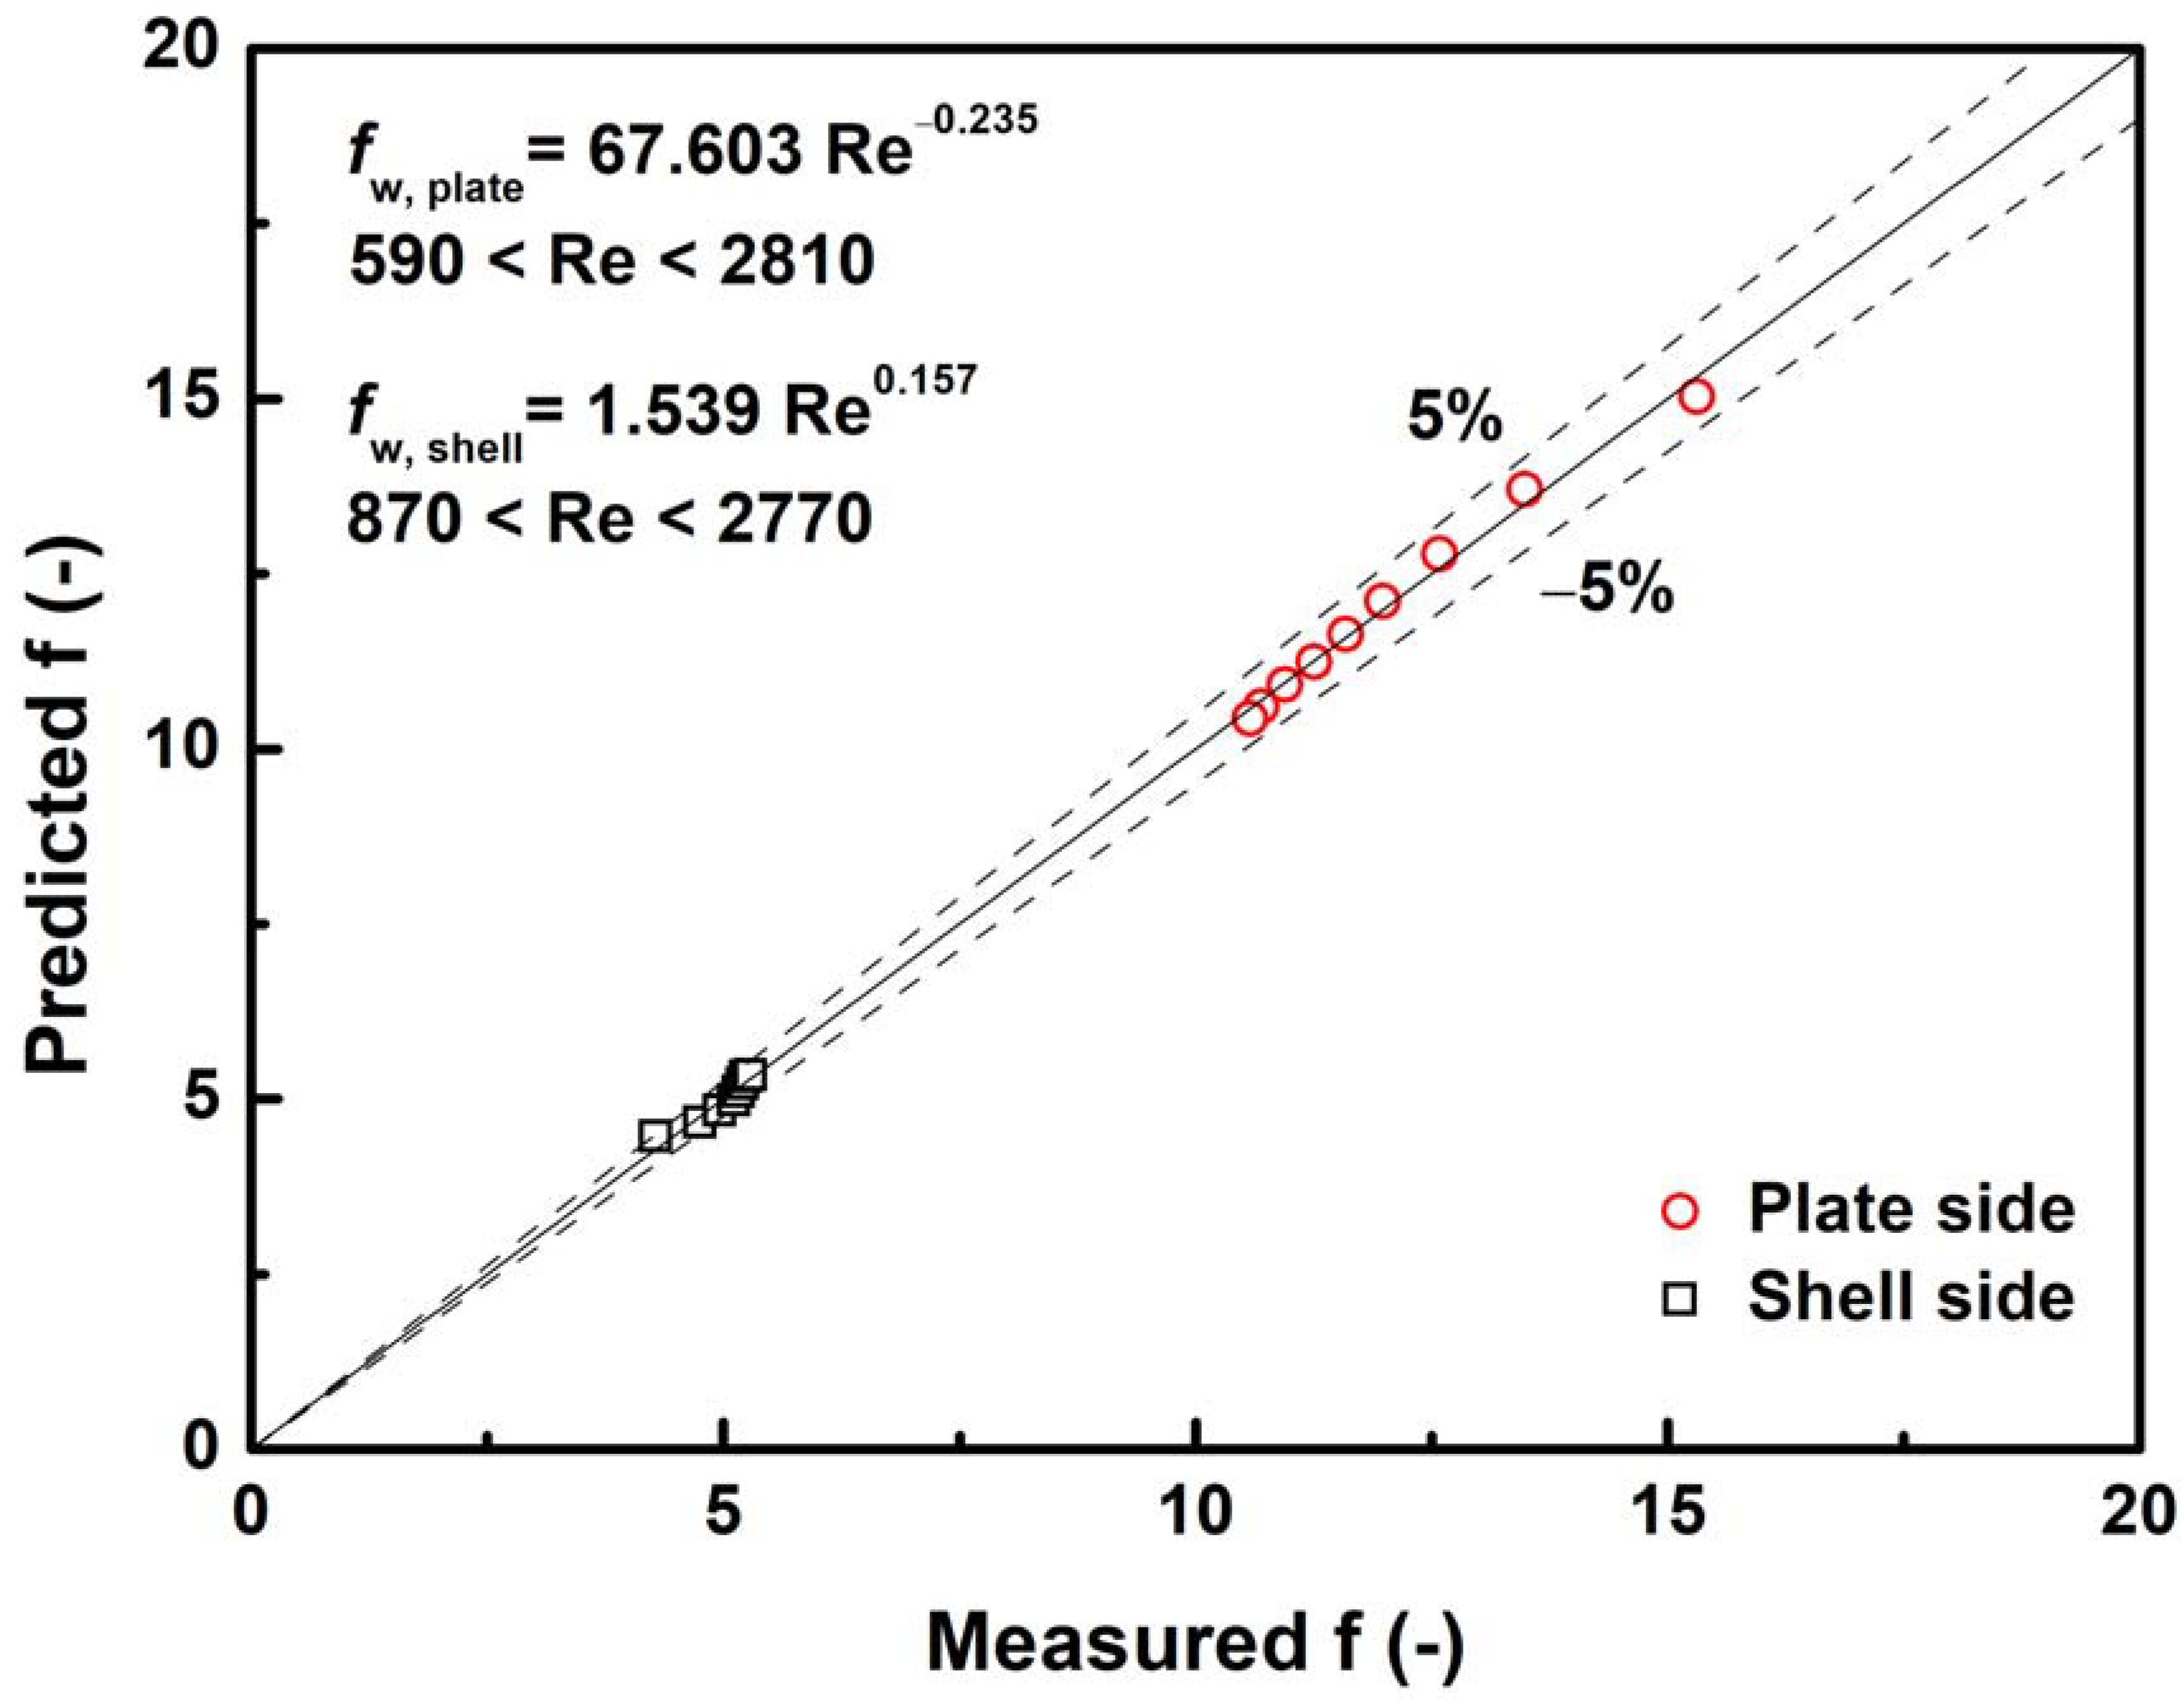
Figure 5 shows the variation in the overall heat transfer coefficient with respect to the Re on the plate side of the PSHE. The volumetric flow rate on the plate side of the PSHE was varied from 2.2 m3 h−1 to 5.0 m3 h−1, while that on the shell side was maintained at 2.0 m3 h−1 and 3.5 m3 h−1. As the Re on the plate side of the PSHE increased, the overall heat transfer coefficient increased owing to the increased turbulence effect on the plate side. However, the increase in the overall heat transfer coefficient according to the Re was relatively small in the tested range. Furthermore, the overall heat transfer coefficient slightly increased with an increase in the temperature due to the liquid viscosity decrease. Additionally, the overall heat transfer coefficient at a shell-side velocity of 3.5 m3 h−1 was substantially higher than that at 2.0 m3 h−1 owing to the increased heat transfer coefficient on the shell side.
The convective heat transfer coefficients of water on the plate and shell sides of the PSHE were estimated using the modified Wilson plot method [15,16]. The convective heat transfer coefficient of water in the PSHE can be expressed by Equation (15). In this study, the exponents of Pr and viscosity term were fixed at 1/3 and 0.17, respectively, according to Lee et al. [16] and Heavner et al. [17].
h w = C k w D h Re n Pr 1 / 3 ( μ μ w a l l ) y
A correlation between the convective heat transfer coefficients of water on the plate and shell sides of the PSHE was represented by Equations (16) and (17). Here, f1 and f2 represent the fluids on the plate and shell sides, respectively.
X = k f 1 D h Re f 1 n Pr f 1 1 / 3 ( μ f 1 μ w a l l ) 0.17 k f 2 D h Re f 2 n Pr f 2 1 / 3 ( μ f 2 μ w a l l ) 0.17
Y = ( 1 U t k w a l l ) k f 1 D h Re f 1 n Pr f 1 1 / 3 ( μ f 1 μ w a l l ) 0.17
The constant C and the exponent n of Re in Equation (15) were determined using Equations (9), (10), (16) and (17) based on the measured data. Finally, the correlations for the convective heat transfer coefficients of water on the plate and shell sides of the PSHE were developed by Equations (18) and (19), respectively.
Nu w , p l a t e = 0.0142 Re 0.85 Pr 1 / 3 ( μ μ w a l l ) 0.17
Nu w , s h e l l = 0.0636 Re 0.78 Pr 1 / 3 ( μ μ w a l l ) 0.17
Figure 6 compares the measured Nu for water with the predicted value on the plate side of the PSHE using the present correlation. The predicted Nu for water on the plate side was within ±10% of the measured data. Due to the limited data, the present correlation can be guaranteed in the range of 1280 < Re < 2870 for the plate side and 850 < Re < 2230 for the shell side.
Figure 7 shows the variation in the Nu for water with respect to the Re for various existing heat transfer correlations. Generally, the Nu increased with an increase in the Re owing to the increased turbulence effect. However, the predicted Nu on the plate side of the PSHE using the present correlation was significantly lower than that obtained from the previous studies [18,19,20] of the PHE. This may be attributed to the reduction in the cross-sectional heat transfer area on the plate side of the PSHE. The fluid on the plate side flows intensively downward to the center of the plate, whereas the fluid on the shell side flows dispersedly, resulting in a severe flow imbalance between the plate sides. When the PSHE is used for a significant industrial purpose, the reduction in the Nu becomes more substantial under low mass flux conditions.

3.2. Pressure Drop

Figure 8 compares the pressure drops of water between the plate and shell sides of the PSHE. The measured pressure drop increased as the Re increased due to the increased flow velocity for both the plate and shell sides. Meanwhile, as the Re increased, the pressure drop on the plate side increased more rapidly than that on the shell side because of the difference in the pressure drop at the port, flow direction, and flow position on the plate. When the Re was 875, the pressure drops on the plate and shell sides were 7.2 kPa and 4.5 kPa, respectively, showing a difference of 37.5%. When the Re was 2620, the pressure drops on the plate and shell sides were 52.5 kPa and 25.5 kPa, respectively, making a difference of 51.4%. The pressure drop on the plate side was higher than that on the shell side owing to the uneven flow distribution on the plate side. The flow on the plate side intensively flowed through the center of the plate due to the influence of gravity, and the pressure drop on the plate side increased due to the more substantial increase in turbulence. However, the flow on the shell side was distributed to the side of the plate and flowed upward in the opposite direction to gravity so that the pressure drop decreased compared to that on the plate side. Additionally, the port pressure drop on the plate side was higher than that on the shell side owing to the uneven flow distribution of the ports on the plate side.
Figure 9 shows the variation in the pressure drop of water on the plate side concerning the Re and average temperature. As the temperature decreased, the pressure drop at a given Re increased due to the liquid viscosity and density increase. As the temperature was increased from 90 °C to 100 °C and from 100 °C to 110 °C, the water density was decreased by 0.72% and 0.77%, respectively.
Figure 10 compares the f for water on the plate and shell sides of the PSHE with respect to the Re. The f on the plate side decreased with an increase in the Re on the plate side owing to the increased mass flux, which was the general trend observed in PHEs [8,20,21]. However, the f on the shell side slightly increased with an increase in the Re on the plate side owing to the decreased mass flux on the shell side with the dispersed upward flow.
A correlation of the f for water can be expressed as a function of Re, as shown in Equation (20). Finally, the coefficient b and exponent z of Re on the plate and shell sides of the PSHE were determined based on the measured data, as shown in Equations (21) and (22), respectively.
f = b Re z
f w , p l a t e = 67.603 Re 0.235
f w , s h e l l = 1.539 Re 0.157
Figure 11 compares the predicted f for water using the present correlation with the measured data on the plate and shell sides of the PSHE. The predicted f for water on the plate and shell sides was within ±5% of the measured data. Due to the limited data, the present correlation can be guaranteed in the range of 590 < Re < 2810 for the plate side and 870 < Re < 2770 for the shell side.
Figure 12 shows the variation in the ratio of Nu to f on the plate side with respect to the Re. As the Re increased, the Nu/f increased owing to the increased Nu and decreased f. However, at a lower Re, the value of Nu/f was lower than 1.0 owing to the lower Nu on the plate side. Furthermore, the value of Nu/f was substantially lower than that for condensation heat transfer of R-1233zd(E) in PSHEs [8]. This may be attributed to the flow imbalance on a large circular plate.

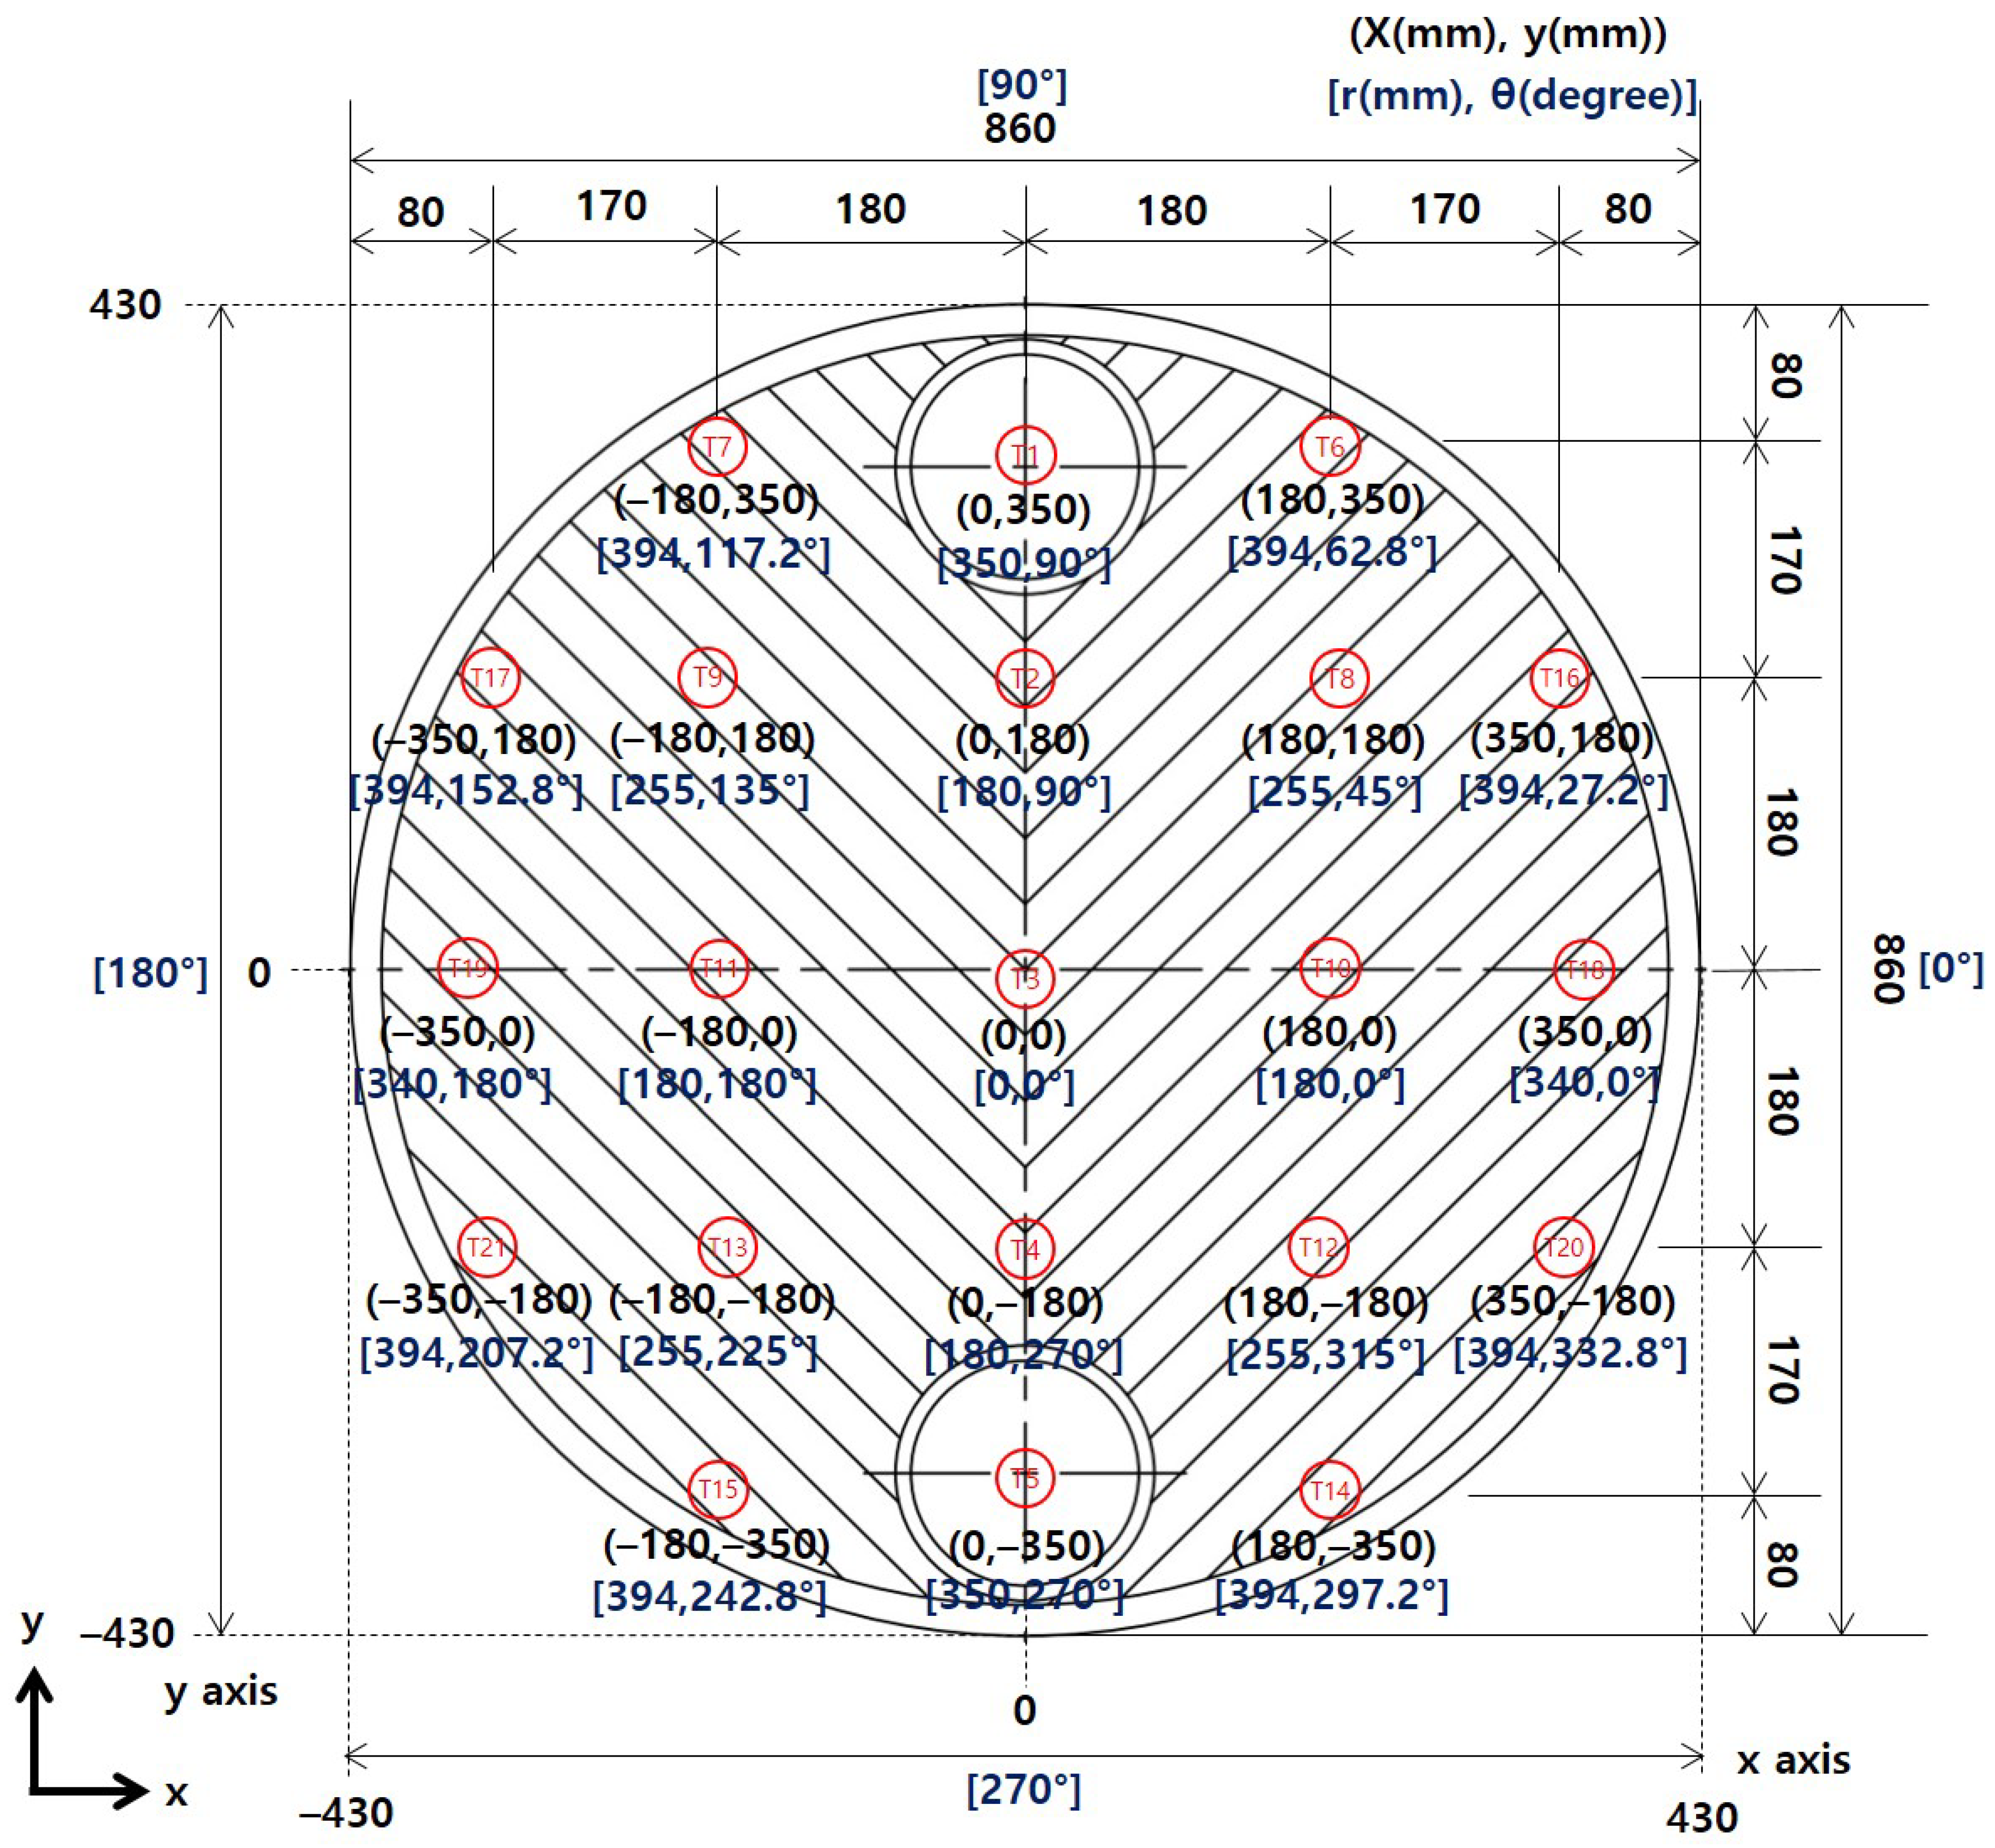
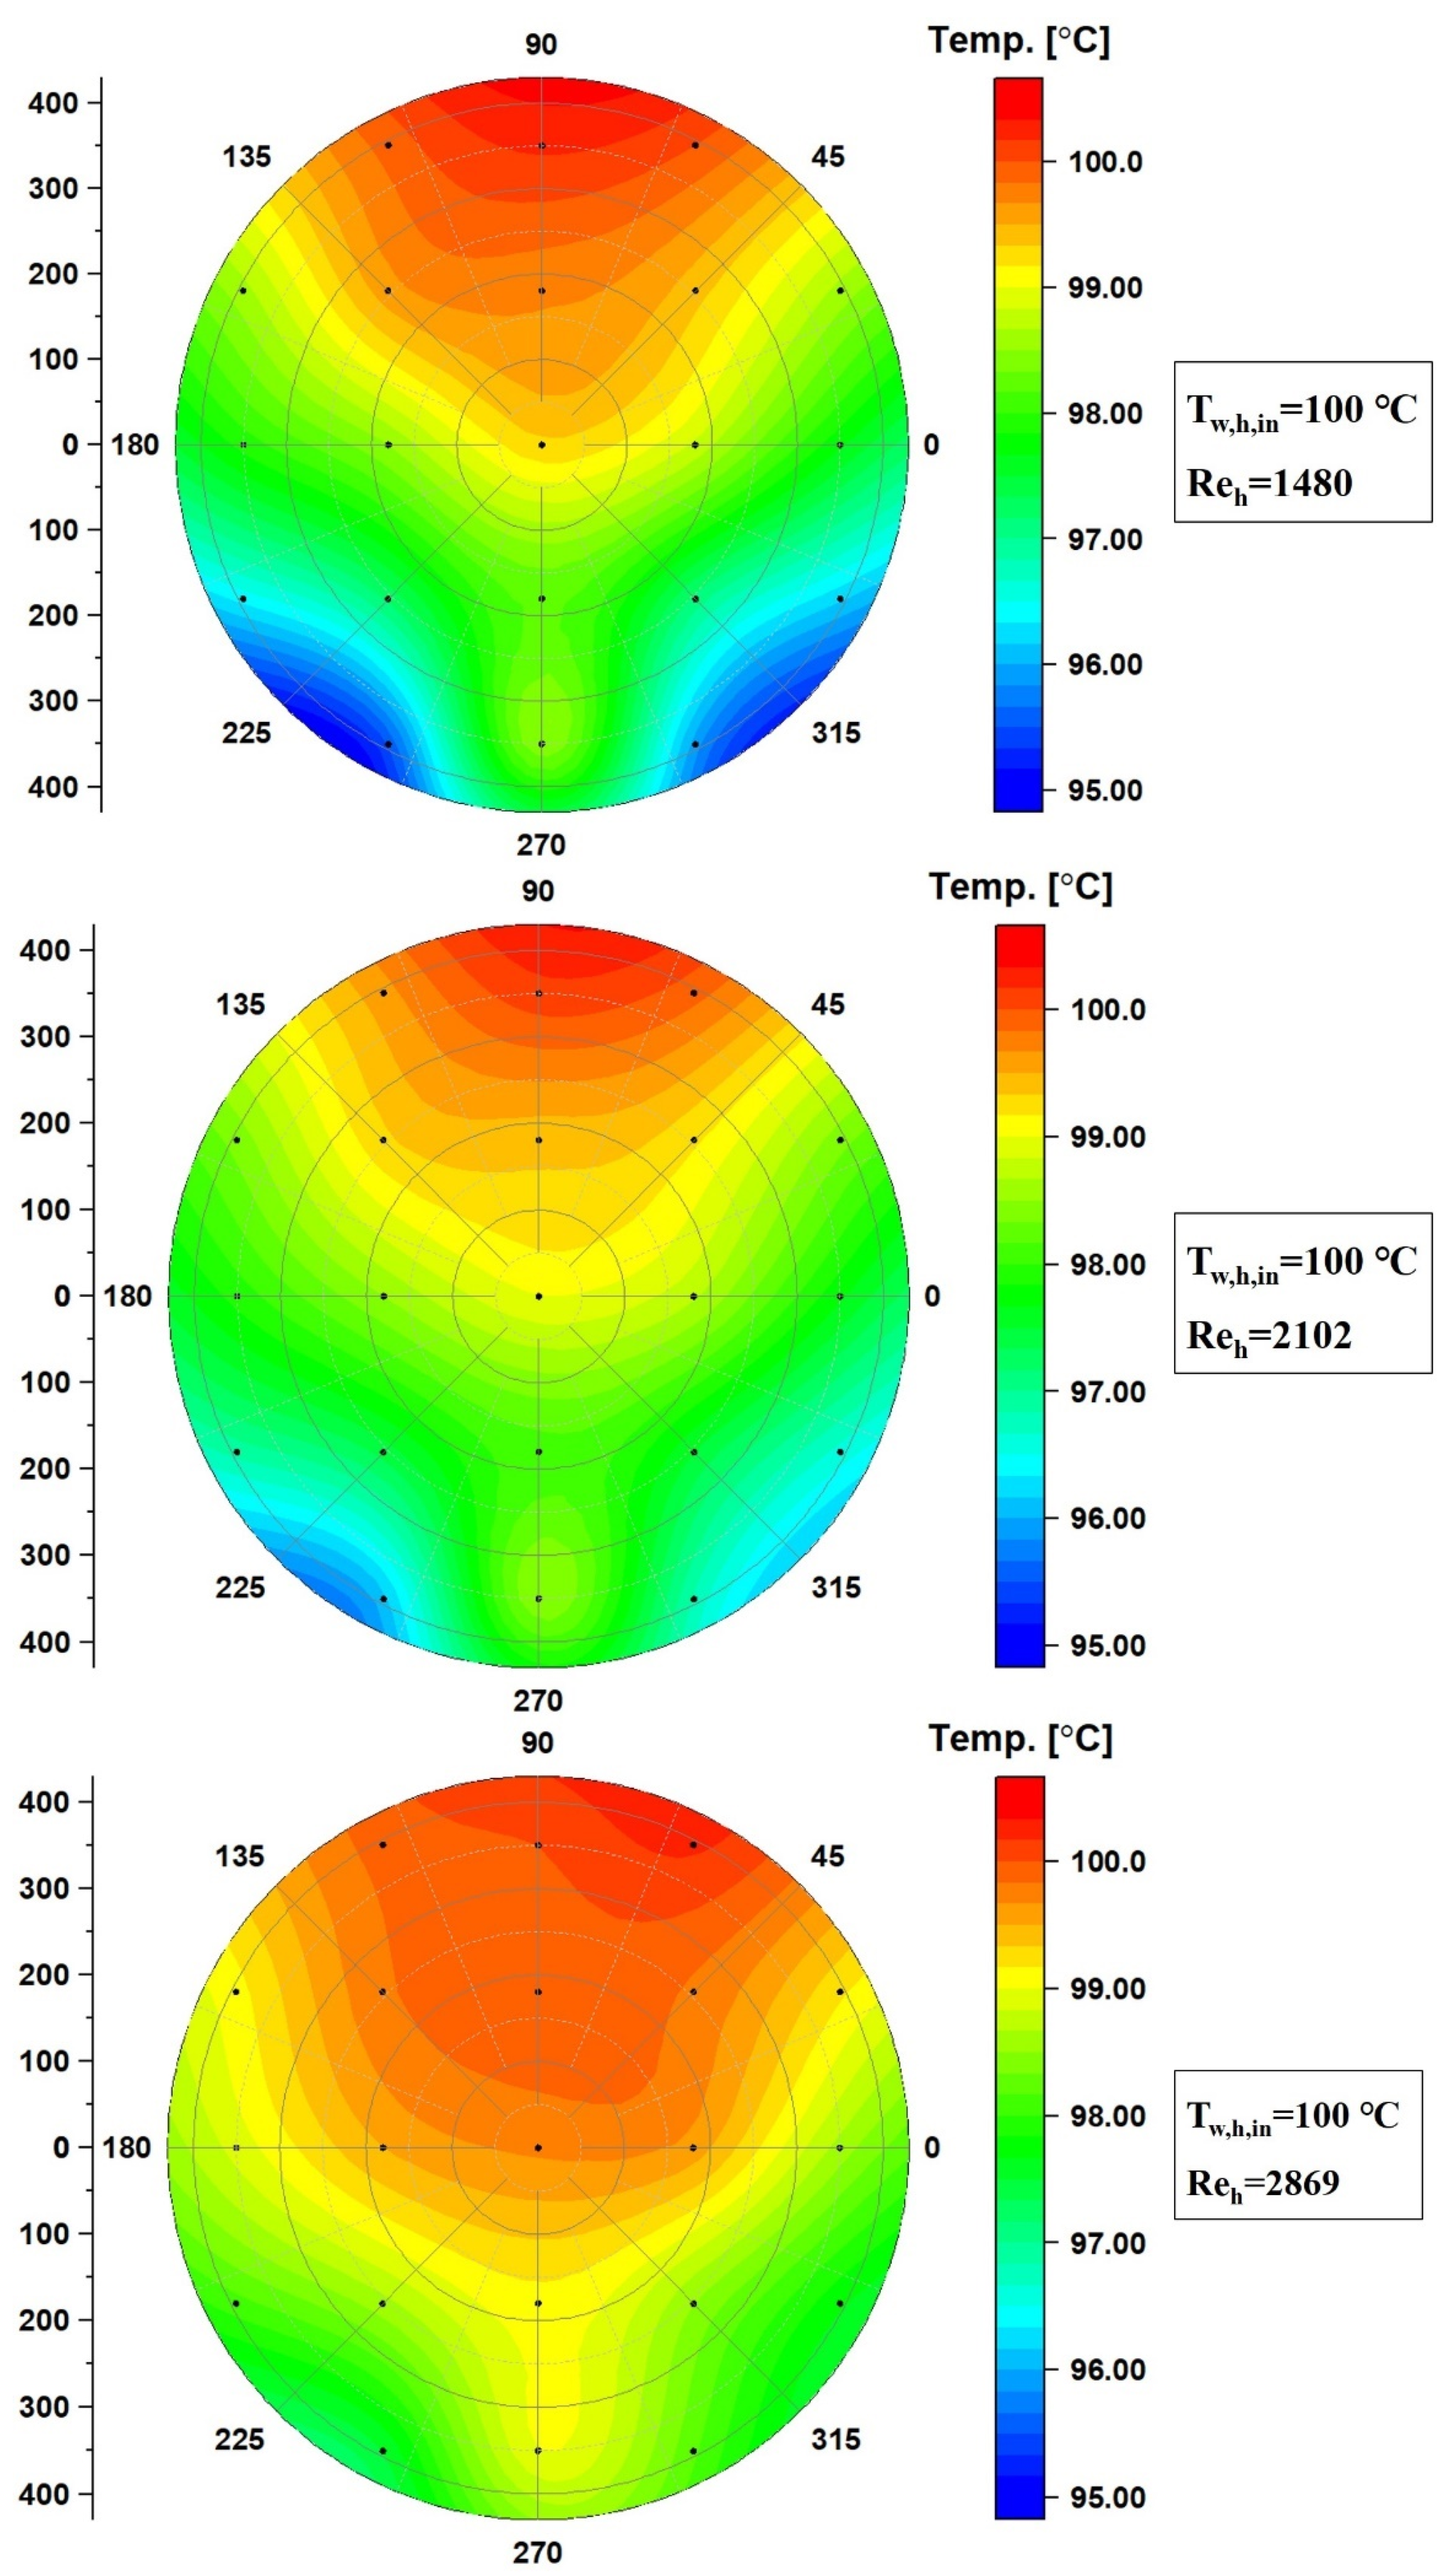
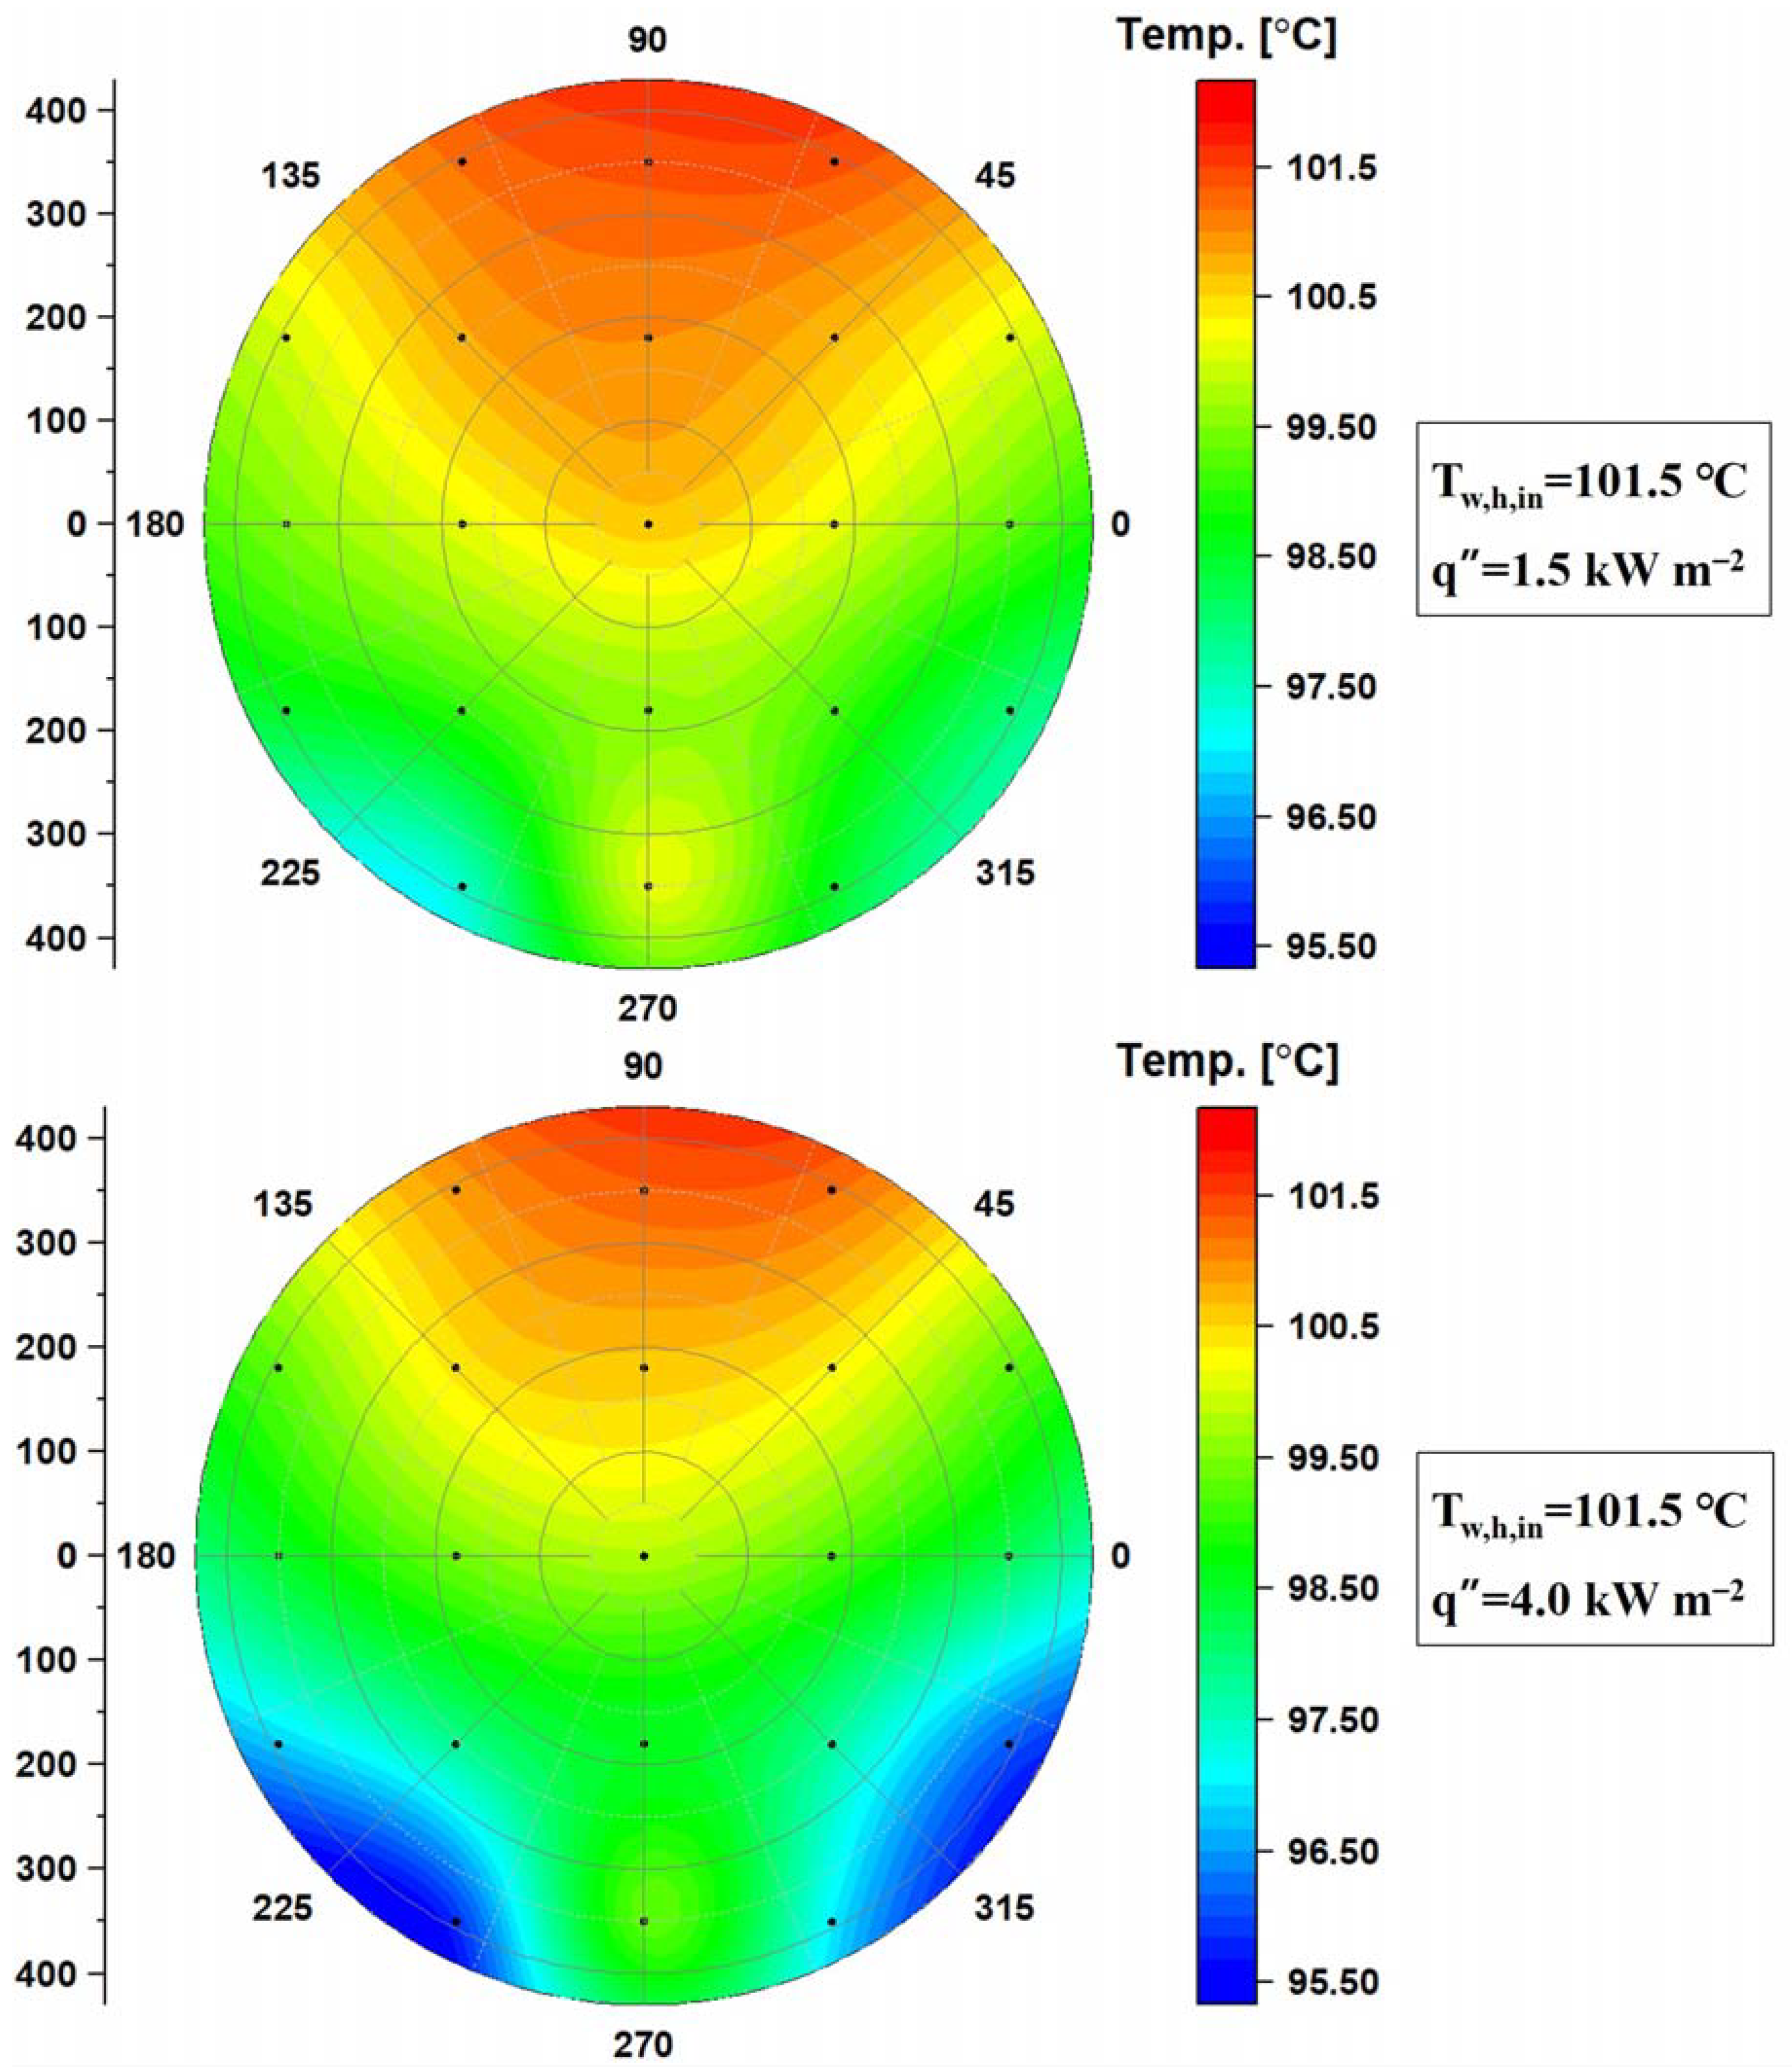
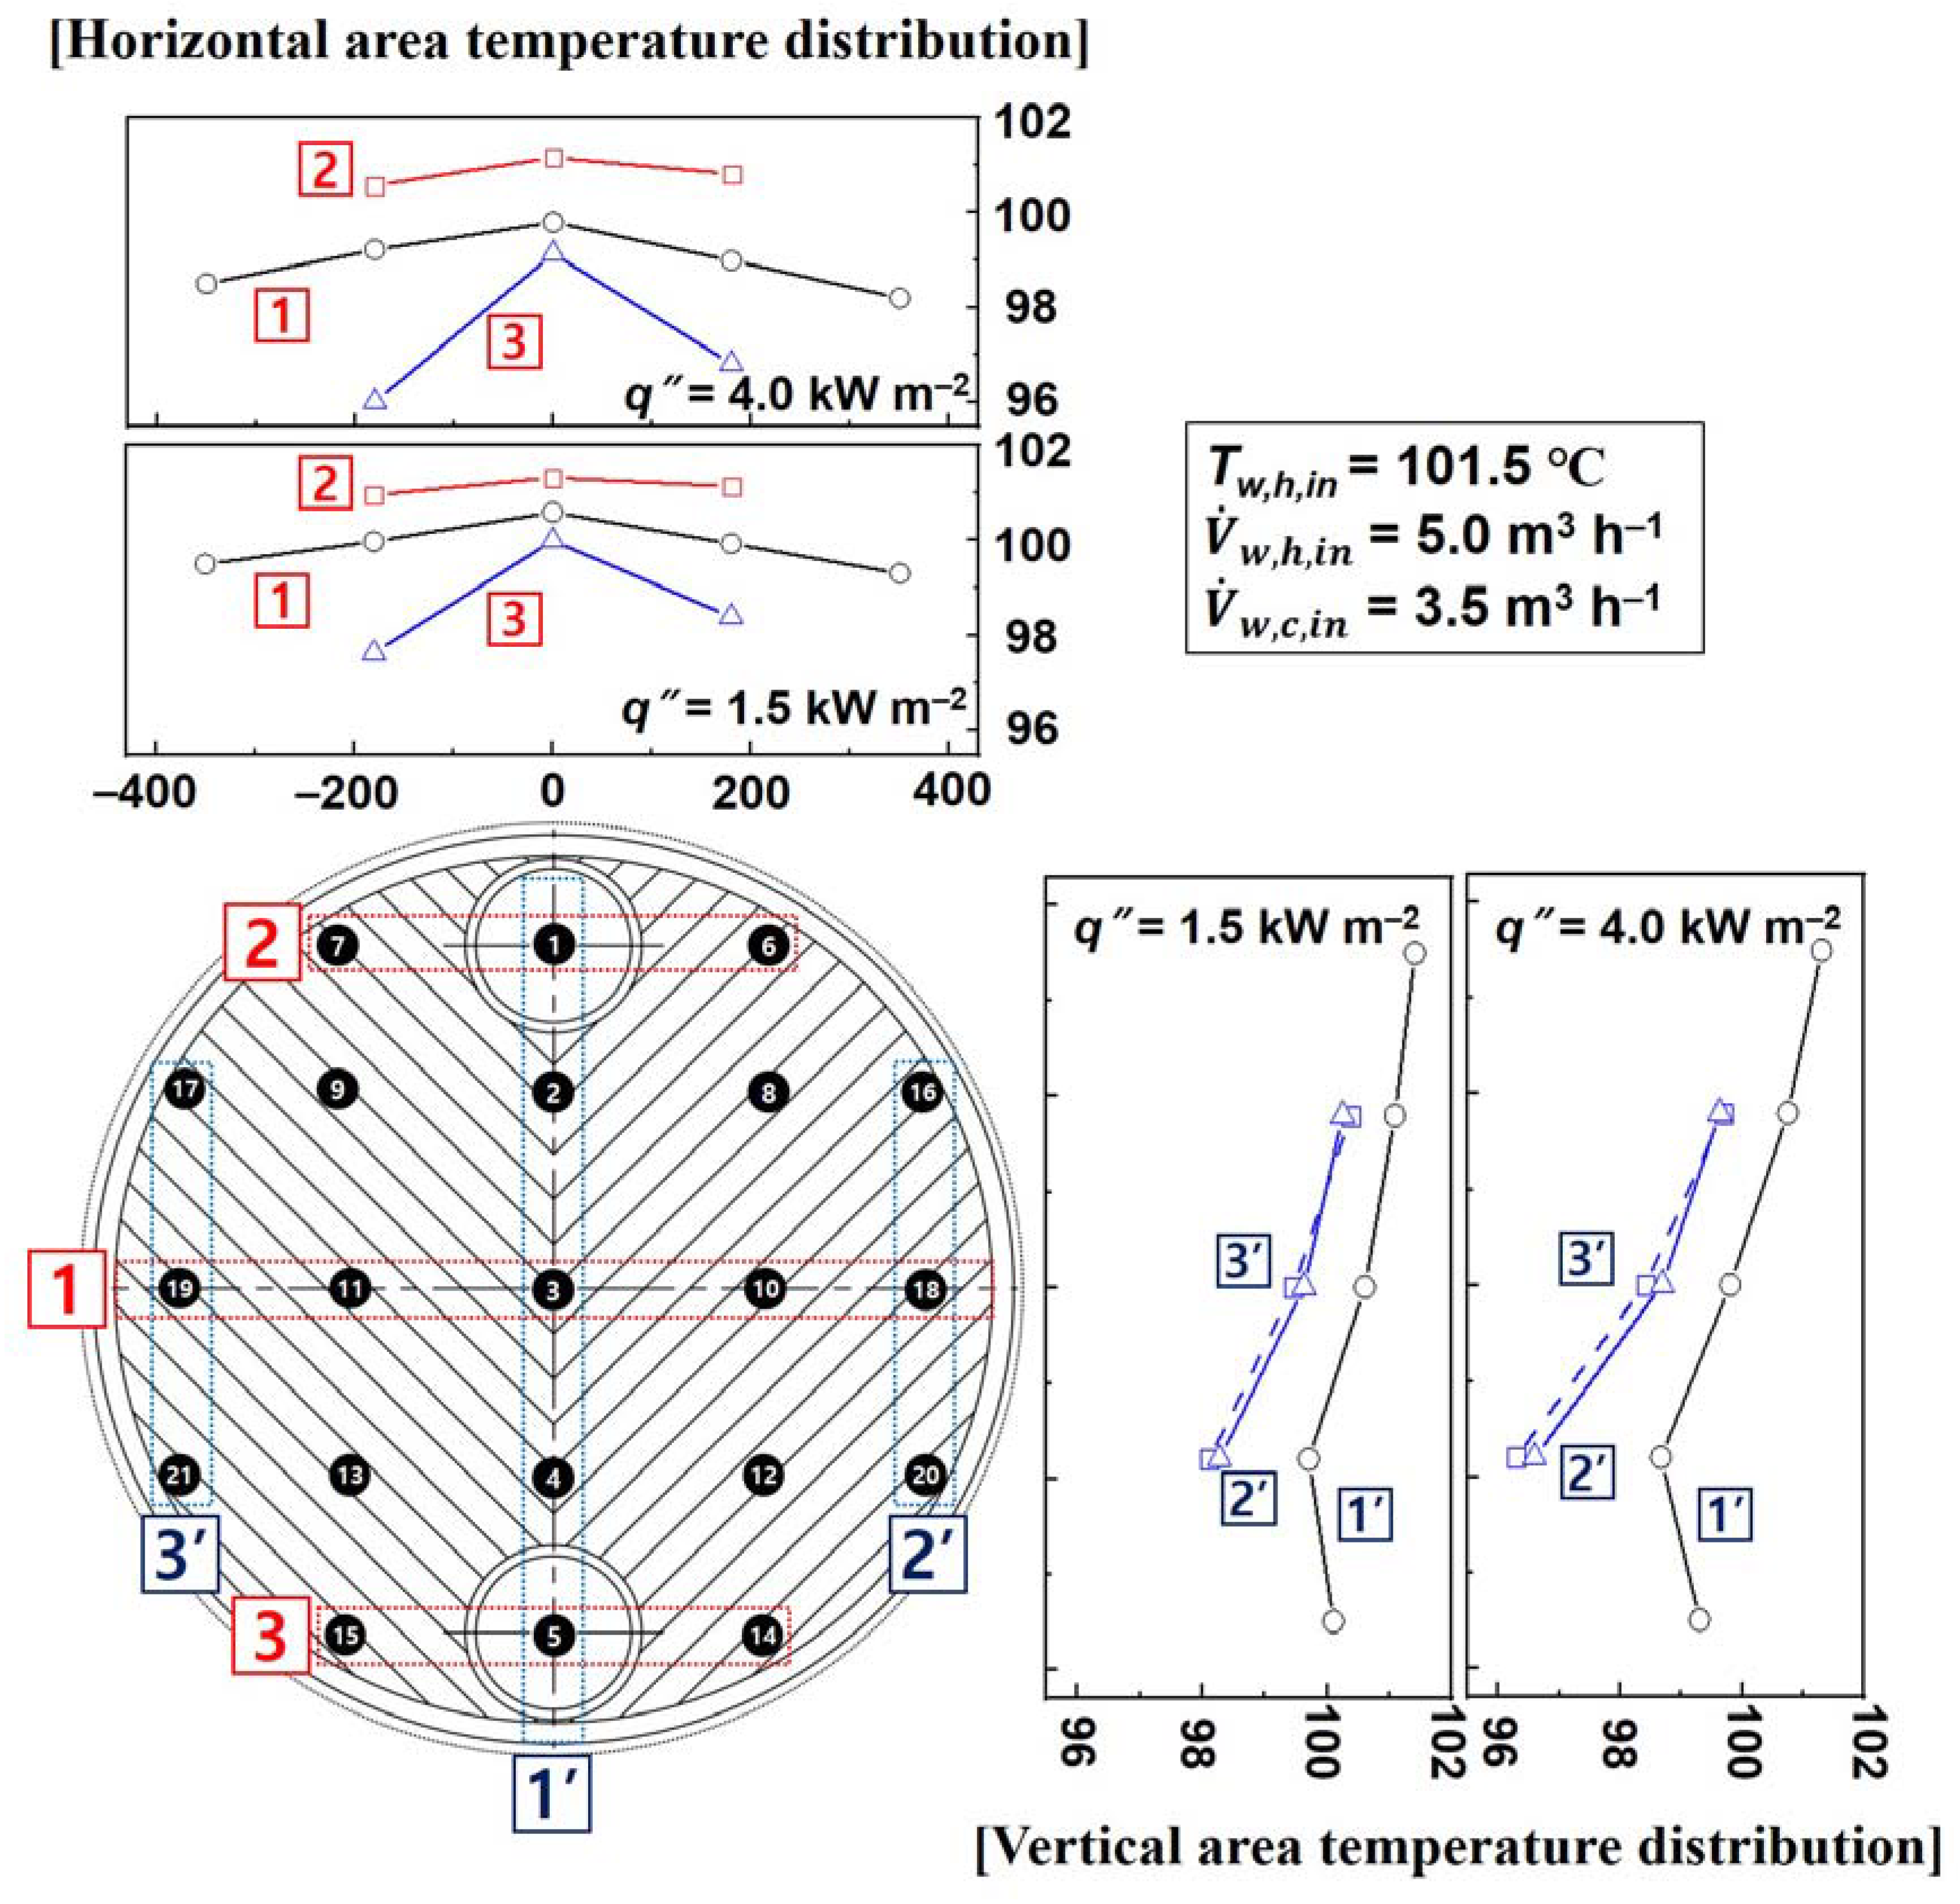
3.3. Temperature Profile on the Circular Plate

Figure 13 shows the temperature profile on the plate at an inlet temperature of 100 °C and volumetric flow rates of 2.2–5.0 m3 h−1. The shell side’s inlet temperature and volumetric flow rate were fixed at 96.5 °C and 3.5 m3 h−1, respectively. At a lower Re, the fluid on the plate side mainly flowed through the center section. In particular, the temperature deviation at the bottom edge of the plate was more significant because the flow was not evenly distributed to the edge of the plate. However, as the Re increased, the temperature difference between the inlet and outlet of the plate side decreased owing to a more uniform flow distribution on the plate. Based on the temperature profile, it was obvious that the fluid intensively flowed through the center of the plate, which is the shortest path under gravity and friction conditions.
Figure 14 compares the temperature profile on the plate with respect to heat flux. The inlet temperature, volumetric flow rate, and Re on the plate side were fixed at 101.5 °C, 5.0 m3 h−1, and 2869, respectively. The heat flux was controlled by varying the inlet temperature on the shell side while maintaining the volumetric flow rate at 3.5 m3 h−1. When the heat flux was low at 1.5 kW m−2, the temperature deviation across the hot plate was relatively small owing to the high mass flux condition. However, as the heat flux increased under the high mass flux condition, the temperature deviation at the bottom edge of the plate increased. Additionally, the temperature at the top of the plate decreased with an increase in the heat flux owing to the increased heat exchange to the fluid on the shell side.
Figure 15 shows the horizontal and vertical temperature profiles at the center and edge of the plate with respect to the Re. In the horizontal direction, the temperature decreased as the location moved from the center to the edge of the plate. Furthermore, a large temperature deviation was observed at the bottom edge of the plate owing to the insufficient flow at the edges and bottom of the plate. As the Re decreased, these trends became more severe owing to the more uneven flow distribution. In the vertical direction, the temperature at the center of the plate was substantially lower than that at the edge of the plate, owing to the increased heat exchange in the centerline. Additionally, temperature deviations at the edge of the plate were almost symmetrical.
Figure 16 shows the horizontal and vertical temperature profiles at the center and edge of the plate with respect to the heat flux. In the horizontal direction, the temperature difference between the edge and bottom of the plate increased as the heat flux increased, owing to the increased heat transfer rate. In the vertical direction, as the heat flux increased, the temperature on the plate gradually decreased owing to the heat exchange in the center of the plate.

4. Conclusions

In this study, the single-phase heat transfer, pressure drop, and temperature distribution of water in a circular plate of an industrial PSHE with a large heat transfer area were measured and analyzed at high temperatures of 90–110 °C by varying the volumetric flow rate. In the single-phase heat transfer experiment on water, the Nu on the plate side was in the range of 7.85–15.2 with the Re from 1200 to 3200, which was substantially lower than that in the PHE studied previously. The lower Nu was attributed to the reduced cross-sectional heat transfer area from the flow imbalance on the plate of the PSHE. When the Re was 875, the pressure drops on the plate and shell sides were 7.2 kPa and 4.5 kPa, respectively, representing a 37.5% difference. When the Re was 2620, the pressure drops on the plate and shell sides were 52.5 kPa and 25.5 kPa, respectively, showing a 51.4% difference. Additionally, the temperature deviation was significant because the mass flux was not evenly distributed over the entire plate. As the heat flux increased, the temperature deviation of the entire plate also increased. Finally, the correlations for the Nu and f on the plate and shell sides were developed. The predictions for the Nu and f on the plate side were consistent with the measured data within ±10% and ±5%, respectively. To apply the PSHE as an industrial condenser, it is recommended to improve the inlet port design to obtain uniform flow distribution on the plate.

Author Contributions

All authors contributed to the preparation of this research article. K.K.: conceptualization, methodology, writing—original draft preparation. K.S.S.: software, investigation. G.L.: data curation, review and editing. K.C.: project administration, review and editing. Y.K.: supervision, review and editing. All authors have read and agreed to the published version of the manuscript.

Funding

This research received no external funding.

Institutional Review Board Statement

Not applicable.

Informed Consent Statement

Not applicable.

Data Availability Statement

Not applicable.

Acknowledgments

This work was conducted under the framework of the Research and Development Program of the Korea Institute of Energy Research (KIER) (No. C1-2416).

Conflicts of Interest

The authors declare that there is no conflict of interest.

Nomenclature

Aheat transfer area (m2)
bcorrugation depth (m)
Cpspecific heat (kJ kg−1 K−1)
Ddiameter (m)
Dhhydraulic diameter (m)
ffriction factor (-)
Gmass flux (kg m−2 s−1)
hheat transfer coefficient (kW m−2 K−1)
kthermal conductivity (kW m−1 K−1)
Llength (m)
LMTDlog mean temperature difference (K)
m ˙ mass flow rate (kg s−1)
Nnumber of plates (-)
NuNusselt number (-)
Ppressure (kPa)
PrPrandtl number (-)
Q ˙ heat transfer rate (W or kW)
qheat flux (kW m−2)
ReReynolds number (-)
Ttemperature (°C or K)
tplate thickness (m)
Uoverall heat transfer coefficient (kW m−2 K−1)
V ˙ volume flow rate (m3 h−1)
Greek symbols
αdimensionless corrugation parameter
βchevron angle (°)
Δdifference (-)
λcorrugation pitch (m)
μviscosity (kg m−1 s−1)
υspecific volume (m3 kg−1)
ρdensity (kg m−3)
ϕsurface enlargement factor (-)
Subscripts
avgaverage
ccold side
chchannel
effeffective
fliquid phase
hhot side
ininlet
outoutlet
plateplate
portport
shellshell
wwater
wallwall
Acronyms
BPHEbrazed plate heat exchanger
PHEplate heat exchanger
PSHEplate and shell heat exchanger
STHE shell and tube heat exchanger

References

  1. IEA. Energy Technology Perspective; IEA: Paris, France, 2017. [Google Scholar]
  2. Vahterus Company. Available online: http://vahterus.com (accessed on 23 September 2021).
  3. Hesselgreaves, J.E. Compact Heat Exchangers Selection, Design and Operation, 1st ed.; Pergamon: Edinburgh, UK, 2001; pp. 60–61. [Google Scholar]
  4. Lim, J.; Song, K.S.; Kim, D.; Lee, D.C.; Kim, Y. Condensation heat transfer characteristics of R245fa in a shell and plate heat exchanger for high-temperature heat pumps. Int. J. Heat Mass Transfer 2018, 127, 730–739. [Google Scholar] [CrossRef]
  5. Song, K.S.; Yun, S.; Lee, D.C.; Kim, K.; Kim, Y. Evaporation heat transfer characteristics of R-245fa in a shell and plate exchanger for very-high-temperature heat pumps. Int. J. Heat Mass Transfer 2020, 151, 119408. [Google Scholar] [CrossRef]
  6. Jo, C.U.; Lee, D.C.; Chung, H.J.; Kang, Y.; Kim, Y. Comparative evaluation of the evaporation heat transfer characteristics of a low-GWP refrigerant R-1234ze(E) between shell and plate and plate heat exchangers. Int. J. Heat Mass Transfer 2020, 153, 119598. [Google Scholar] [CrossRef]
  7. Park, J.H.; Kim, Y.S.; Seo, M.G. Experimental study on R-134a condensation heat transfer characteristics in plate and shell heat exchangers. In Proceedings of the International Refrigeration Air Conditioning Conference, Purdue, IN, USA, 24–28 May 2002; p. 562. [Google Scholar]
  8. Kwon, O.J.; Jung, J.H.; Kang, Y.T. Development of experimental Nusselt number and friction factor correlation of R-1233zd(E) in plate heat exchangers. Int. J. Heat Mass Transfer 2020, 158, 120008. [Google Scholar] [CrossRef]
  9. Abbas, A.; Lee, H.; Sengupta, A.; Wang, C.C. Numerical investigation of thermal and hydraulic performance of shell and plate heat exchanger. Appl. Therm. Eng. 2020, 167, 114705. [Google Scholar] [CrossRef]
  10. Gherasim, I.; Taws, M.; Galanis, N.; Nguyen, C.T. Heat transfer and fluid in a plate heat exchanger part I. Experimental investigation. Int. J. Therm. Sci. 2011, 50, 1492–1498. [Google Scholar] [CrossRef]
  11. Martin, H. A theoretical approach to predict the performance of chevron-type plate heat exchangers. Chem. Eng. Proc. 1996, 35, 301–310. [Google Scholar] [CrossRef]
  12. Shah, R.K.; Focke, W.W. Plate Heat Exchangers and Their Design Theory, Heat Transfer Equipment Design; Hemisphere Publishing: Washington, DC, USA, 1988. [Google Scholar]
  13. Moffat, R.J. Describing the uncertainties in experimental results. Exp. Therm. Fluid Sci. 1998, 1, 3–17. [Google Scholar] [CrossRef] [Green Version]
  14. ASHRAE. ASHRAE Guideline 2–2010 (RA2014). Engineering Analysis of Experimental Data; ASHRAE: Atlanta, GA, USA, 2014. [Google Scholar]
  15. Fernandez-Seara, J.; Uhia, F.J.; Sieres, J.; Campo, A. A general review of the Wilson plot method and its modifications to determine convection coefficients in heat exchanger devices. Appl. Therm. Eng. 2007, 27, 2745–2757. [Google Scholar] [CrossRef] [Green Version]
  16. Lee, H.; Li, S.; Hwang, Y.; Radermacher, R.; Chun, H.H. Experimental investigations on flow boiling heat transfer in plate heat exchanger at low mass flux condition. Appl. Therm. Eng. 2013, 61, 408–415. [Google Scholar] [CrossRef]
  17. Heavner, R.L.; Kumar, H.; Wanniarachchi, A.S. Performance of an industrial plate heat exchangers: Effect of chevron angle. In AIChE Symposium Series; American Institute of Chemical Engineers: New York, NY, USA, 1993; Volume 89, pp. 262–267. [Google Scholar]
  18. Nilpueng, K.; Wongwises, S. Experimental study of single-phase heat transfer and pressure drop inside a plate heat exchanger with a rough surface. Exp. Therm. Fluid Sci. 2015, 68, 268–275. [Google Scholar] [CrossRef]
  19. Hayes, N.; Jokar, A.; Ayub, Z.H. Study of carbon dioxide condensation in chevron plates exchangers, heat transfer analysis. Int. J. Heat Mass Transfer. 2011, 54, 1121–1131. [Google Scholar] [CrossRef]
  20. Talik, A.C.; Fletcher, L.S.; Anand, N.K.; Swanson, L.W. Heat transfer and pressure drop characteristics of a plate heat exchanger. In Proceedings of the ASME/JSME Thermal Engineering Conference, New York, NY, USA, 31 December 1995; pp. 321–329. [Google Scholar]
  21. Gulenoglu, C.; Akturk, F.; Aradag, S.; Uzol, N.S.; Kakac, S. Experimental comparison of performances of three different plates for gasketed plate heat exchangers. Int. J. Therm. Sci. 2014, 75, 249–256. [Google Scholar] [CrossRef]
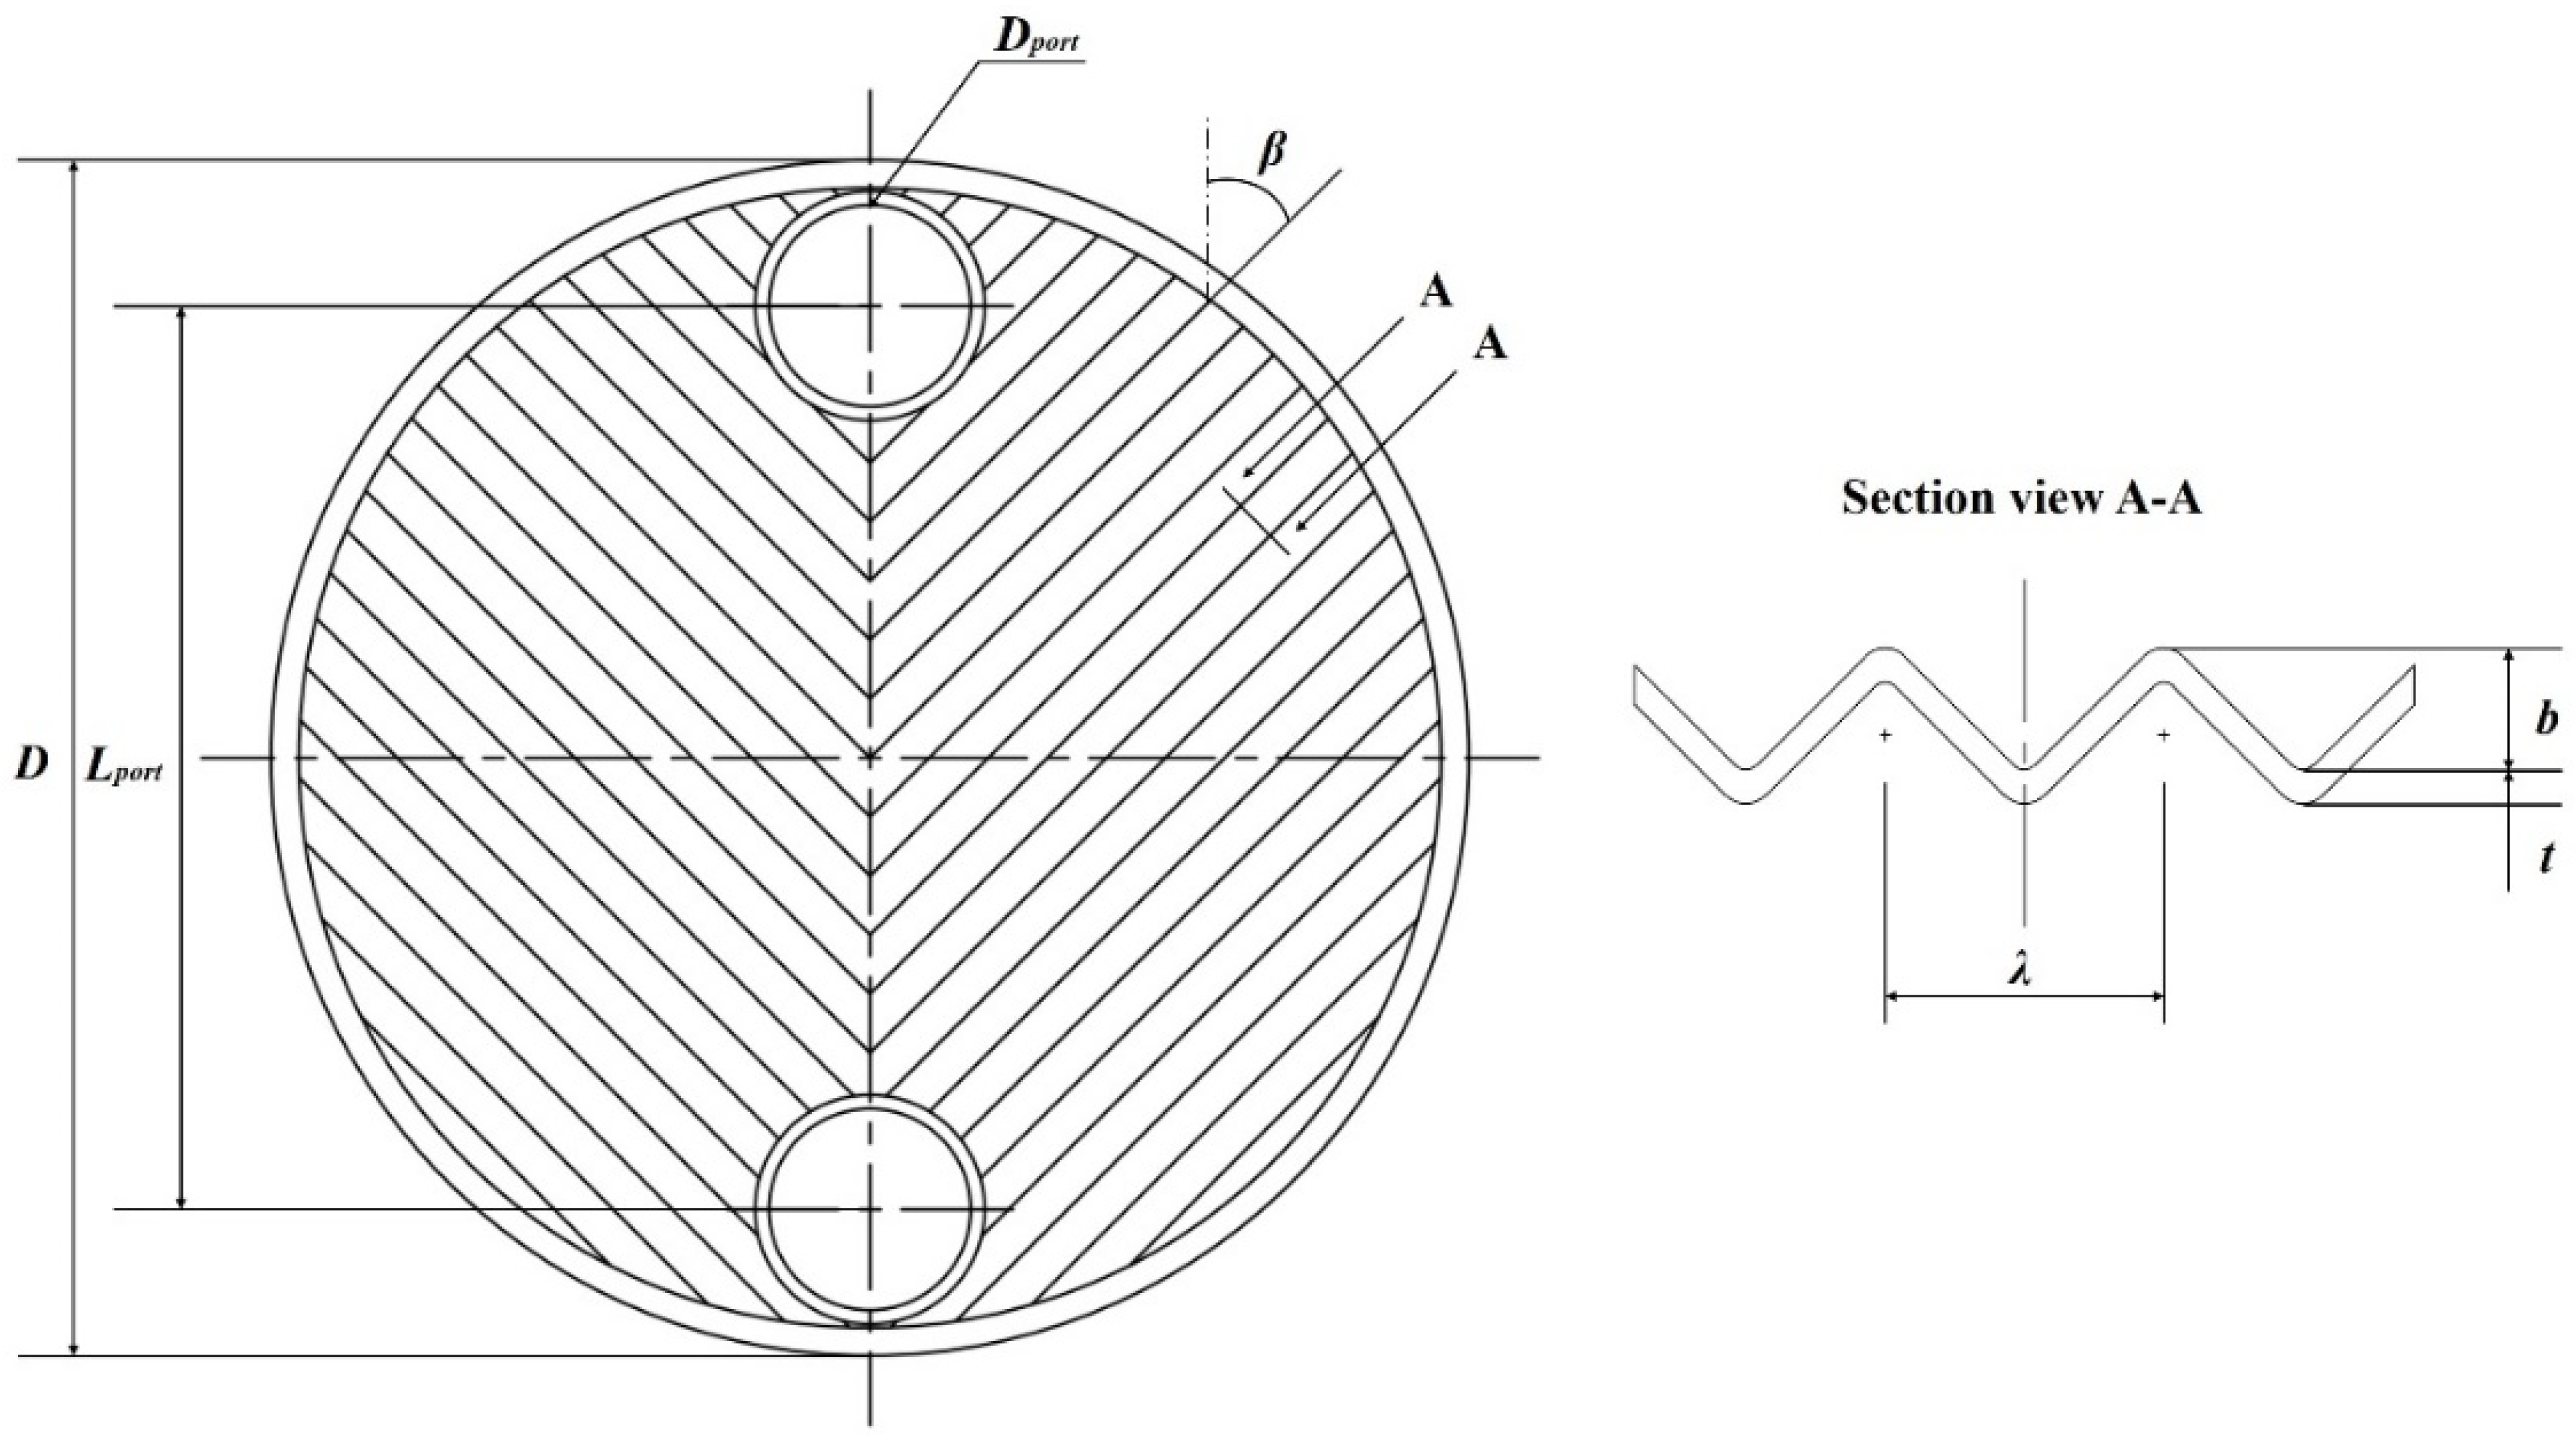
Figure 1. Schematic of the PSHE.
Energies 14 06688 g001
Figure 2. Schematic of the experimental setup.
Energies 14 06688 g002
Figure 3. Schematic of the circular plate.
Energies 14 06688 g003
Figure 4. Positions of temperature sensors on the circular plate.
Energies 14 06688 g004
Figure 5. Variation in the overall heat transfer coefficient with respect to the Re and average temperature in PSHE.
Energies 14 06688 g005
Figure 6. Comparison of the predicted with measured Nu on the plate side of the PSHE.
Energies 14 06688 g006
Figure 7. Comparison of the predicted Nu on the plate side using the present correlation with those using the existing correlations with respect to the Re.
Energies 14 06688 g007
Figure 8. The pressure drop on plate and shell sides with respect to the Re in the PSHE.
Energies 14 06688 g008
Figure 9. The pressure drop on the plate side with respect to thee Re and average temperature in PSHE.
Energies 14 06688 g009
Figure 10. The f on the plate and shell sides with respect to the Re in PSHE.
Energies 14 06688 g010
Figure 11. Comparison of the predicted with measured f in the PSHE.
Energies 14 06688 g011
Figure 12. Variation in the Nu/f with respect to the Re.
Energies 14 06688 g012
Figure 13. The temperature profile on the circular plate with respect to the Re at 100 °C.
Energies 14 06688 g013
Figure 14. The temperature profile on the circular plate with respect to the Re at 101.5 °C.
Energies 14 06688 g014
Figure 15. The horizontal and vertical temperature profiles with respect to the Re.
Energies 14 06688 g015
Figure 16. The horizontal and vertical temperature profiles with respect to heat flux.
Energies 14 06688 g016
Table 1. Geometries of the tested PSHE.
GeometriesSymbolValue
Plate diameter (m)D0.86
Port diameter (m)Dport0.145
Port to port length (m)Lport0.65
Chevron angle (°)β45
Plate thickness (m)t0.0008
Corrugation pitch (m)λ0.012
Corrugation depth (m)b0.003
Hydraulic diameter (m)Dh0.005
Surface enlargement factor (-)ϕ1.170
Number of plates (-)Nplate4
Effective heat transfer area (m2)Aeff2.619
Table 2. Test conditions.
Operating VariablesRange
Average temperature, Tavg (°C)90, 100, 110
Volume   flow   rate ,   V ˙ w , h (m3 h−1)1.0–5.0
Volume   flow   rate ,   V ˙ w , c (m3 h−1)1.5–4.7
Heat flux, q″ (kW m−2)1.5–4.0
(No heat flux for pressure drop tests)
Table 3. Systematic errors of sensors and relative uncertainties of results.
ParametersSpecification and Uncertainty
Temperature, TModelRTD Omega PM 1/3 DIN
Range0–250 °C
Accuracy±1/3 (0.3 + 0.005lTl)
Pressure, PModelAplisen PCD-28D
Range0–10 bar, 0–40 bar
Accuracy±0.2% of full scale
Differential pressure, ΔPModelYokogawa EJA110E
Range1–300 kPa
Accuracy±0.055% of span
Volume   flow   rate ,   V ˙ w ModelRosemount 8732C
Range0–6 m3 h−1
Accuracy±0.35% of span
Log mean temperature difference, LMTDUncertainty±3.1%
Heat flux, q±7.1%
Mass flux, G±1.0%
Overall heat transfer coefficient, U±7.5%
Heat transfer coefficient of hot side, hw,h±7.3%
Heat transfer coefficient of cold side, hw,c±7.8%
Fiction factor, f±6.1%
Publisher’s Note: MDPI stays neutral with regard to jurisdictional claims in published maps and institutional affiliations.

