Article

Energy-Saving and CO2-Emissions-Reduction Potential of a Fuel Cell Cogeneration System for Condominiums Based on a Field Survey

1
Graduate School of Environmental and Information Studies, Tokyo City University, Yokohama 224-8551, Japan
2
Tokyu Fudosan R&D Center Inc., Tokyo 150-0043, Japan
3
Tokyo Gas Co., Ltd., Tokyo 105-8527, Japan
4
Teamnet Inc., Tokyo 155-0033, Japan
*
Author to whom correspondence should be addressed.
Energies 2021, 14(20), 6611; https://doi.org/10.3390/en14206611
Submission received: 29 August 2021 / Revised: 5 October 2021 / Accepted: 5 October 2021 / Published: 13 October 2021
(This article belongs to the Special Issue Thermal Comfort and Energy Use in Buildings)

Abstract

:
A residential cogeneration system (CGS) is highlighted because of its efficient energy usage on both the supplier and consumer sides. It generates electricity and heat simultaneously; however, there is insufficient information on the efficiency according to the condition of usage. In this study, we analysed the performance data measured by the home energy management system (HEMS) and the lifestyle data of residents in a condominium of 356 flats where fuel cell CGS was installed in each flat. The electricity generated by CGS contributed to an approximately 12% reduction in primary energy consumption and CO2 emission, and the rate of generation by the CGS in the electric power demand (i.e., contribution rate) was approximately 38%. The electricity generation was mainly affected by the use of electricity up to 4 MWh/household/year. Gas or water use also impacted electric power generation, with water use as the primary factor affecting the contribution rate. Electric power generation changes monthly, mainly based on the water temperature. From these results, we confirmed that a CGS has substantial potential to reduce energy consumption and CO2 emission in condominiums. Thus, it is recommended for installation of fuel cell CGS in existing and new buildings to contribute to the energy-saving target of the Japanese Government in the residential sector.

Graphical Abstract

1. Introduction

1.1. International and National Policy against Global Warming

In the international movement to combat the threats of climate change, cogeneration systems (CGSs), especially fuel cells, are becoming common because of their high energy efficiency. Global recognition of the requirement for an effective and progressive response to the urgent threat of climate change led to the enactment of the “Paris Agreement” [1] at the Conference of Parties to the United Nations Framework Convention on Climate Change 21 (COP 21) held in 2015. According to this agreement, the target of the global warming temperature limit was 2 °C, and the Japanese Government, along with other countries, declared a Nationally Determined Contribution (NDC) [2]. The reduction target of greenhouse gas (GHG) emissions was 26% by 2030 compared to 2013, and this NDC also included a reduction of 40% in the residential sector, which accounts for 14% of energy consumption in Japan [3]. To realise this NDC, the Japanese Government designed global-warming countermeasures plans [4]. There, the approaches in the residential sector were the higher energy-saving performances of residential buildings, the introduction of high energy-saving appliances, including fuel cell CGSs for residence, and the home energy management system (HEMS).
At COP 25 held in 2019, the necessity to shift the target of global warming temperature limit to 1.5 °C was discussed; therefore, the Japanese and other governments planned to reduce greenhouse gas emissions to zero by 2050 [5]. To achieve this, the reduction target was increased in 2030 to 46% from the prior target of 26%; in particular, the target of the residential sector was increased to 66%. Thus, residential energy-saving measures are becoming an urgent issue.

1.2. Expectations of Fuel Cell Cogeneration System (CGS)

In Japan, a shortage of electrical power was experienced after the Great East Japan earthquake in 2011, which led to excessive energy-saving measures in offices and residences. Several field studies after the earthquake indicated the possibility of reduced productivity of occupants due to these measures, and energy-saving strategies that do not affect comfort and productivity were required [6,7].
Cogeneration systems (CGSs), especially fuel cells, have become increasingly common because of their high energy efficiency and their ability to produce electric power and heat simultaneously on site. On the supplier side, they have the potential to reduce the peak load of centralised electric power plants as well as losses caused by transmission. On the consumer side, they are also expected to serve water that is stored in tanks as well as generate power if a natural disaster occurs.
In Japan, a residential fuel cell CGS has been developed and has been in use for more than 10 years in detached houses and greater than 5 years in condominiums. The Japanese Government has set the goal of installing 5.3 million residential fuel cell CGSs in 2030 on the strategic road map of converting energy usage to hydrogen and fuel cells [8]. However, they are not being implemented as rapidly as expected. One of the reasons might be that the initial cost is much higher than the cost of a conventional home boiler. Another factor might be that there is not sufficient information on the impact of a fuel cell CGS in an actual building and the conditions required to realise the potential performance of this system.

1.3. Previous Studies Related to Fuel Cell Cogeneration Systems (CGSs)

Several studies on fuel cell cogeneration systems (CGSs) have been conducted to estimate the energy-saving efficiency or CO2 emissions reduction in residential buildings. Ferguson et al. [9] developed a simulation tool to predict the performance of CGS in a building environment. They investigated various sized proton exchange membrane (PEM) fuel cells through a case study in a Canadian detached house. They found that the optimal size of fuel cell for the house was 3 kW, which provided greater than 93% of the total electricity required within the house. Dorer et al. [10,11] compared the reduction capacities for primary energy and CO2 emission of CGS and other devices in Swiss residences by simulation. They confirmed that fuel cell CGSs achieved 6–48% of primary energy reduction in comparison with a gas boiler. Pellegrino et al. [12] compared the impact of different supporting systems for residential CGSs in Italy and other European countries. Di Marcoberardiano et al. [13] investigated the techno-economic assessment of 5 kW proton exchange membrane fuel cell (PEMFC) CGSs with different gas compositions in Europe.
The energy use system is substantially different in Japan from European and North American countries. Generally, Japanese residences do not use steam or hot water for heating or washing clothes. However, the hot water demands for bathing are much higher than those in European or North American countries. Japanese apartments do not have a central heating system, but gas boilers are installed in each flat. Energy efficiency level is not mandatory in residential buildings. As for electricity, reverse power flow from CGSs to the commercial power grid is not permitted in Japan.
There have also been several studies conducted in Japan on this topic. Kuroki et al. [14] investigated the effect on energy saving, CO2 emissions reduction, and utility cost saving of residential polymer electrolyte fuel cell CGSs in a detached house through a simulation. They concluded that the effects were higher in the cold climatic regions in Japan. Wakui et al. [15] analysed the energy-saving effect of CGS in a detached house combined with a plug-in hybrid electric vehicle using an optimal operational planning model based on mixed-integer linear programming. Aoki et al. [16] compared the energy-saving effectiveness among three types of CGSs with a variety of families by simulation in a detached house. They concluded that the energy-saving effect was influenced by the existence of household members during the daytime on weekdays and the frequency of bathing. Ono et al. [17] evaluated the possibility of utilising the surplus capacity of hydrogen production in the residential CGS for fuel cell vehicles and investigated energy supply in collective housing environments in Tokyo. The effect of sharing one CGS between two households in apartments was examined through a simulation [18], while the performance of CGS in detached houses has also been analysed [19]. Yamamoto et al. [20] compared the detailed performance of CGS according to the demand change in two detached houses. Akabayashi et al. [21] simulated the effect of the peak electricity demand reduction by the numerical installation of 100–300 thousand CGS units in winter or 700–1500 thousand CGS units in summer into residences of northern Japan. Arinami et al. [22] simulated the impact of primary energy consumption reduction by the nation-wide usage of surplus electric power generation by CGS.
Most of the studies were based on simulations, and there are only a few field studies using measured data in large condominiums. In 2018, condominiums accounted for 43% of the housing in Japan [23]; thus, it is important to conduct research in this field.

1.4. Objectives

The main objective of this study was to clarify the realised energy-saving effect and CO2 emissions reduction in a cogeneration system (CGS) installed in a condominium by analysing measured energy performance data and several factors that might affect efficiency. The specific objectives of this study were to:
  • Estimate the energy-saving effect of CGS by the distribution of the performance data: the electricity/gas/water use, the primary energy consumption and CO2 emission, and the electricity generated by CGS;
  • Clarify the relationship between the energy-saving effect and electricity/gas/water usage;
  • Analyse the factors related to the seasonal variation in the energy-saving effect of CGS; and
  • Clarify the relationship between the energy-saving effect of CGS and the type of residents.

2. Materials and Methods

This study focused on the condominium where a polymer electrolyte fuel cell cogeneration system (CGS) was installed in every flat for the first time in the world. We analysed the measured performance data of electricity/gas/water use and the electricity generated by the CGS to estimate the characteristics of the energy-saving effect according to their relationship.

2.1. Investigated Residential Building

The condominium is located in the southeastern urban area in Tokyo [24,25,26]. It is an 18-stories building, with 356 flats. There are two types of floor plans: three bedrooms with a living–dining room and kitchen (3LDK: 71.01–77.13 m2), 272 flats; or four bedrooms (4LDK: 80.86–90.23 m2), 84 flats. Floor heating is installed in the living–dining room, and the heating source is not provided by cogeneration system (CGS) but by a backup gas boiler (Figure 1).

2.2. Installed Cogeneration System (CGS)

The performance values of the installed polymer electrolyte fuel cell cogeneration system (PEFC-CGS) are listed in Table 1. CGS operates according to the daily start–stop operation, whereby it starts and stops once a day at maximum and stays off for at least 2 h a day. Electricity is generated in relation to the demand at that particular moment. Simultaneously, the generated heat boils water which is reserved in the storage tank; however, the amount of the heat generation is restricted to the daily demand. By these restrictions, the unit learns the optimal operation pattern for each residence automatically.

2.3. Measured Energy Consumption Data

Home energy management system (HEMS) was installed in each flat of the investigated building and was used to measure the energy consumption performance data, including electricity purchased, electricity consumed by eight branch circuits, electricity generated by cogeneration system (CGS), and gas and water consumption. Electricity consumption data were measured by circuit transformer (CT) sensors (ratio error: 2% of full scale) installed in the distribution board, gas consumption by a gas meter installed by the gas company (verification tolerance: 3%), and water by an installed flowmeter (instrument error: 5%). Each piece of data was recorded in 30 min intervals and stored on the cloud server. Residents could visualise the energy use results in real-time using a computer or smartphone. We analysed 1 year of data on energy performance from April 2018 to March 2019 in 304 flats.
Gas use was not measured for each appliance separately; thus, we estimated the gas use for CGS for each 30 min from the generated electricity values. The gas usage other than CGS was for the backup boiler and stovetop burners in the kitchen. The backup boiler supplied the heat source for the floor heating in the living–dining room and the clothes dryer and the mist shower in the bathroom, and provided boiling water to supplement the shortage of hot water supply from CGS.
We calculated the reduction effect of CGS by comparing it with a conventional gas boiler with an energy efficiency of 80% [27]. The calculation standard is determined based on Japanese building energy-saving act, and the baseline energy efficiency value of the gas boiler for individual residences is 78.2% [28].
The conversion factors for primary energy consumption and CO2 emission are listed in Table 2. CO2 emission factor of electricity was based on the national average data of 2018 [29].
Reduction values of primary energy consumption and CO2 emission by CGS are calculated by the following equations:
RVpe = 9.76Eg − 0.045Gfc(1–56/80)
RVCO2 = 0.462Eg − 0.00224Gfc(1–56/80)
where RVpe is the reduction value of the primary energy consumption (GJ), RV CO 2 is the reduction value of CO2 emission (t-CO2), Eg is the generated electricity (MWh), Gfc is the gas used for CGS (m3), 56% is the heat recovery efficiency of CGS, and 80% is the energy efficiency of the conventional gas boiler.
The outdoor air temperature was obtained from the Haneda meteorological observation station, which is the nearest to the investigated building [30]. City water temperature data were obtained from the Bureau of Waterworks, Tokyo Metropolitan Government [31].

2.4. Questionnaire Survey and Profile of Residents

We conducted a questionnaire survey of residents three times between February 2015 and November 2016, and the results are shown in Table 3. The survey items included household profiles, lifestyle, appliance usage, energy-saving behaviour, and others. The responding rate decreased from first to third survey. They responded only once, twice or three times. Therefore, we have adopted the latest data of each household. As a result, we analysed 161 responses that corresponded to 53% of HEMS data that we analysed.
The profiles of the residents in each type of flat plan are shown in Table 4 and Table 5. Households of three members occupy the largest share (39%), followed by two members (30%). The mean number of household members (2.72) was higher than the average value in Japan (2.5) [32]. The share of single families (10%) was lower than that of Japanese average (25%), and the share of three members (39%) was higher than Japanese average (20%). In most previous studies, the simulation was conducted by four family members [11,12,18,19], but the share of households with more than four family members decreased from 38.5% in 1994 to 23.1% in 2014 [32].
In the investigated condominium, two-thirds of the married women worked outside of the home, which is approximately the same level as that of Japan as a whole [33]. Two-thirds of the youngest children were under 5 years old. There was no significant difference between the residents of 3LDK and 4LDK.

3. Results and Discussion

3.1. Annual Energy Use and the Effect of Cogeneration Systems (CGSs)

In this section, we analysed the effect of electric generation by the cogeneration system (CGS) to reduce the annual energy consumption. The contribution rate is the share of electricity generated by the CGS in the total electricity use.
Figure 2 shows the distribution of the annual generated electricity, gas or water use, and the energy-saving effects of the fuel cell CGS. In this condominium, 1.31 MWh/household was generated by the CGS in a year, which accounted for 38.2% of the total electricity use of 3.35 MWh/household. As a result, the annual primary energy consumption was reduced from 64.2 to 56.0 GJ/household, and CO2 emission was reduced from 3.12 to 2.74 t-CO2/household. Therefore, the reduction rate was 12.3% and 11.7%, respectively (Figure 2e,f).
Table 6 shows a comparison of the annual energy-saving effects of the CGS with those of previous studies. The mean annual generated electricity was slightly higher than that of a previous study, and the contribution rate was within the range of prior studies [18]. The mean reduction rate of the annual primary energy consumption was higher than that of a previous study, and annual CO2 emission was lower than those previously reported [14]. We confirmed by the measured data that the performance of the CGS was similar to that previously reported based on simulations. However, the variation in the energy-saving effect dispersed over a wide range (e.g., contribution rates of 8–65%); therefore, it is important to clarify the factors which affect energy saving.
The Japanese Government has a target to install 5.3 million fuel cell CGSs in 2030. Arinami et al. [22] simulated the energy reduction effect by the nation-wide installation of fuel cell CGSs according to the Japanese target that is equivalent to 11% of residences. They found that the primary energy reduction was 75 PJ/year, and the reduction rate was 1.3% in the largest case. Our study showed a larger effect of primary energy reduction than that of the simulated result (Table 6).
The CGS works under several restrictions, as we mentioned in Section 2.2. Figure 3 shows an example of the daily energy use pattern in winter over 30 min. We converted the data by 30 min to the data by one hour, and thus the values of electricity indicate the average kW during each interval.
In this example flat, the CGS begins generating electricity in the morning (7:30) and stops late at night (3:00). It can be operated according to the electricity demand at that moment; however, the generation is under the limit of the rated output capacity (750 W). Simultaneously, the generation is limited by the heat demand of the day. In this case, the CGS works at rated load from 8:30 to 11:00 and 17:00 to 2:30. A shortage of electrical power is supplemented from the grid (Figure 3a).
The heat is produced while CGS generates electricity, and the water in the storage tank is boiled within the range of daily hot water requirements. The backup boiler supplements a shortage of boiled water. Thus the gas use, except for the CGS, increases when boiled water is used more than the output capacity of the CGS. Although the gas use includes cooking, floor heating, and bathroom heating, we have estimated that most gas use without water use is for the floor heating (Figure 3b).

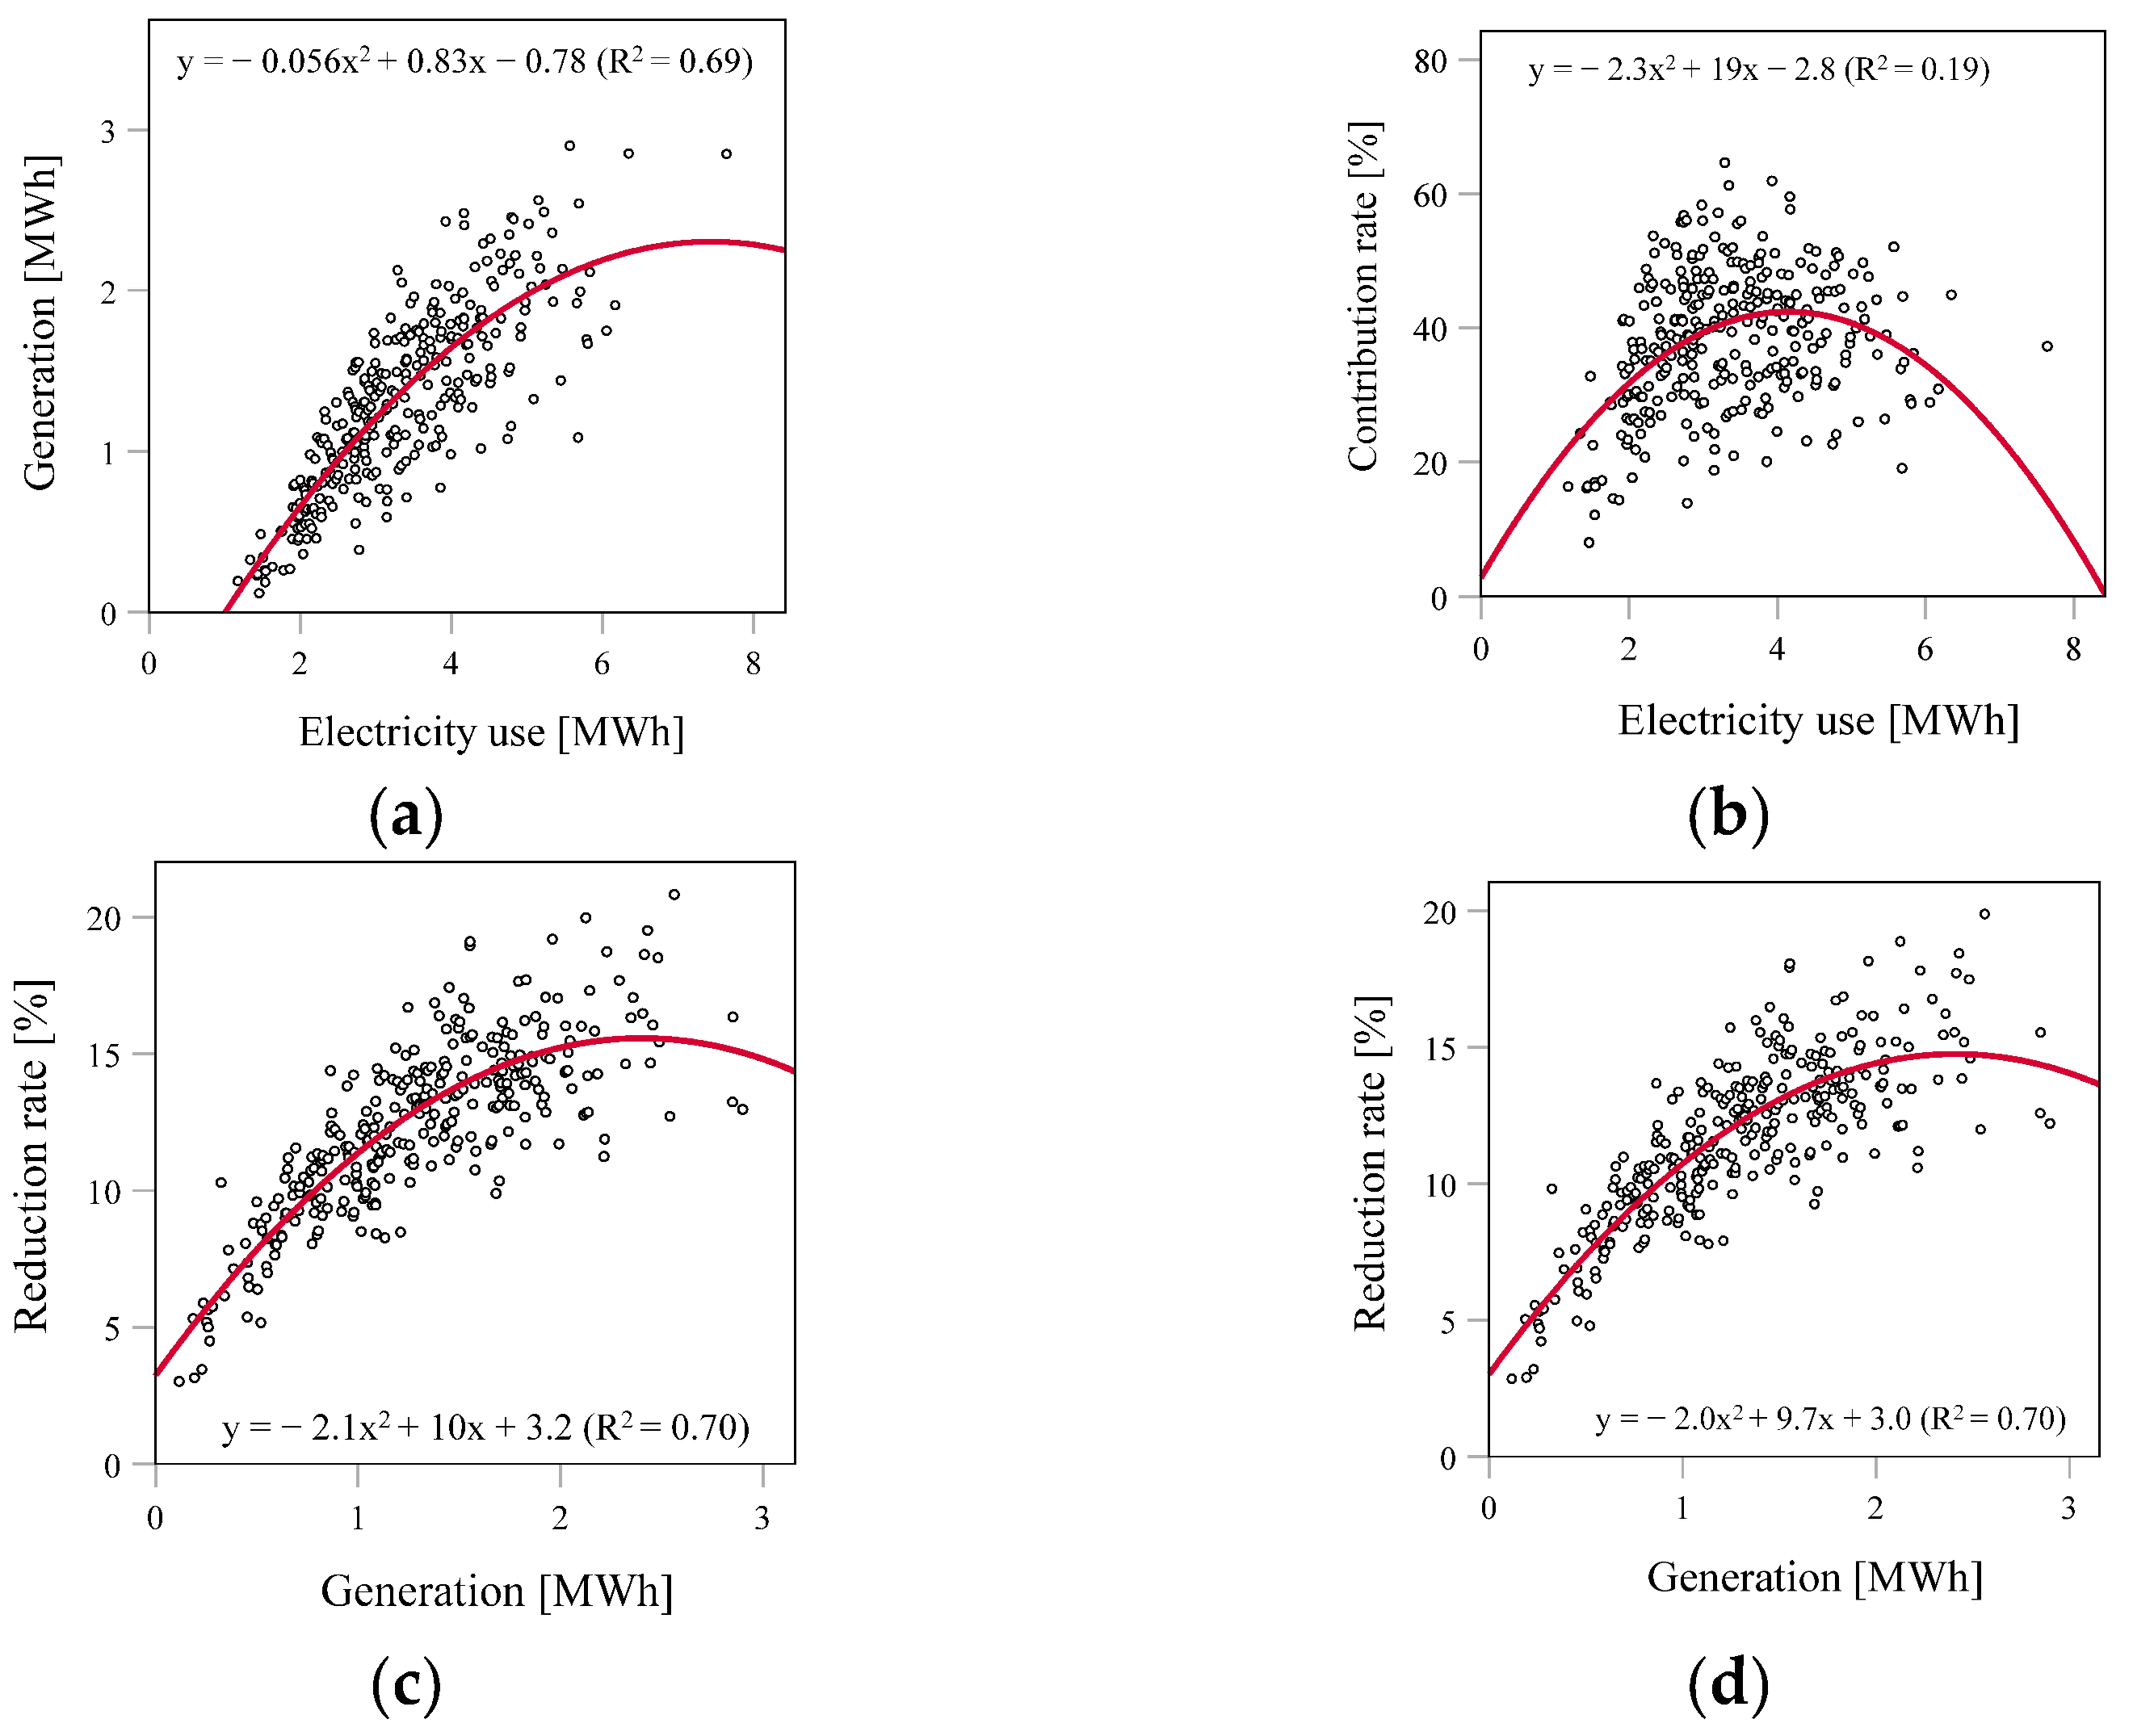
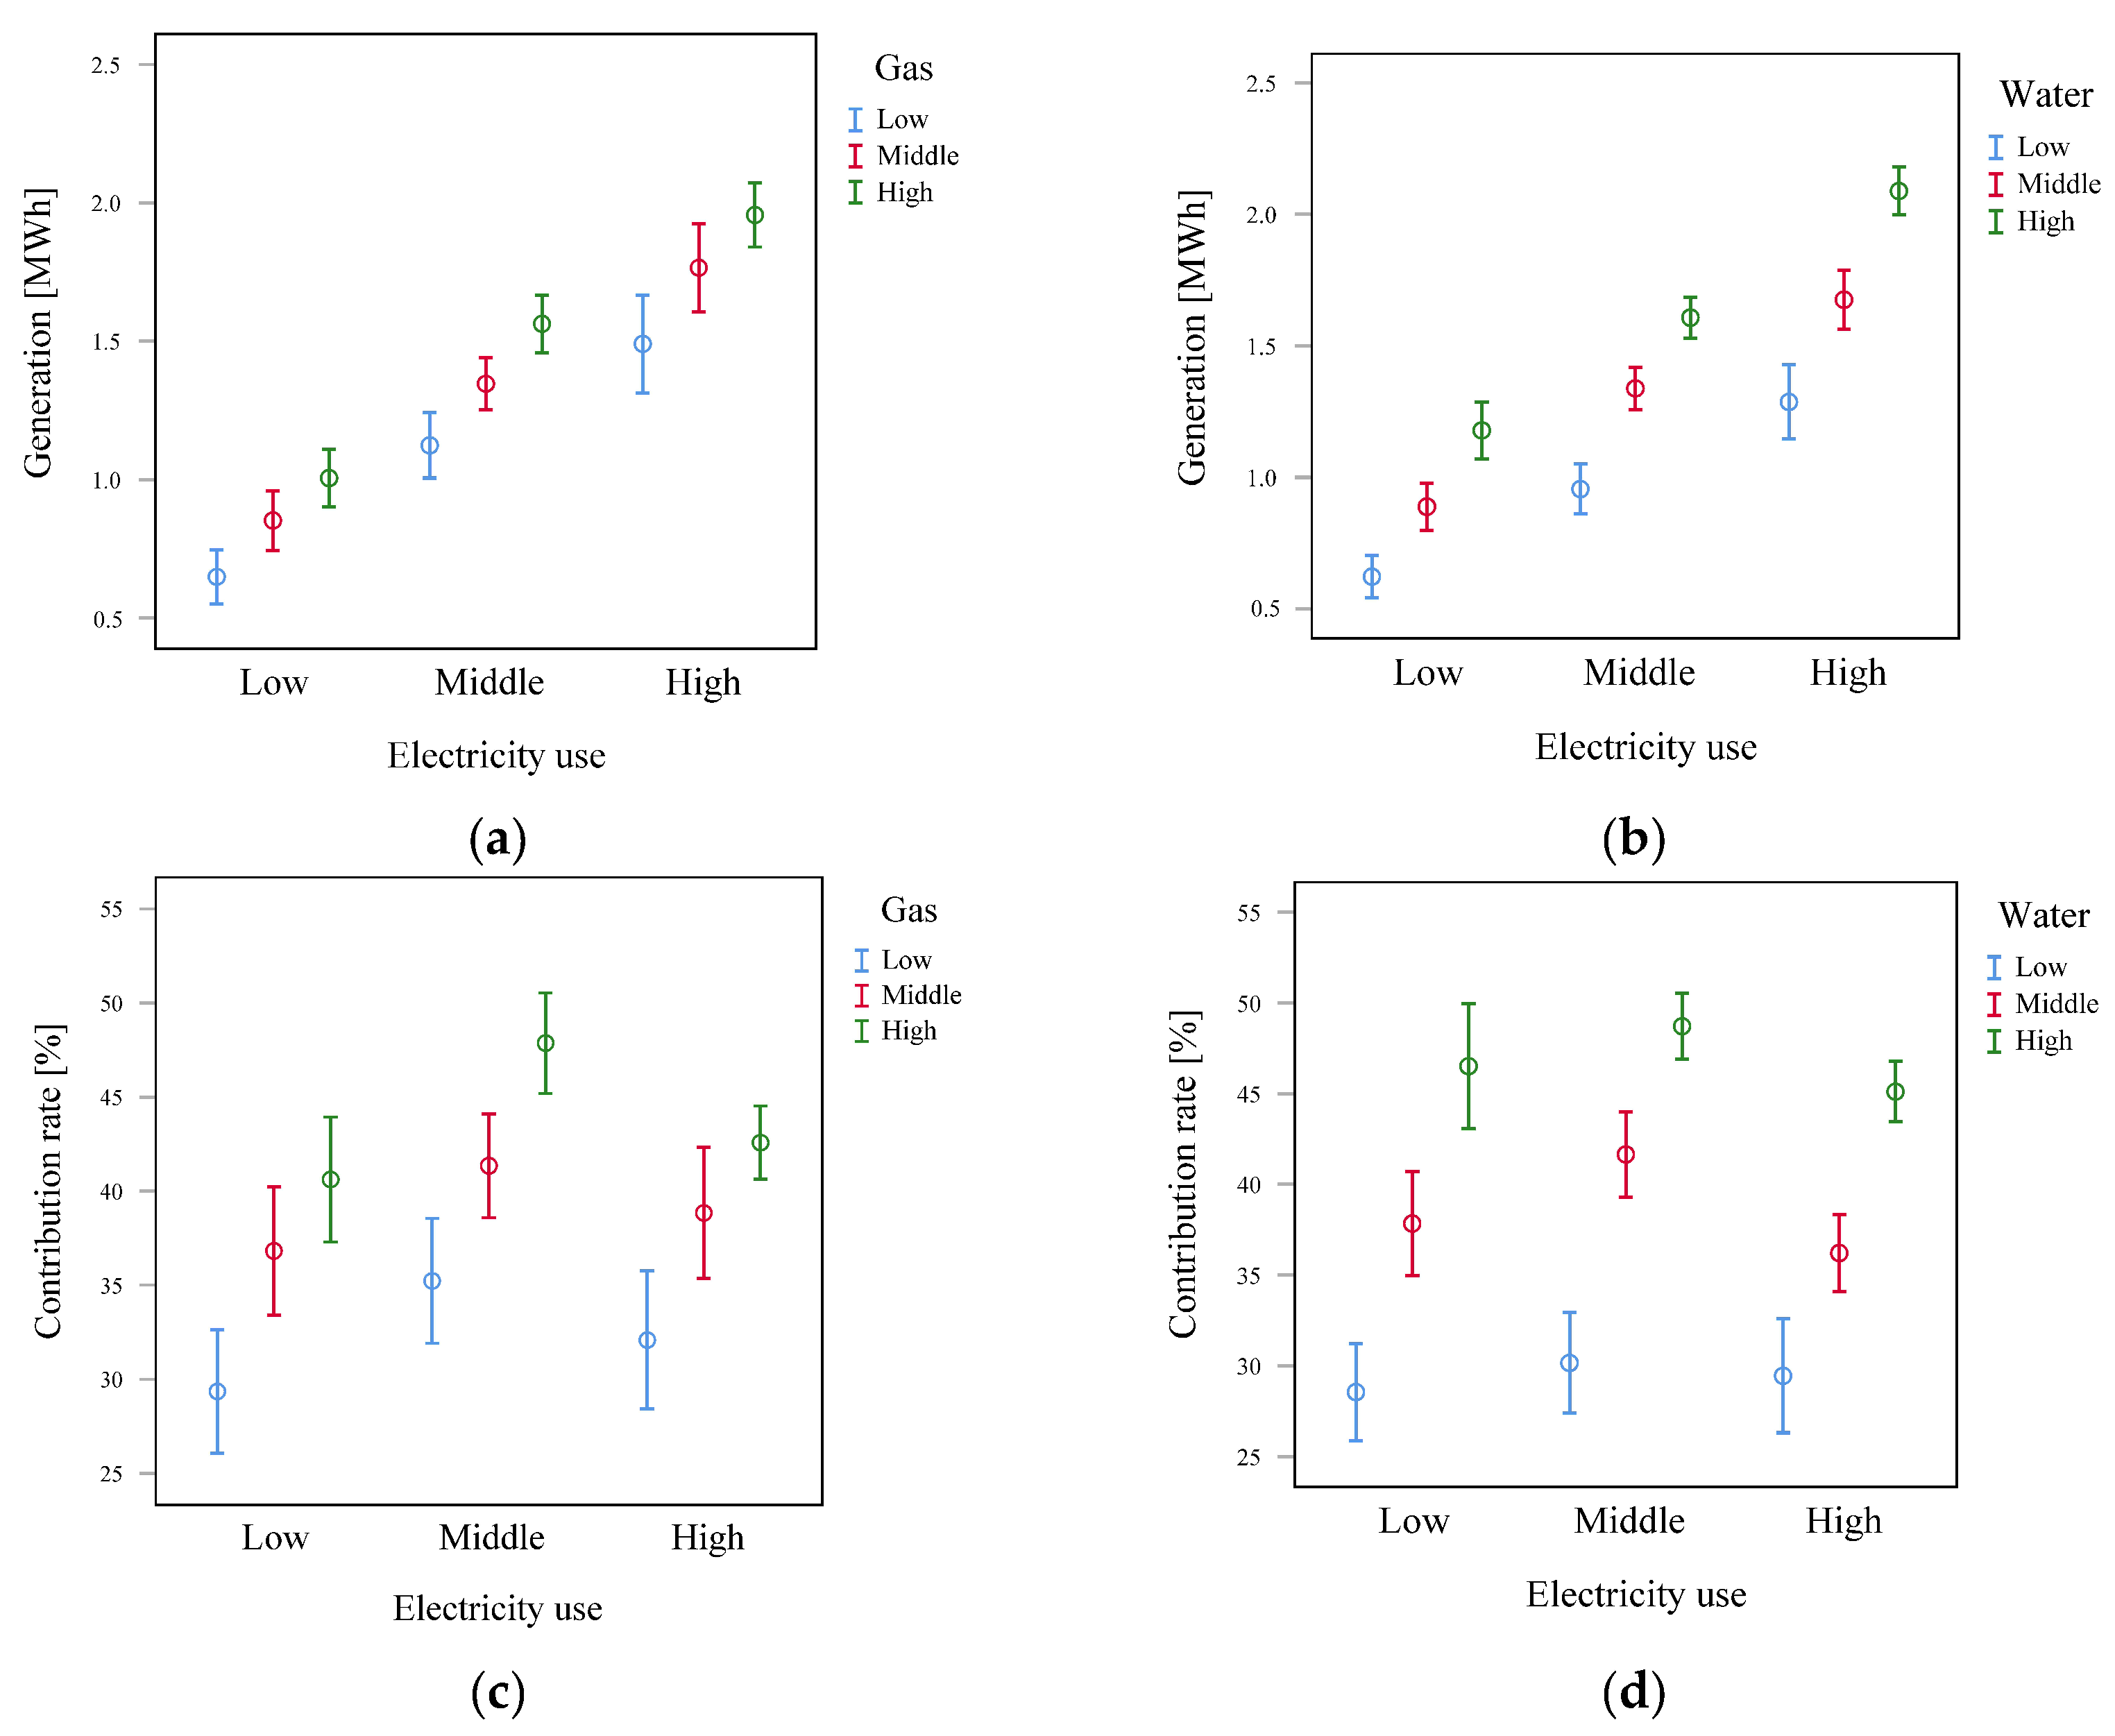
3.2. Relationship among the Factors of the Energy-Saving Effects of Cogeneration Systems (CGSs)

In this section, we analysed how electricity use affects the energy-saving effect of the cogeneration system (CGS) in terms of electricity generation, contribution rate, reduction in primary energy consumption, and reduction in CO2 emission.
Figure 4a shows the relationship between the annual electricity generation by the CGS and the annual electricity use. They are significantly correlated, but the growth rate tends to decrease as the annual electricity use exceeds 4 MWh/household. Figure 4b shows the contribution rate by the electricity use, whereby the rate shows a decrease as the annual electricity use exceeds 4 MWh/household. These tendencies may be related to the output capacity of the CGS.
The reduction values increased linearly with the increase in the electricity generation. They can be estimated using the following regression equations from the regression analysis:
RVpe = 6.6Eg − 0.45   (R2 = 0.998)
RVCO2 = 0.31Eg − 0.024   (R2 = 0.997)
where RVpe is the reduction value of the primary energy consumption (GJ), RV CO 2 is the reduction value of CO2 emission (t-CO2), and Eg is the generated electricity (MWh).
Figure 4c,d shows the relationship between the reduction rate of annual primary energy consumption or CO2 emission and the annual generated electricity. The reduction rates of primary energy consumption and CO2 emission showed a tendency to decrease as the annual generated electricity increased by more than 2 MWh/household, which could be related to the decrease in the contribution rate of the CGS in the range of high energy use (Figure 4b).

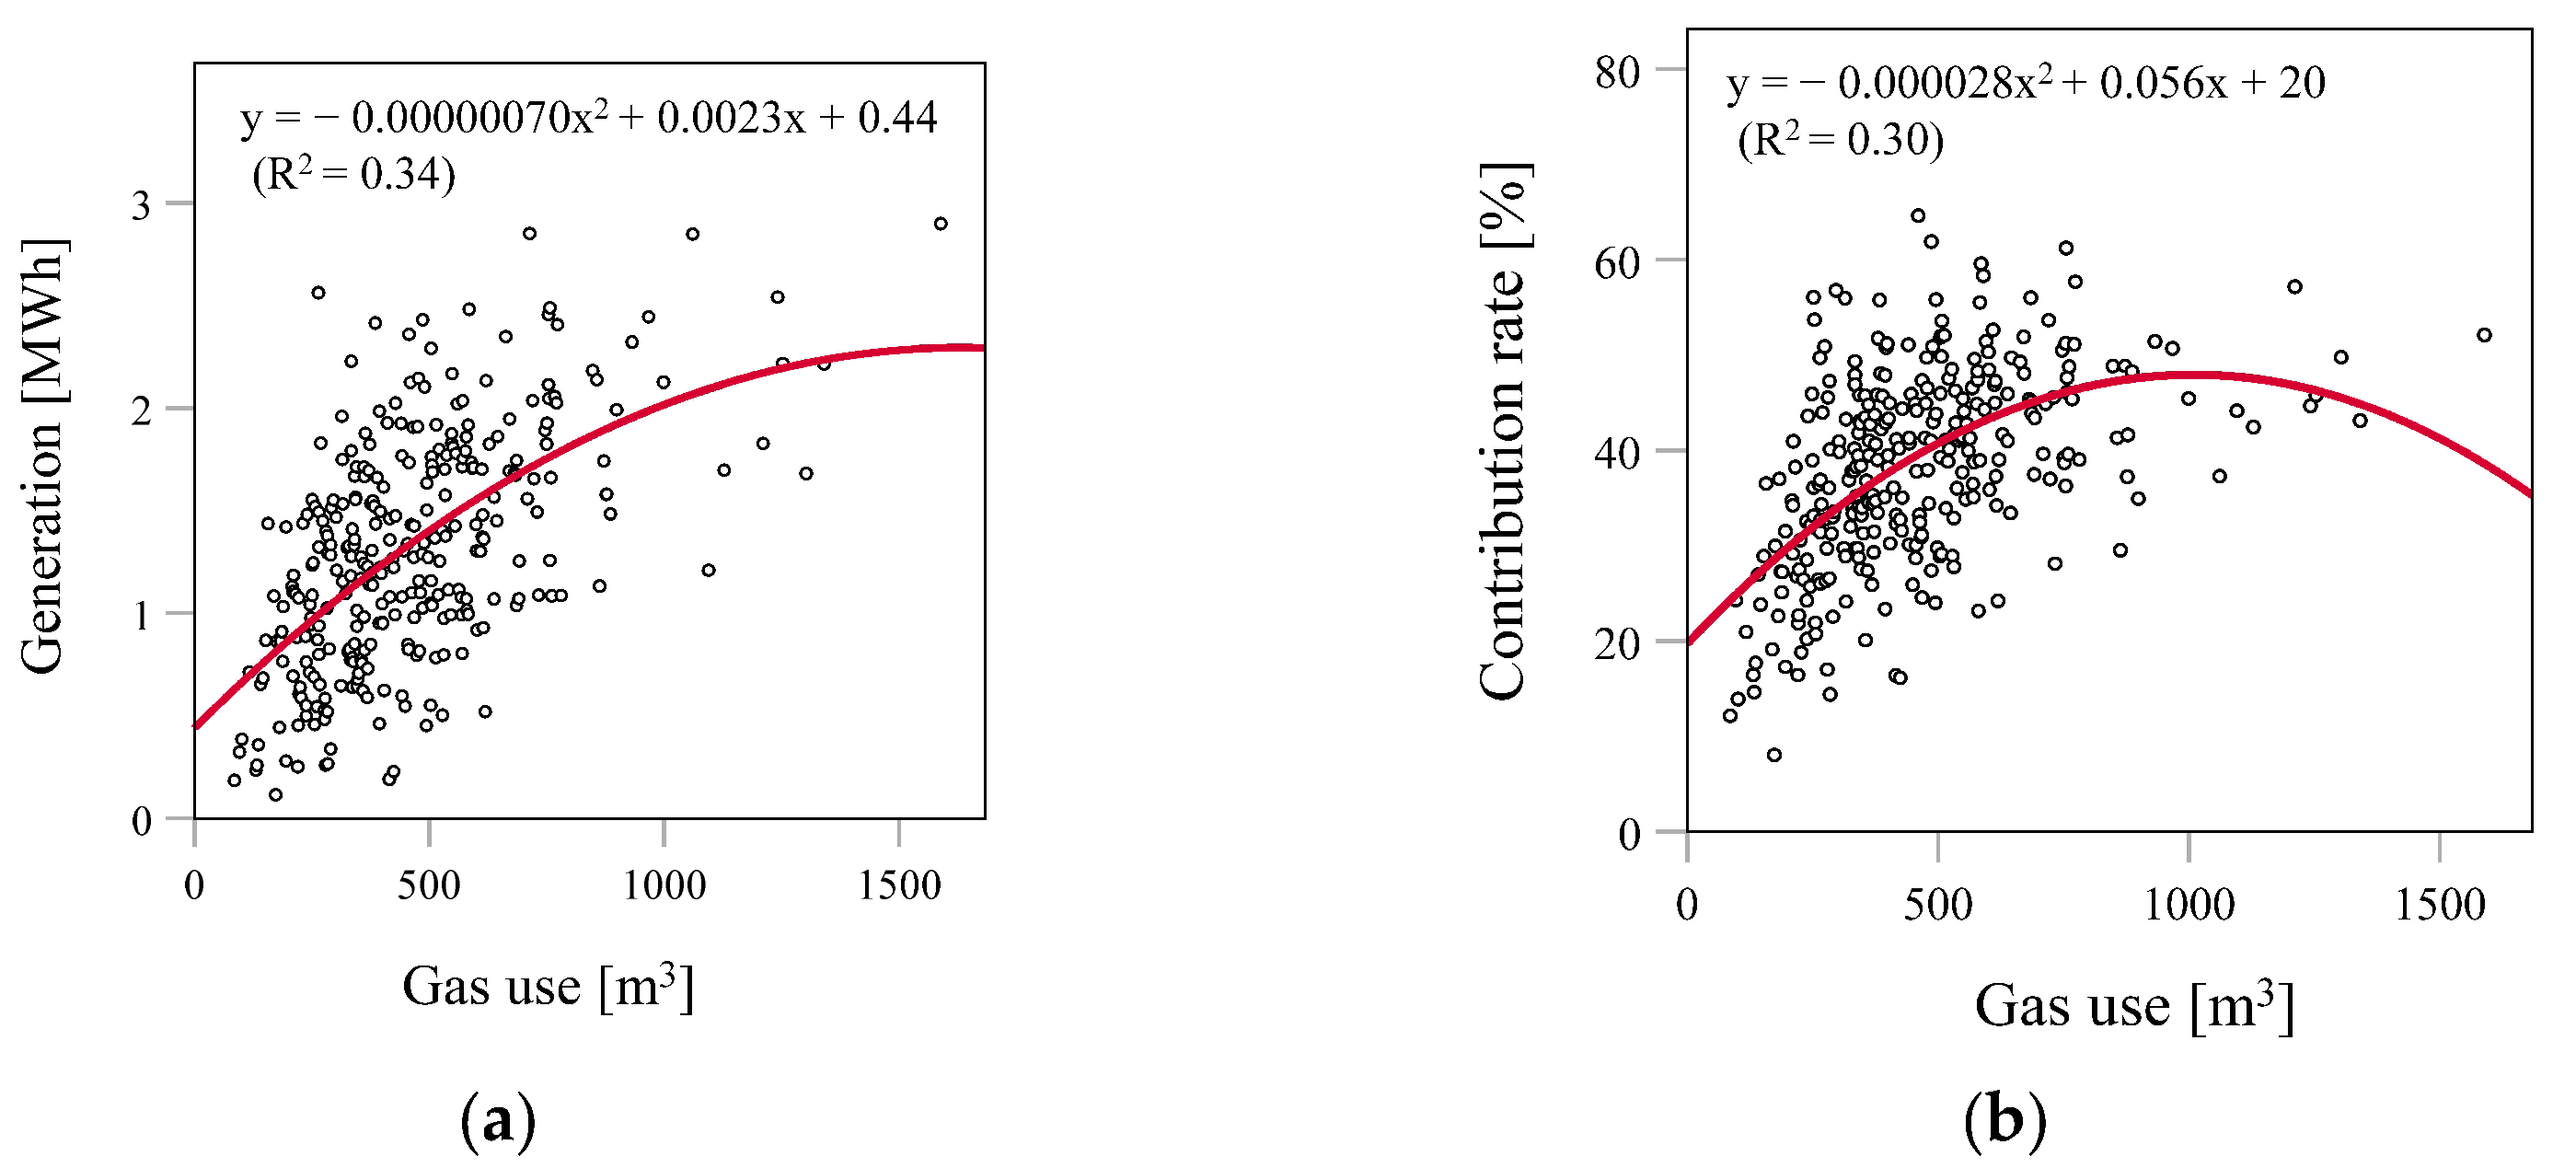
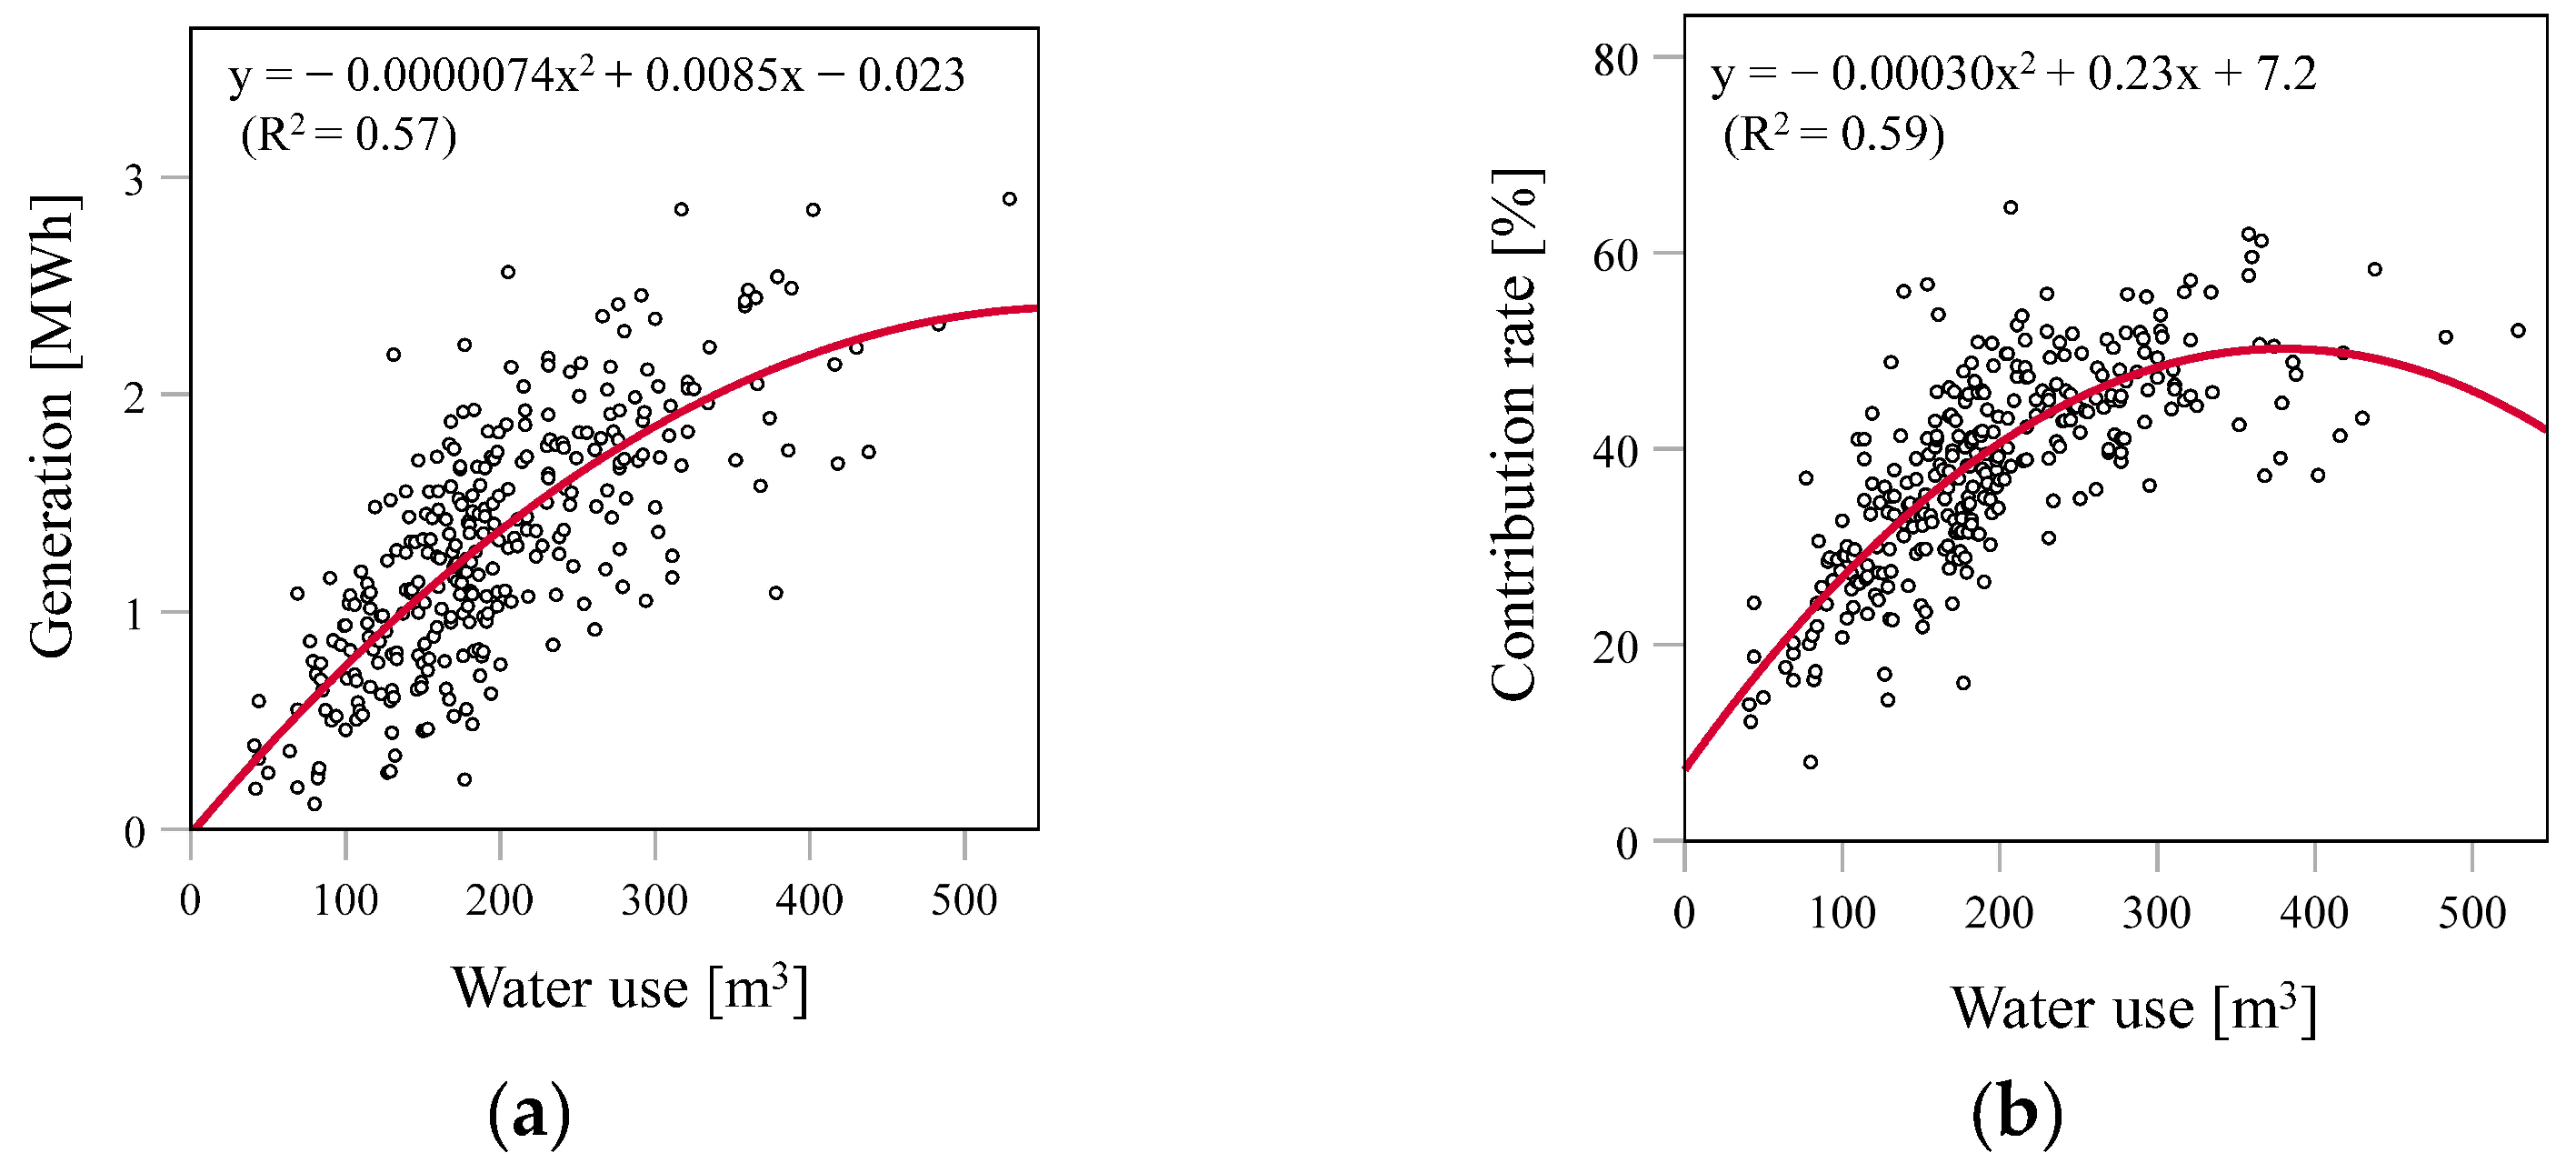
3.3. Relationship between the Energy-Saving Effect of the Cogeneration System (CGS) and Gas or Water Use

The cogeneration system (CGS) produces heat when electricity is generated, and this heat is utilised for boiling water. Therefore, in this section, we analysed how gas or water use affects the energy-saving effects of the CGS, i.e., electric power generation and contribution rate.
Figure 5 shows a significant correlation between the annual gas use except for the CGS and the energy-saving effect of the CGS. However, the R2 value was not high. This could relate to the fact that the gas use, except for the CGS, still includes several usages other than boiling water, i.e., floor heating, cooking, and bathroom heating.
Figure 6 shows the relationship between the annual water use and the energy-saving effect of the CGS. They were also significantly correlated, and the R2 value was high, especially the contribution rate comparing with electricity or gas. Therefore, it can be said that water use is the main factor affecting the contribution rate of the CGS.
We divided the annual electricity, gas, and water use data into three groups of 101–102 flats, as shown in Table 7. Figure 7 shows the error bars of the annual electricity generated by the CGS and the contribution rate, according to the level of electricity use, gas use (except for the CGS), or water use.
Comparing the influence of electricity and gas use, the electricity generation by the CGS was more affected by the electricity use, as shown in Figure 7a. However, the contribution rate was more affected by gas use (Figure 7c). In contrast, the influence of water use is higher for both electricity generation and contribution rate, as shown in Figure 7b,d. In particular, if the water use is high, the contribution rate is also high regardless of the electricity use.
The traditional Japanese bathing style requires a large amount of water in a bathtub; thus, the contribution rate is high in households with this bathing style.

3.4. Monthly Variation in the Electricity Generation of the Cogeneration System (CGS)

In this section, we analysed the monthly variation in energy use and the energy-saving effect of the cogeneration system (CGS). Figure 8a shows the monthly variation in mean electricity use per day, which consists of electricity generated by the CGS and purchased electricity. Figure 8b–d show the error bars of the monthly mean values per day of the contribution rate of the CGS, gas use (except for the CGS), and water use.
Electricity use is high in both summer and winter, and it is largely correlated to air conditioning usage (Figure 8a). The mean electricity generated by the CGS was lowest in August (2.3 kWh/day) and highest in February (5.1 kWh/day), and the contribution rate varied from 20% in August to 49% in March (Figure 8b). In previous studies, the mean contribution rate measured in detached houses varied from 11% in August to 41% in April [19]. Arinami et al. [22] showed that the contribution rate on the coolest day in summer was 15%. Although these values are slightly lower than our measured data, we found a similar seasonal tendency.
The mean gas use except for the CGS also varied from 0.5 m3/day in August to 2.3 m3/day in February (Figure 8c), while the mean water use was approximately the same level throughout the year, from 0.50 m3/day in August to 0.56 m3/day in February (Figure 8d).
Figure 9 shows the relationship between the monthly electricity use per day and the outdoor air temperature. Because of the variation in electricity use by flat (Figure 9a), we also used the binned data by monthly mean (Figure 9b). The regression coefficient was the same for both sets of data. Due to the nature of the binned data [34], the coefficient of determination (R2) of the monthly data is substantially higher than the monthly mean data of each flat. The quadratic curve is the lowest at 17–18 °C. In Japan, most residents use air conditioners in individual rooms not only for cooling but also for heating, as well as gas floor heating in the living–dining room. As a result, the total electricity use was high in both summer and winter.
Figure 10 shows the relationship between the monthly mean energy-saving effect of the CGS and the outdoor air or water temperature. Electricity generated by the CGS decreases as the outdoor air or water temperature increases. The reason for high electric power generation in winter is that more energy is required to heat the colder water, and there is a preference for hot water rather than cold water in winter, although the amount of monthly mean water use per day is similar all year round, as shown in Figure 8d. The contribution rate also decreased as the temperature increased or decreased from approximately 13–14 degrees (Figure 10b).

3.5. Variation in the Energy-Saving Effect of the Cogeneration System (CGS) by the Type of Residents

In this section, we analysed the relationship between the energy-saving effect of the CGS and the type of residents. Figure 11 shows the error bars of electricity use, water use, generated electricity, and contribution rate by family size. All values increased as family size increased, the mean contribution rate increased from 35% in single families to 43% in 4–6 family members. Family sizes of 4–6 had significantly higher results than those of singles or couples. These results indicate that the large family size used the CGS more effectively than small families due to the higher amount of hot water demand as well as electricity demand.
We have also analysed the characteristics of residents such as age of householders, employment status of married women, and age of youngest child, as shown in Table 5. However, we could not find any significant difference in energy-saving effect of the CGS in each comparison of the characteristics.

4. Conclusions

We measured 1-year energy data in the condominium where the polymer electrolyte fuel cell cogeneration system (CGS) had been installed in each flat for the first time in the world and found four main results.
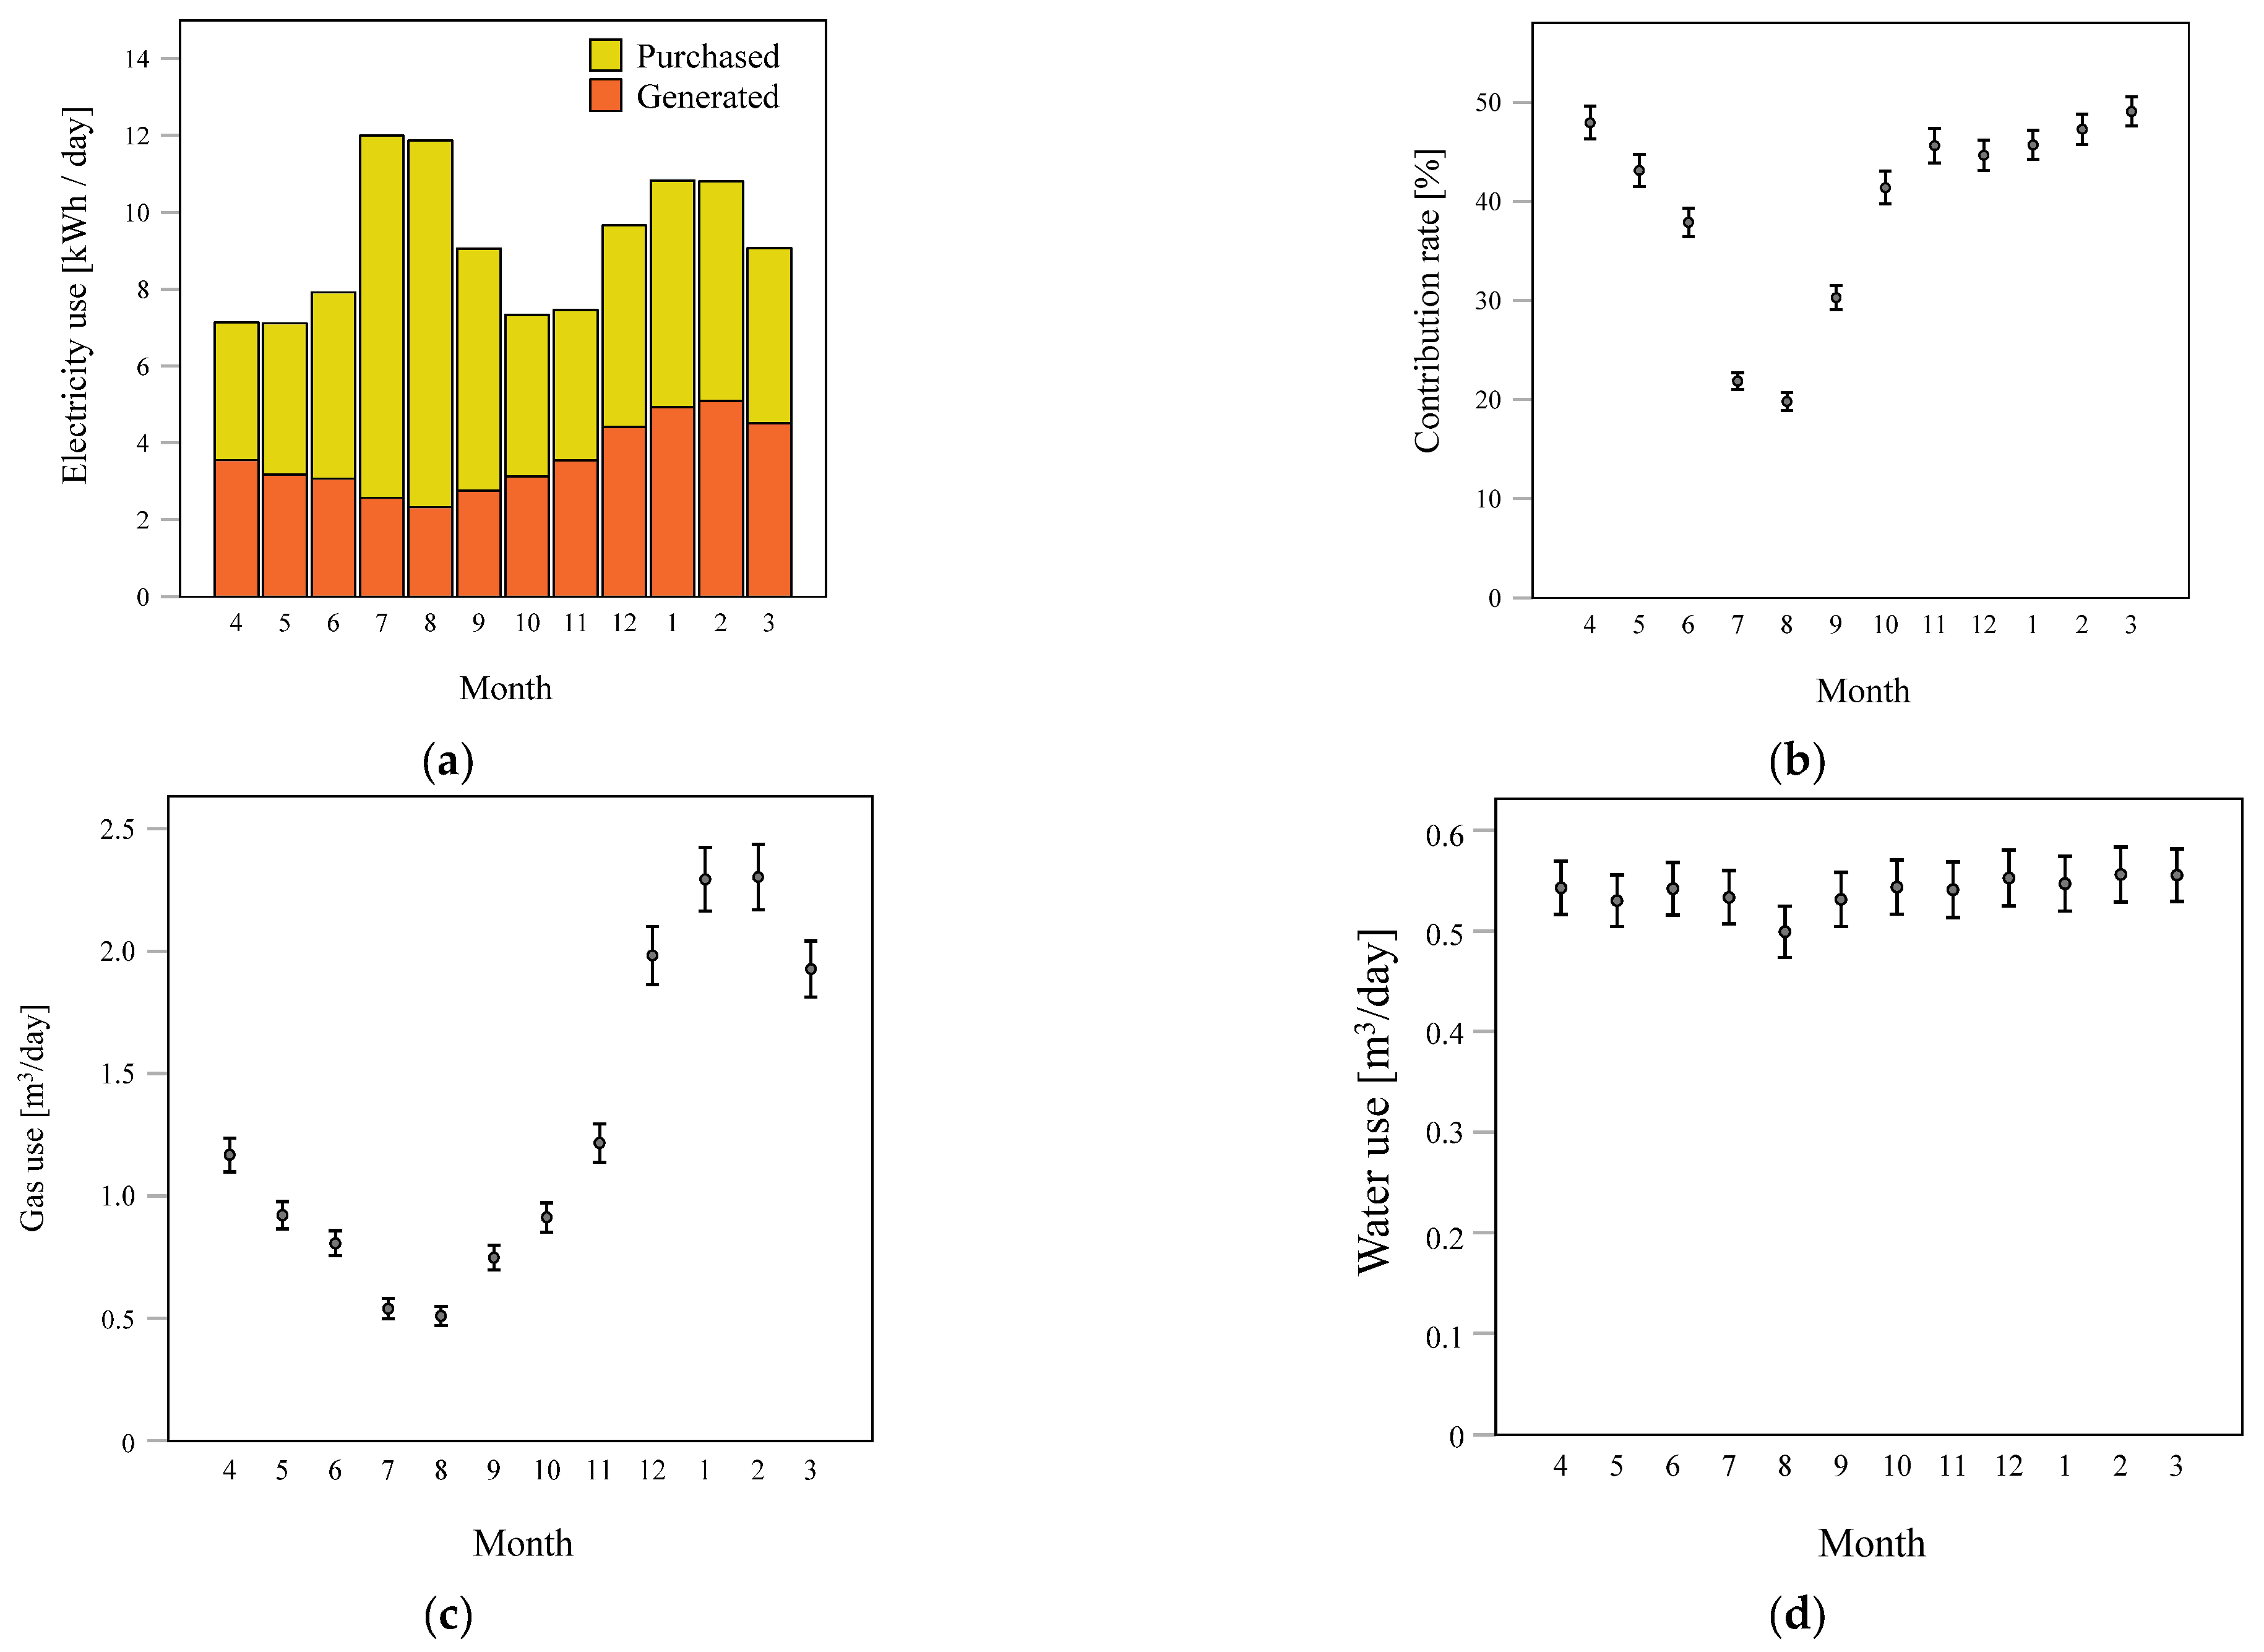
  • CGS in the investigated condominium provided both a part of the hot water demand and 38.2% of the electric power demand, thereby reducing the required amount of purchased power. The generated electricity contributed to a 12.3% reduction in the primary energy consumption and an 11.7% reduction in CO2 emission compared with the residents who use the conventional gas boilers and purchase all of the electricity demand.
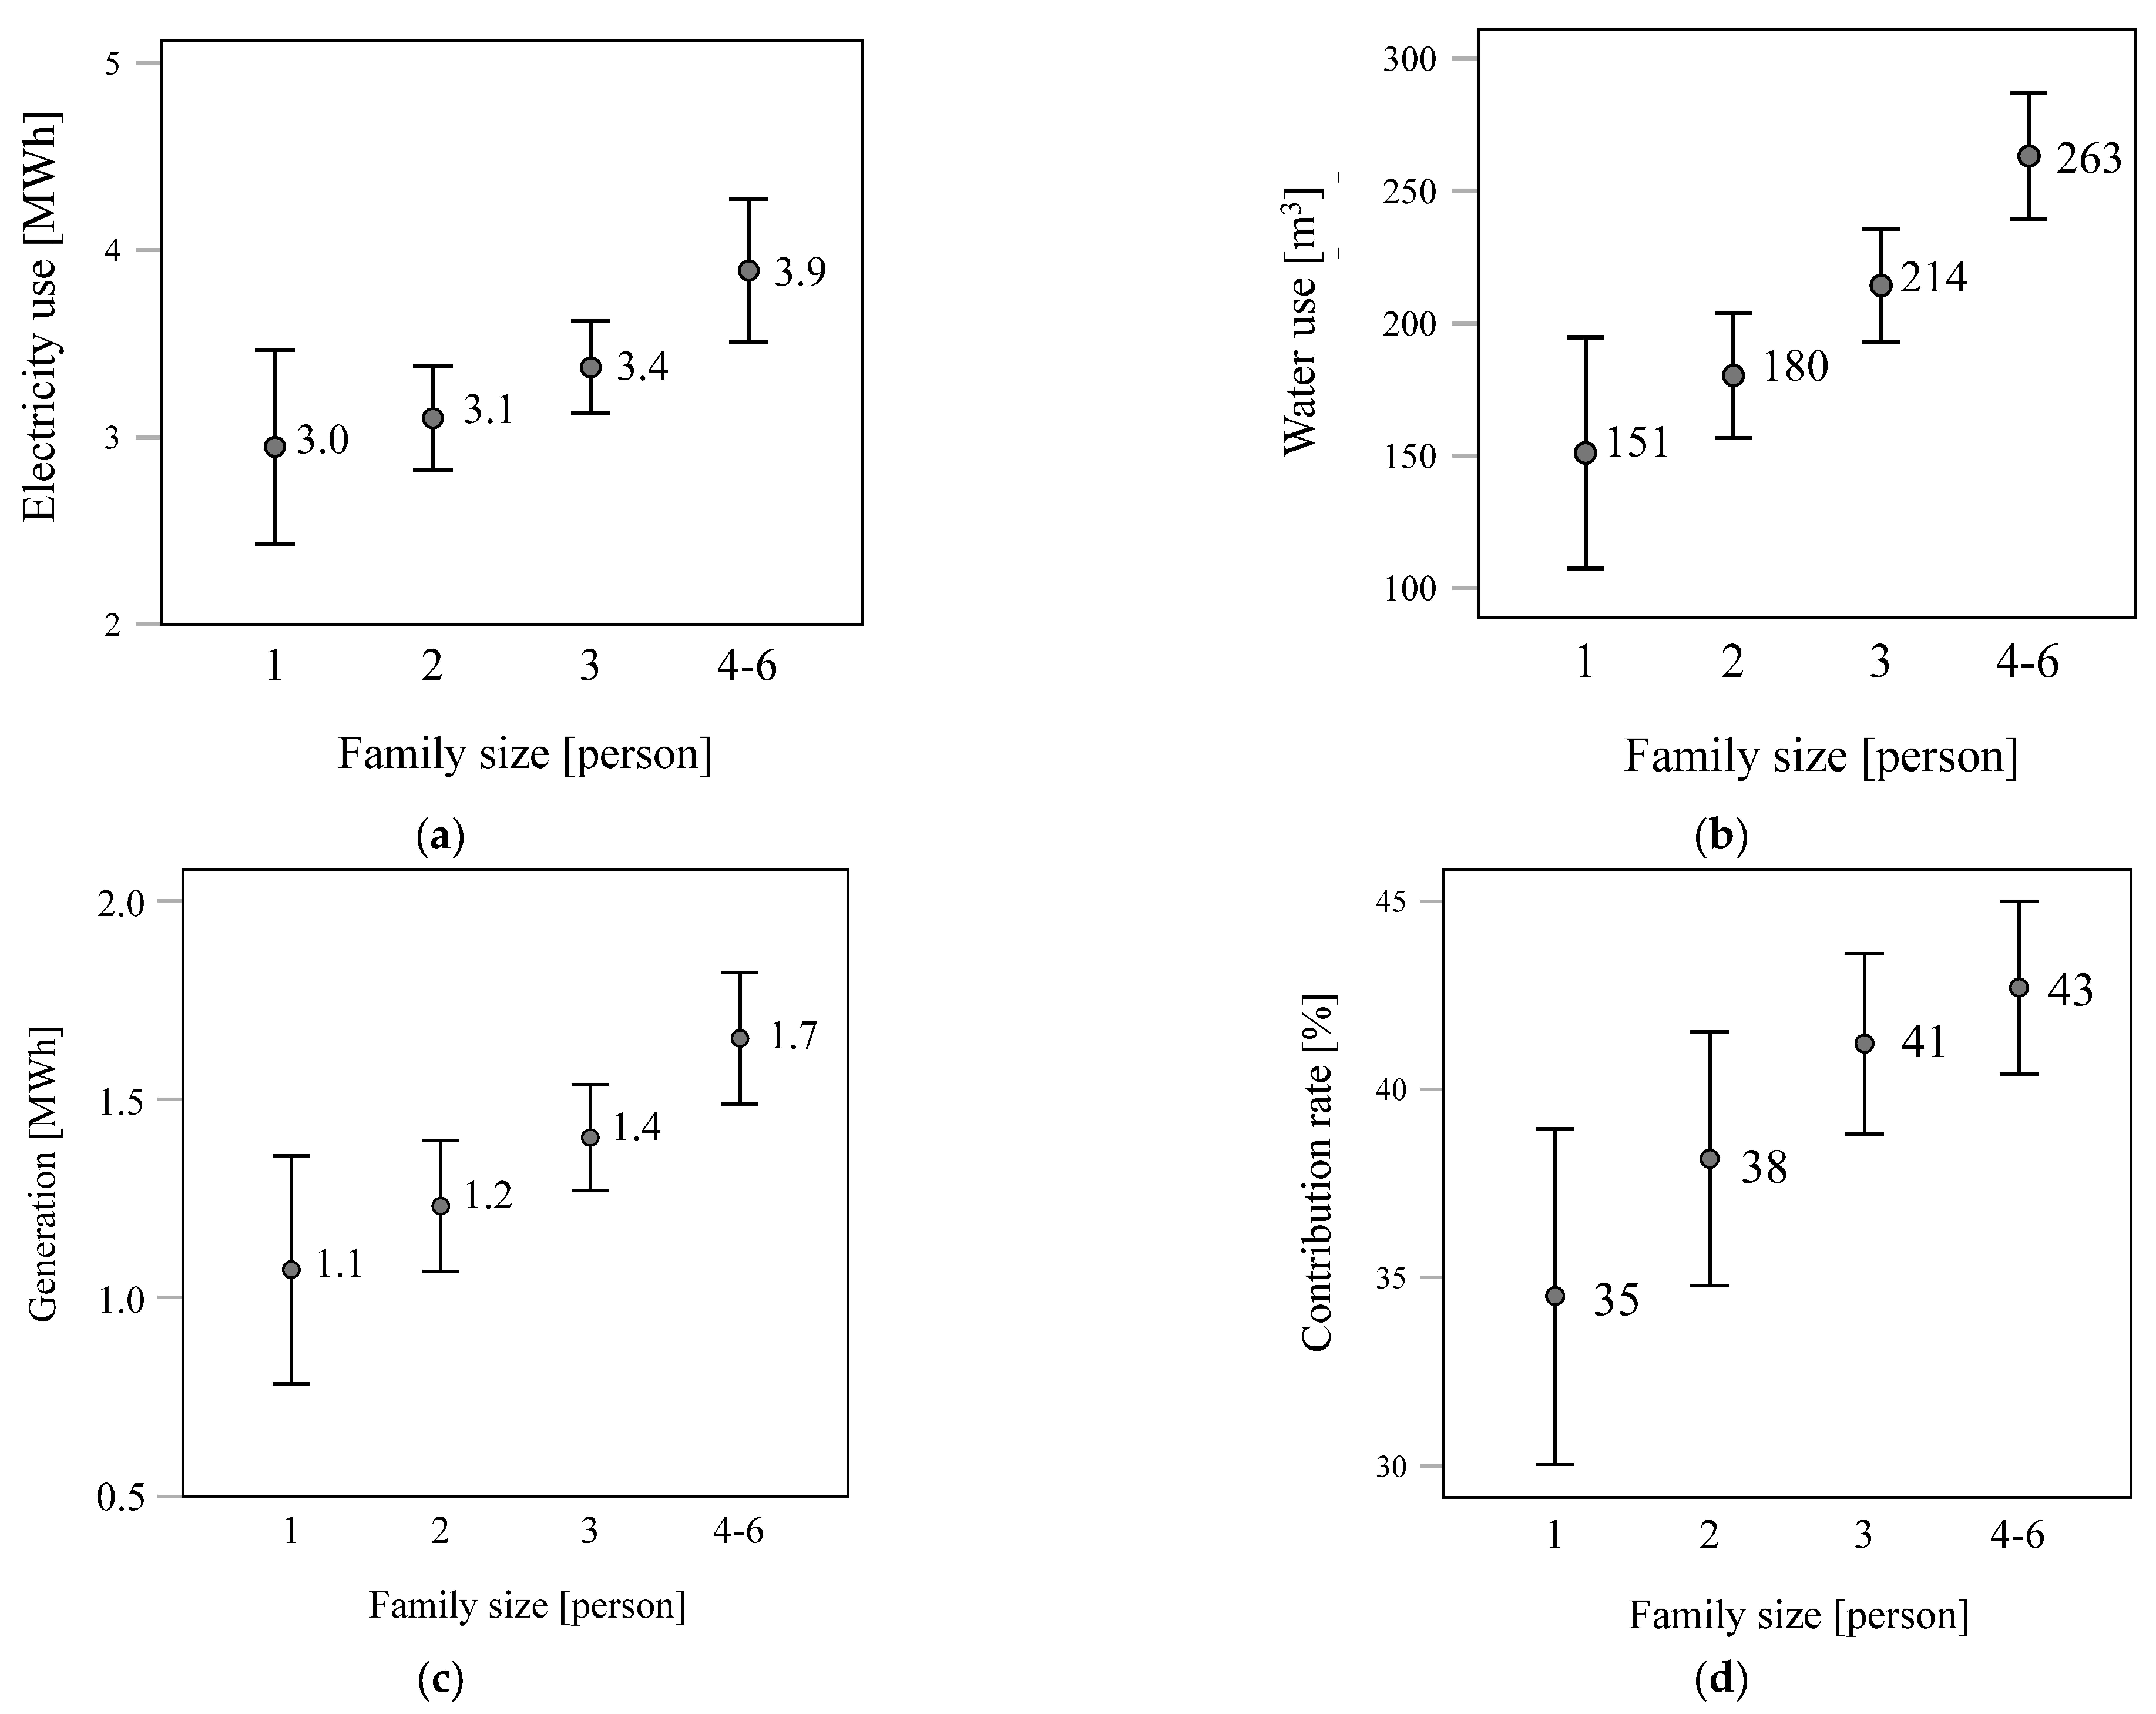
  • Electricity generation by CGS was affected by electricity use, gas use, and water use, but most importantly by hot water use. The contribution rate of the CGS increased with the increase in annual electricity use but decreased when the usage exceeded 4 MWh/household. In contrast, the contribution rate was high in households with high water use, even if the electricity use was low. A large amount of water use likely indicates a high amount of hot water demand, especially in winter.
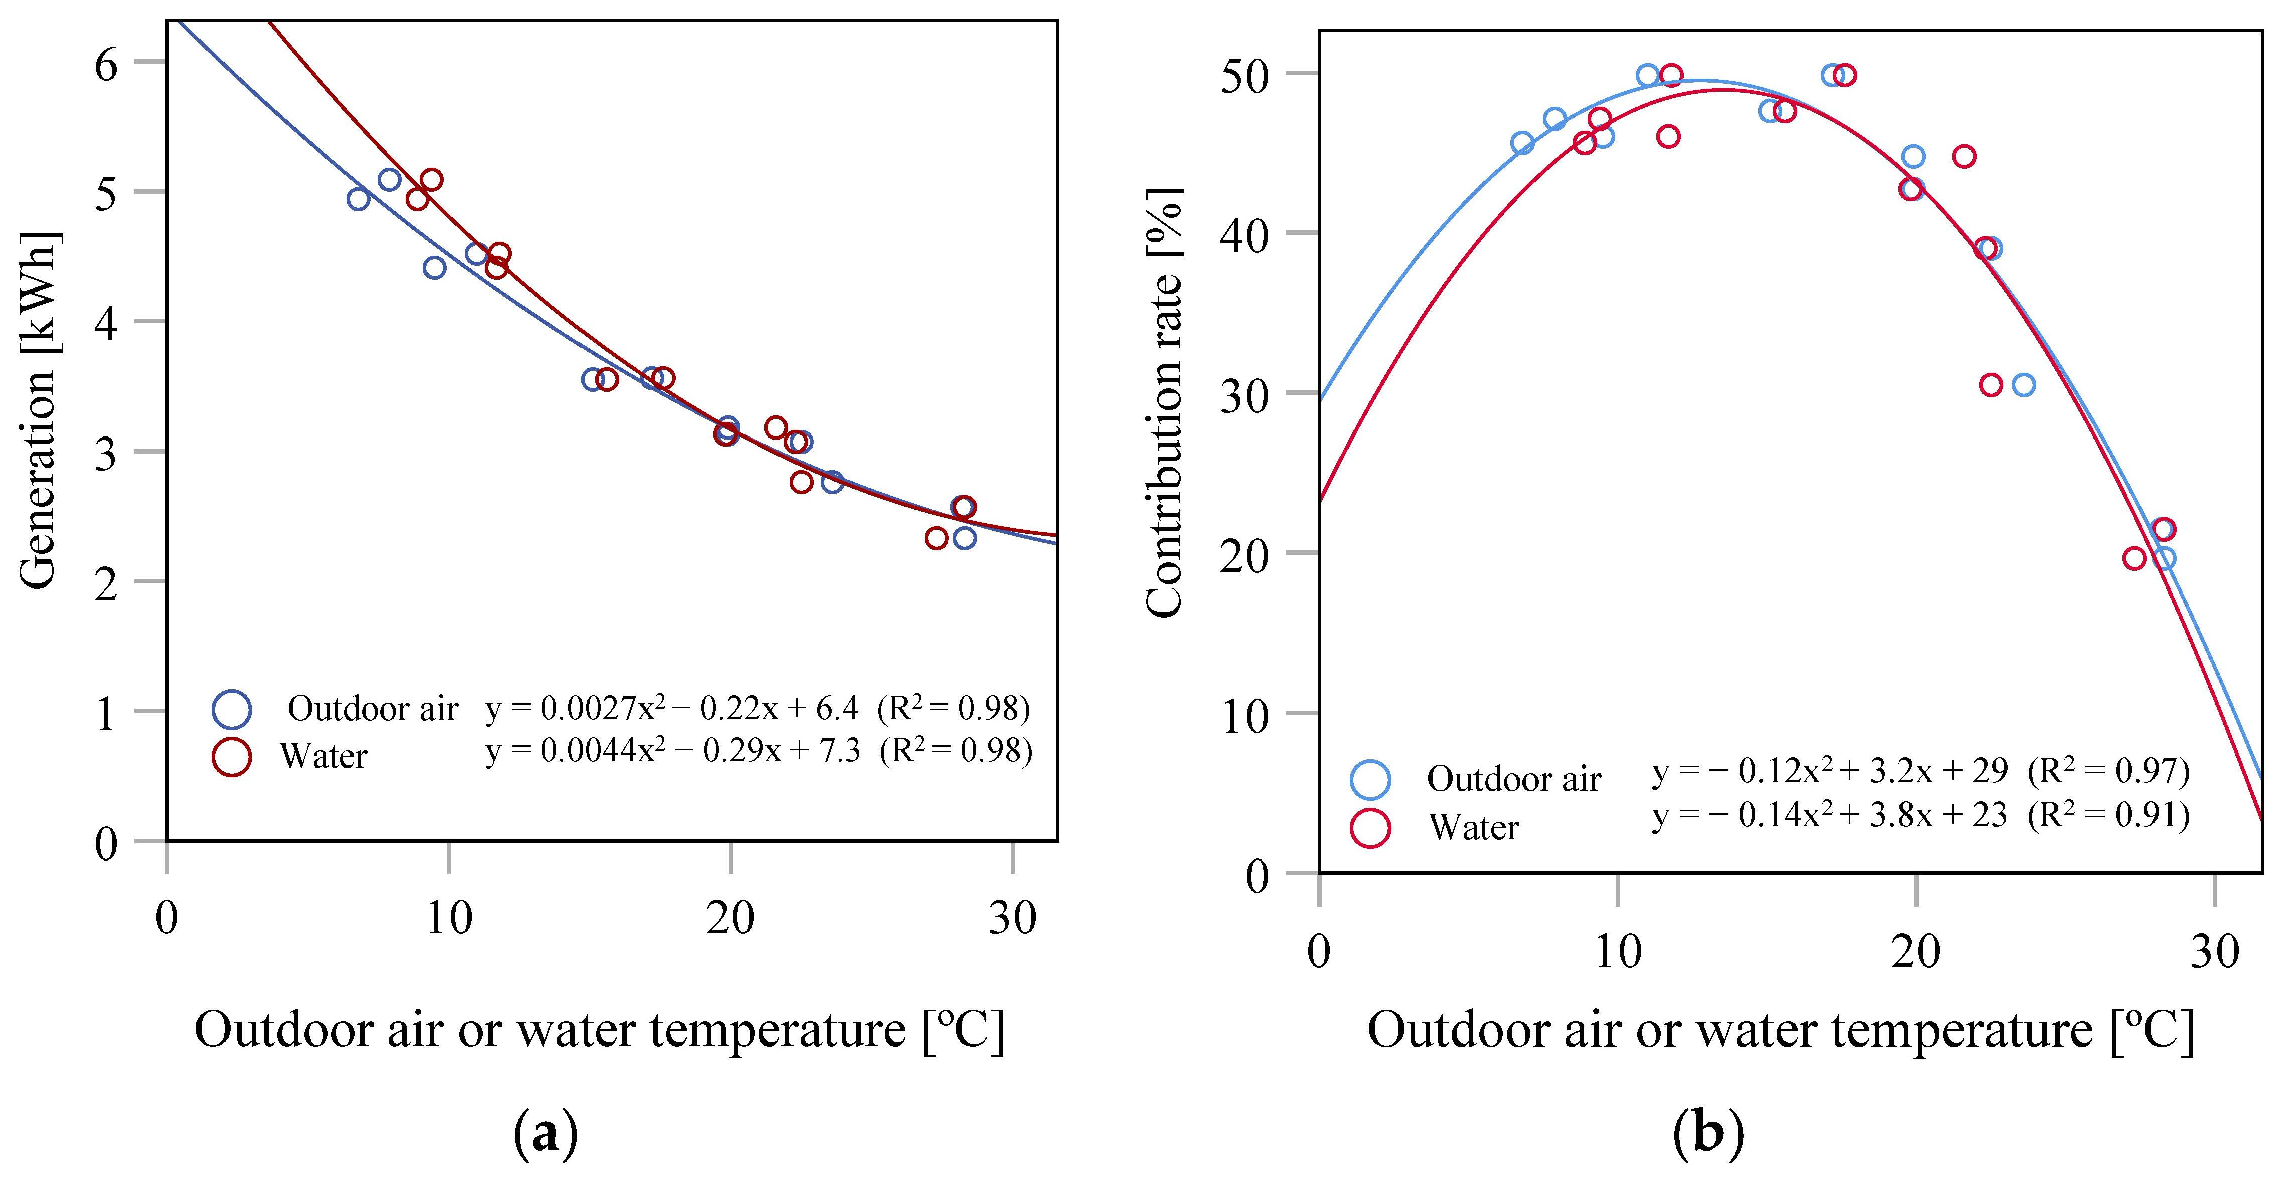
  • The amount of electricity generated by CGS changes monthly; it is lowest in August (2.3 kWh/day) and highest in February (5.1 kWh/day). It varies according to outdoor air or water temperature. Water use was similar throughout the year; thus, the reason could be that the heat energy demand for boiling water increases in winter. In Japan, people have a custom of bathing frequently, and this bathing lifestyle might affect the efficiency of CGS.
  • Large families use considerable amounts of water as well as electricity, and as a result, the energy-saving effect is high in large families. For example, the mean contribution rate increases from 35% in single families to 43% in 4–6 family members.
From these results, we can conclude that CGS contributes to the reduction in the primary energy consumption and CO2 emission and generates large amounts of electricity in households where the electricity demand is high. As for the contribution to the reduction in purchased electricity, the efficiency is high in households where the hot water demand is high.
A residential cogeneration system has strong potential for the supplier side; it reduces the peak load of the power plant and losses caused by the transmission. On the consumer side, it reduces the purchased electricity, and residents can use the water stored in the tank if a natural disaster occurs. Thus, it is recommended that the cogeneration system should be installed in existing and new buildings to contribute to the energy-saving and CO2-emissions-reduction targets of the Japanese Government.

Author Contributions

As a primary author, K.Y. contributed to the data collection, analysis, manuscript writing, and prepared the final draft of the manuscript. H.B.R. revised the content of the paper, contributed to the editing and structuring of the paper, and advised on the data analysis. K.B., A.M. and H.A. provided advice for the data analysis. All authors have read and agreed to the published version of the manuscript.

Funding

This research was funded by the Ministry of Land, Infrastructure, Transport, and Tourism (MLIT) through “The Leading Projects for Promoting CO2 reduction in Hosing and Building, 2013”.

Acknowledgments

We would like to thank the householders who participated in the survey, the HEMS servicer, and other people involved in this study.

Conflicts of Interest

The authors declare no conflict of interest.

References

  1. United Nations Framework Convention on Climate Change. The Paris Agreement. Available online: https://unfccc.int/sites/default/files/english_paris_agreement.pdf (accessed on 25 July 2021).
  2. Government of Japan. Submission of Japan’s Nationally Determined Contribution, 17 July 2015. Available online: https://www4.unfccc.int/sites/ndcstaging/PublishedDocuments/Japan%20First/20150717_Japan’s%20INDC.pdf (accessed on 9 April 2021).
  3. Ministry of Economy, Trade and Industry Government of Japan. White Paper of Energy in 2018. Available online: https://www.enecho.meti.go.jp/about/whitepaper/ (accessed on 19 August 2021). (In Japanese).
  4. Ministry of Environment Government of Japan: Global Warming Countermeasures Plan, 13 May 2016. Available online: https://www.env.go.jp/press/102512.html (accessed on 9 April 2021).
  5. Prime Minister of Japan and His Cabinet. Greenhouse Gas Emissions to Zero by 2050. Available online: https://japan.kantei.go.jp/tyoukanpress/202010/26_p.html (accessed on 25 July 2021).
  6. Tanabe, S.; Iwahashi, Y.; Tsushima, S.; Nishihara, N. Thermal comfort and productivity in offices under mandatory electricity savings after the Great East Japan earthquake. Archit. Sci. Rev. 2013, 56, 4–13. [Google Scholar] [CrossRef]
  7. Indraganti, M.; Ooka, R.; Rijal, H.B. Thermal comfort in offices in summer: Findings from a field study under the ‘setsuden’ conditions in Tokyo, Japan. Build. Environ. 2013, 61, 114–132. [Google Scholar] [CrossRef]
  8. Ministry of Economy, Trade and Industry Government of Japan. The Strategic Road Map for Hydrogen and Fuel Cells. Available online: https://www.meti.go.jp/press/2018/03/20190312001/20190312001-3.pdf (accessed on 25 July 2021).
  9. Ferguson, A.; Ugursal, V.I. Fuel cell modelling for building cogeneration applications. J. Power Sources 2004, 137, 30–42. [Google Scholar] [CrossRef]
  10. Dorer, V.; Weber, R.; Weber, A. Performance assessment of fuel cell micro-cogeneration systems for residential buildings. Energy Build. 2005, 37, 1132–1146. [Google Scholar] [CrossRef]
  11. Dorer, V.; Weber, R.; Weber, A. Energy and CO2 emissions performance assessment of residential micro-cogeneration systems with dynamic whole-building simulation programs. Energy Convers. Manag. 2009, 50, 648–657. [Google Scholar] [CrossRef]
  12. Pellegrino, S.; Lanzini, A.; Leone, P. Techno-economic and policy requirements for market-entry of the fuel cell micro-CHP system in the residential sector. Appl. Energy 2015, 143, 370–382. [Google Scholar] [CrossRef]
  13. Di Marcoberardino, G.; Manzolini, G. Investigation of a 5 kW micro-CHP PEM fuel cell based system integrated with membrane reactor under diverse EU natural gas quality. Intern. J. Hydrog. Energy 2017, 42, 13988–14002. [Google Scholar] [CrossRef]
  14. Kuroki, H.; Shimizu, S.; Takaguchi, H.; Watanabe, T. Effective operation methods and energy conservation effect of housing polymer electrolyte fuel cell co-generation systems—Installation effect of distributed power and heat source system for housing (Part 1). J. Environ. Eng. AIJ 2006, 610, 67–73. (In Japanese) [Google Scholar] [CrossRef] [Green Version]
  15. Wakui, T.; Wada, N.; Yokohama, R. Energy-saving effect of a residential polymer electrolyte fuel cell cogeneration system combined with a plug-in hybrid electric vehicle. Energy Convers. Manag. 2014, 77, 40–51. [Google Scholar] [CrossRef]
  16. Aoki, T.; Habara, H.; Shimoda, Y. Analysis of the effect of introducing residential cogeneration systems based on the demand characteristics of households. J. Jpn. Soc. Energy Resour. 2015, 37, 9–16. (In Japanese) [Google Scholar]
  17. Ono, Y.; Haneda, T.; Ikegami, T.; Akisawa, A. Potential of producing hydrogen for fuel-cell vehicles by residential fuel cell co-generation utilizing idle capacity. J. Jpn. Inst. Energy 2017, 96, 478–486. (In Japanese) [Google Scholar] [CrossRef] [Green Version]
  18. Yamamoto, T.; Amatatsu, K.; Sumiyoshi, D. Estimation energy saving effects of sharing fuel cell with two households by simulation program. J. Environ. Eng. AIJ 2018, 83, 365–374. (In Japanese) [Google Scholar] [CrossRef]
  19. Yamamoto, T.; Sumiyoshi, D. Analysis of fuel cell performance on detached house with HEMS measurement data in a smart town. AIJ J. Technol. Des. 2018, 24, 727–732. (In Japanese) [Google Scholar] [CrossRef]
  20. Yamamoto, T.; Sumiyoshi, D.; Choi, Y. Study of energy saving effect and catch up to electric, demand of fuel cell for residence with detailed measurement survey in an actual house. J. Environ. Eng. AIJ 2020, 85, 45–54. (In Japanese) [Google Scholar] [CrossRef]
  21. Akabayashi, S.; Sakaguchi, J.; Oshima, T.; Ichikawa, H.; Arinami, Y. Peak electricity demand reduction by installation of fuel cell cogeneration system in residences—Part 1 Results of simulations for the district of Tohoku electric power company. J. Environ. Eng. AIJ 2013, 78, 639–644. (In Japanese) [Google Scholar] [CrossRef] [Green Version]
  22. Arinami, Y.; Sakaguchi, J.; Akabayashi, S. Study on primary energy reduction effect by installing home-use fuel cell cogeneration system. J. Environ. Eng. AIJ 2019, 84, 687–697. (In Japanese) [Google Scholar] [CrossRef]
  23. Statistics Bureau of Japan. Dwellings by Type of Building (4 Groups) and Construction Material (5 Groups)—Japan, 3 Major Metropolitan Areas, Prefectures and Major Cities (1988~2018). Available online: https://www.e-stat.go.jp/stat-search/files?page=1&layout=datalist&toukei=00200522&tstat=000001127155&cycle=0&year=20180&month=0&tclass1=000001140366&tclass2val=0 (accessed on 24 July 2021). (In Japanese).
  24. Rijal, H.B.; Yoshida, K.; Humphreys, M.A.; Nicol, J.F. Development of an adaptive thermal comfort model for energy-saving building design in Japan. Archit. Sci. Rev. 2021, 64, 109–122. [Google Scholar] [CrossRef]
  25. KC, R.; Rijal, H.B.; Shukuya, M.; Yoshida, K. An investigation of the behavioral characteristics of higher- and lower-temperature group families in a condominium equipped with a HEMS system. Buildings 2019, 9, 4. [Google Scholar] [CrossRef] [Green Version]
  26. KC, R.; Rijal, H.B.; Shukuya, M.; Yoshida, K. An in-situ study on occupants’ behaviors for adaptive thermal comfort in a Japanese HEMS condominium. J. Build. Eng. 2018, 19, 402–411. [Google Scholar] [CrossRef]
  27. Tokyo Gas Co., Ltd.; Panasonic Corporation. World’s First “Ene-Farm” Home Fuel Cell for Condominiums to be Released. Available online: https://news.panasonic.com/global/press/data/2013/10/en131021-5/en131021-5.html (accessed on 27 September 2021).
  28. Building Research Institute (National R & D Corporation in Japan). Technical Information about the Evaluation of the Energy Consumption Performance for Houses Based on the Energy-Saving Standard in 2016, 7-1-22. Available online: https://www.kenken.go.jp/becc/documents/house/7-1_210401_v23.pdf (accessed on 22 September 2021). (In Japanese).
  29. Ministry of the Environment Government of Japan. Emission Factor of Electric Company. Available online: https://www.env.go.jp/press/ondanka/113100.pdf (accessed on 9 April 2021). (In Japanese).
  30. Japan Meteorological Agency. AMeDAS (Automated Meteorological Data Acquisition System). Available online: http://www.data.jma.go.jp/obd/stats/etrn/index.php (accessed on 9 April 2021). (In Japanese).
  31. The Bureau of Waterworks, Tokyo Metropolitan Government. Water Temperature at Shinjuku. Available online: https://www.waterworks.metro.tokyo.lg.jp/suigen/topic/03/03_kako_h30.html (accessed on 24 July 2021). (In Japanese).
  32. National Institute of Population and Social Security Research (in Japan). Released Data of Change in Household in 2014. Available online: http://www.ipss.go.jp/ps-dotai/j/DOTAI7/NSHC07_top.asp (accessed on 24 July 2021). (In Japanese).
  33. Ministry of Health, Labour and Welfare Government of Japan. White Paper in 2018. Available online: https://www.mhlw.go.jp/stf/wp/hakusyo/kousei/18/index.html (accessed on 24 July 2021). (In Japanese).
  34. Gautam, B.; Rijal, H.B.; Shukuya, M.; Imagawa, H. A Field Investigation on the Wintry Thermal Comfort and Clothing Adjustment of Residents in Traditional Nepalese Houses. J. Build. Eng. 2019, 26, 100886. [Google Scholar] [CrossRef]
Figure 1. (a) Investigated condominium; (b) installed polymer electrolyte fuel cell cogeneration system (CGS).
Energies 14 06611 g001
Figure 2. Annual distribution (n = 304): (a) electricity generation; (b) gas use (except for CGS); (c) water use; (d) contribution rate; (e) reduction rate of primary energy consumption; (f) reduction rate of CO2 emission.
Energies 14 06611 g002
Figure 3. Variation of daily energy use (example data of a flat on 1 February): (a) electricity generated by CGS and purchased; (b) gas use (except for CGS) and water use.
Energies 14 06611 g003
Figure 4. Relationship of annual values in each household (n = 304): (a) generation and electricity use; (b) contribution rate and electricity use; (c) reduction in primary energy and generation; (d) reduction in CO2 emission and generation.
Energies 14 06611 g004
Figure 5. Relationship between the annual gas use (except for CGS) and the energy-saving effects of CGS in each household (n = 304): (a) generation; (b) contribution rate.
Energies 14 06611 g005
Figure 6. Relationship between the annual water use and the energy-saving effects of CGS in each household (n = 304): (a) generation; (b) contribution rate.
Energies 14 06611 g006
Figure 7. Relationship between the annual energy-saving effect of cogeneration system (CGS) and the annual electricity use by three levels of gas use (except for CGS) or water use (n = 304): (a) generation by gas use; (b) generation by water use; (c) contribution rate by gas use; (d) contribution rate by water use.
Energies 14 06611 g007
Figure 8. Monthly variation (n = 304): (a) electricity use; (b) contribution rate; (c) gas use (except for CGS); (d) water use.
Energies 14 06611 g008
Figure 9. Relationship between the electricity use and the outdoor air temperature: (a) monthly mean value of each flat (n = 3648); (b) monthly mean value (n = 12).
Energies 14 06611 g009
Figure 10. Relationship between the energy-saving effect of cogeneration system (CGS) and the outdoor air or water temperature (n = 12): (a) generation; (b) contribution rate.
Energies 14 06611 g010
Figure 11. Variation by the family size (n = 161): (a) electricity use; (b) water use; (c) electricity generation by cogeneration system (CGS); (d) contribution rate.
Energies 14 06611 g011
Table 1. Performance values of polymer electrolyte fuel cell cogeneration system (CGS) for a condominium.
ItemValue
Electricity generation output(minimum) 200–750 W (rated)
Rated hot water output1080 W
Rated generation efficiency based on lower heating value39%
Rated heat recovery efficiency based on lower heating value56%
Rated integrated efficiency based on lower heating value95%
Water tank capacity147 L
Table 2. Conversion factors for energy consumption and CO2 emission.
Energy SourcePrimary Energy Consumption (GJ)CO2 Emission (t-CO2)
Electricity (MWh)9.76 GJ/MWh0.462 t-CO2/MWh
Gas (m3)0.045 GJ/m30.00224 t-CO2/m3
Table 3. Questionnaire survey.
Survey PeriodSurveys DistributedSurveys Collected
1: February 2015 (before completion)10477
2: November 2015 (immediately after completion)22593
3: November 2016 (1 year after completion)356115
Table 4. Characteristics of household.
DescriptionTotal3 LDK4 LDK
Avg.S.D.Avg.S.D.Avg.S.D.
Number of household members (n = 161)2.720.992.660.983.001.00
Age of householder (n = 160)42.49.542.09.544.09.6
LDK: living, dining and kitchen; Avg.: average; S.D.: standard deviation.
Table 5. Employment status of married women and age of children.
DescriptionTypeTotal3LDK4LDK
np (%)np (%)np (%)
Employment status of married womenWorking outside906477661354
Full-time homemaker513640361146
Age of youngest child<5 years old566243601368
6–15 years old23251926421
>16 years old12131014211
LDK: living, dining and kitchen; n: number of households; p: percentage.
Table 6. Annual effect values of cogeneration system (CGS) in previous studies.
AuthorType of HouseMethodGeneration (MWh)Contribution Rate (%)Reduction Rate of Primary Energy (%)Reduction Rate of CO2 Emission (%)
This studyCondominiumMeasured data1.3138.212.311.7
Kuroki et al. [14]Detached houseSimulation 451013–17
Wakui et al. [15]Detached houseSimulation 17
Yamamoto et al. [18]Apartment houseSimulation1.2317
Yamamoto et al. [19]Detached houseMeasured data2.130
Arinami et al. [22]Apartment houseSimulation
(Tokyo)
7.3
Table 7. Three levels of annual electricity, gas, and water use in each household.
ItemsLowMiddleHigh
Electricity use (MWh)1.17–2.772.78–3.783.79–7.64
Gas use (m3)85–341343–519521–1589
Water use (m3)41–156157–215216–529
Publisher’s Note: MDPI stays neutral with regard to jurisdictional claims in published maps and institutional affiliations.

