Article

Experimental Research on Detonation Cell Size of a Purified Biogas-Oxygen Mixture

Institute of Heat Engineering, Faculty of Power and Aeronautical Engineering, Warsaw University of Technology, Nowowiejska 21/25, 00-665 Warsaw, Poland
*
Author to whom correspondence should be addressed.
Energies 2021, 14(20), 6605; https://doi.org/10.3390/en14206605
Submission received: 30 June 2021 / Revised: 22 September 2021 / Accepted: 6 October 2021 / Published: 13 October 2021
(This article belongs to the Special Issue Thermal Processes in Piston, Turbine and Rocket Engines)

Abstract

:
Interest in alternative and renewable energy sources has risen significantly in recent years. Biogas is a prime example of a promising, alternative fuel that might be a possible replacement for fossil fuels. It is a mixture consisting mainly of CH4 and CO2 with various additions. Biogas is easily storable and as such is a more reliable and stable source of energy than solar and wind sources, which suffer from unreliability due to their dependence on weather conditions. In this paper, the authors report experimental results of detonation of a biogas-oxygen mixture. The composition of the biogas was 70% CH4 + 30% CO2 and the experiments were carried out for a range of equivalence ratios (Φ = 0.5 ÷ 1.5) and initial pressures (0.6 ÷ 1.6 bar). The aim of the research was to analyze the cellular structure of detonation. The soot foil technique was used to determine the width of the detonation cells (λ). The conducted experiments and subsequent analysis of the detonation cell size confirm that both the increase in the initial pressure of the mixture or move away from stoichiometric (Φ = 1) composition is accompanied by a decrease in the width of the detonation cell. The authors also argue that due to the unstable cellular structure of the detonation, it is insufficient to report only the average cell size. Instead, the researchers propose more detailed statistical description assured values.

1. Introduction

Climate change concerns have been very much in the forefront in the international scientific community for a number of years. This is reflected in growing research efforts in the field of alternative and renewable fuels and energy production with low or no impact on the environment. Moreover, research is strongly driven by regulatory and climate policies such as the Kyoto Agreement (1997) [1] and the following Paris Agreement (2015) [2] and Katowice Climate Package (2018) [3] of the United Nations Framework Conventions on Climate Change (UN FCCC). At the same time, energy is vital for achieving economic development and higher standards of living across the planet. It is well known that living standards are high in countries with high industrial output and intense energy use, but for this to happen energy is needed, and most of it is obtained from fossil fuels (coal, oil and natural gas) [4]. It is therefore evident that the world is in dire need of securing alternative and renewable energy sources to fulfill international agreements and reduce the global emissions of carbon dioxide if it wishes to achieve the goals set out in the Paris Agreement [2].
One possible solution is to utilize biogas produced from bio-waste or bio-residues obtained from, e.g., agriculture, forestry or similar sources [5]. Biogas is usually obtained in the process of anaerobic digestion in the presence of bacteria or anaerobic degradation in landfills. During this process, bio-waste is converted into a mixture consisting mainly of CH4 and CO2 [6]. However, it can also contain other gases and contaminants such as water, hydrogen sulfide (H2S), nitrogen (N2), ammonia (NH3), oxygen (O2), siloxanes and solid matter [7]. Typical volume percentages in biogas range from 35% to 70% for CH4 and 15% to 50% for CO2. Those values depend on the composition of the substrate from which the gas was produced [7,8]. Some impurities may have seriously negative impacts on the utilization system, such as corrosion, increased emissions and health hazards [8]. However, in the reported research, we used synthetic biogas consisting only of CH4 and CO2.
Biogas is seen as a promising, alternative source of energy for a number of reasons. First and foremost, as it is produced from biomass, the net balance of CO2 emitted into the atmosphere is close to 0. Moreover, using bio-waste as an energy source is more cost-effective than producing new biomass [9]. Biogas is also easily storable, meaning it is a more reliable and stable energy source than solar and wind, which are weather dependent [5].
Nevertheless, despite its advantages, biogas has some drawbacks. The most important one is its low Lower Heating Value (LHV), ranging between 16 MJ/Nm3 and 23 MJ/Nm3 [5,8]. Approximately 40–60% lower than the natural gas LHV (33.5 [5] or 39 MJ/Nm3 [8]) and the pure methane (35.8 MJ/Nm3 [5]). Low LHV means that a gas turbine powered by biogas requires increased fuel flow to maintain efficiency at an acceptable level [10]. However, this in turn decreases the compressor surge margin [10,11,12] and leads to overheating of the turbine blades [12,13], shortening their useful life. One solution to these problems is to use detonative instead of deflagrative combustion. The main advantage of detonation combustion is its higher thermal efficiency compared to the isobaric or isochoric cycle [11,12]. It can also occur in a wide variety of equivalence ratios: lean, stoichiometric [13] and rich mixtures [14,15]. Burning a lean mixture has the advantage of lower flame temperature [16], which could solve the problem of the turbine overheating. It was also shown that, especially for lean mixtures, detonation engines will have significantly lower NOx emissions [17] which in connection with low emission from biogas [10] is even more promising.
Deflagration and detonation are two known combustion modes. For the former, the pressure wave and the combustion front are separated whereas, for the latter, the combustion zone is attached to the shock wave. Typical detonation parameters involve a pressure peak of 20–50 bar and velocity of about 2000 m/s. Mixture composition and its initial conditions are the parameters on which those values depend. Three main parameters describe the detonation process: peak pressure, detonation wave velocity and the detonation cell size—λ. Detonation cells are a product of the three-dimensional, unstable structure of the detonation wave. They are created by the collision of Mach stems, transverse waves and incident shocks, which form triple points. Triple points move not only in the direction of the detonation front but also perpendicularly, creating a very well-known diamond-shaped pattern called the cellular structure of detonation [18]. The detonation cell width λ is the most often used parameter in quantifying the ease with which a given mixture can detonate. It is called detonation sensitivity or detonability. The detonation cell size strongly depends on the equivalence ratio and the mixture initial pressure [19,20,21]. It reaches its minimum near the stoichiometric ratio and significantly increases near the lean fuel limit [15]. This primary parameter is used in safety analysis in places where there is a risk of gas leaks. Power stations and chemical plants are prime examples. Another usage of λ is in the design of the rotating detonation combustion chamber of a Rotating Detonation Engine (RDE). As Xie et al. [13] noted, the detonation wave in the chamber tends to be stable when the detonation cell is smaller than the width of the combustion chamber. Bykovskii et al. [19,22,23] noted the connection between flow conditions, geometry, detonation cell size and the detonation wave’s stability in the RDE. Since the RDE concept is not the main topic of this paper, the interested reader is referred to the works of Wolanski [12] and Zhou et al. [22] for a broad overview and to the research of Kindracki et al. [23,24] for more specific examples.
Detonation cell size, the key parameter describing the gaseous detonation process, has been well investigated and described for a range of combustible mixtures such as hydrogen—oxidizer or simple hydrocarbon—oxidizer. The Detonation Database [20] neatly aggregates a large number of results. However, few studies deal with low-calorie biogas. Most of them were carried out in Malaysia at the University of Technology and concerned fueling a Pulsed Detonation Engine with biogas. Wahid et al. [25] conducted experimental research in a tube of inner diameter 100 mm with synthetic biogas consisting of 65% CH4 and 35% CO2 mixed with oxygen and diluted at various percentages with N2. All the experiments were conducted at the initial pressure of 1 atm and room temperature of 300 K. They showed that the detonation cell size increases as percent of N2 in the mixture increases. Saqr et al. [26] performed chemical equilibrium calculations of ideal detonation characteristics of biogas-H2 and biogas-H2O2 mixtures with air. They researched the influence of the additional fuel on CJ velocity, pressure rise and temperature, but they did not calculate the detonation cell size. Dairobi et al. [27] provided a general feasibility study of fueling the PDE with biogas. They discussed possible problems with lower flame speed and the biogas impurities with their potentially damaging influence on the environment and the engine itself. In 2020 Elhawary et al. [28] reported an experimental study of PDE fueled by biogas with hydrogen enrichment and O2 as an oxidizer. They investigated the influence of H2 addition on the detonation cell size together with other detonation characteristics. Stable operation of PDE at a frequency of 10 Hz using a hydrogen-enriched mixture was also presented.
As described above, there is minimal research on biogas detonation available. The authors, however, are convinced that burning biogas in detonative mode is a very encouraging direction and, as such, needs to be investigated more deeply. In this paper, the authors report the results of experimental research on the detonation cell size of purified biogas—oxygen mixture for different initial pressures and equivalence ratios. The mixture used is called “purified biogas” because it is a 70% CH4 + 30% CO2 mixture and as such, its CH4 content is at the top limit of what is considered biogas [7,8].

2. Materials and Methods

2.1. Experimental Setup

The experimental setup included four subsystems: the ignition device, the detonation tube, the data acquisition system and the system used to fill and empty the tube. The scheme of the experimental apparatus is shown in Figure 1. The main element of the test stand was a stainless-steel detonation tube with an inner diameter of 122.2 mm, a total length of 4718 mm and a volume of 54.7 dm3. On one end of the tube, an initiator was placed that was filled with the hydrogen-oxygen stoichiometric mixture. It was 485 mm long and had an inner diameter of 30 mm and volume equal to 0.343 dm3. The pressure used in the initiator ranged from 3 to 4 bars depending on the initial pressure in the detonation tube (higher pressure in the tube meant higher pressure in the initiator). The initiator was separated from the rest of the tube by a foil diaphragm. Additionally, to ensure a smooth detonation transition between the two mixtures, a conical section was mounted between the initiator and the main part of the tube. The initiator and the conical part of the tube are marked as the driver section in Figure 1. The driven section consisted of two two-meter-long tubes with seven slots for pressure transducers and one for the temperature sensor. The purpose of this section was to stabilize the detonation wave passing from hydrogen-oxygen (in the initiator section) to the biogas-oxygen mixture (in the driven and test unit). Downstream of the driven section was the 350 mm long test section separated from the dumping section by a foil membrane. The dumping section had a length of 500 mm and was filled with densely packed circles of steel mesh of different mesh sizes. Their purpose was to attenuate the detonation wave and prevent the reflected shock wave from blowing out the detonation cell pattern recorded on the smoked foil. Additionally, the dumping section was evacuated before every experiment to enhance the attenuation effect.
Seven pressure sensors (PCB model 113A24) were employed to record the time of arrival of the detonation and the detonation peak pressure. The sensors were placed 400 mm apart in each tube. The distance between the 3rd and 4th sensor was 800 mm and between the first and last one the distance was 2800 mm. They were used to monitor and ensure that the detonation occurred and was stable, and to calculate the propagation velocity. A National Instruments data acquisition card (model PCI 6133) with in-house software was used to collect the data with the frequency of 2 MHz. A simple temperature sensor was used to control the temperature of the fresh mixture inside the tube and the temperature of the tube itself. Based on the researchers’ previous experience and on the literature [29], it may be assumed that temperature fluctuations with an amplitude below 5 °C are negligible for the final results.
Smoked foils cut from aluminum sheets (0.5 mm thickness) were used to record the cellular structure of the detonation. They were covered with soot from a mixture of paraffin oil and toluene and carefully inserted into the test section before each experiment. During the experiment, propagating detonation left a cellular pattern visible on the foil. After the experiment, the foil was carefully removed and photographed using a camera at a resolution of 25 megapixels. A special frame was used to ensure the photos were taken from the same distance and perspective. The detonation cell size distribution was then obtained by marking the width of all recognizable and visible cells using AutoCAD software. The lengths of the drawn lines were then exported from AutoCAD and scaled using the paper scale that was placed on the foil when taking the photo.
In this study, the “purified” biogas: 70% CH4 + 30% CO2 was tested for a range of different equivalence ratios and initial pressures. Each mixture was prepared in a gas cylinder using the partial pressures method at least 24 h before the experiment to ensure homogeneity. The pressure of the mixture in the cylinder was always set to 10 bar abs. Prior to the experiment, the mixture was fed into the detonation tube to the desired pressure and left for 2 min to stabilize. Table 1 presents the ranges of initial pressures and equivalence ratios researched in the reported work. In some cases, the experiments were repeated 2 or 3 times to gather more data, as the cells were of considerable size.

2.2. Experimental Uncertainty

The experimental measurements are exposed to uncertainties from three sources: (a) preparation of the combustible mixture using the partial pressure method, (b) detonation tube initial pressure measurement and (c) determination of the detonation cell size. The digital pressure manometer Keller LEO 2 was used in the processes of preparing the mixture and filling the detonation tube. It has an accuracy of ≤0.1% FS, which in the case of manometer’s scale of 0–30 bar gives an accuracy of 0.03 bar. Table 2 presents the equivalence ratio uncertainty of the prepared mixtures.
The third source of the uncertainties was, as mentioned above, the measurement of the recorded detonation cell size. To reduce the influence of subjectivity on the processes of preparing the mixture and measuring the cell sizes, each of those activities were carried out by only one person from the team. However, it is important to note that this kind of mixture has a very irregular cellular pattern. The observed detonation wave structure strongly resembles the irregular cell shapes presented by Ng [30] and Pintgen et al. [31].

3. Experimental Results

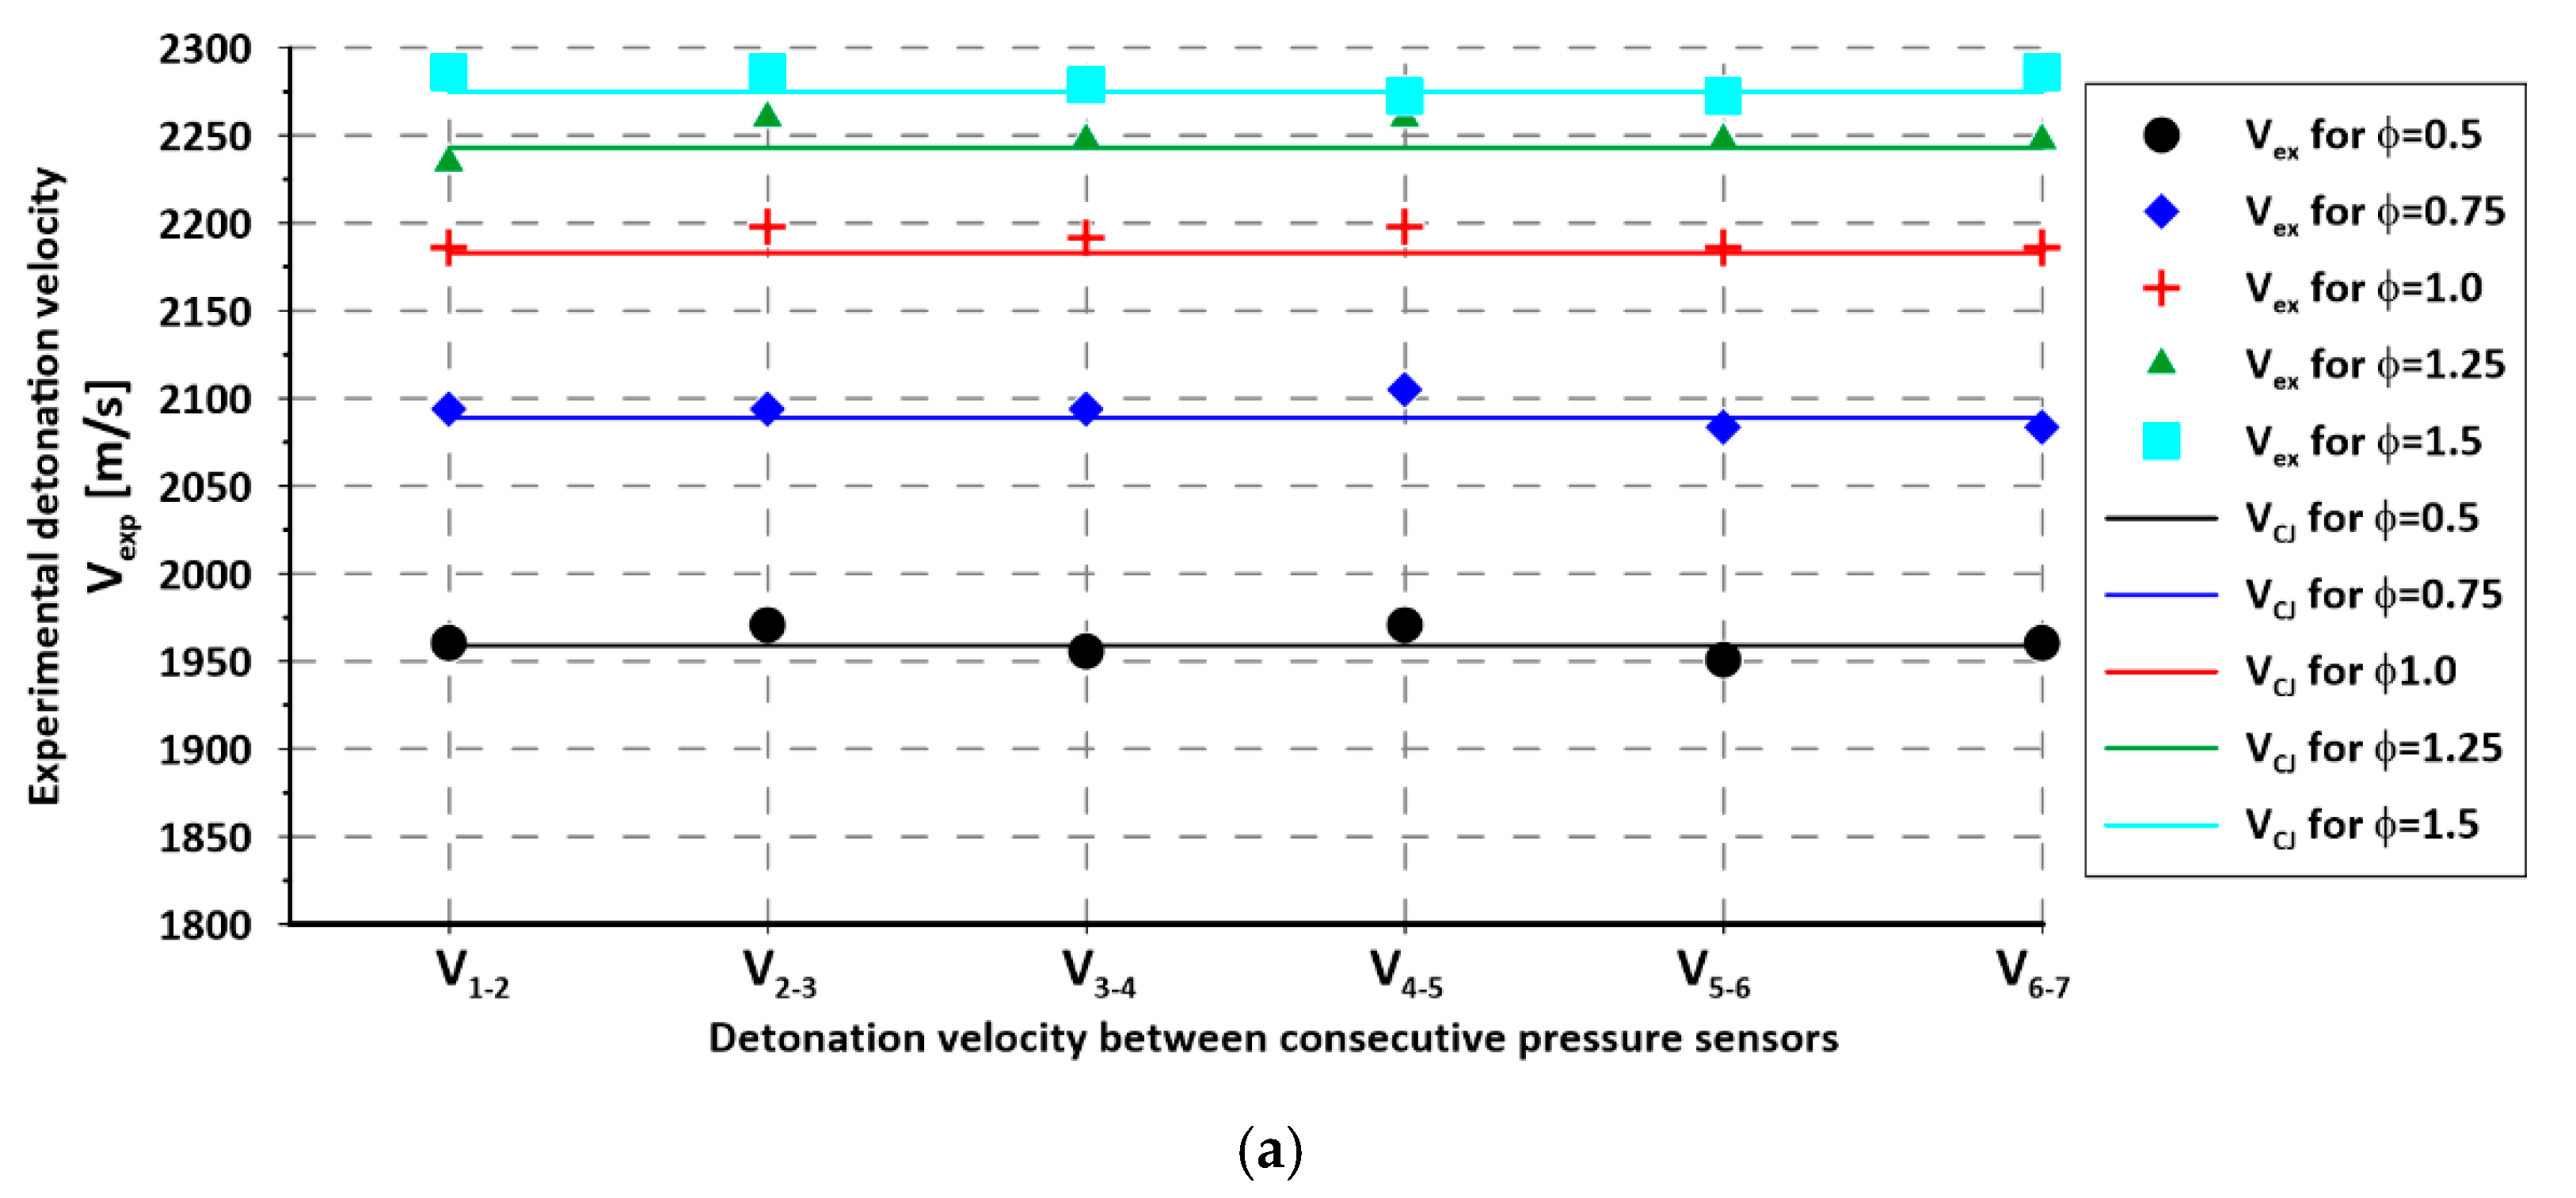
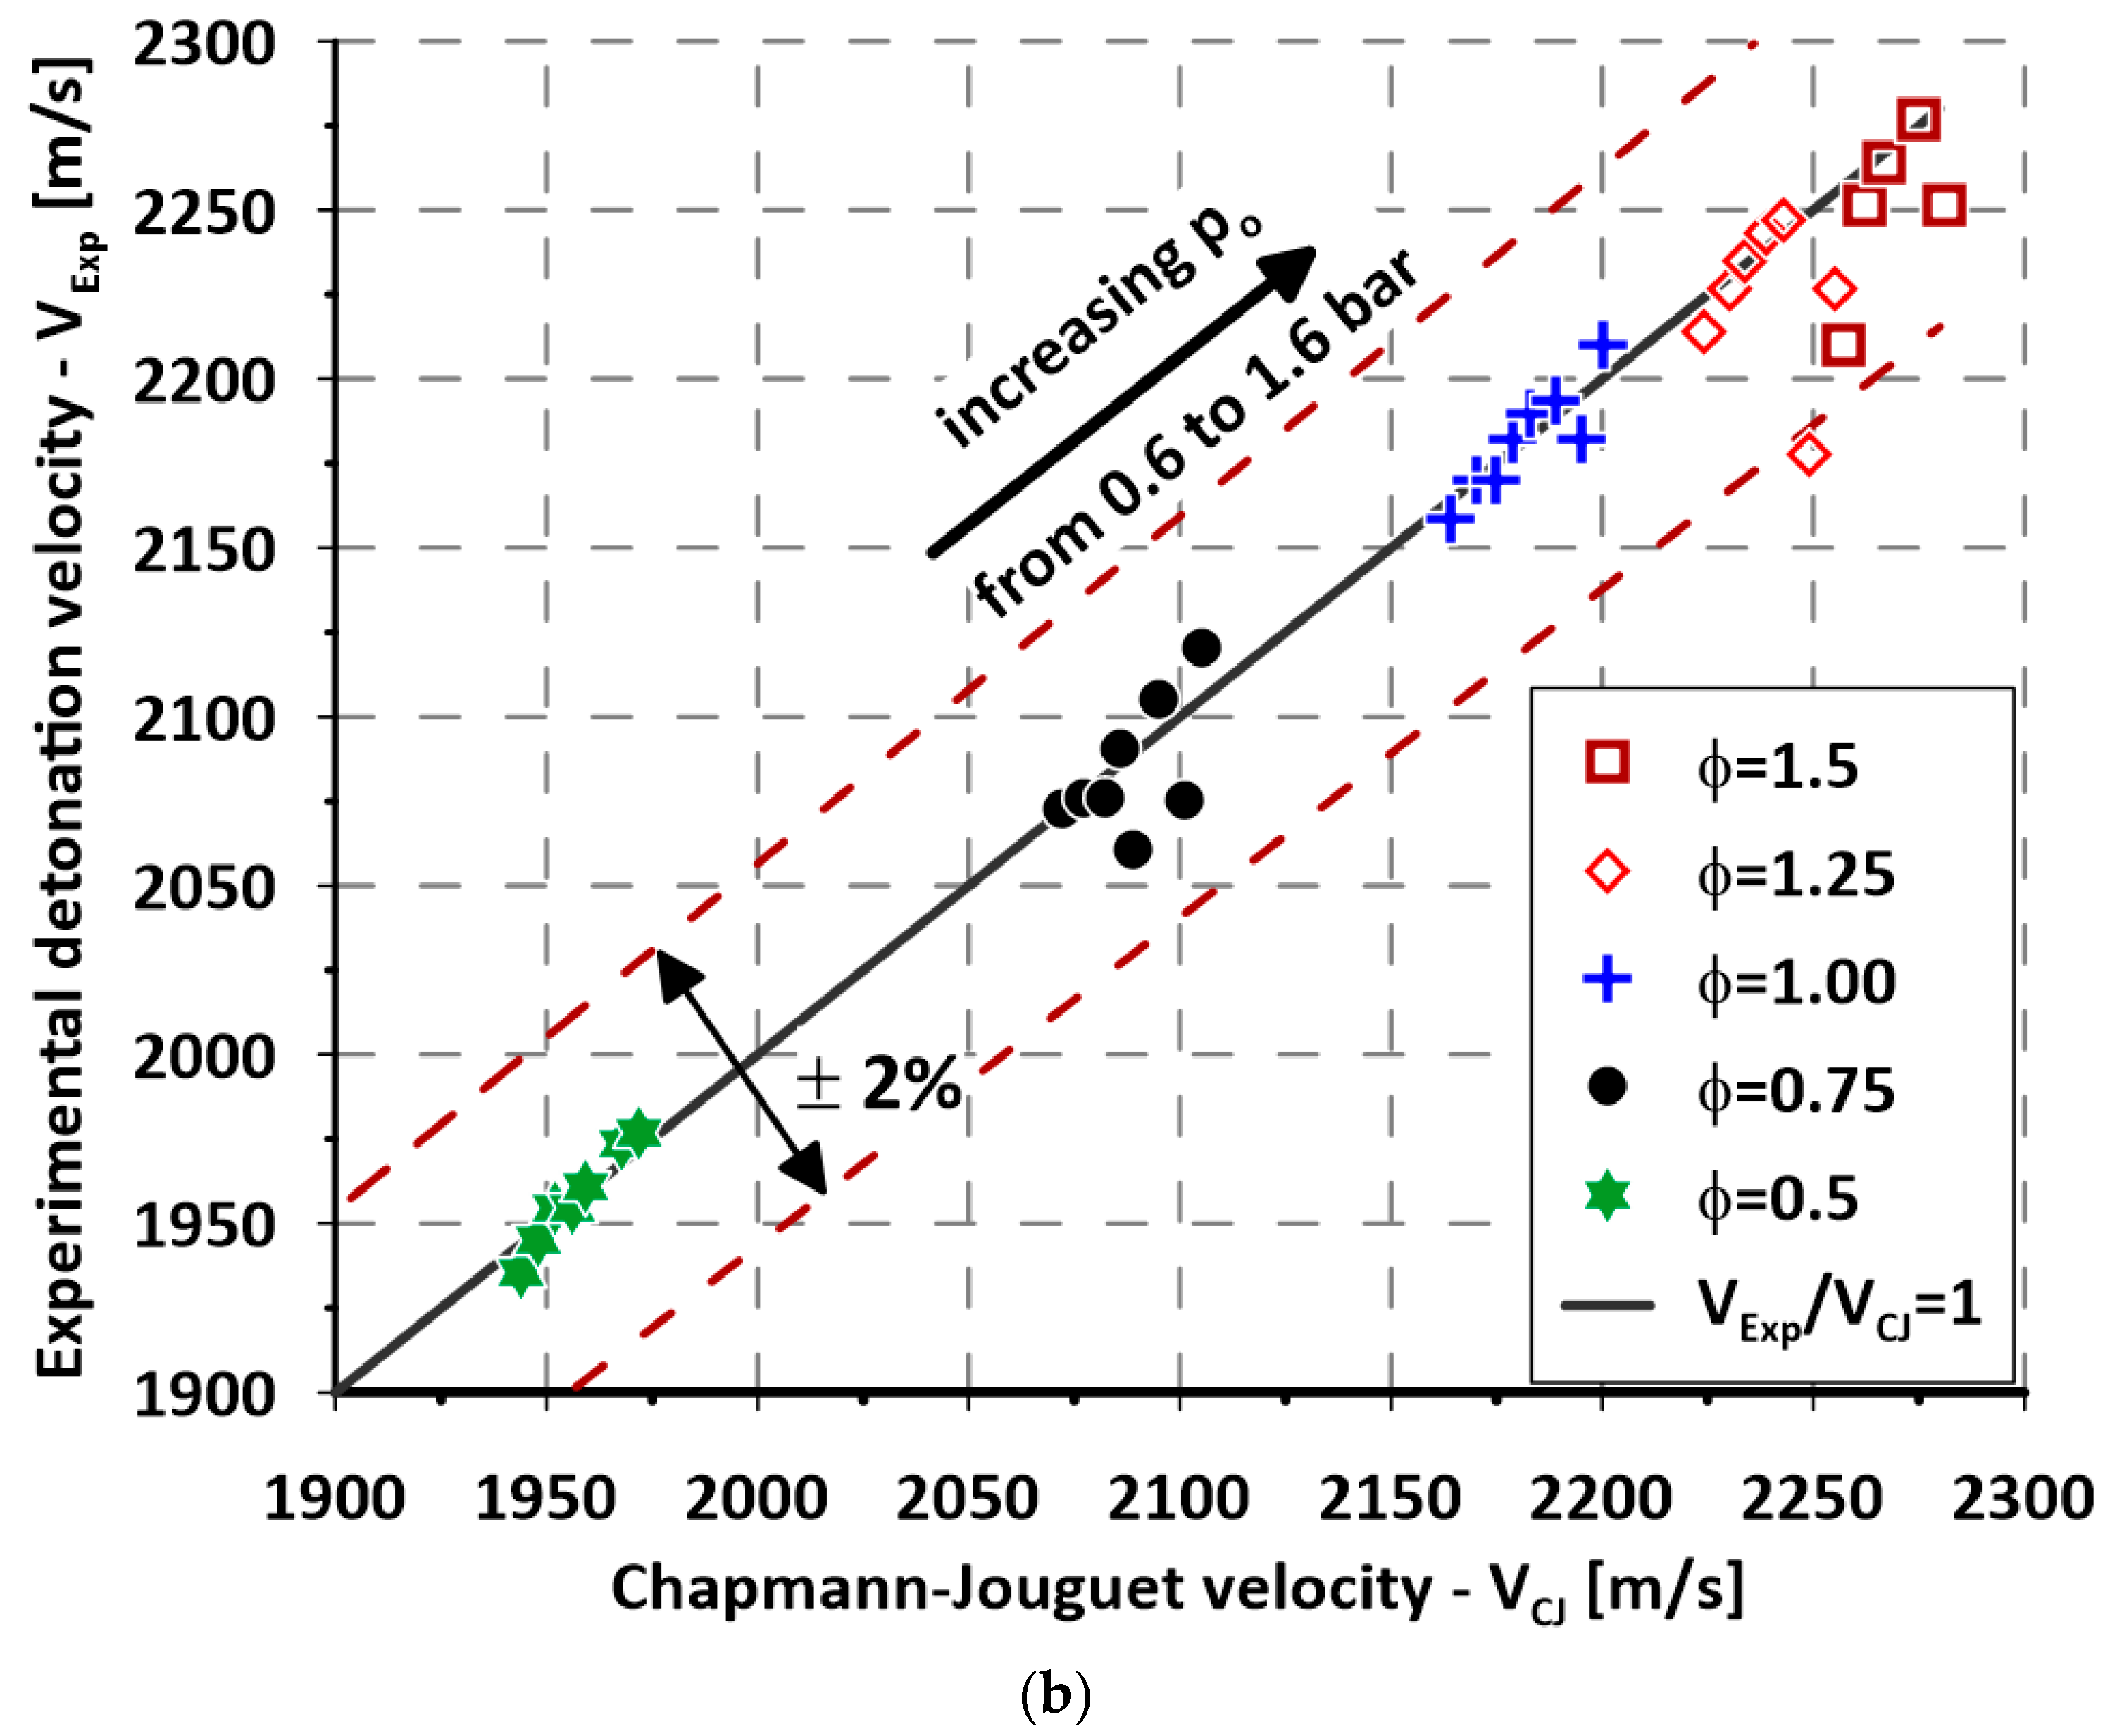
Figure 2 shows an exemplary pressure course from one of the experiments. Those kinds of pressure traces showing a rapid, twenty-fold plus increase in pressure suggest that detonation occurred. Additionally, the velocities of the wave between each sensor were calculated and compared to the theoretical VCJ. In Figure 3a, velocities between consecutive pressure transducers for an initial pressure of 1 bar and different equivalence ratios are presented, showing excellent agreement between the calculated detonation velocities and theoretical values. Figure 3b illustrates an average detonation velocity calculated using the velocities between pressure transducers P4–P5, P5–P6 and P6–P7 compared to the theoretical VCJ. This plot covers the whole range of researched pressures and equivalence ratios. Most of the points differ by no more than 2% from the VCJ, showing very good agreement throughout all the experiments. As expected, detonation velocity increases with the increasing initial pressure of the combustible mixture and equivalence ratio.
As mentioned above, the main result expected from the experiments was to record the cellular structure of the detonation wave on the sooted foil inserted in the test section of the detonation tube. The width of the detonation cell depended on the initial pressure, mixture composition and equivalence ratio. It ranged from around 2 mm up to 40 mm, resulting in a different number of recorded cells in each experiment. Additionally, the detonation wave structure was very unstable, resulting in a wide range of measured cell sizes from one experiment. What is more, during some experiments, the not fully attenuated shock waves reflected from the dumping section blew away all or part of the soot from the foil, fully or partially destroying the results. Figure 4 presents some examples of different cell sizes, successful and unsuccessful experiments, as well as the unstable structure of the detonation recorded on the foil. Parts (a) and (b) of Figure 4 presents the differences between the number of cells obtained from different experiments. As expected, when a low initial pressure was used a lower number of cells were obtained due to their bigger size. On the other hand, when the initial pressure was raised, the number of obtained cells increased as well due to the cells being smaller. Figure 4c shows soot partially blown out by the reflected shock wave; this kind of result made it very hard to obtain a reasonable number of cell measurements and usually forced the authors to repeat the experiment. Finally, Figure 4d presents an unstable cellular structure of the detonation: it can be seen that the cells differ in both size and shape. Some cells have a regular diamond-like shape while others are more elongated, thereby confirming that the structure of the detonation is unstable.
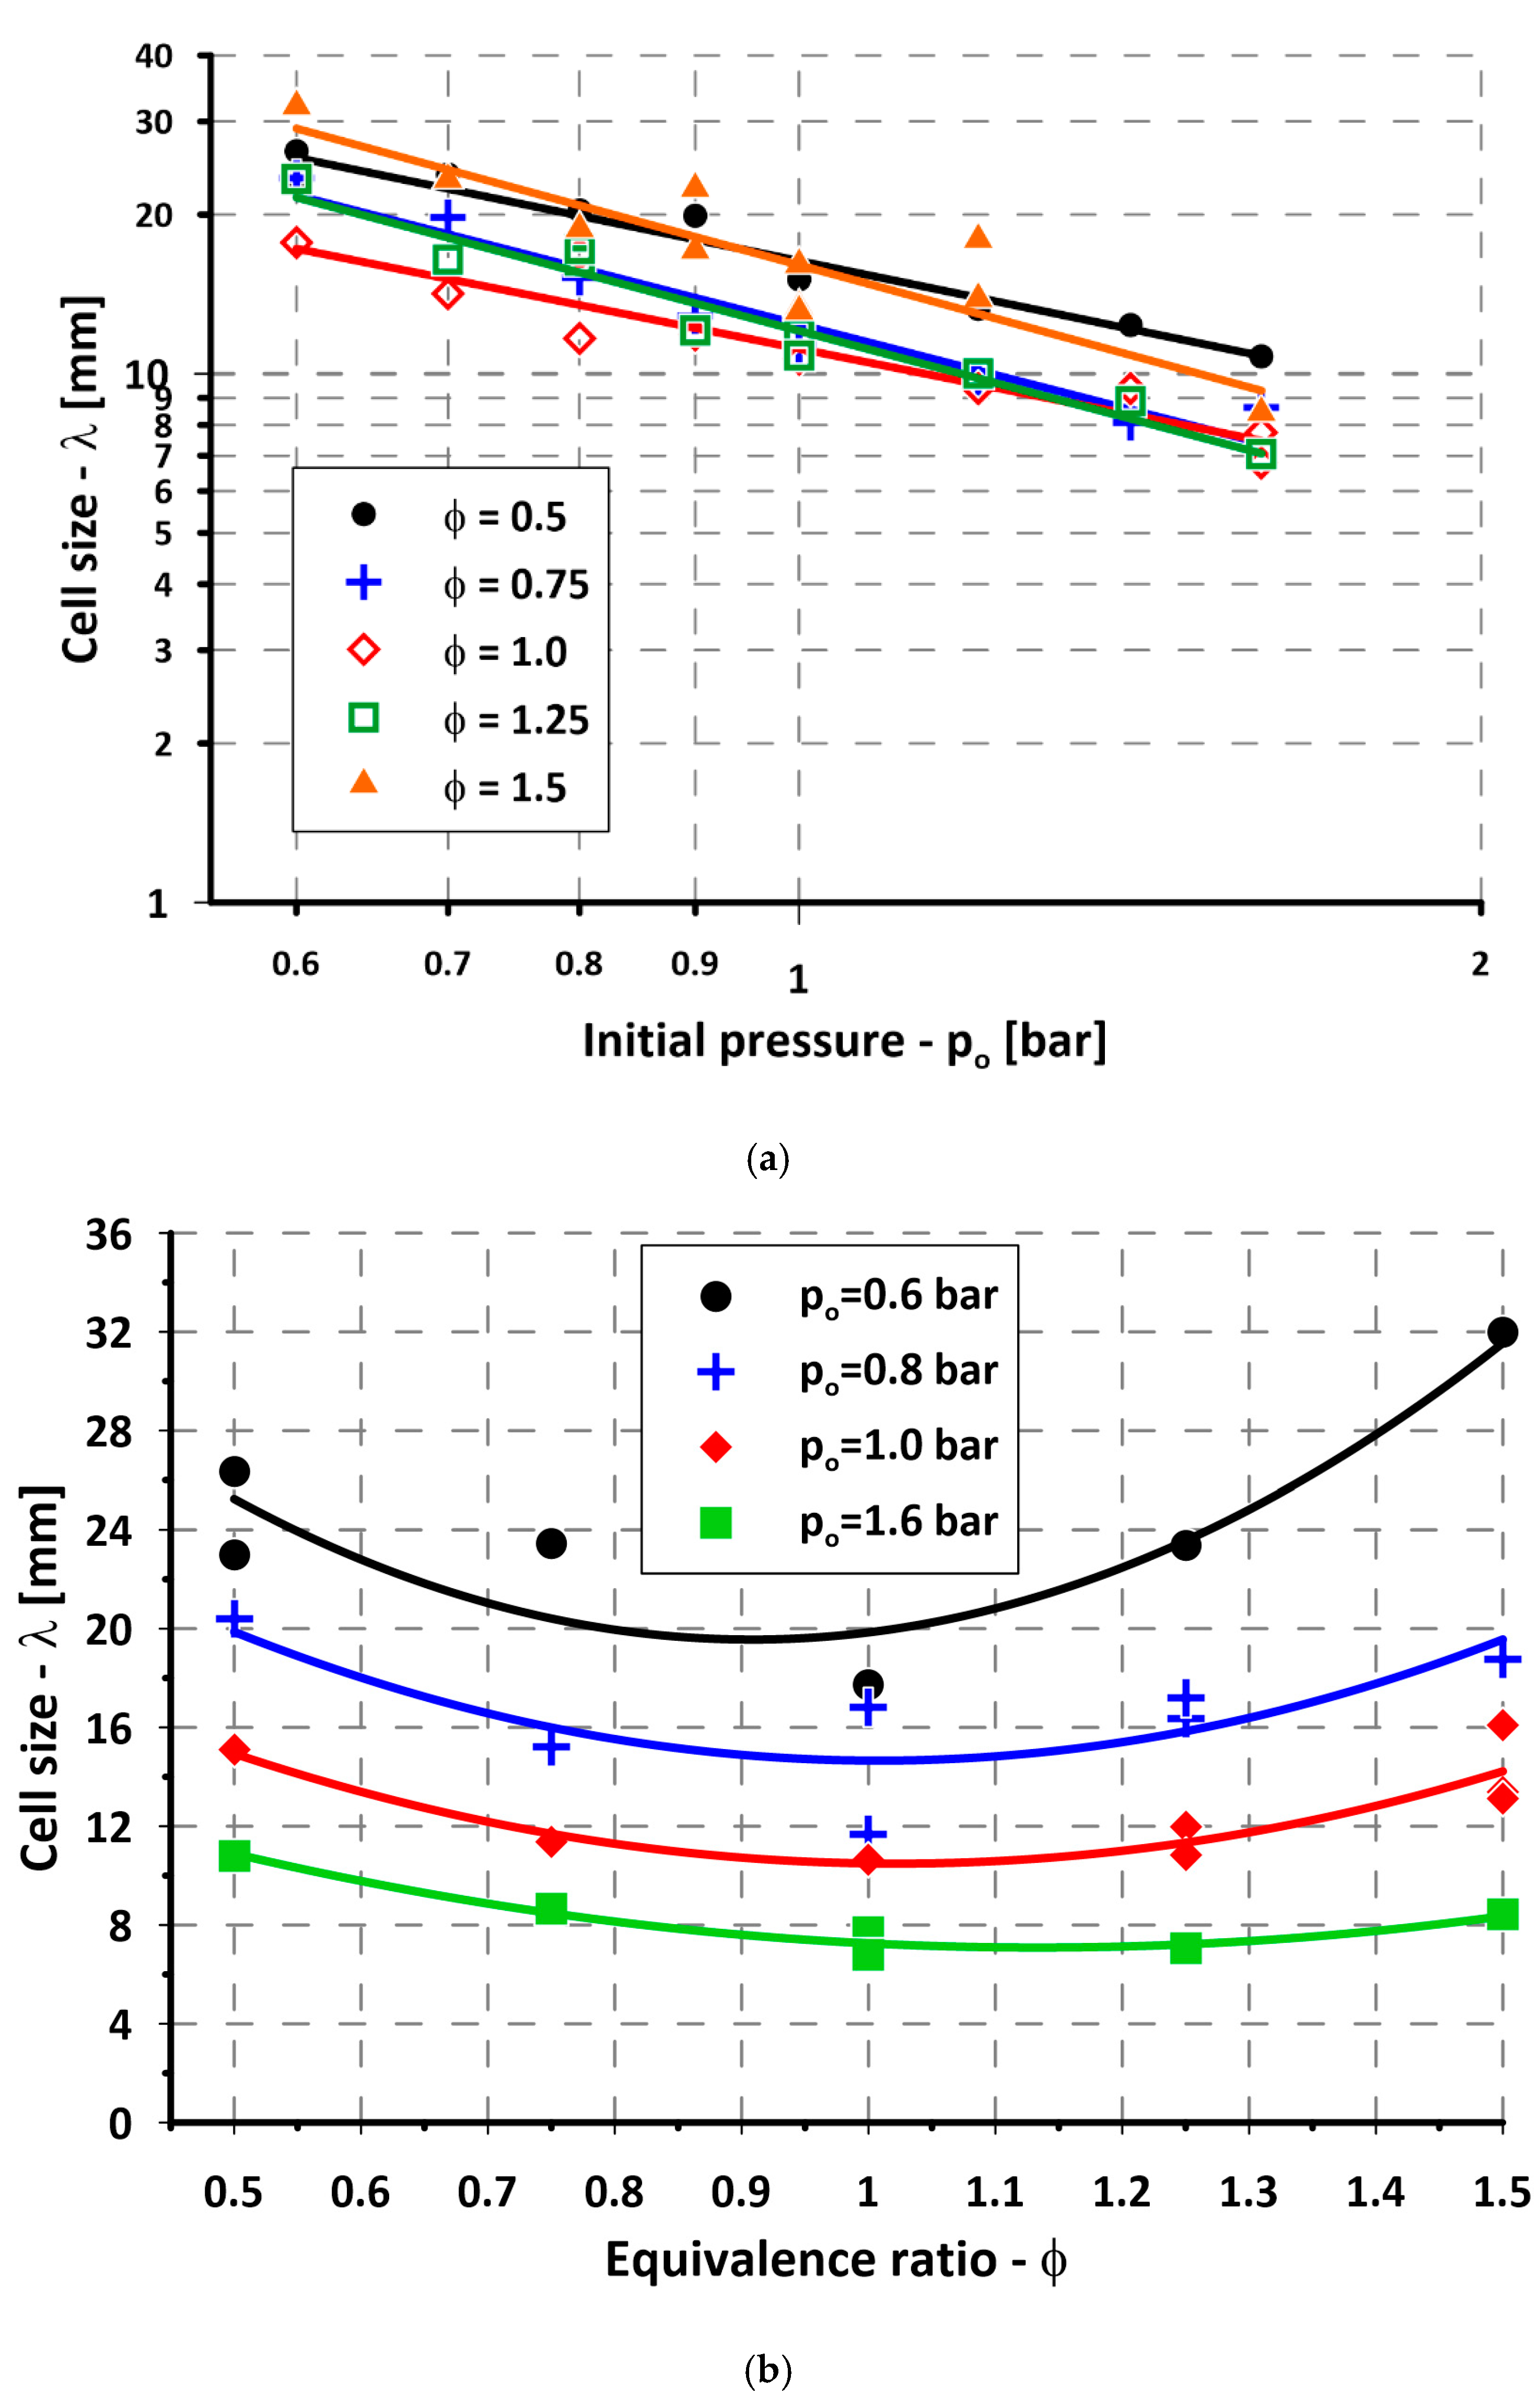
Figure 5a,b show the dependency of average cell size on the initial pressure and equivalence ratio Φ, respectively. Average cell size ranges from around 4 mm to about 32 mm depending on the Φ and p0. Figure 5a shows that when the equivalence ratio is kept constant, cell size decreases with as initial pressure increases. At the same time, when the initial pressure is fixed and the equivalence ratio is varied, it can be seen that the smallest widths are found for Φ = 1. It is also evident that for constant initial pressure, when the equivalence ratio decreases or increases, the detonation cell’s width increases. This general trend agrees with previous, reported research for many different mixtures, showing that the detonation cell size decreases with increasing initial pressure and reaches minimal size while being stoichiometric [20]. Additionally, Table 3 presents the equations and the coefficients of determination R2 of the fitted curves shown in Figure 5.
Figure 6 presents the distribution of the data points from the case of Φ = 1.25. Figure 6a shows the box and whiskers plots. The whiskers mark the minimum and maximum values of the measured detonation cell size while the box shows the interquartile range and the horizontal line inside the box shows the mean value of the detonation cell size in each presented case. Figure 6b illustrates the histograms of the data. To produce the histogram, the entire range of values is divided into a series of intervals, and then the data points falling into each interval or “bin” are counted. In the histograms, the Y-axis shows the percentage of all the data points falling into each bin. The data is also offered in tabular form in Table 4 with some additional information: the number of data points, standard deviation, variation and the standard error of the mean. Analyzing Figure 6a, it appears that cell size variation is increasing as initial pressure decreases. However, the spread of measured values is always in the order of its mean, and the value of the coefficient of variation (CV) oscillates around 0.19. The CV is a standardized measure of dispersion that shows the extent of variability in relation to the mean. It is defined as the ratio of the standard deviation to the mean. In the presented results, the average value of CV from all experiments was 0.191, and the standard deviation was 0.027. These results indicate that although absolute variation increases with increasing cell size, the relative variation stays roughly the same throughout the different cases, meaning that the increase in variation comes only from the increase in detonation cell and it is not caused by any kind of methodological error or interaction between experiment’s parameters.

4. Discussion

The prospect of a highly effective combustion process utilizing eco-friendly fuel presents a very promising alternative to burning fossil fuels, especially in the context of climate change concerns. The future combustion chamber of the RDE will need to be designed with optimal geometry to effectively harness detonative combustion. Thus, in light of the high variability encountered in cell sizes, providing only the average value will not suffice. Consequently, the authors postulate that a more comprehensive, statistical description of the experimentally obtained cell sizes, especially for mixtures with a very unstable cellular structure, should be provided when reporting the results. At least the mean and standard deviation should be provided, preferably a minimum, maximum, median and the coefficient of variation as well. Providing this kind of data will help in future design efforts regarding the RDE combustion chamber. This is even more important when one considers the biogas-air mixture, as the presence of nitrogen in the air will render the cellular structure even more unstable [31].

5. Summary and Conclusions

In the research presented in this paper, the authors conducted a series of experiments to determine one of the basic parameters of the detonation wave—the detonation cell—for the biogas—oxygen mixture. It was shown that when the equivalence ratio is held constant and the initial pressure rises, the detonation cell size decreases. On the other hand, when the initial pressure is fixed, the cell width increases when the equivalence ratio moves further away from stoichiometry, either towards a lean or rich composition. This is in accordance with the experimental results broadly reported in the detonation database [20], not only for biogas-oxygen mixtures but many others as well. The results recorded on the sooted foil also showed that the detonation cellular structure of the biogas-oxygen mixture is very unstable. Based on this, the authors decided to calculate not only the average value of the measured detonation cell size in each case but to provide a more detailed, statistical description of the gathered samples. Consequently, it showed that indeed the absolute variability of the cell size was high, but at the same time, relative variability stayed roughly constant throughout all the researched cases. Authors of this article believe that this research is crucial in the context of the future development of the biogas fueled Rotating Detonation Engine (RDE).

Author Contributions

Conceptualization, J.K. and S.S.; methodology, J.K. and S.S.; formal analysis, S.S.; investigation, K.W., S.S. and J.K.; data curation, K.W. and S.S.; writing—original draft preparation, S.S.; writing—review and editing, K.W. and J.K.; visualization, J.K., S.S. and K.W.; supervision, J.K.; funding acquisition, J.K. All authors have read and agreed to the published version of the manuscript.

Funding

Studies were funded by the ENERGYTECH-1 project granted by Warsaw University of Technology under the program Excellence Initiative: Research University (ID-UB).

Institutional Review Board Statement

Not applicable.

Informed Consent Statement

Not applicable.

Data Availability Statement

The data presented in this study are available on request from the corresponding author. The data are not publicly available due to the lack of consent from the funding party.

Conflicts of Interest

The authors declare no conflict of interest. The funders had no role in the design of the study; in the collection, analyses or interpretation of data; in the writing of the manuscript or in the decision to publish the results.

Nomenclature

p0initial pressure in the detonation tube [bar]
Φequivalence ratio [-]
λdetonation cell size [mm]
CVCoefficient of Variation
CJChapman-Jouguet
FSFull Scale
LHVLower Heating Value [MJ/Nm3]
PDEPulsed Detonation Engine
RDERotating Detonation Engine
StdStandard Deviation
SEMStandard Error of Mean
VarVariation
VExpExperimental detonation velocity [m/s]
VCJChapman-Jouguet detonation velocity [m/s]

References

  1. Kyoto Protocol: A Guide and Assessment (Book)|ETDEWEB. Available online: https://www.osti.gov/etdeweb/biblio/20730601 (accessed on 14 September 2020).
  2. The Paris Agreement|UNFCCC. Available online: https://unfccc.int/process-and-meetings/the-paris-agreement/the-paris-agreement (accessed on 9 September 2020).
  3. United Nations Framework Convention on Climate Change Katowice Climate Package|UNFCCC. Available online: https://unfccc.int/process-and-meetings/the-paris-agreement/paris-agreement-work-programme/katowice-climate-package (accessed on 14 September 2020).
  4. Balta, M.O.; Eke, F. Spatial Reflection of Urban Planning in Metropolitan Areas and Urban Rent; a Case Study of Cayyolu, Ankara. Eur. Plan. Stud. 2011, 19, 1817–1838. [Google Scholar] [CrossRef]
  5. Benato, A.; Macor, A. Italian Biogas Plants: Trend, Subsidies, Cost, Biogas Composition and Engine Emissions. Energies 2019, 12, 979. [Google Scholar] [CrossRef] [Green Version]
  6. Gupta, K.K.; Rehman, A.; Sarviya, R.M. Bio-Fuels for the Gas Turbine: A Review. Renew. Sustain. Energy Rev. 2010, 14, 2946–2955. [Google Scholar] [CrossRef]
  7. Baccioli, A.; Antonelli, M.; Frigo, S.; Desideri, U.; Pasini, G. Small Scale Bio-LNG Plant: Comparison of Different Biogas Upgrading Techniques. Appl. Energy 2018, 217, 328–335. [Google Scholar] [CrossRef]
  8. Sun, Q.; Li, H.; Yan, J.; Liu, L.; Yu, Z.; Yu, X. Selection of Appropriate Biogas Upgrading Technology-a Review of Biogas Cleaning, Upgrading and Utilisation. Renew. Sustain. Energy Rev. 2015, 51, 521–532. [Google Scholar] [CrossRef]
  9. Shiratori, Y.; Oshima, T.; Sasaki, K. Feasibility of Direct-Biogas SOFC. Int. J. Hydrog. Energy 2008, 33, 6316–6321. [Google Scholar] [CrossRef]
  10. Rodrigues, M.; Walter, A.; Faaij, A. Co-Firing of Natural Gas and Biomass Gas in Biomass Integrated Gasification/Combined Cycle Systems. Energy 2003, 28, 1115–1131. [Google Scholar] [CrossRef]
  11. Kindracki, J. Badania Eksperymentalne i Symulacje Numeryczne Procesu Wirującej Detonacji Gazowej [Experimental Research and Numerical Calculation of the Rotating Detonatino]. Ph.D. Thesis, Warsaw University of Technology, Warszawa, Poland, 2008. (In Polish). [Google Scholar]
  12. Wolanski, P. Detonative Propulsion. Proc. Combust. Inst. 2013, 34, 125–158. [Google Scholar] [CrossRef]
  13. Xie, Q.; Wen, H.; Li, W.; Ji, Z.; Wang, B.; Wolanski, P. Analysis of Operating Diagram for H2/Air Rotating Detonation Combustors under Lean Fuel Condition. Energy 2018, 151, 408–419. [Google Scholar] [CrossRef]
  14. Kindracki, J.; Wolański, P.; Gut, Z. Experimental Research on the Rotating Detonation in Gaseous Fuels-Oxygen Mixtures. Shock Waves 2011, 21, 75–84. [Google Scholar] [CrossRef] [Green Version]
  15. Wang, L.; Ma, H.; Shen, Z.; Xue, B.; Cheng, Y.; Fan, Z. Experimental Investigation of Methane-Oxygen Detonation Propagation in Tubes. Appl. Therm. Eng. 2017, 123, 1300–1307. [Google Scholar] [CrossRef]
  16. Lefebvre, A.H. Gas Turbine Combustion, 2nd ed.; CRC Press: Boca Raton, FL, USA, 1998; ISBN 978-1-56032-673-1. [Google Scholar]
  17. Schwer, D.A.; Kailasanath, K. Characterizing NOx Emissions for Air-Breathing Rotating Detonation Engines. In Proceedings of the 52nd AIAA/SAE/ASEE Joint Propulsion Conference, Salt Lake City, UT, USA, 25–27 July 2016; American Institute of Aeronautics and Astronautics: Reston, VA, USA. [Google Scholar]
  18. Shepherd, J.E. Detonation in Gases. Proc. Combust. Inst. 2009, 32, 83–98. [Google Scholar] [CrossRef]
  19. Bykovskii, F.A.; Zhdan, S.A.; Vedernikov, E.F. Continuous Spin Detonations. J. Propuls. Power 2006, 22, 1204–1216. [Google Scholar] [CrossRef]
  20. Kaneshige, M.; Shepherd, J.E.; Detonation Database. Technical Report FM97-8, GALCIT. July 1997. Available online: https://shepherd.caltech.edu/detn_db/html/db.html (accessed on 1 December 2019).
  21. Hu, X.Y.; Khoo, B.C.; Zhang, D.L.; Jiang, Z.L. The Cellular Structure of a Two-Dimensional H2/O2/Ar Detonation Wave. Combust. Theory Model. 2004, 8, 339–359. [Google Scholar] [CrossRef] [Green Version]
  22. Zhou, R.; Wu, D.; Wang, J. Progress of Continuously Rotating Detonation Engines. Chin. J. Aeronaut. 2016, 29, 15–29. [Google Scholar] [CrossRef] [Green Version]
  23. Kindracki, J.; Kobiera, A.; Wolanski, P.; Gut, Z.; Folusiak, M.; Swiderski, K. Experimental and Numerical Study of the Rotating Detonation Engine in Hydrogen-Air Mixtures. In Proceedings of the Progress in Propulsion Physics, Les Ulis, France, 1 October 2011; Volume 2, pp. 555–582. [Google Scholar]
  24. Kindracki, J.; Siatkowski, S.; Lukasik, B. Influence of Inlet Flow Parameters on Rotating Detonation. AIAA J. 2019, 1–6. [Google Scholar] [CrossRef]
  25. Wahid, M.A.; Ujir, H.; Saqr, K.M.; Sies, M.M. Experimental Study of Confined Biogas Pulse Detonation Combustion. In Proceedings of the 2nd International Meeting on Advances in Thermo-Fluids, Barcelona, Spain, 15–17 July 2009; pp. 71–77. [Google Scholar]
  26. Saqr, K.M.; Kassem, H.I.; Sies, M.M.; Wahid, M.A. Ideal Detonation Characteristics of Biogashydrogen and -Hydrogen Peroxide Mixtures. In Proceedings of the International Conference on Fluid Mechanics and Heat & Mass Transfer, Corfu Island, Greece, 22–24 July 2010; pp. 69–72. [Google Scholar]
  27. Dairobi, A.G.; Wahid, M.A.; Inuwa, I.M. Feasibility Study of Pulse Detonation Engine Fueled by Biogas. Available online: https://www.scientific.net/AMM.388.257 (accessed on 21 September 2020).
  28. Elhawary, S.; Saat, A.; Wahid, M.A.; Ghazali, A.D. Experimental Study of Using Biogas in Pulse Detonation Engine with Hydrogen Enrichment. Int. J. Hydrog. Energy 2020, 45, 15414–15424. [Google Scholar] [CrossRef]
  29. Tieszen, S.R.; Stamps, D.W.; Westbrook, C.K.; Pitz, W.J. Gaseous Hydrocarbonair Detonations. Combust. Flame 1991, 84, 376–390. [Google Scholar] [CrossRef]
  30. Ng, H.D. The Effect of Chemical Reaction Kinetics on the Structure of Gaseous Detonations; McGill University: Montréal, QC, Canada, 2005. [Google Scholar]
  31. Pintgen, F.; Austin, J.M.; Shepherd, J.E. Detonation Front Structure: Variety and Characterization. In Confined Detonations and Pulse Detonation Engines; TORUS PRESS Ltd.: Moscow, Russia, 2003; pp. 105–116. ISBN 5-94588-012-4. [Google Scholar]
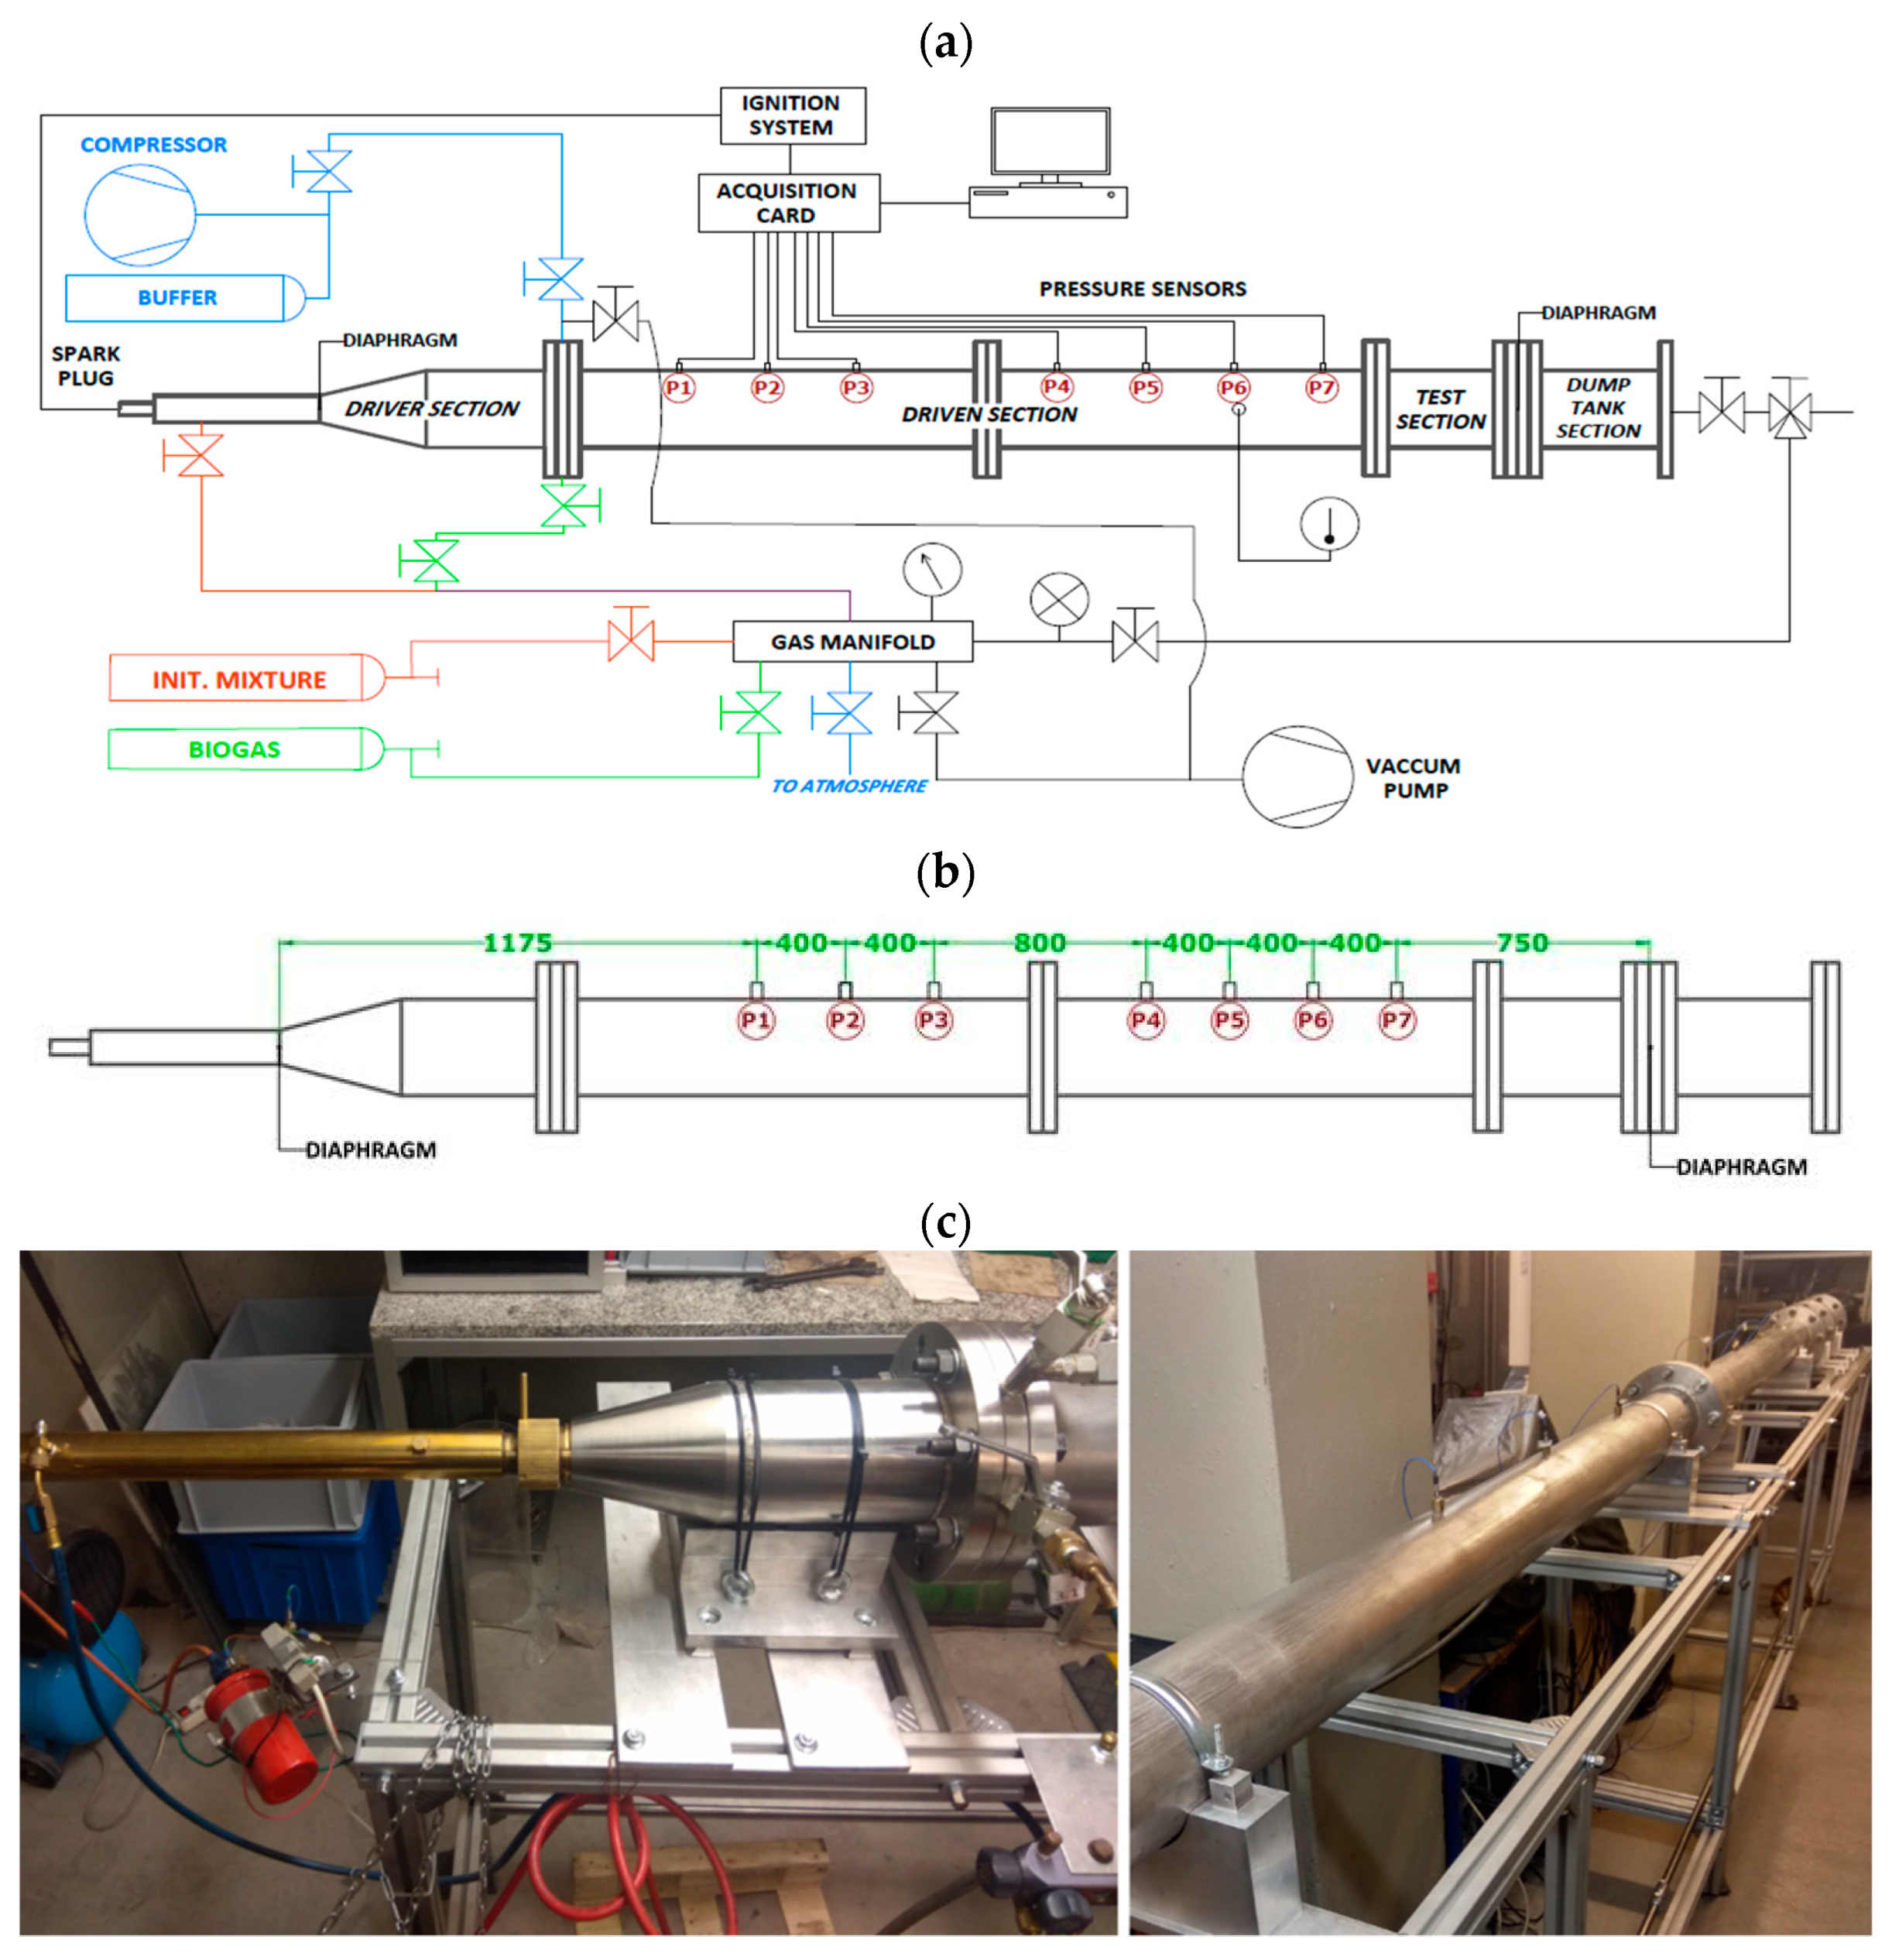
Figure 1. (a) Chart of the experimental setup; (b) positions of the pressure sensors; (c) test stand in the laboratory.
Energies 14 06605 g001
Figure 2. Exemplary pressure traces from an experiment.
Energies 14 06605 g002
Figure 3. A comparison of detonation velocity from the experiments VExp and theoretical VCJ: (a) detonation velocity calculated between consecutive pressure sensors, initial pressure p0 = 1 bar; (b) average detonation velocity from all the cases compared to theoretical Chapman—Jouguet detonation velocity VCJ.
Energies 14 06605 g003aEnergies 14 06605 g003b
Figure 4. Examples of recorded cellular structure: (a) low pressure, big cells; (b) high pressure, small cells; (c) partially blown out soot; (d) unstable cellular structure.
Energies 14 06605 g004
Figure 5. Average cell size dependence on: (a) initial pressure p0; (b) equivalence ratio Φ. Symbols represent experimental results, and continuous lines represent fitted power and polynomial function, respectively, in (a,b).
Energies 14 06605 g005
Figure 6. Experimental results for a case of equivalence ratio Φ = 1.25. (a) box plots showing the IQR, min, max and mean for each initial pressure; (b) histogram showing the data distribution.
Energies 14 06605 g006
Table 1. Ranges of initial pressure and equivalence ratio used in the experiments.
p0 [bar] 0.60.70.80.91.01.21.41.6
Φ [-]
0.5
0.75
1.0
1.25
1.5
Table 2. The uncertainty of the equivalence ratio of the prepared mixtures.
Φ0.50.751.01.251.5
ΔΦ±0.01±0.01±0.02±0.02±0.03
Table 3. Equations and R2 of the fitted curves from Figure 5.
Figure 5a: λ = A + B ∗ ln(p0)
ΦABR2
0.502.794−0.8810.96
0.752.517−1.1010.95
1.002.412−0.8520.89
1.252.490−1.1370.95
1.502.776−1.1640.79
Figure 5b: λ = A + B ∗ Φ + C ∗ Φ2
p0 [bar]ABCR2
0.647.750−62.09934.1990.82
0.835.212−40.80120.2480.62
1.027.560−33.41716.3510.78
1.619.251−21.4619.4660.95
Table 4. Statistical description of the equivalence ratio Φ = 1.25 case presented in Figure 6.
p0 [bar]NMinMaxMeanMedianStdVarSEMCV
0.68913.1733.4123.3823.134.9524.530.530.21
0.720110.4324.1416.4316.313.4712.020.240.21
0.811911.4321.8716.8217.072.456.000.220.15
0.91048.2618.6212.0611.702.636.930.260.22
1.01607.3517.1011.2611.192.224.910.180.20
1.24456.3014.3510.039.942.024.070.100.20
1.43216.1212.088.878.771.432.030.080.16
1.63694.6310.207.056.891.401.950.070.20
Publisher’s Note: MDPI stays neutral with regard to jurisdictional claims in published maps and institutional affiliations.