Article

Quasi-Z-Source Inverter-Based Photovoltaic Power System Modeling for Grid Stability Studies

1
Department of System Engineering and Design, Universitat Jaume I, Av. Vicent sos Baynat s/n, 12071 Castelló de la Plana, Spain
2
Department of Electrical Engineering (ETSEIB—UPC), Universitat Politècnica de Catalunya, Av. Diagonal 647, 08028 Barcelona, Spain
3
Department of Electrical Engineering (EEBE—UPC), Universitat Politècnica de Catalunya, Av. Eduard Maristany 16, 08019 Barcelona, Spain
*
Author to whom correspondence should be addressed.
Energies 2021, 14(2), 508; https://doi.org/10.3390/en14020508
Submission received: 17 December 2020 / Revised: 12 January 2021 / Accepted: 18 January 2021 / Published: 19 January 2021
(This article belongs to the Special Issue Applications of Medium Voltage Direct Current in Electric Systems)

Abstract

:
Quasi-Z-source inverters (qZSIs) are becoming a powerful power conversion technology in photovoltaic (PV) power systems because they allow energy power conversion in a single stage operation. However, they can cause system resonances and reduce system damping, which may lead to instabilities. These stability problems are well known in grid-connected voltage source converter systems but not in quasi-Z-source inverter (qZSI)-based PV power systems. This paper contributes with Matlab/Simulink and PSCAD/EMTDC models of qZSI-based PV power systems to analyze transient interactions and stability problems. These models consider all power circuits and control blocks of qZSI-based PV power systems and can be used in sensitivity studies on the influence of system parameters on stability. PV power system stability is assessed from the proposed models. The causes of instabilities are analyzed from numerical simulations and possible solutions are proposed.

1. Introduction

Penetration of wind and solar PV energies in grids has been rapidly growing in the last few years [1,2,3,4]. PV power systems have different configurations achieved in a single or two stages [5,6], with the two-stage DC/DC and DC/AC voltage source inverter (VSI) topology being the most common configuration. Nevertheless, single stage topologies with a centralized inverter are gaining ground in a wide range of applications because they are simpler and cheaper than two stage topologies [6,7,8,9,10]. Several impedance-source-network-based power converters with different converter topologies that overcome the drawbacks of traditional converter topologies are reported in research works. A comprehensive review of them, together with their main topologies, modeling, control, and modulation techniques from an engineering application point of view are presented in [8,9]. A complete analytical comparison of impedance-source-network-based power converters related to their passive component count and semiconductor stress, and a comparison between two and multilevel buck–boost inverters based on the already existing impedance-source networks are provided in [10]. Recent solutions based on these networks have been extended to various fields of application such as Z-source inverters and quasi-Z-source inverters (qZSIs) for grid integration into low-voltage energy sources [10]. In particular, introduction of qZSIs in PV power systems improves their efficiency and reliability because they can make both buck or boost DC voltage and energy power conversion in a single-stage operation [11,12,13,14,15,16,17]. The traditional qZSI based on an impedance and semiconductor network coupling the inverter to the dc source is studied in [11,12,13,14]. Four new qZSIs with several improvements and no disadvantages compared to ZSIs are presented and theoretically studied in [15]. In addition, [16,17] examine a new qZSI topology, known as three-level neutral-point-clamped qZSI, which is a combination of the qZSI and the three-level neutral-point-clamped inverter. This new qZSI offers the advantages of both topologies, i.e., buck or boost DC voltage capability, short circuit immunity and high energy density.
PV power systems can cause stability problems in grids because power electronics reduces damping of grid-connected converter systems. Several works characterize dynamic behavior of PV power systems with a two-stage boost DC/DC converter and a DC/AC VSI, and investigate stability [4,18,19]. They conclude that solar irradiance and temperature lead to variations in a PV power system operating point, affecting system stability [18,19] and that control parameters have an influence on it too [4]. Other works provide small-signal models of qZSIs to analyze their dynamics and stability [9,11,12,13,14,20]. The influence of qZSI control on qZSI stability is explored in [11,12,13,14], and qZSI design rules are provided from dynamic models in [11,12]. A broad and worthy study of pole-zero location and impact of parameters on the dynamics of several impedance-source-network-based power converters (including qZSIs)] considering the wide operating ranges of different sources is developed in [9]. A comparative study between various qZSI control schemes is carried out from the small-signal state-space averaged model of qZSIs in [20]. Several works analyze qZSI-based PV power systems to propose dynamic models and assess PV power system stability [21,22,23,24,25]. Most of them focus on the analysis and enhancement of the DC side and the enhancement of AC network impedance performance on the DC side [21,24,25], but the dynamic interaction between the DC and AC side has not been fully studied yet. Only a few works can be found in the literature [22,23], where the effect of the impedance network on qZSI dynamics is analyzed. It is shown that oscillatory instabilities may appear in the modulation ratio triggered by the AC current controller due to the AC network impedance. A design guideline to improve this issue is proposed.
Unlike most published works, which mainly focus on qZSI dynamic behavior, improvement of the DC side of qZSI-based PV power systems and impact of the AC impedance network on qZSI-based PV power system stability, this paper presents a broader study about qZSI-based PV power system stability that provides the following contributions to understand the qZSI-based PV power system dynamics:
  • Simulation tools, fully developed for implementation, based on Matlab/Simulink and PSCAD/EMTDC small-signal state-space averaged models of qZSI-based PV power systems which include all their components and controls.
  • An exhaustive study about the influence of qZSI-based PV power system parameters on stability.
  • Solutions to improve qZSI-based PV power system stability.
These contributions can be a useful tool and a guide on qZSI-based PV power system stability works for designers, engineers and researchers.

2. QZSI-Based PV Power Systems

The circuit and block diagram of qZSI-based PV power systems is illustrated in Figure 1. It consists of a DC bus where an Np × Ns (number of PV panels in parallel × number of PV panels in series) PV array is connected with a shunt capacitor Cp and a DC cable, characterized with a resistance Rc, to the qZSI, which boosts the output voltage vdc at the VSI terminals. The maximum power point (MPP) tracking (MPPT) control is used to obtain the maximum power from the PV panel. The PV and current control loops ensure power flow from the PV panel to the AC grid. Moreover, the duty cycle control of the qZSI allows the DC-link peak voltage vdc,p to be fixed.
The Matlab/Simulink and PSCAD models of the qZSI-based PV power system are presented in the following Sections to assess system stability.

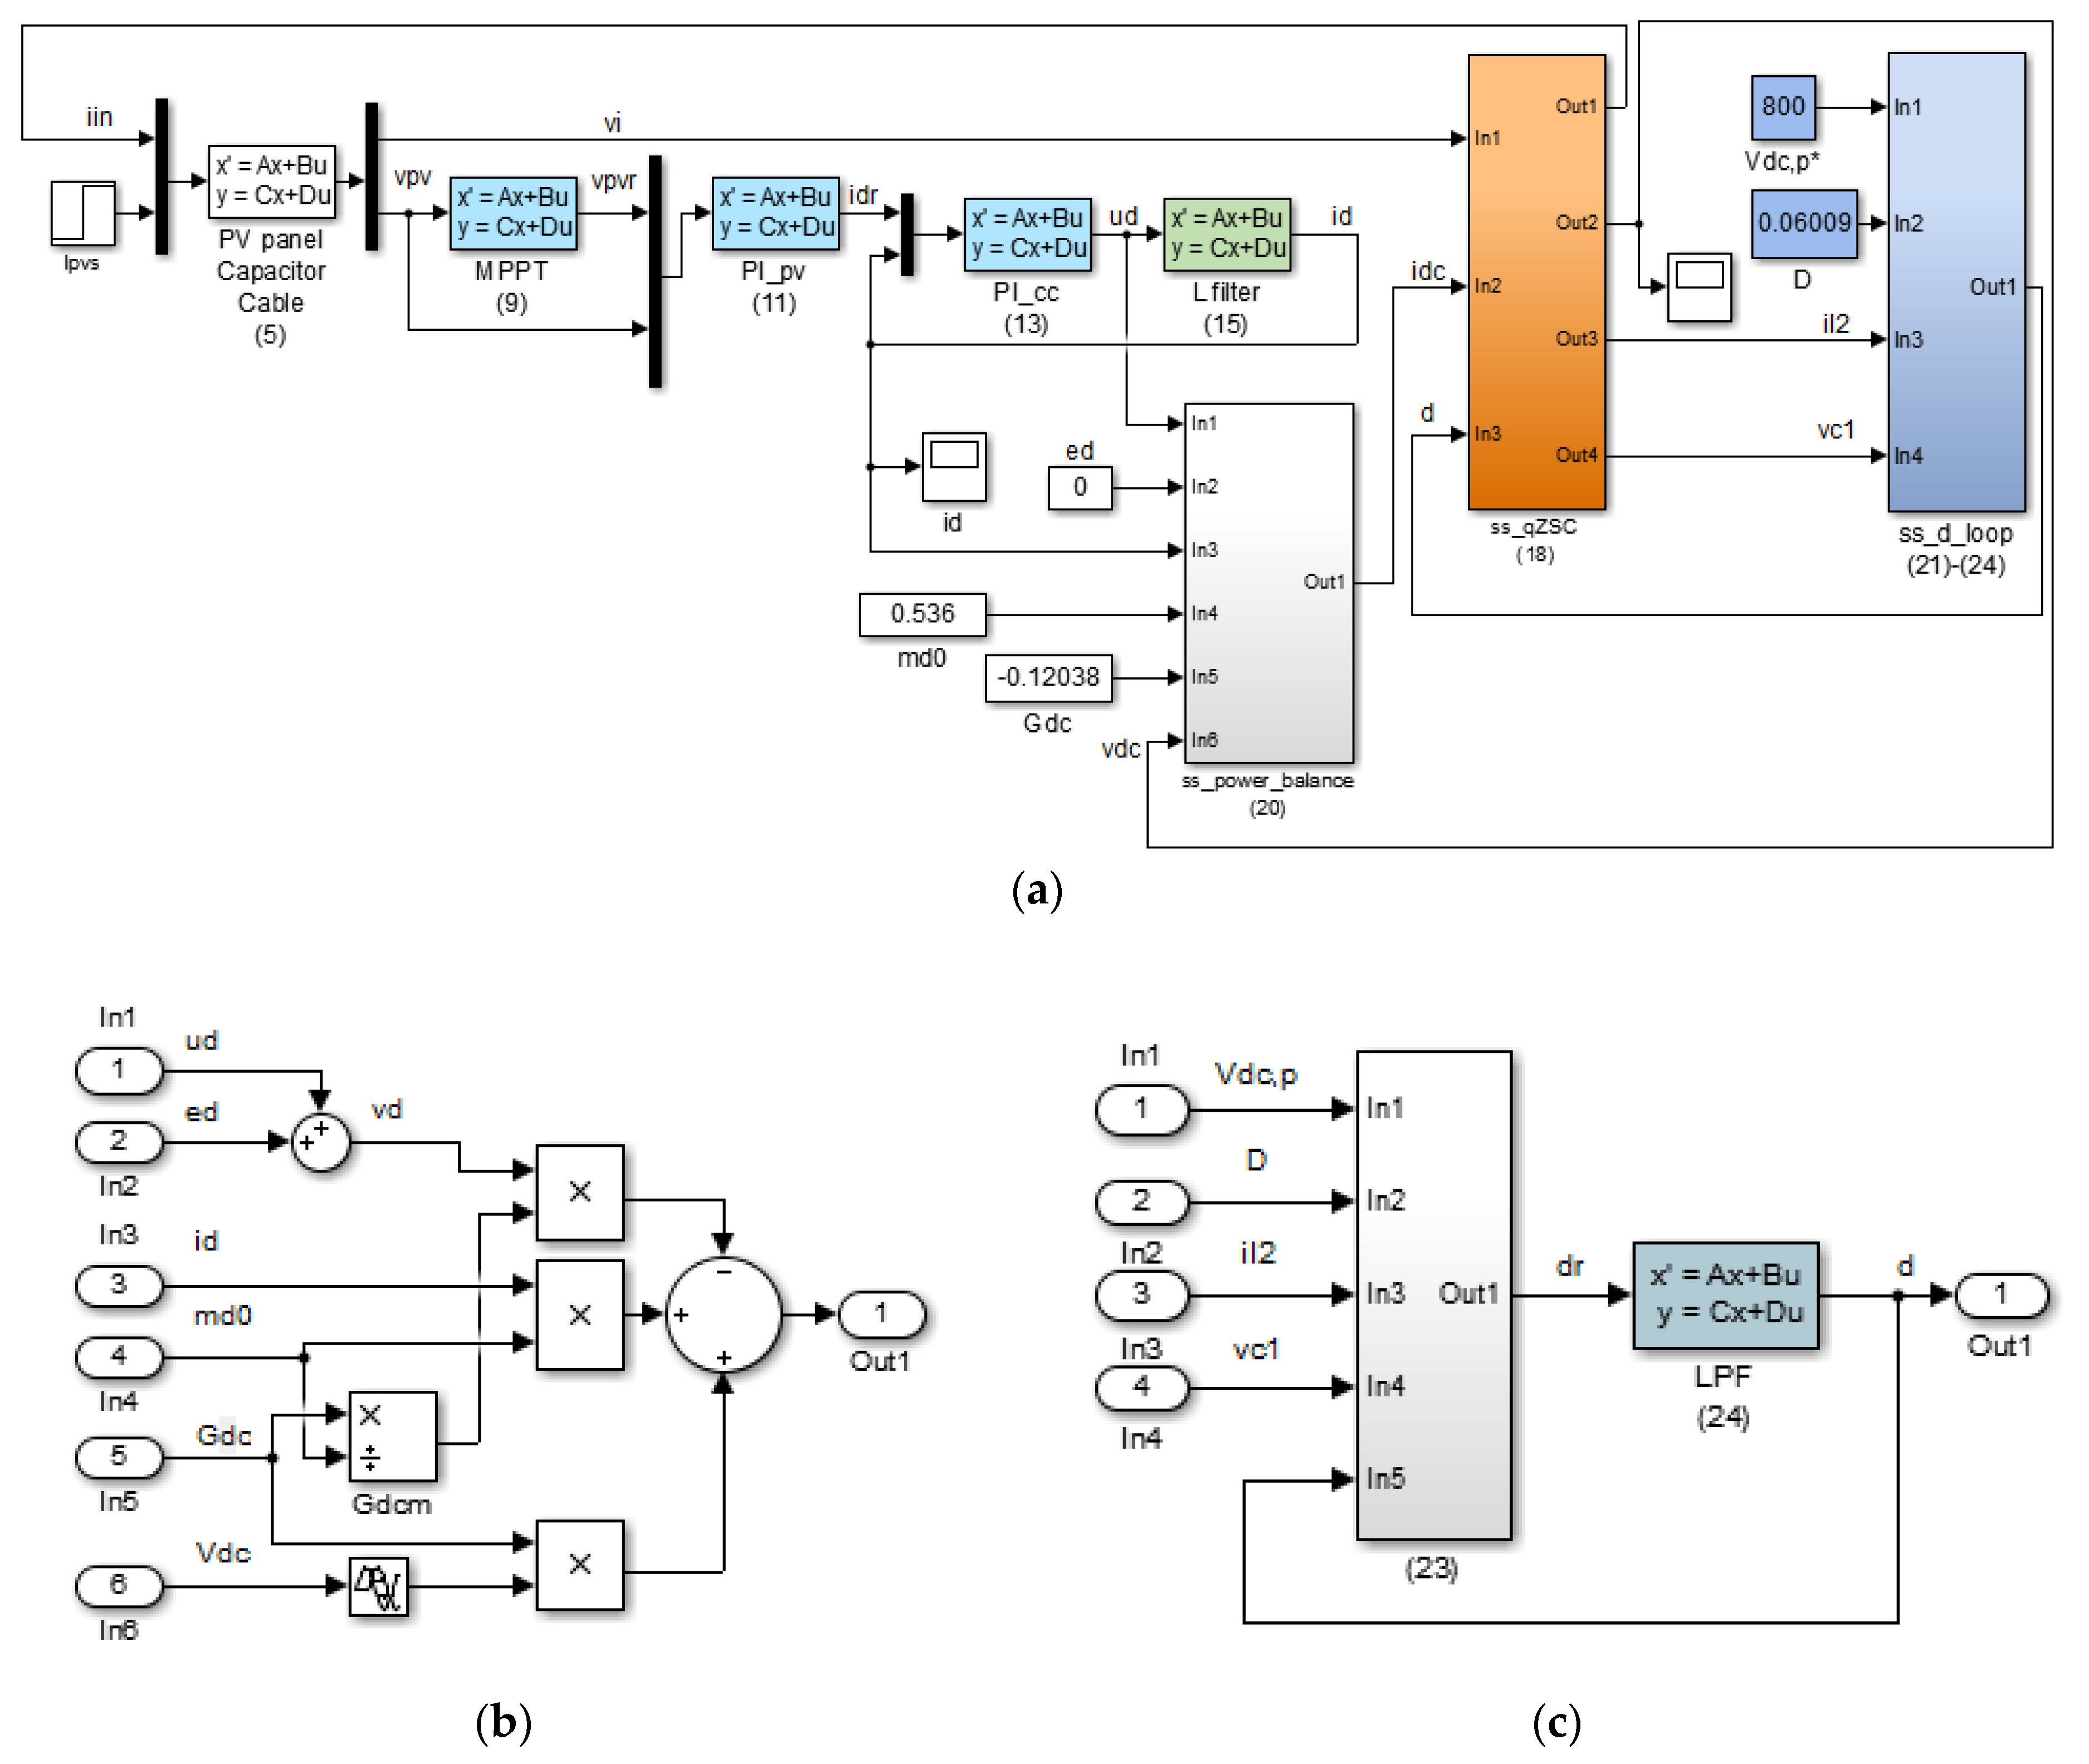
3. Matlab/Simulink Model of the qZSI-Based PV Power System

The Matlab/Simulink small-signal state-space averaged model of the qZSI-based PV power system in Figure 2 is derived. It is used to study the dynamic behavior of the PV power system in order to assess PV system stability and analyzing possible solutions to mitigate instability problems. The dynamic response of the PV power system is obtained by simulations, and the state-space matrix A and eigenvalues λi = σi ±ωi of the state-space modes of the PV power system can also be obtained from the Matlab/Simulink small-signal state-space averaged model of the qZSI-based PV power system. Moreover, the participation factors of each state-space variable of each mode can be calculated as pki = ϕki·ψik, where ϕki and ψik are the elements of the right and left eigenvectors of the state-space matrix A, respectively.
This Section is divided into Subsections introducing the Matlab/Simulink model of the qZSI-based PV power system subsystems in Figure 2. In order to obtain these subsystem models, the small-signal state-space averaged equations of the circuits in Figure 1 are derived according to the state-space equation form
d x d t = A x + B u y = C x + D u ,
where A, B, C, and D are the state-space, input, output, and feedthrough matrices, x is the state vector, u is the input vector, and y is the output vector.

3.1. PV Installation Modeling

The small-signal state-space model of the PV installation, formed by the PV panel with the MPPT control, the shunt capacitor Cp and the resistance Rc of the cable connecting the PV panel and the qZSI (see Figure 1), is derived.
The equation that relates the output current ipv and the terminal voltage vpv in the PV panel is expressed as [2],
i p v = N p { I p v L I p v 0 { exp ( v p v / N s + R s i p v / N p n V T 1 ) } } ,
where IpvL and Ipv0 are the photovoltaic and the saturation currents of the PV cell, Rs is the equivalent series resistance of the PV cell, n is the diode quality factor and VT = k·T/q is the thermal constant of the PV cell, with k being the Boltzman constant (1.38 × 10⁻²³ J/K), q the Coulomb constant (1.602 × 10⁻¹⁹ C), and T the PV cell temperature in Kelvin. The photovoltaic current IpvL is proportional to the irradiance level G and is usually referred to as the rated irradiation (i.e., G = 1 Sun = 1000 W/m2). The photovoltaic and saturation currents, IpvL and Ipv0, also depend on the temperature T, which is 25 °C.
Figure 3a shows the ipv-vpv characteristics (2) of a PV panel based on 60 W PV Solarex MSX60 modules [2]. The influence of Np and Ns on the MPP is also illustrated in Figure 3a for three PV array configurations.
The small-signal model of the PV panel is obtained from the linearization of ipv-vpv characteristics (2) around the MPP (Vpv = Vmpp and Ipv = Impp) [5],
i p v = I p v s 1 R p v v p v Δ i p v = Δ I p v s 1 R p v Δ v p v ,
where the incremental symbol ∆ identifies the small-signal variables and
I p v s = I p v + V p v R p v R p v = d v p v d i p v | ( V p v , I p v ) = N s N p R p v _ c e l l R p v _ c e l l = n V T I p v 0 exp ( V p v / N s + R s I p v / N p n V T 1 ) + R s .
The small-signal circuit of the PV panel (3), shunt capacitor, and cable is shown in Figure 3b and the small-signal state-space model becomes
d d t [ Δ v p v ] = [ 1 C p R p v ] [ Δ v p v ] + [ 1 C p 1 C p ] [ Δ i i Δ i p v ] [ Δ v i ] = [ 1 ] [ Δ v p v ] + [ R c 0 ] [ Δ i i Δ i p v ] .
The MPPT control generates the PV panel reference voltage by imposing the maximum value of the instantaneous power from the PV panel, ppv = ipv·vpv. Thus, the MPP can be mathematically characterized as [5]
d p p v d v p v | MPP     = [ i p v + v p v d i p v d v p v ] MPP Σ m p p   = 0 Σ m p p = i p v v p v + d i p v d v p v = 0 .
According to (6), the sum of the actual conductance and the incremental conductance at the MPP (Vmpp, Impp) is equal to zero. The sum Σmpp is related to the PV voltage around the MPP by means of the linear I-V characteristics of the PV panel (3) as
Σ m p p = 2 R m p p + I m p p v p v + V m p p R m p p 1 v p v ,
where Rmpp = Vmpp/Impp is the incremental resistance of the linear ipv-vpv characteristics of the PV panel at the MPP (3). Considering the previous characterization of the MPP, the PV panel reference voltage is obtained from a PI control as the small-signal relation
v p v r = ( k p m + k i m s ) Σ m p p Δ v p v r = ( k p m + k i m s ) k m Δ v p v Δ Σ m p p Δ v p v r = k p m k m Δ v p v + k i m k m Δ i p v s s Δ i p v s = Δ v p v ,
where k p m and k i m are the PI control proportional and integral gains of the MPPT control and km = −2/(Vmpp·Rmpp) [5].
According to (8), the small-signal state-space model of the MPPT control is represented by
d d t [ Δ i p v s ] = [ 0 ] [ Δ i p v s ] + [ 1 ] [ Δ v p v ] [ Δ v p v r ] = [ k i m k m ] [ Δ i p v s ] + [ k p m k m ] [ Δ v p v ] .
Figure 3c,d shows the influence of Np, Ns and G on the MPP of the PV panel (i.e., on Impp, Vmpp and Rmpp). The MPP corresponding to the PV array configuration Np = 55 and Ns = 42 and the operating point T1 = 25 °C with G = 0.5 Sun and 0.75 Sun labeled with the blue and red dots, respectively. The current Impp is affected by Np and by G, and the increase of both variables leads to the increase of Impp. Variations of Impp can have a large impact on the performance of the qZSI-PV-based power system, even leading the system to instability in some conditions (see Section 5). The voltage Vmpp is mainly affected by Ns, and the increase of this variable results in the increase of Vmpp. The number of PV panels in series Ns is usually fixed according to the rated voltage of the PV power system, and low variations of Vmpp due to other causes (e.g., the irradiance level G) are controlled by means of the duty cycle control of the qZSI. The incremental resistance Rmpp = Vmpp/Impp varies in accordance with the variations of Vmpp and Impp.

3.2. PV Panel Voltage Control and Grid-Connected VSI Modeling

The small-signal state-space model of the PV panel voltage control, VSI current control, and grid-connected VSI is presented in Figure 1. The grid d-frame reference current idr is generated by the PI-based control of the PV panel voltage. The grid q-frame reference current iqr is set to zero considering that the VSI operates at unity power factor [6,8]. The grid dq-frame reference voltage vdqr is provided by the PI-based control of the VSI. The VSI PLL is not considered in the study.
The grid d-reference current generated by the PV panel voltage control is expressed as the small-signal relation
i d r = ( k p p v + k i p v s ) ( v p v r v p v ) Δ i d r = k i p v Δ q p v + k p p v ( v p v v p v r ) s Δ q p v = Δ v p v Δ v p v r ,
where k p p v and k i p v are the PI control proportional and integral gains of the PV panel voltage control. According to (10), the small-signal state-space model of the PV panel voltage control is expressed as
d d t [ Δ q p v ] = [ 0 ] [ Δ q p v ] + [ 1 1 ] [ Δ v p v Δ v p v r ] [ Δ i d r ] = [ k i p v ] [ Δ q p v ] + [ k p p v k p p v ] [ Δ v p v Δ v p v r ] .
The output d-reference voltage generated by the PI compensator of the dq-frame VSC current control is expressed as the small-signal relation
u d = ( k p c c + k i c c s ) ( i d r i d ) Δ u d = k p c c ( Δ i d r Δ i d ) + k i c c Δ q c c s Δ q c c = Δ i d r Δ i d ,
where k p c c and k i c c are the proportional and integral gains of the PI compensator. According to (12), the small-signal state-space model of the PI compensator is represented by
d d t [ Δ q c c ] = [ 0 ] [ Δ q c c ] + [ 1 1 ] [ Δ i d r Δ i d ] [ Δ u d ] = [ k i c c ] [ Δ q c c ] + [ k p c c k p c c ] [ Δ i d r Δ i d ] .
The small-signal model of the grid-connected VSI is obtained from the d-current dynamics and the grid d-reference voltage vdr generated by the dq-frame VSI current control as
v d = L f s i d L f ω 1 i q + e d v d r = u d L f ω 1 i q + e d } v d = v d r s Δ i d = 1 L f Δ u d ,
where Lf is the inductance of the converter filter. According to (14), the small-signal state-space model of the grid-connected VSI is represented by
d d t [ Δ i d ] = [ 0 ] [ Δ i d ] + [ 1 L f ] [ Δ u d ] [ Δ i d ] = [ 1 ] [ Δ i d ] + [ 0 ] [ Δ u d ] .

3.3. qZSI Modeling

This Subsection presents the small-signal state-space averaged model of the qZSI in Figure 1. The qZSI works in two different operational states during one switching cycle T: The shoot-through and the non-shoot-through states (see Figure 4) [11]. The first interval is T0, where the inverter bridge is equivalent to short circuit. The second interval is T1, where the inverter is equivalent to a current source, which represents VSI consumption. The shoot-through interval is defined by the duty cycle d = T0/T and the non-shoot-through interval by T1/T = 1 − d. The qZSI control of the duty cycle is also plotted in Figure 1. This control allows the adjustment of the dc-link voltage vdc [11].

3.3.1. Power Circuit Model

The equations during each switching interval of the qZSI can be deduced from the equivalent circuits of the qZSI in Figure 4 [11].
  • Shoot-through state: The matrices of the state-space model in this interval are
    d d t [ Δ i L 1 Δ i L 2 Δ v c 1 Δ v c 2 ] = [ ( R + r ) L 1 0 0 1 L 1 0 ( R + r ) L 2 1 L 2 0 0 1 C 1 0 0 1 C 2 0 0 0 ] [ Δ i L 1 Δ i L 2 Δ v c 1 Δ v c 2 ] + [ 1 L 1 0 0 0 0 0 0 0 ] [ Δ v i Δ i d c ] [ Δ i i Δ v d c ] = [ 1 0 0 0 0 0 0 0 ] [ Δ i L 1 Δ i L 2 Δ v c 1 Δ v c 2 ] + [ 0 0 0 0 ] [ Δ v i Δ i d c ] .
  • Non-shoot-through state: The matrices of the state-space model in this interval are
    d d t [ Δ i L 1 Δ i L 2 Δ v c 1 Δ v c 2 ] = [ ( R + r ) L 1 0 1 L 1 0 0 ( R + r ) L 2 0 1 L 2 1 C 1 0 0 0 0 1 C 2 0 0 ] [ Δ i L 1 Δ i L 2 Δ v c 1 Δ v c 2 ] + [ 1 L 1 R L 1 0 R L 2 0 1 C 1 0 1 C 2 ] [ Δ v i Δ i d c ] [ Δ i i Δ v d c ] = [ 1 0 0 0 R R 1 1 ] [ Δ i L 1 Δ i L 2 Δ v c 1 Δ v c 2 ] + [ 0 0 0 2 R ] [ Δ v i Δ i d c ] .
The small-signal state-space averaged model of the qZSI is finally expressed from (16) and (17) as [11]
d d t [ Δ i L 1 Δ i L 2 Δ v C 1 Δ v C 2 ] = [ ( R + r ) L 1 0 ( D 1 ) L 1 D L 1 0 ( R + r ) L 2 D L 2 ( D 1 ) L 2 1 D C 1 D C 1 0 0 D C 2 1 D C 2 0 0 ] [ Δ i L 1 Δ i L 2 Δ v C 1 Δ v C 2 ] + [ 1 L 1 R ( 1 D ) L 1 V 1 L 1 0 R ( 1 D ) L 2 V 1 L 2 0 D 1 C 1 I 1 C 1 0 D 1 C 2 I 1 C 2 ] [ Δ v i Δ i d c Δ d ] [ Δ i i Δ v d c Δ i L 2 Δ v C 1 ] = [ 1 0 0 0 ( 1 D ) R ( 1 D ) R ( 1 D ) ( 1 D ) 0 1 0 0 0 0 1 0 ] [ Δ i L 1 Δ i L 2 Δ v C 1 Δ v C 2 ] + [ 0 0 0 0 2 ( 1 D ) R V 2 0 0 0 0 0 0 ] [ Δ v i Δ i d c Δ d ] ,
where D is the steady state duty cycle and V1 = VC1 + VC2RIdc, I1 = IdcIL1IL2., V2 = −V1 + RI1, with IL1, IL2, VC1, and VC2 being the steady state values of the state variables.
The qZSI input output current idc is obtained from the DC/AC VSI power balance, which, assuming a lossless VSI, can be written as
v d c i d c = v d i d + v q i q .
The power balance (19) is expressed as the following small-signal relation:
V d c Δ i d c + I d c Δ v d c = V d Δ i d + I d Δ v d + V q Δ i q + I q Δ v q V d > > V q E q = I q = 0 Δ i d c = m d 0 Δ i d 1 m d 0 G d c Δ v d + G d c Δ v d c ,
where md0 = Vd/Vdc is the steady-state operation point of the modulation function, Gdc = 1/Rdc = −P/V2dc, P is the active power flowing through the VSI from the DC to the AC side (see Figure 1), Vd is the steady = state converter voltage, and Vdc and Idc are the steady-state qZSI output voltage and current, respectively. The Matlab/Simulink model of this small-signal relation of the power balance is presented in Figure 2b.

3.3.2. Duty Cycle Control Model

The duty cycle control of the qSZI-based PV power system in Figure 1 is based on the adjustment of the dc-link peak voltage vdc,p through a PI-based control of the dc-link voltage reference V d c , p * together with a P-based control for the inductor-L2 current. Finally, in order to smooth the duty cycle delivered to the VSI, a low-pass-filter (LPF) tuned to fc = 25 Hz is used.
The control laws of the dc-link voltage and inductor-L2 current loops are expressed as the small-signal relation
d r = k p L ( k p d c + k i d c s ) ( V d c , p * v d c , p ) k p L i L 2 Δ d r = k p L k i d c Δ q d c k p L k p d c Δ v d c , p k p L Δ i L 2 s Δ q d c = Δ v d c , p ,
where k p d c and k i d c are the proportional and integral gains of the dc-link voltage PI-based control, and k p L is the proportional gain of the inductor—L2 current P-based control. The small-signal averaged expression of the dc-link peak voltage is derived as [10]
v d c , p = 1 1 d v C 1 Δ v d c , p = 1 1 D Δ v C 1 + V d c , p 1 D Δ d .
The small-signal state-space model of the duty cycle dr is derived from (21) and (22) as
d d t [ Δ q d c ] = [ 0 ] [ Δ q d c ] + [ 0 1 1 D V d c , p 1 D ] [ Δ i L 2 Δ v C 1 Δ d ] [ Δ d r ] = [ k p L k i d c ] [ Δ q d c ] + [ k p L k p L k p d c 1 D k p L k p d c 1 D V d c , p ] [ Δ i L 2 Δ v C 1 Δ d ] .
The small-signal state-space model of the LPF is represented by
d d t [ Δ d ] = [ ω c ] [ Δ d ] + [ ω c ] [ Δ d r ] [ Δ d ] = [ 1 ] [ Δ d ] + [ 0 ] [ Δ d r ] .
The Matlab/Simulink model of the duty cycle control is presented in Figure 2c.

4. PSCAD/EMTDC Model

PSCAD implementation of the qZSI-based PV power system is illustrated in Figure 5 according to the power and control systems of the qZSI-based PV power system in Figure 1 and the qZSI-based PV power system modeling in Section 3. The PSCAD model, composed of the power modules of the PV panel, qZSI, VSI, and AC grid, is shown in Figure 5a. Furthermore, Figure 5b presents the three control loops included in the qZSI-based PV power system, i.e., the PV voltage (left-top), current (right-top), and duty cycle (bottom) control loops.

5. Applications

Simulations with the Matlab/Simulink and PSCAD/EMTDC models of the qZSI-based PV power system in Figure 1 and Table 1 data are shown in Figure 6a. The PV panel supplies a 138 kW 1 kV DC PV power system connected to a strong 400 V AC grid. Note that small-scale (Ppv < 10 kW) PV power systems usually work with DC voltages below 1 kV [7,13,16], but large-scale PV power systems (Ppv > 10 kW) tend to work with DC voltages in the range of 1 kV to 1.5 kV to reduce the initial PV array cost and total cabling required [7,11,19,25]. In the application, the PV panel has 55 arrays connected in parallel, each of which consists of 42 PV Solarex MSX60 modules connected in series. Key data of these modules at 1 Sun are Voc = 21 V, Isc = 3.74 A, Vmax = 17.1 V, Imax = 3.5 A, Pmax = 59.9 W [2]. An irradiance level of 0.5 Sun and MPP voltage and current equal to Vmpp = 16.73 V and Impp = 1.77 A, which corresponds to a PV panel voltage, current and active power Vpv = 16.73 × 42 = 702.9 V, Ipvs = 1.77 × 55 = 97.35 A and Ppv = 702.9 × 97.35 = 68.2 kW, respectively, are considered in the studied cases. It must also be noted that traditional IGBTs at the 10 kHz switching frequency fsw are set in the application, just as in [11,15,20]. It is well known that the use of SiC MOSFETs or Si MOSFETs would allow the switching frequency to be increased up to the 25–65 kHz range to reduce passive component size and improve system efficiency [17,21,25]. According to this, it would be interesting to further develop studies about the influence of switching frequency on dynamic behavior of qZSI-based PV power systems.
The Matlab/Simulink small-signal model of the qZSI-based PV power system model depends on the steady-state stable operation point values (i.e., Vmpp = 702 V, Impp = 94.2 A, IL1 = IL2 = 94.1 A, Vc1 = 760 V, Vc2 = 63 V and D = 0.06), as obtained from PSCAD/EMTDC time domain simulations.
The dynamic response of the dc-link voltage vdc and the grid d-frame current id is studied when the PV panel current Ipvs is increased by 2 A and subsequently decreased by 1 A at 0.5 s and 1.5 s, respectively. The fair accuracy between the qZSI-based PV power system models is worth noting by comparing the dynamic response of the Matlab/Simulink and PSCAD/EMTDC simulations. It can also be noted that the PV power system is stable at all operating points. As an example, the PV power system eigenvalues of the operating point before 0.5 s, which is called reference operating point (ROP), are shown in Figure 6b. It is observed that the PV power system has no right hand plane (RHP) eigenvalues at the ROP. The same is true for the other two operating points.
The sensitivity of the circuit and control parameters on the qZSI-based PV power system eigenvalues and stability is numerically analyzed from the Matlab/Simulink small-signal state-space averaged model (see results in Table 2). It can be observed that several parameters affect to some extent (i.e., low, medium, or high sensitivity) the locus eigenvalues but not all of them impact on system stability. In order to analyze this issue, Figure 7 shows the locus of the ROP eigenvalues with low, medium, and high sensitivity (labeled in blue and red as in Figure 6b) with respect to the circuit and control qZSI-based PV power system parameters. These parameters are varied according to 10% increments above and below the ROP circuit and control parameter values. The arrows indicate the growing value of the circuit and control parameters. The circuit and control parameters with no impact on the eigenvalues are omitted in Figure 7. It is observed that only the red eigenvalue is related to system instability because it could be shifted to the RHP by circuit and control parameter variations. Thus, only the circuit and control parameters that affect this eigenvalue can impact to some extent (low, medium, or high sensitivity) on system stability (i.e., Cp, Rc, L1, L2, C1, C2, Ipvs and V d c , p * ). The sensitivity level depends on how the red eigenvalue approaches close to the RHP.
It was numerically verified that only the external circuit parameter Ipvs = 2·Impp in Figure 5a can cause system instability. This is so because it is related to the active power P flowing through the VSI (large Ipvs values lead to high P values) and this power affects system stability. The small-signal DC input current and voltage of the VSI, i.e., the qZSI output current and voltage idc and vdc, are related by means of the virtual conductance Gdc = –P/V2dc (20), which has a negative value for inverter operation of the VSI (i.e., for P > 0). In this situation, the VSI has a non-passive behavior at the DC side, which reduces the damping of qZSI-based PV power systems at resonances, and this can lead to system instability. This external parameter Ipvs increases when the irradiance level G and the number of PV panels in parallel Np increase (see Figure 3c). Therefore, these factors increase the active power P flowing through the VSI and enlarge the value of Gdc, compromising qZSI-based PV power system stability. It can be observed from Figure 7 that low values of L2, C2, k p p v or high values of L1, C1, Rc, Cp can move the system away from the RHP and help make the system more stable. It must also be noted that any factor that reduces the value of Gdc in (20), such as a large steady state qZSI output voltage Vdc, may also improve qZSI-based PV power system stability. For this reason, the increase of V d c , p * moves the system away from the RHP in Figure 7. Comparison of the above conclusions with the qZSI [9] and qZSI-based PV power system [22], ref. [23] stability studies in the literature shows that:
  • The influence of the inductors L1 and L2 and the capacitors C1 and C2 on qZSI dynamic behavior [9] can be extended to qZSI-based PV power system dynamic behavior: Inductors and capacitors have a high and low impact on the dynamic response, respectively. However, unlike [9], the present study differentiates the value of both inductors and concludes that the increase of L1 may improve qZSI-based PV power system stability.
  • The detailed analysis of the present study shows the impact of the qZSI-based PV power system operating point on instabilities, in particular high and low values of the active power P flowing through the VSI and the steady-state qZSI output voltage Vdc, respectively. The latter is directly related to the negative impact of high values of the duty cycle control in [22,23].
  • The impact of the AC network on qZSI-based PV power systems [22,23] is not studied in this paper because a strong AC grid is considered in the application. However, the proposed Matlab/Simulink and PSCAD/EMTDC small-signal state-space averaged models can be used to analyze this concern.
PSCAD/EMTDC simulations are shown in Figure 8 to verify the above conclusions. The dynamic response of the currents iL1, idc, and id to G, L2, V d c , p * and C1 variations is plotted. It can be noted that the increase of G from 0.5 Sun to 0.75 Sun causes system instability. On the other hand, the decrease of L2 from 0.3 mH to 0.225 mH (ΔL2 = −25 %), the increase of V d c , p * from 800 V to 960 V (Δ V d c , p * = +20%), and the increase of C1 from 3 mF to 3.9 mF (ΔC1 = +30%) restore system stability after the qZSI-based PV power system becomes unstable due to the step-up of the irradiance level. Although not shown for the sake of space, the influence of the other parameters (i.e., Np, C2, k p p v , L1, Rc and Cp) on stability was also validated.

6. Conclusions

This first part of the paper contributes to qZSI-based PV power system stability studies with two simulation tools based on a Matlab/Simulink and a PSCAD model of qZSI-based PV power systems. Both models consider all the main components and controls. They make it possible to analyze system stability based on system eigenvalues and dynamic numerical simulations, respectively. The second part of the paper (Section 5) contributes with the stability study performed from the above models and the discussion about the impact of parameter variations on system stability. Direction on the qZSI-based PV power system stability is provided to designers, engineers, and researchers. The following recommendations and solutions are proposed:
  • The operating point is the main factor related to system stability. In particular,
    The increase of active power flowing through the VSI, which directly depends on the irradiance level and the number of PV panels in parallel, can lead to system stability loss.
    The dc-link peak voltage also affects system stability. According to this, the increase of the dc-link peak voltage reference may be used to enhance stability because it mitigates the impact of active power flowing through the VSI.
  • The qZSI component design is important for upgrading PV power system stability. In particular, low values of L2, C2 and high values of L1, C1 can help to make the system more stable.
  • Other PV power system parameters such as the PV panel shunt capacitor Cp and the DC cable Rc could help to improve stability if they take high values.
  • PV installation, qZSI, PV control, and D control parameters have little influence on system stability.
All of the above was verified through time domain simulations with the proposed Matlab/Simulink and PSCAD models, which may become a powerful tool for analyzing other factors related to dynamic interaction between the DC and AC side of qZSI-based PV power systems such as the effect of the AC impedance network on qZSI dynamics.

Author Contributions

Conceptualization, L.M. and L.S.; methodology, L.S. and J.P.; software development and validation, L.M. and J.J.M.; writing—original draft preparation, L.S. and L.M.; All authors have read and agreed to the published version of the manuscript.

Funding

This research was funded by the Ministerio de Ciencia, Innovación y Universidades under Grant RTI2018-095720-B-C33.

Institutional Review Board Statement

Not applicable.

Informed Consent Statement

Not applicable.

Conflicts of Interest

The authors declare no conflict of interest

References

  1. Fu, Q.; Montoya, L.F.; Solanki, A.; Nasiri, A.; Bhavaraju, V.; Abdallah, T.; David, C.Y. Microgrid generation capacity design with renewables and energy storage addressing power quality and surety. IEEE Trans. Smart Grid 2012, 3, 2019–2027. [Google Scholar] [CrossRef]
  2. Walker, G. Evaluating MPPT converter topologies using a Matlab PV Model. J. Electr. Electron. Eng. 2001, 21, 49–55. [Google Scholar]
  3. Liu, S.; Liu, P.X.; Wang, X. Stochastic small-signal stability analysis of grid-connected photovoltaic systems. IEEE Trans. Ind. Electron. 2016, 63, 1027–1038. [Google Scholar] [CrossRef]
  4. Degner, T.; Schmid, J.; Strauss, P. Distributed generation with high penetration of renewable energy sources. In Final Public Report of Dispower Project; Institut Fuer Solare Energieversorgungstechnik E.VL: Kassel, Germany, 2006; ISBN 3-00-016584-3. [Google Scholar]
  5. Pokharel, M.; Ghosh, A.; Man Ho, C.N. Small-signal modelling and design validation of PV-controllers with INC-MPPT using CHIL. IEEE Trans. Energy Convers. 2019, 34, 361–370. [Google Scholar] [CrossRef]
  6. Liu, Y.; Ge, B.; Abu-Rub, H.; Peng, F.Z. An effective control method for quasi-Z-source cascade multilevel inverter-based grid-tie single-phase photovoltaic power system. IEEE Trans. Ind. Inform. 2014, 10, 399–407. [Google Scholar] [CrossRef]
  7. Serban, E.; Ordonez, M.; Pondiche, C. DC-bus voltage range extension in 1500 V photovoltaic inverters. IEEE J. Emerg. Sel. Top. Power Electron. 2015, 3, 901–917. [Google Scholar] [CrossRef]
  8. Siwakoti, Y.P.; Peng, F.Z.; Blaabjerg, F.; Loh, P.C.; Town, G.E. Impedance-source networks for electric power conversion Part I: A topological review. IEEE Trans. Power Electron. 2015, 30, 699–716. [Google Scholar] [CrossRef]
  9. Siwakoti, Y.P.; Peng, F.Z.; Blaabjerg, F.; Loh, P.C.; Town, G.E.; Yang, S. Impedance-source networks for electric power conversion part II: Review of control and modulation techniques. IEEE Trans. Power Electron. 2015, 30, 1887–1906. [Google Scholar] [CrossRef]
  10. Husev, O.; Blaabjerg, F.; Roncero-Clemente, C.; Romero-Cadaval, E.; Vinnikov, D.; Siwatoki, Y.; Strzelecki, R. Comparison of impedance-source networks for two and multilevel buck–boost inverter applications. IEEE Trans. Power Electron. 2016, 31, 7564–7579. [Google Scholar] [CrossRef]
  11. Liu, Y.; Abu-Rub, H.; Ge, B.; Blaabjerg, F.; Ellaban, O.; Chiang, P. Impedance Source Power Electronic Converters; John Wiley and Sons-IEEE Press: Chichester, UK, 2016. [Google Scholar]
  12. Liu, J.; Hu, J.; Xu, L. Dynamic modeling and analysis of Z-source converter-derivation of AC small signal model and design-oriented analysis. IEEE Trans. Power Electron. 2007, 22, 1786–1796. [Google Scholar] [CrossRef]
  13. Li, Y.; Anderson, J.; Peng, F.Z.; Liu, D. Quasi-Z-source inverter for photovoltaic power generation systems. In Proceedings of the 2009 Twenty-Fourth Annual IEEE Applied Power Electronics Conference and Exposition, Washington, DC, USA, 15–19 February 2009; pp. 918–924. [Google Scholar]
  14. Liu, Y.; Ge, B.; Ferreira, F.J.T.E.; de Almeida, A.T.; Abu-Rub, H. Modeling and SVPWM control of quasi-Z-source inverter. In Proceedings of the 11th International Conference on Electrical Power Quality and Utilisation (EPQU), Lisbon, Portugal, 17–19 October 2011; pp. 1–7. [Google Scholar]
  15. Anderson, J.; Peng, F.Z. Four quasi-Z-Source inverters. In Proceedings of the 2008 IEEE Power Electronics Specialists Conference, Rhodes, Greece, 15–19 June 2008; pp. 2743–2749. [Google Scholar]
  16. Roncero-Clemente, C.; Romero-Cadaval, E.; Husev, O.; Vinnikov, D.; Stepenko, S. Simulation of grid connected three-level neutral-point-clamped qZS inverter using PSCAD. Electr. Control Commun. Eng. 2013, 2, 14–20. [Google Scholar] [CrossRef] [Green Version]
  17. Husev, O.; Roncero-Clemente, C.; Stepenko, S.; Vinnikov, D.; Romero-Cadaval, E. CCM operation analysis of the single-phase three-level quasi-Z-source inverter. In Proceedings of the 2012 15th International Power Electronics and Motion Control Conference (EPE/PEMC), Novi Sad, Serbia, 4–6 September 2012; pp. DS1b.21-1–DS1b.21-6. [Google Scholar]
  18. Tan, Y.; Kirschen, D.; Jenkins, N. A model of PV generation suitable for stability analysis. IEEE Trans. Energy Convers. 2004, 19, 748–755. [Google Scholar] [CrossRef]
  19. Xue, Y.; Manjrekar, M.; Lin, C.; Tamayo, M.; Jiang, J. Voltage stability and sensitivity analysis of grid-connected photovoltaic systems. In Proceedings of the IEEE PES General Meeting, Detroit, MI, USA, 24–28 July 2011; pp. 1–7. [Google Scholar]
  20. Castiglia, V.; Miceli, R.; Blaabjerg, F.; Yang, Y. Small-signal modeling and experimental validation of the three-phase quasi-Z-source inverter. In Proceedings of the 2020 IEEE 21st Workshop on Control and Modeling for Power Electronics (COMPEL), Aalborg, Denmark, 9–12 November 2020; pp. 1–8. [Google Scholar]
  21. Stepenko, S.; Husev, O.; Vinnikov, D.; Roncero-Clemente, C.; Pimentel, S.P.; Santasheva, E. Experimental comparison of two-level full-SiC and three-level Si–SiC quasi-Z-source inverters for PV applications. Energies 2019, 12, 2509. [Google Scholar] [CrossRef] [Green Version]
  22. Liang, Z.; Hu, S.; Yang, H.; He, X. Synthesis and design of the AC current controller and impedance network for the quasi-Z-source converter. IEEE Trans. Ind. Electron. 2018, 65, 8287–8296. [Google Scholar] [CrossRef]
  23. Liu, W.; Yang, Y.; Kerekes, T.; Liivik, E.; Blaabjerg, F. Impedance network impact on the controller design of the QZSI for PV applications. In Proceedings of the 2020 IEEE 21st Workshop on Control and Modeling for Power Electronics (COMPEL), Aalborg, Denmark, 9–12 November 2020; pp. 1–6. [Google Scholar]
  24. Oliveira-Assis, L.; Soares-Ramos, E.P.P.; Sarrias-Mena, R.; García-Triviño, P.; Fernández-Ramírez, L.M. Large-scale grid connected quasi-Z-source inverter-based PV power plant. In Proceedings of the 2020 IEEE International Conference on Environment and Electrical Engineering and 2020 IEEE Industrial and Commercial Power Systems Europe (EEEIC/I&CPS Europe), Madrid, Spain, 9–12 June 2020; pp. 1–6. [Google Scholar]
  25. Husev, O.; Vinnikov, D.; Roncero-Clemente, C.; Chub, A.; Romero-Cadaval, E. Single-phase string solar qZS-based inverter: Example of multi-objective optimization design. IEEE Trans. Ind. Appl. 2020. [Google Scholar] [CrossRef]
Figure 1. Circuit and block diagram of quasi-Z-source inverter (qZSI)-based photovoltaic (PV) power systems.
Energies 14 00508 g001
Figure 2. Matlab/Simulink small-signal model of qZSI-based PV power systems (symbol ∆ is omitted for sake of simplicity): (a) General layout; (b) power balance subsystem (20); (c) duty cycle control subsystem.
Energies 14 00508 g002
Figure 3. Study of the PV panel (T1 = 25 °C): (a) ipv-vpv characteristics; (b) small-signal equivalent circuit; (c) influence of Np and G on MPP; (d) influence of Ns and G on MPP.
Energies 14 00508 g003
Figure 4. Equivalent circuit of qZSI with continuous current input: (a) Shoot-through state; (b) non-shoot-through state.
Energies 14 00508 g004
Figure 5. PSCAD/EMTDC model of the qZSI-based PV power system: (a) Power circuit; (b) control circuit.
Energies 14 00508 g005aEnergies 14 00508 g005b
Figure 6. Study of the qZSI-based PV power system with the Matlab/Simulink and PSCAD/EMTDC models: (a) Time domain simulations. (b) Eigenvalues.
Energies 14 00508 g006
Figure 7. Root locus of the qZSI-based PV power system eigenvalues.
Energies 14 00508 g007
Figure 8. Stability study with PSCAD/EMTDC simulations.
Energies 14 00508 g008
Table 1. qZSI-based PV power system parameters.
Circuit and ControlParametersData
PV arrayNp × Ns55 × 42
G, T0.5 Sun, 25 °C
PV installationRc, Cp0.0667 Ω, 10 mF
qZSI source networkL1 = L2, r1 = r20.3 mH, 0.011 Ω
C1 = C2, R1 = R2 3 mF, 0.006 Ω
fsw10 kHz
VSIRf, Lf≈0 Ω, 0.4 mH
MPPT control k p m , k i m 0.01 Ω, 0.5 Ω/s
PV control k p p v , k i p v 1.8 Ω−1, 75 Ω−1/s
CC control k p c c , k i c c 0.424 Ω−1, 150 Ω−1/s
D control V d c , p * 800 V
k p d c , k i d c 0.016 V−1, 125 V−1/s
k p L 10−4A−1
Table 2. Sensitivity analysis of the qZSI-based PV power system eigenvalues and stability to circuit and control parameters.
Circuit ParametersControl Parameters
Sensitivity Sensitivity
CircuitParametersEigenvaluesStabilityControlParametersEigenvaluesStability
PV installationCpLow LowMPPT k p m Null Null
RcMedium Low k i m Null Null
qZSI source networkL1Medium LowPV k p p v Low Null
L2High High k i p v Null Null
C1Medium LowCC k p c c High Null
C2Medium Low k i c c High Null
GridLfMedium NullD V d c , p * Low Medium
edNull Null k p d c Null Null
PV arrayIpvs = 2mppMedium High k p L Null Null
Rpv = RmppNullNull
Publisher’s Note: MDPI stays neutral with regard to jurisdictional claims in published maps and institutional affiliations.

