Techno-Cost-Benefit Analysis of Biogas Production from Industrial Cassava Starch Wastewater in Thailand for Optimal Utilization with Energy Storage


 ,
,
Abstract
:1. Introduction
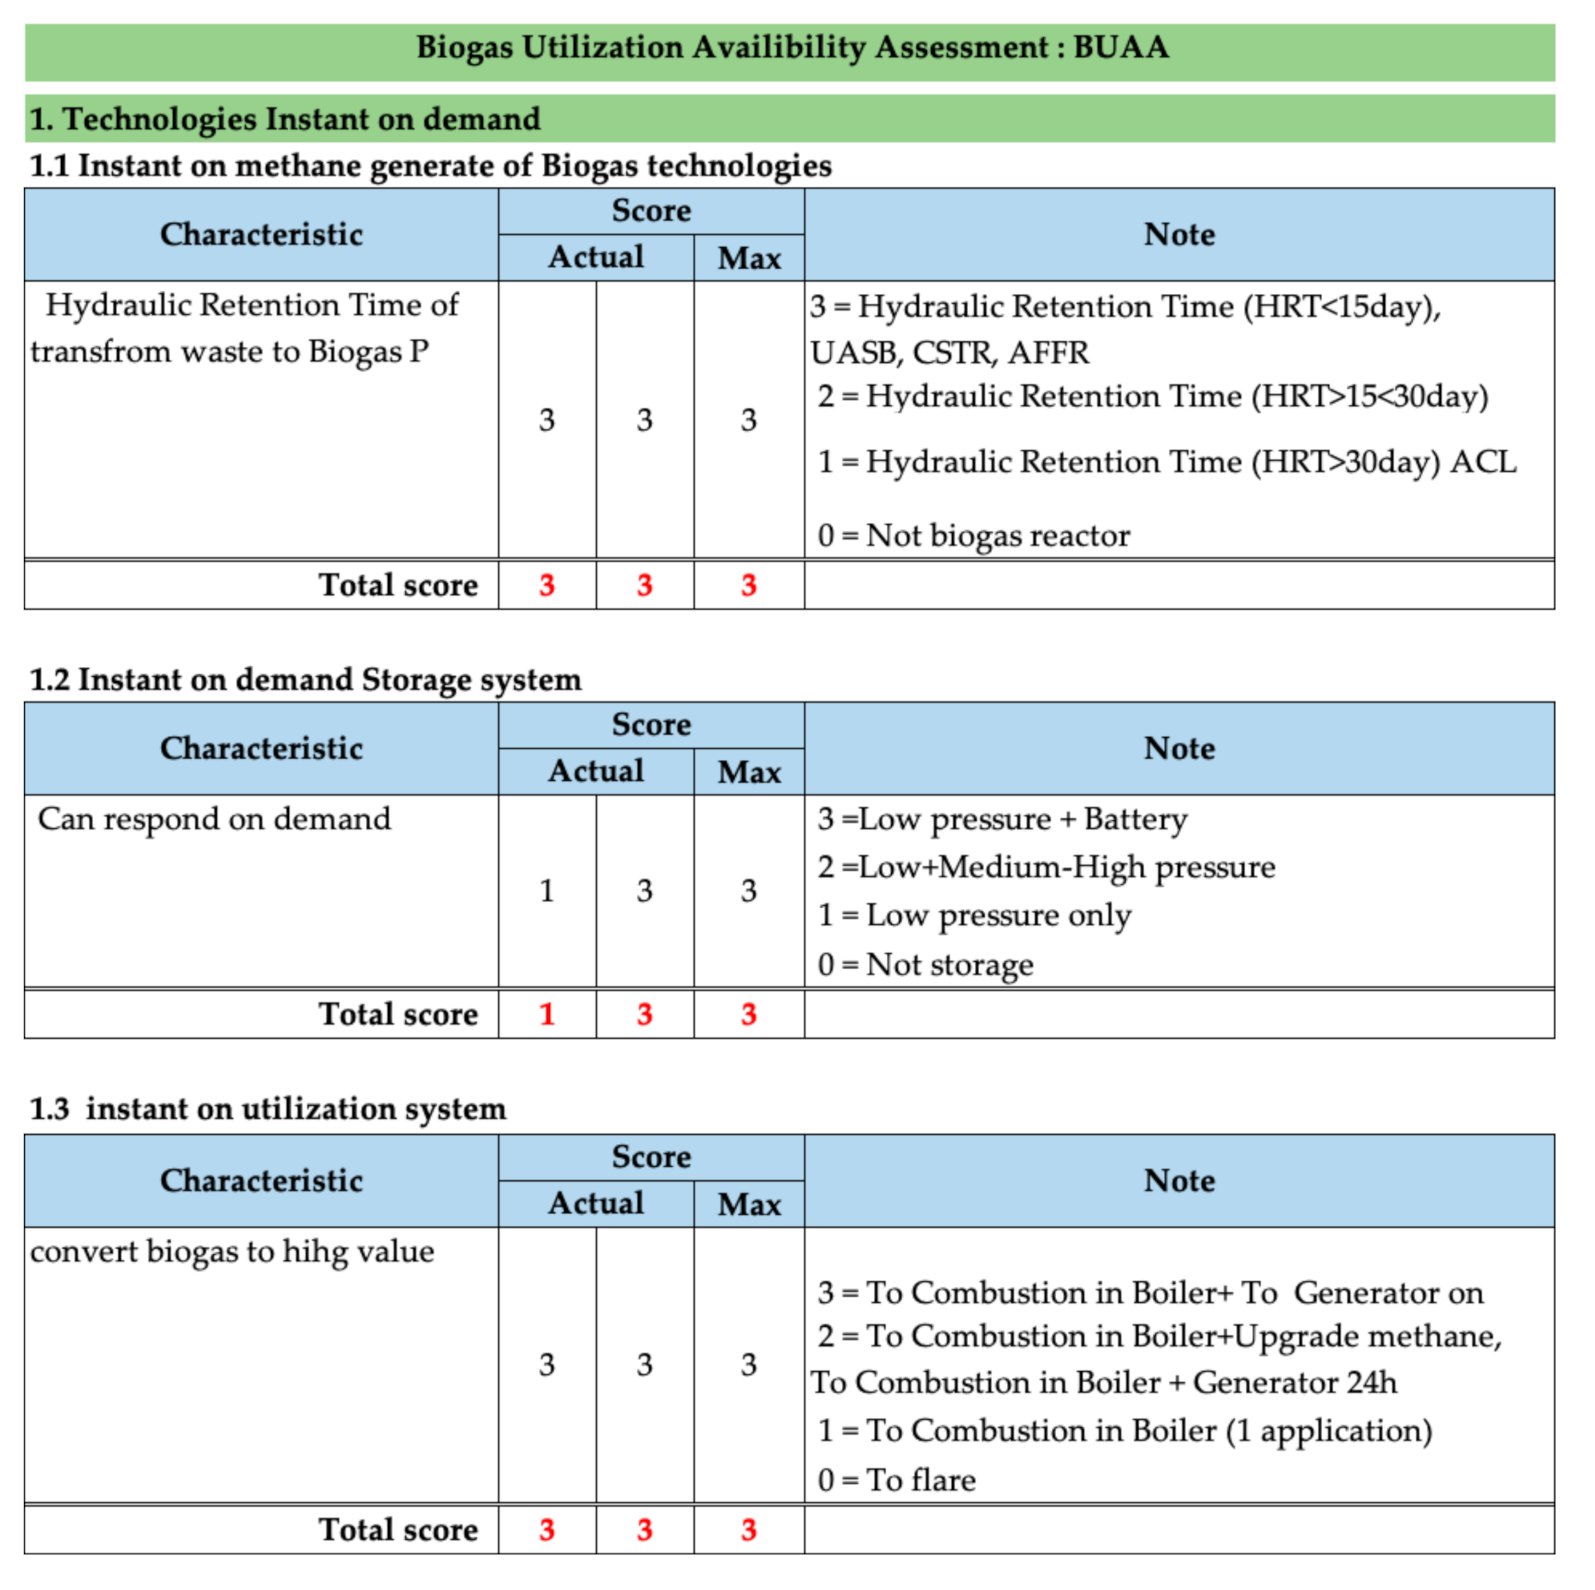
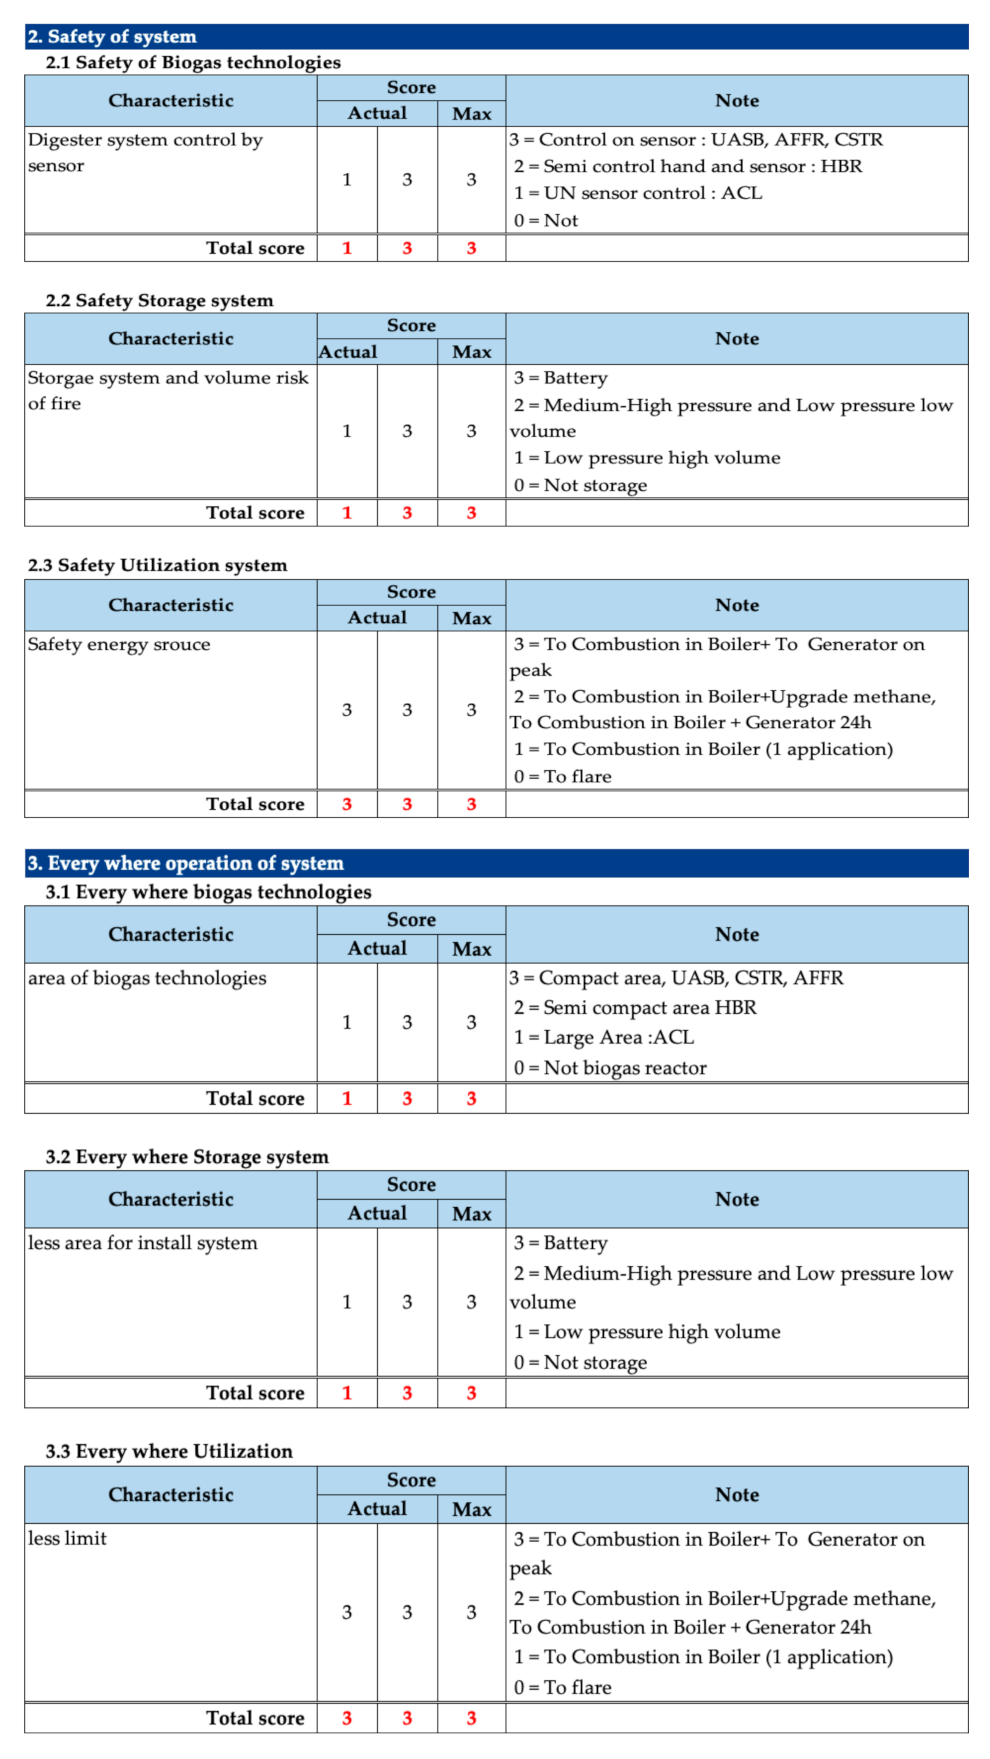
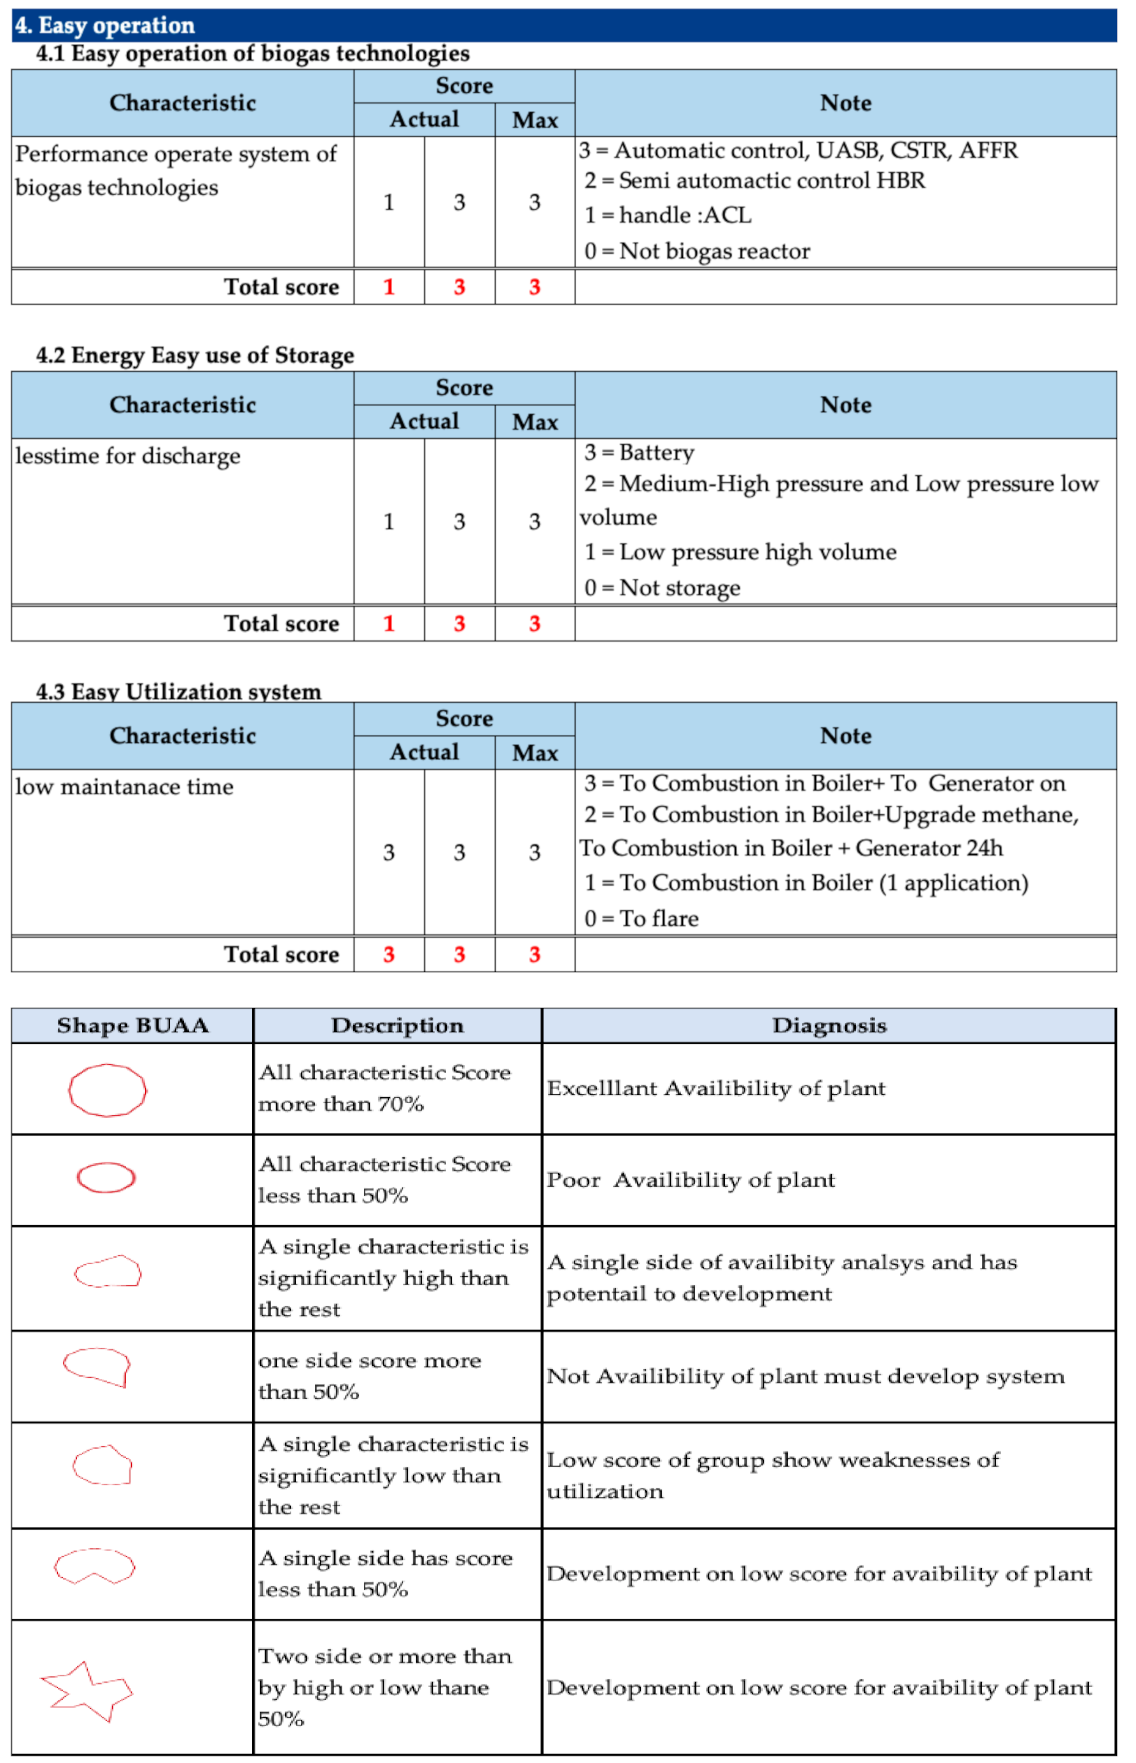
2. Materials and Methods
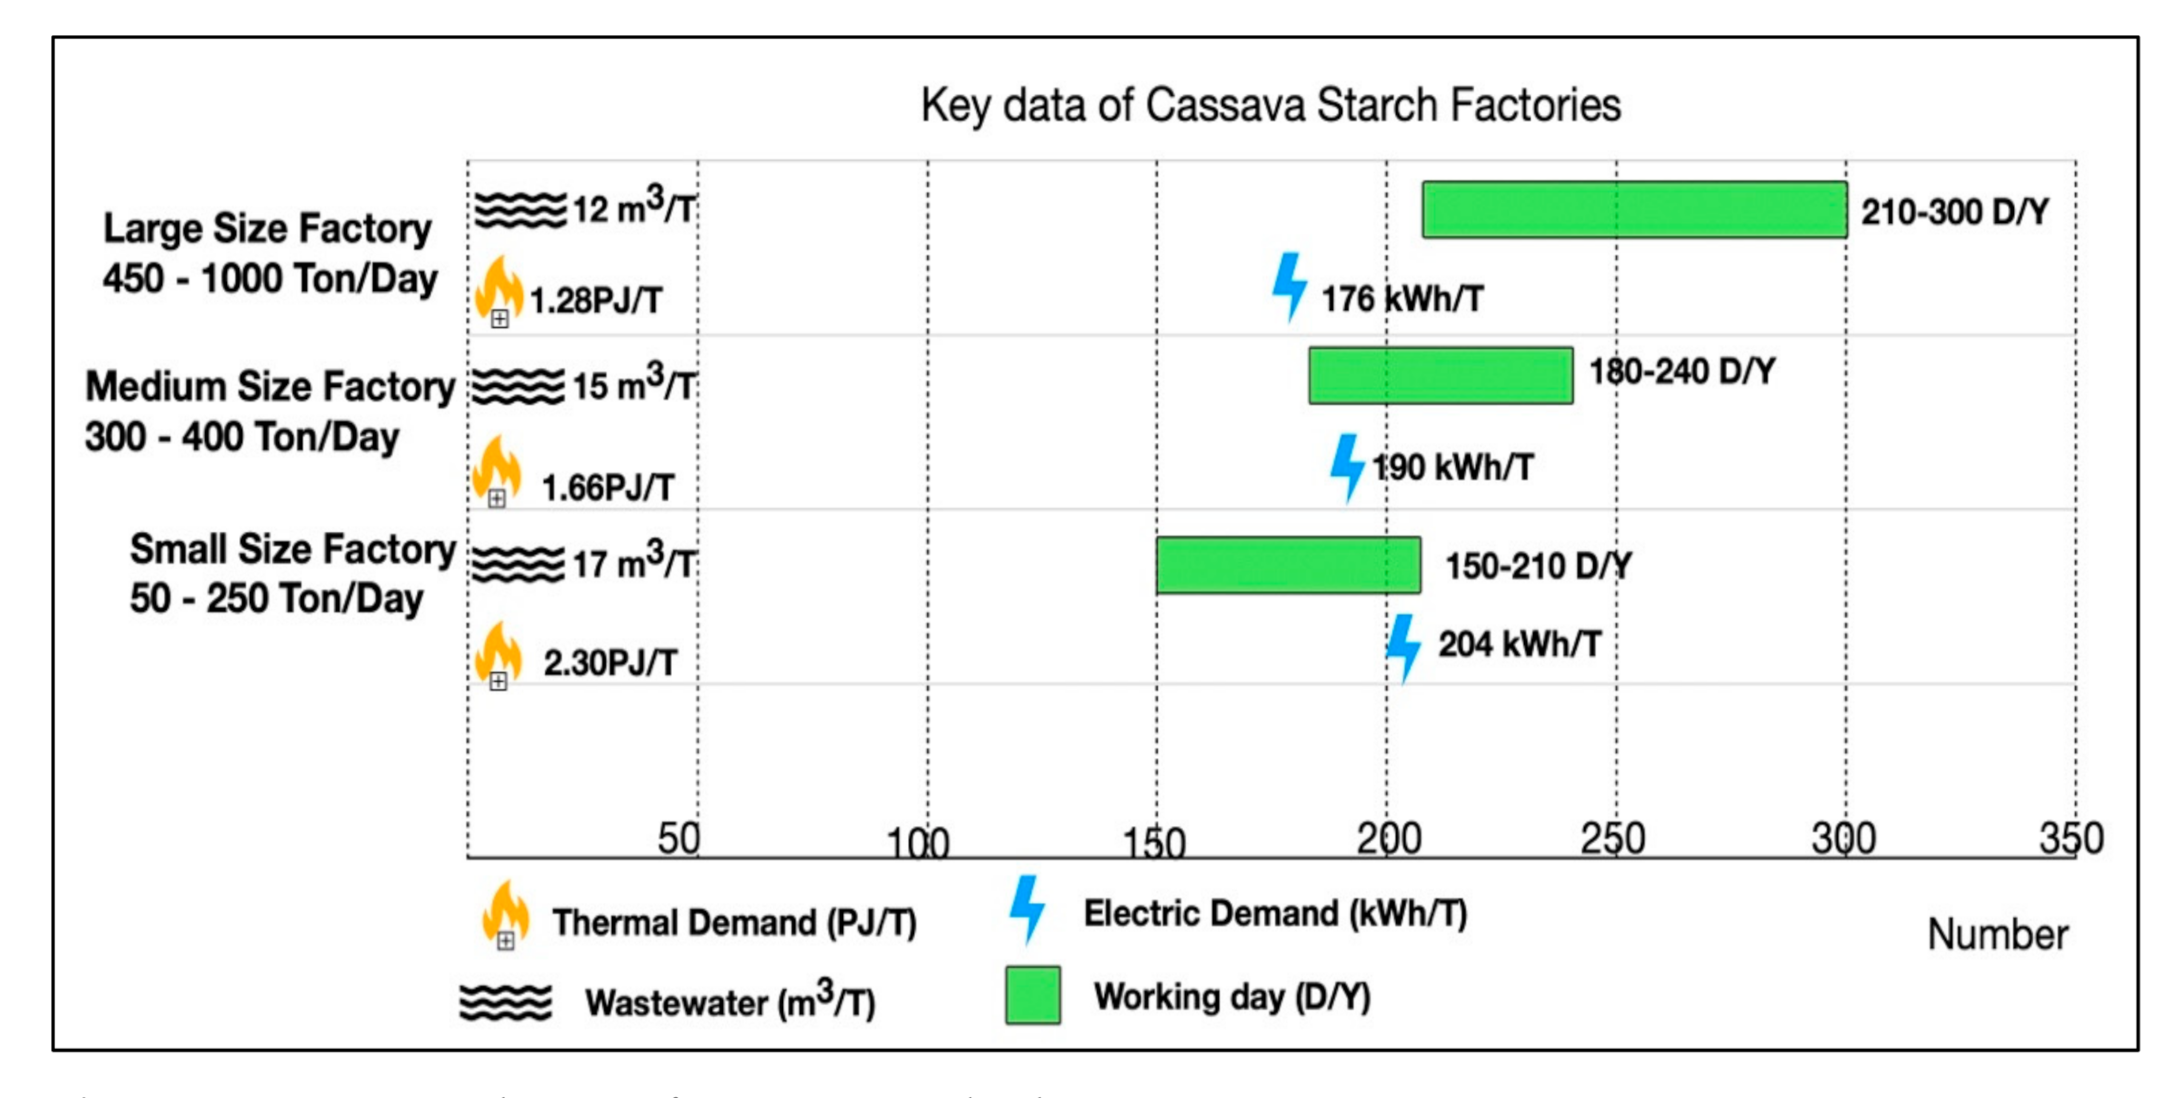
2.1. Cassava Starch Factory
2.2. Analysis of Biogas Production
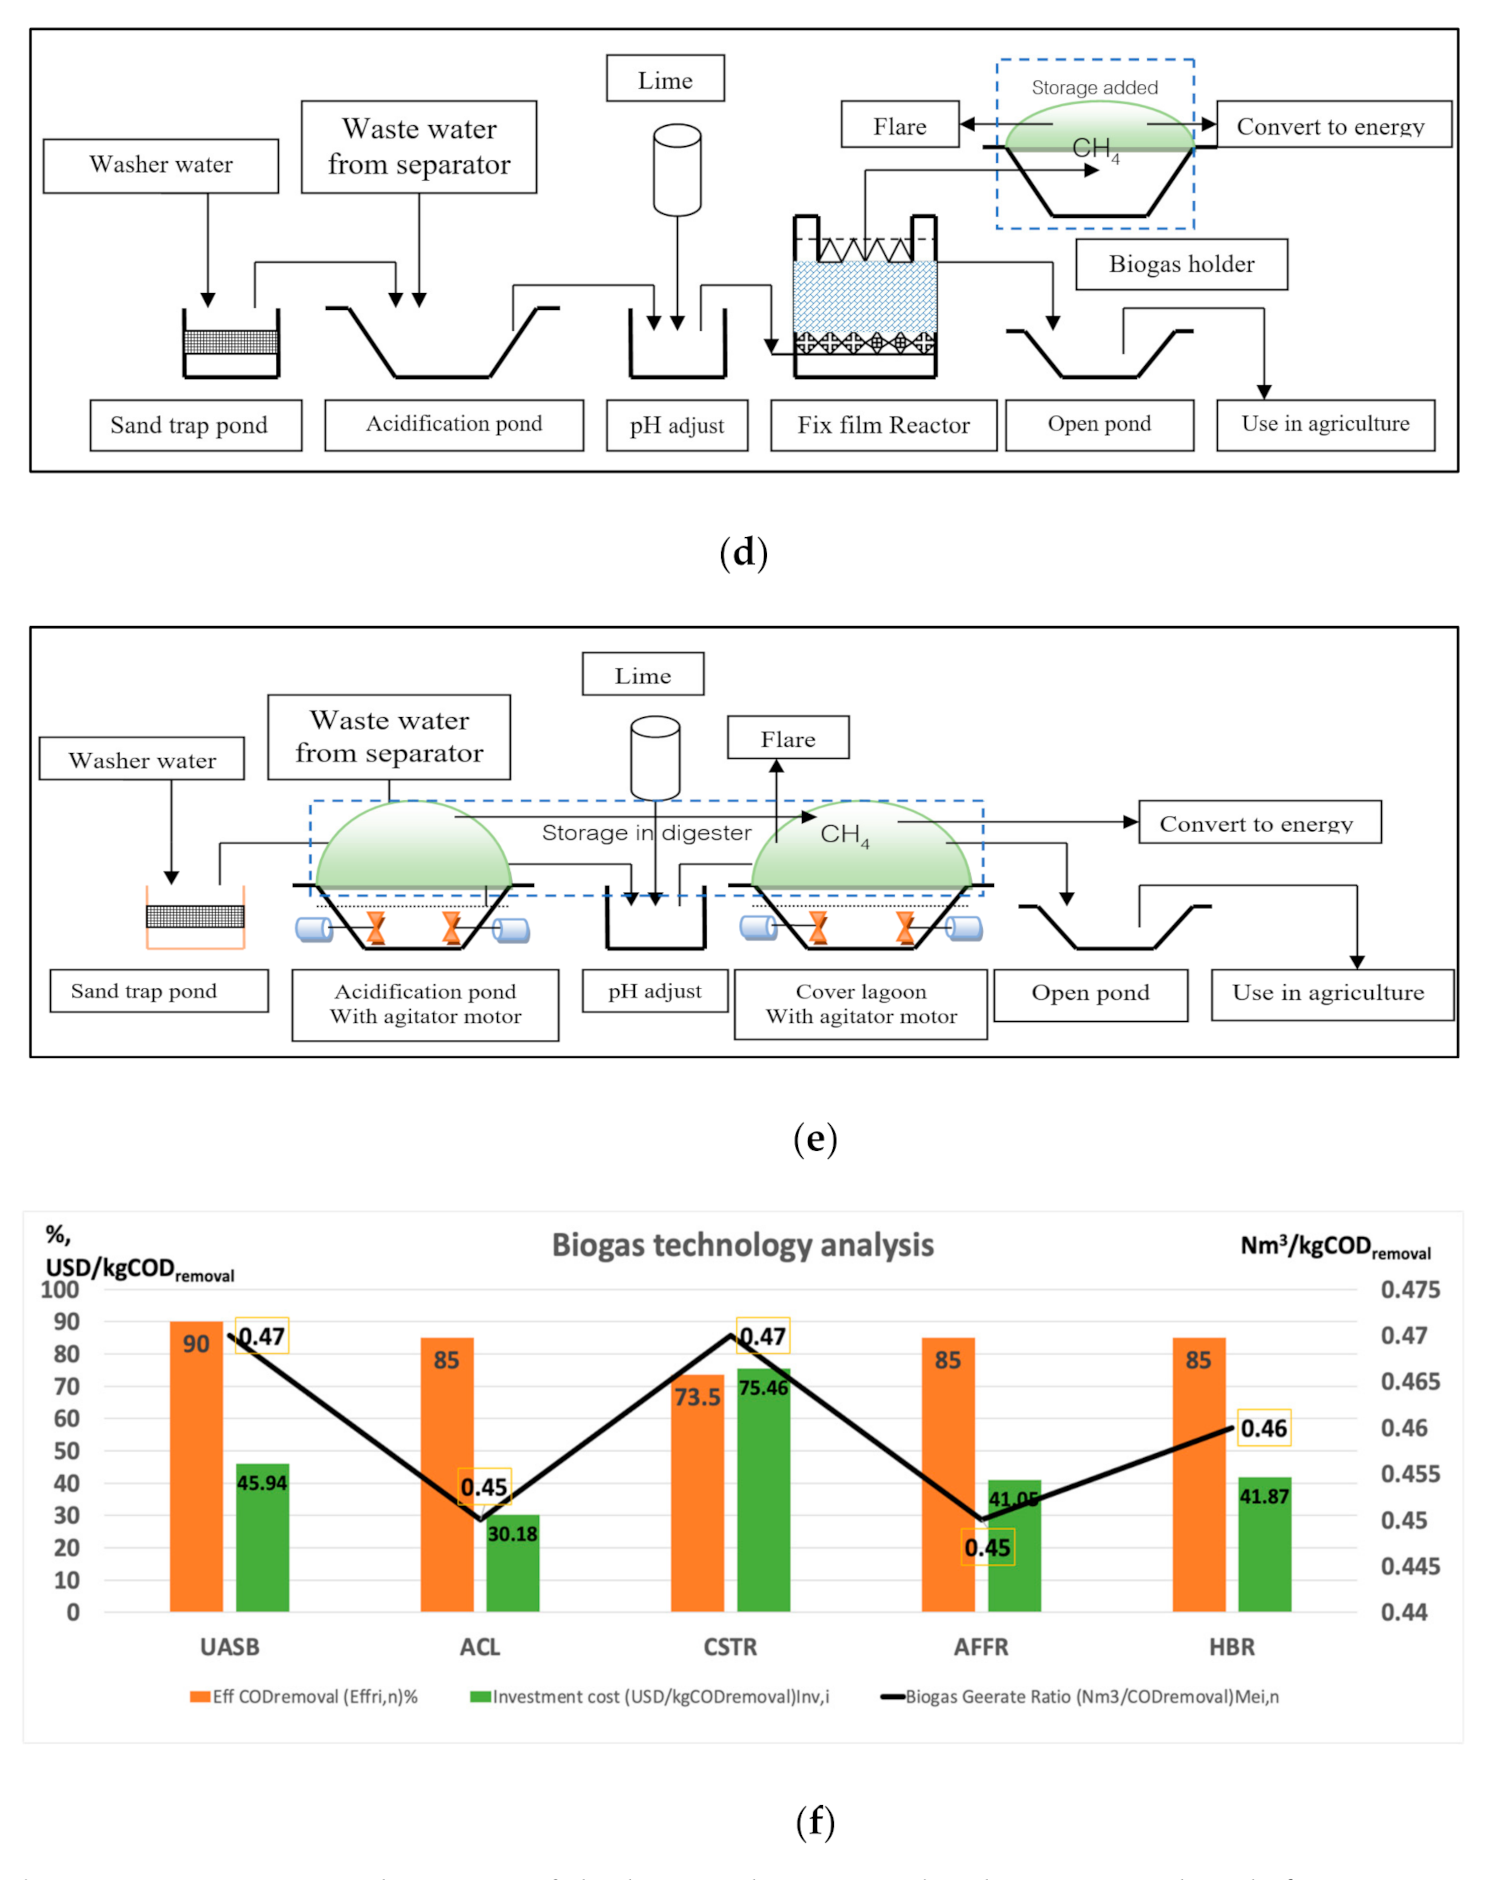
2.3. Biogas Production
Biogas System Investment Cost
2.4. Storing Biogas and Energy
2.4.1. Low-Pressure Storage: T1
2.4.2. Medium-Pressure Storage: T2
2.4.3. High-Pressure Storage Used for Compressed Biogas after Upgrading: T3
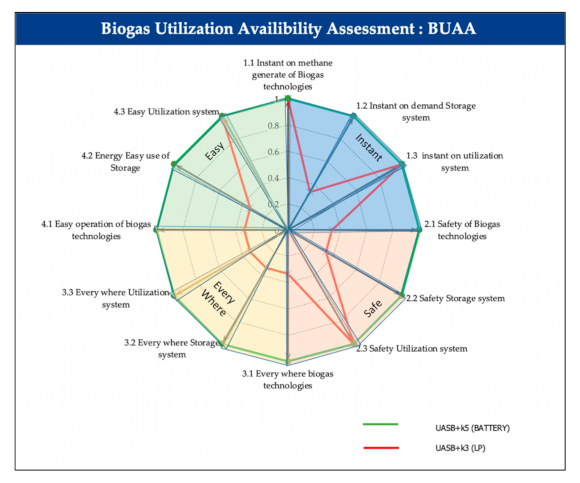
2.4.4. Battery Storage: T4
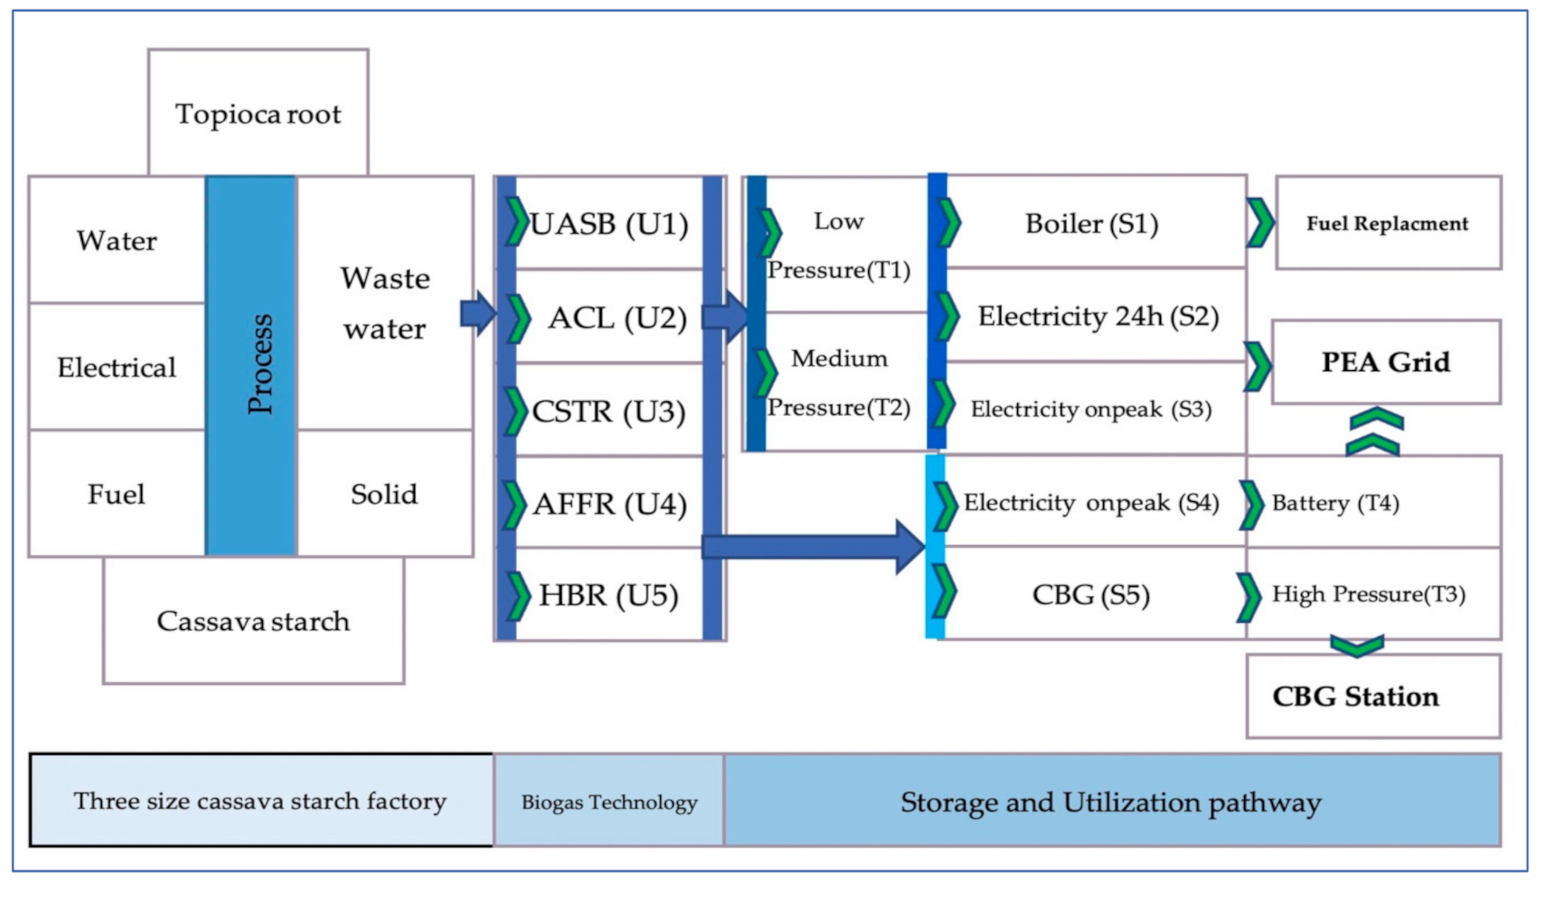
2.5. Gas Preparation and Biogas Utilization Pathway Analyses
2.5.1. Thermal Energy for Drying Process: S1
2.5.2. Electricity Generation via the Gas Engine to the Grid for the Whole Day: S2
2.5.3. Electricity Generation via the Gas Engine to the Grid during On-Peak Hours: S3
2.5.4. Electricity Generation via Gas Engine and Store in the Battery for On-Peak Period Selling: S4
2.5.5. Upgrading to Bio-Methane for Vehicle Fuel: S5
2.6. Mathematical Formulation
Objective Function
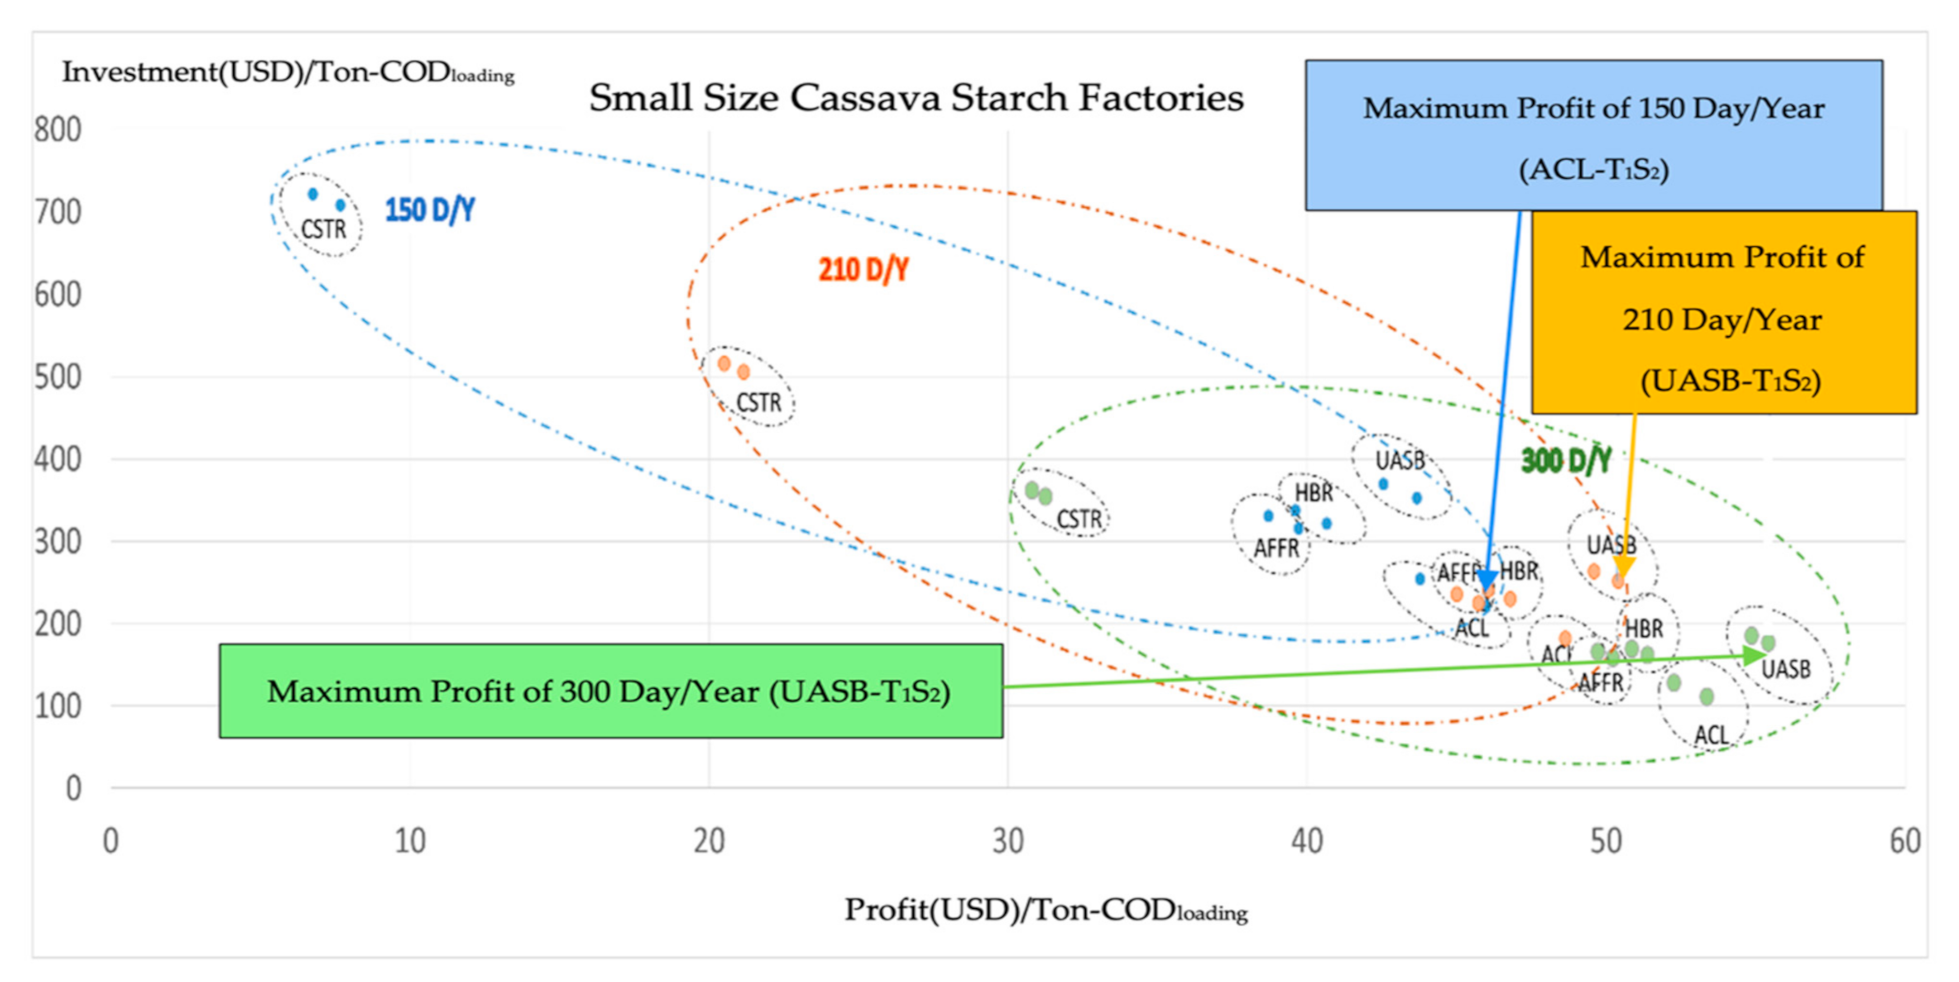
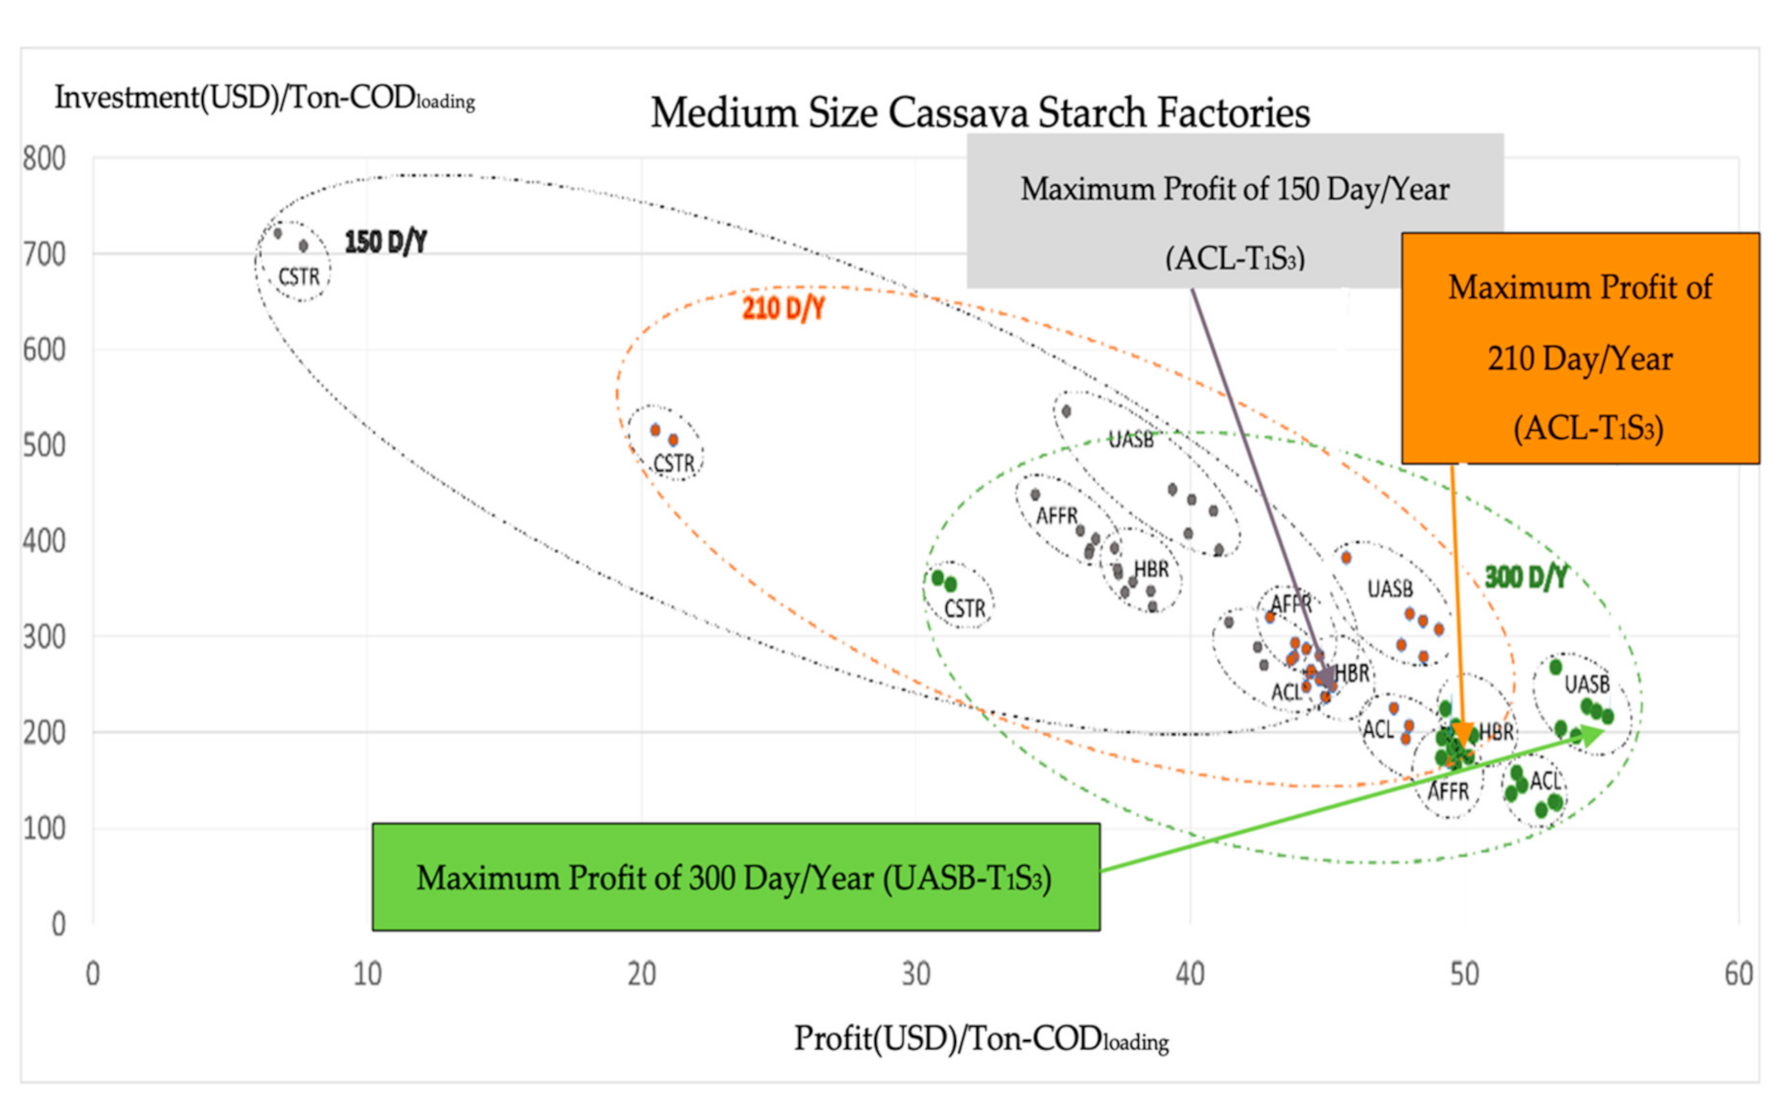
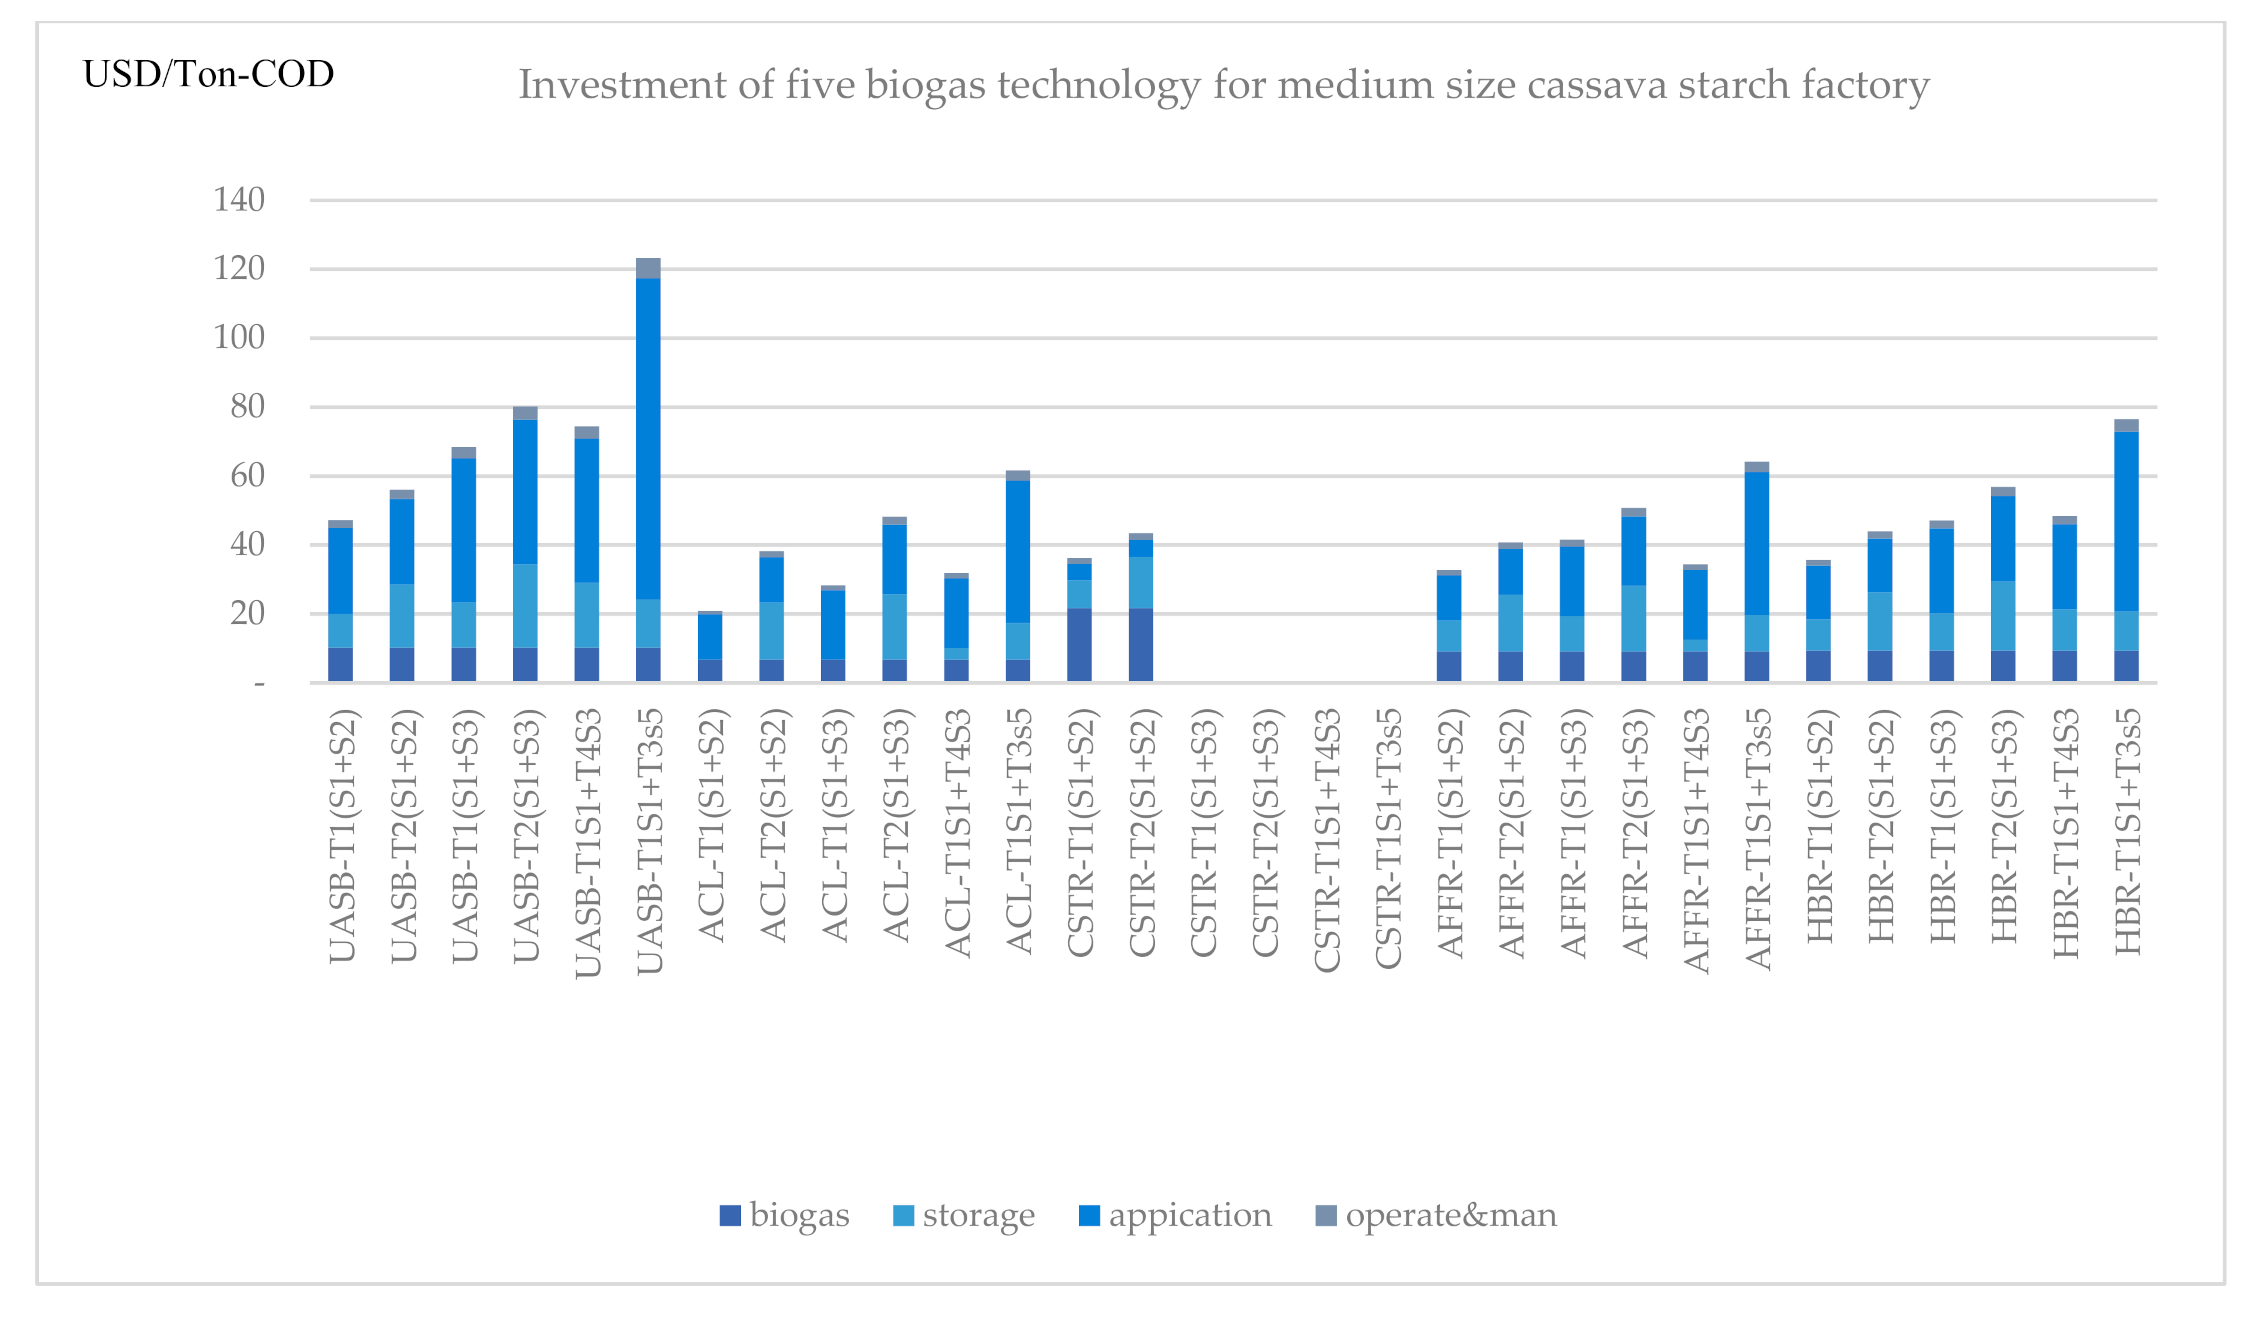
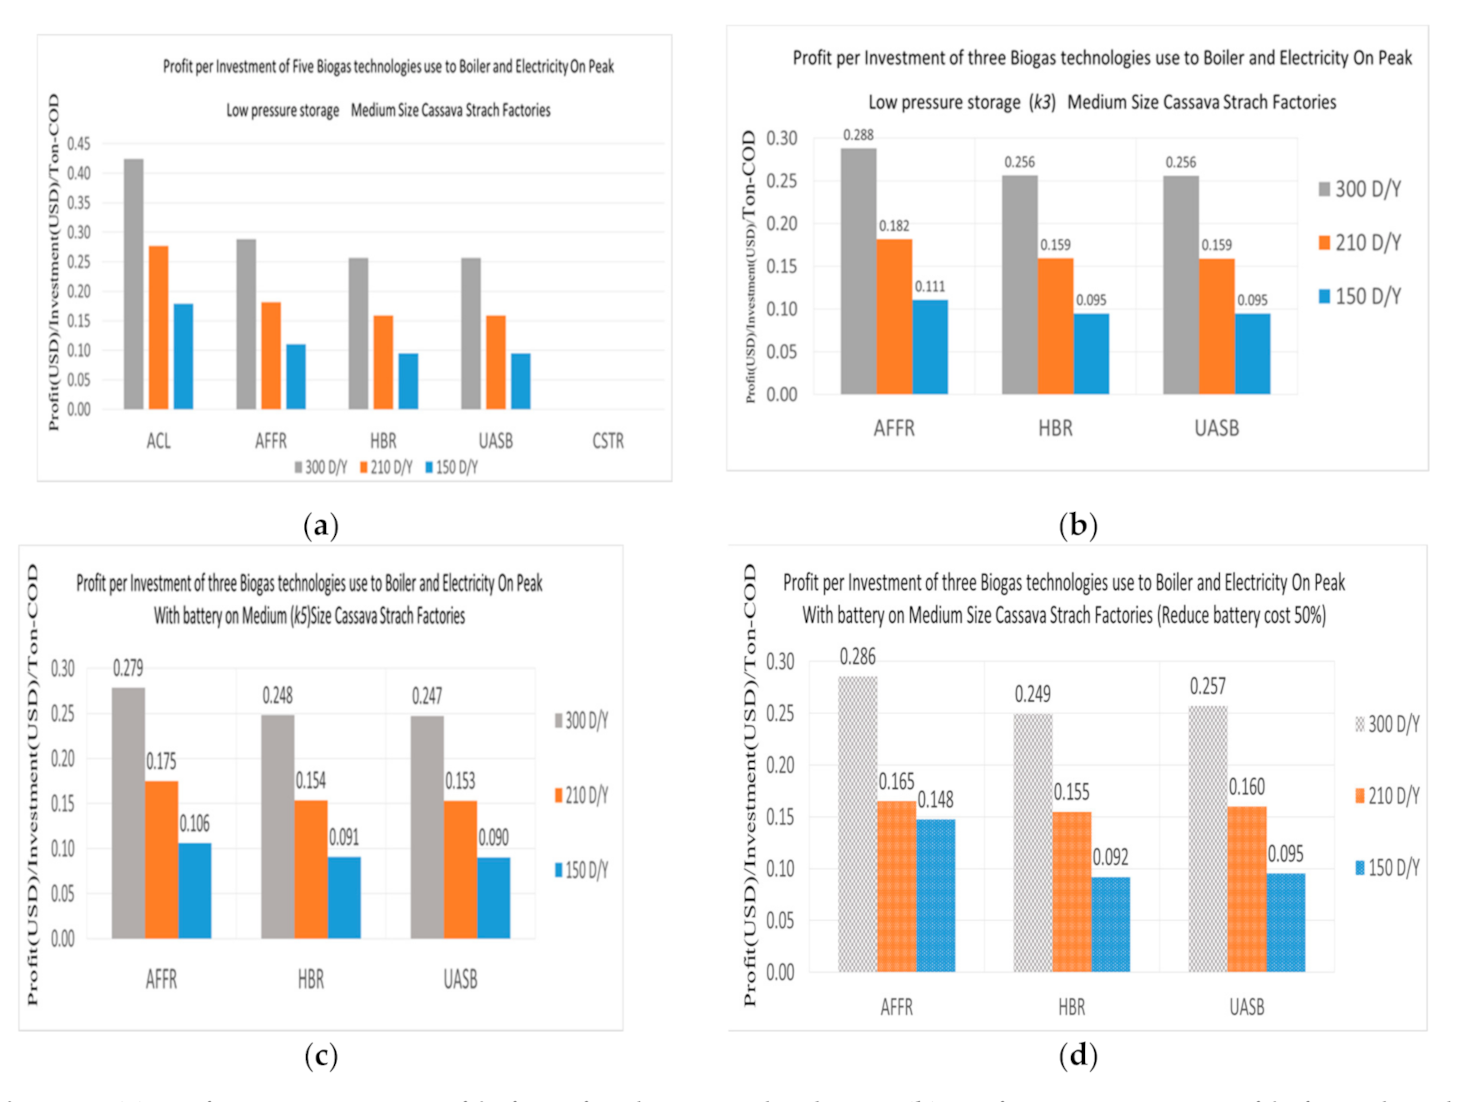
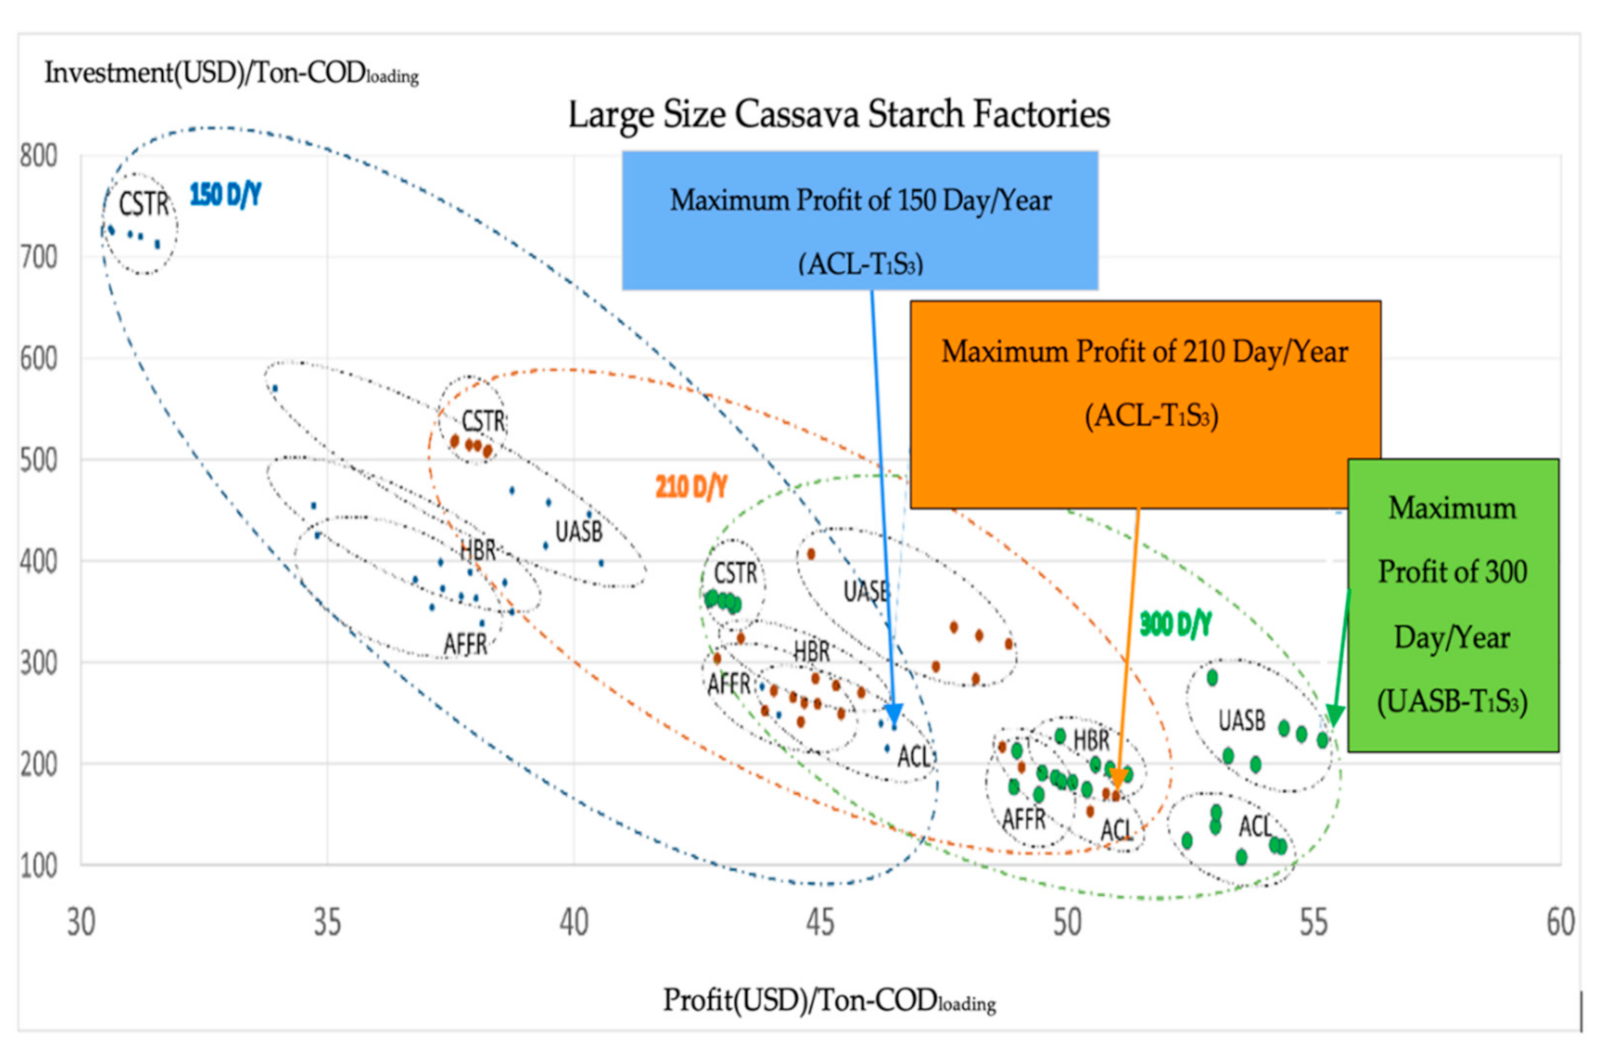
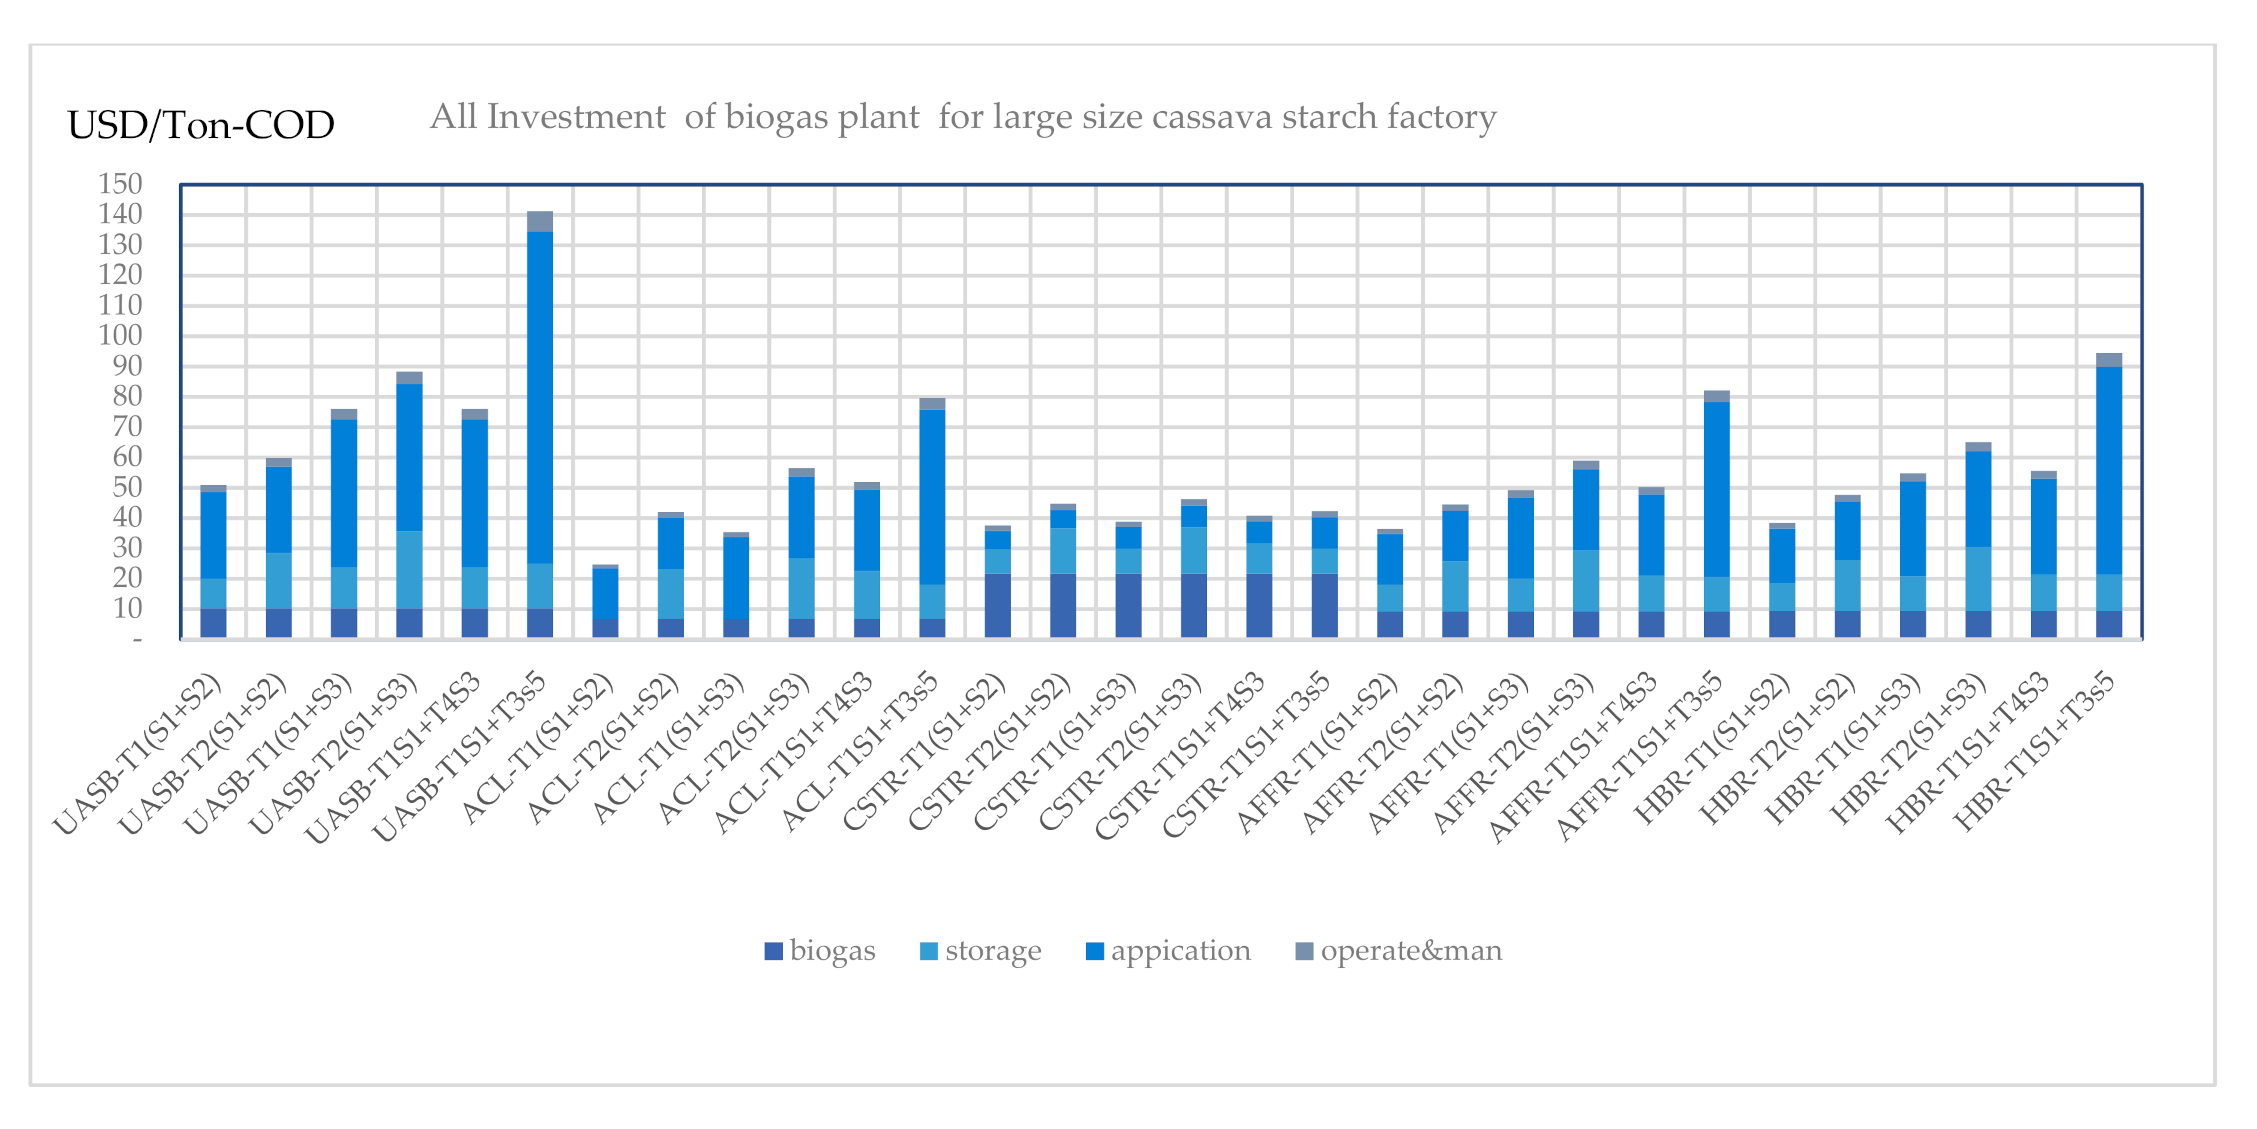
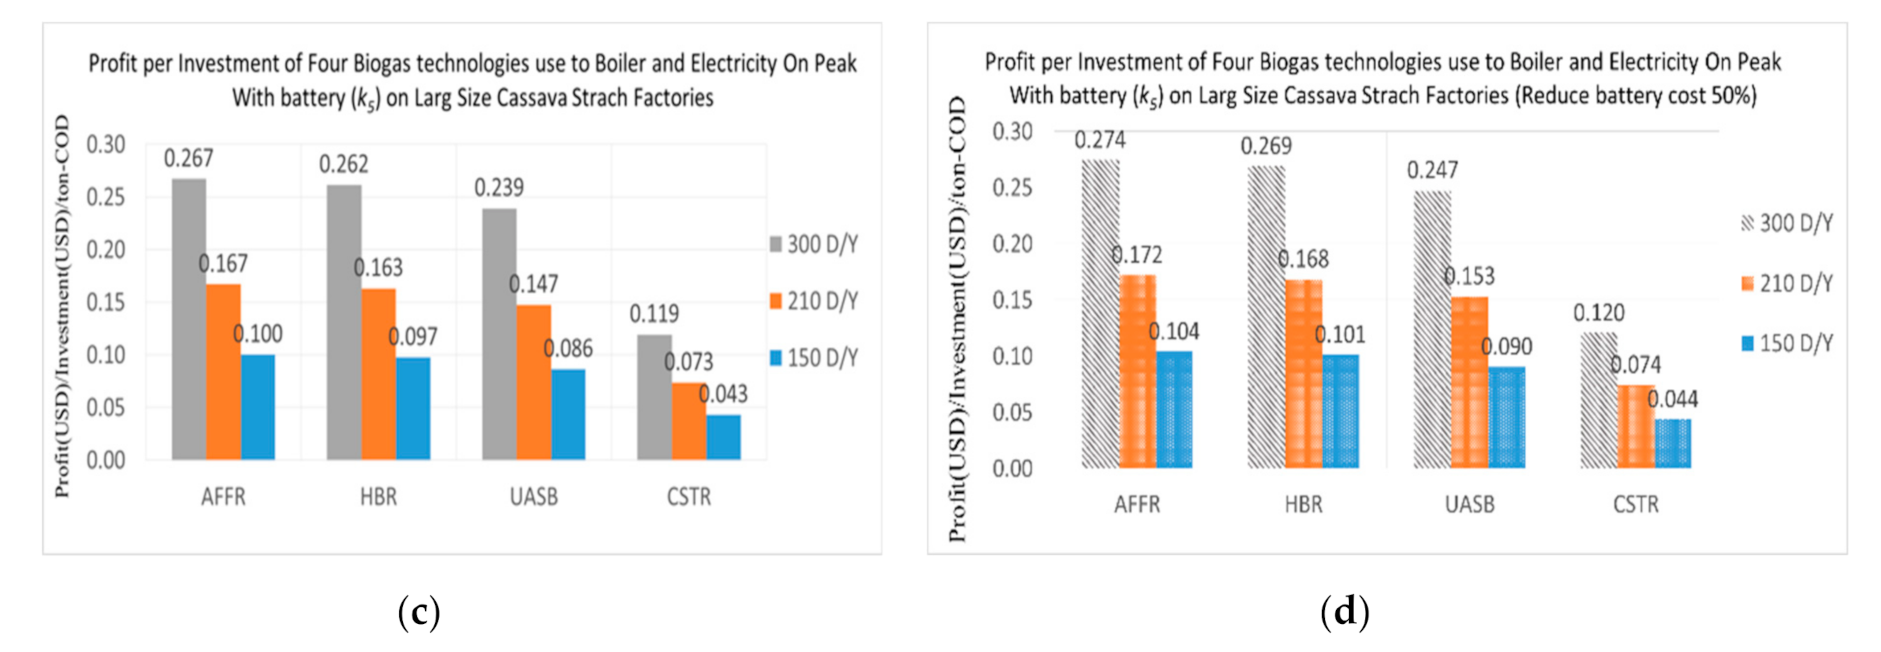
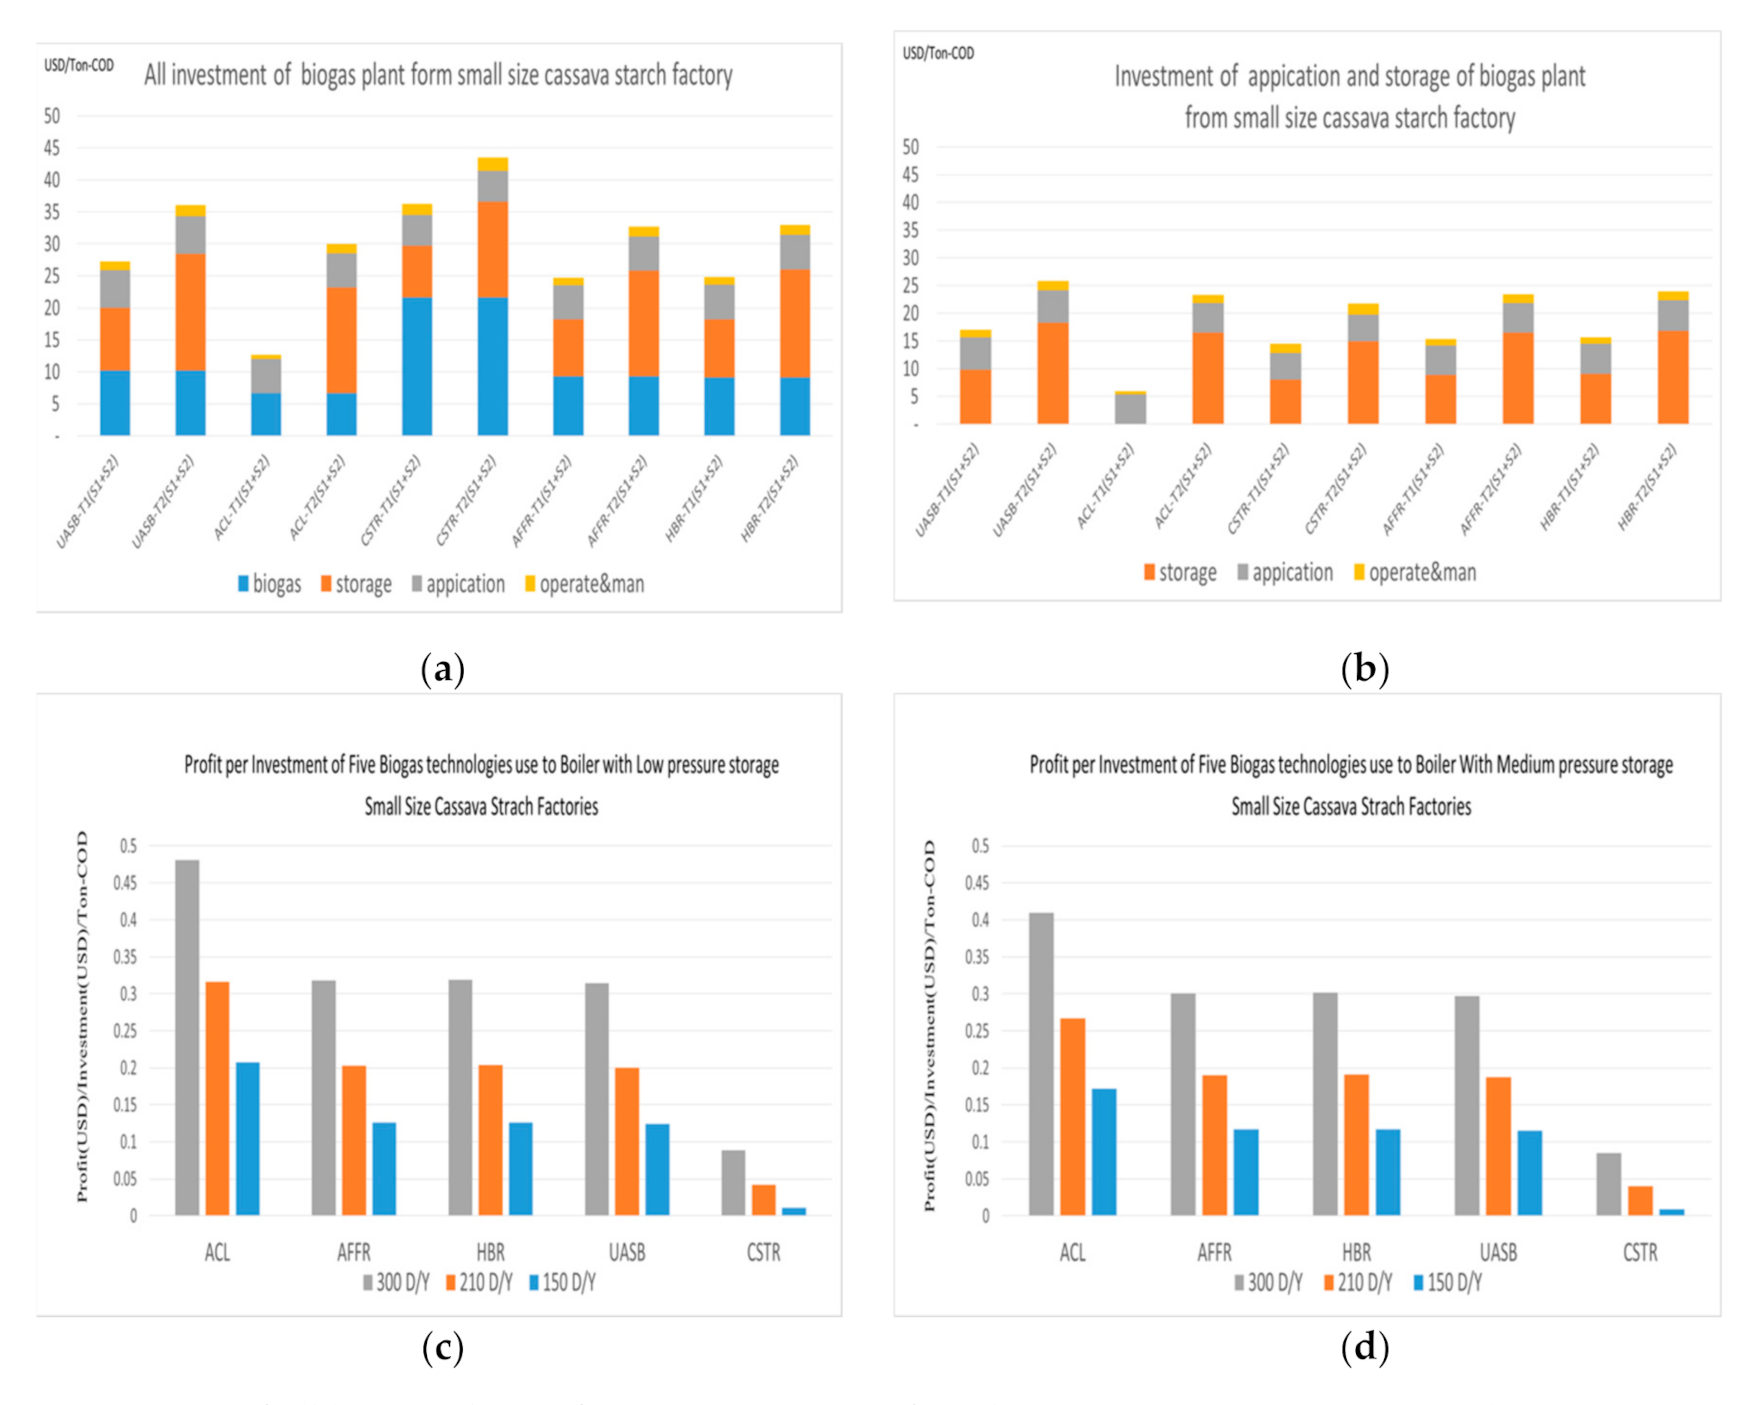
3. Results
4. Discussion
5. Conclusions
Author Contributions
Funding
Acknowledgments
Conflicts of Interest
Nomenclature
| Be | Ratio convert biogas to electricity about (2.185 kWh/Nm3) |
| Bri | Biogas produce from five biogas technologies (N-m3/mgCODremoval) |
| Bt | Ratio of converting electric energy to size of battery about (1 kWh/1.95 Ah) |
| BUc | Investment cost of biogas burner (USD/ N-m3/hour) |
| BUs | Size of biogas burner (N-m3/hour) |
| Capi,n | Capacity of biogas generated from five biogas technologies (N-m3/Year) |
| CB | Battery size (Ah) |
| Cn | Production capacity of cassava factory (Ton/Day) |
| CBi, n | Cost of biogas system (UASB, ACL, CSTR, AFFR, HBR) (USD/mgCODloading) |
| COD | Chemical oxygen demand fixed at approximately (15,000 mg/L) |
| CODloading n | COD Volume of wastewater load to the biogas digester (kgCOD/Day) |
| CODremoval i, n | COD Volume of wastewater removal of biogas digester (kgCOD/Day) |
| ConSk | Constant parameter convert biogas to energy (MJ/N-m3) |
| CT1, I | Investment cost of the low-pressure system (USD/N-m3) |
| CT2, I | Investment cost of the medium-pressure system (USD/N-m3) |
| CT3 | Investment cost of the high-pressure system (USD/N-m3) |
| CT4 | Investment cost of the battery storage system (USD/Ah) |
| Del | Biogas boiler demand of large size cassava factories (MJ/Ton) |
| Dem | Biogas boiler demand for medium size cassava factories (MJ/Ton) |
| Des | Biogas boiler demand of small size cassava factories (MJ/Ton) |
| Dn | Working days of cassava factory (Day/Year) |
| Ek = o | Ratio biogas convert to energy 1 Nm3 = 20.93 MJ/LHV heavy oil 39.77 (MJ/L) |
| Ek = 1.2.,.5 | Biogas 1 Nm3 = 2.185 (kWh/Year) |
| Ek=6 | Biogas 1 Nm3 = 0.552 (kgCBG/Year) |
| Effri, n | COD removal efficiency of five biogas technologies (%) |
| GPc | Generator cost for selling electricity only in on-peak periods (MW) |
| GPs | Generator size for selling electricity only in on-peak periods (MW) |
| GWc | Generator cost for selling electricity the whole day (MW) |
| GWs | Generator size for selling electricity the whole day (MW) |
| Hc | Hour continue of off-peak (Hour/Day) |
| Ho | Operating hours (Hour/Day) |
| Hoi, n | Operating hours per year (Hour/Year) |
| Hon | 65 h on peak per week (Hour/Week) |
| Hw | 24 h of whole day (Hour/Day) |
| Invi = 1 | Investment cost of UASB (USD) |
| Invi= 2 | Investment cost of ACL (USD) |
| Invi = 3 | Investment cost of CSTR (USD) |
| Invi = 4 | Investment cost of AFFR (USD) |
| Invi = 5 | Investment cost of HBR (USD) |
| invo | Investment cost of equipment ko scenario (USD) |
| invk = 1 | Investment cost of equipment k1 scenario (USD) |
| invk = 2 | Investment cost of equipment k2scenario (USD) |
| invk = 3 | Investment cost of equipment k3scenario (USD) |
| invk = 4 | Investment cost of equipment k5scenario (USD) |
| invk = 5 | Investment cost of equipment k5scenario (USD) |
| invk = 6 | Investment cost of equipment k6scenario (USD) |
| k0 | Scenario utilization pathway biogas to the boiler |
| k1 | Scenario utilization pathway biogas to the boiler with low-pressure storage and electricity the whole day with low-pressure storage |
| k2 | Scenario utilization pathway biogas to the boiler with low pressure and electricity a whole day with medium pressure storage |
| k3 | Scenario utilization pathway biogas to the boiler with low pressure and electricity on-peak periods with low-pressure storage |
| k4 | Scenario utilization pathway biogas to the boiler with low pressure and electricity on-peak periods with medium pressure storage |
| k5 | Scenario utilization pathway biogas to the boiler with low pressure and electricity on-peak periods with battery storage |
| k6 | Scenario utilization pathway biogas to the boiler with low pressure and upgrade biogas to compress biogas with a high-pressure storage |
| Mei, n | Ratio of methane generated per CODremoval (N-m3/mgCODremoval) |
| P0 | Price of biogas converted to the boiler (USD) |
| Pk = 1,2 | Price of biogas converted to electricity whole day (USD/kWh) |
| Pk = 3,4,5 | Price of biogas converted to electricity on peak (USD/kWh) |
| Pk = 6 | Price of biogas converted to CBG (USD/kg) |
| Pc | 7 bar pressure compress (Bar) |
| S1 | Use biogas to boiler |
| S2 | Use biogas to electricity the whole day |
| S3 | Use biogas to electricity on-peak period |
| S4 | Use biogas to electricity on-peak period with battery storage |
| S5 | Use biogas to upgrade CBG |
| T1, i | Size of low-pressure storage (N-m3) |
| T2, i | Size of medium pressure storage (N-m3) |
| T3, | Size of high-pressure storage (N-m3) |
| T4 | Size of battery storage (Ah) |
| Vi, n | Volume of biogas generated per hour from five biogas technologies (N-m3/h) |
| Vk | Volume of biogas from five technologies (N-m3/Day) |
| Wn | Consumption of wastewater per ton of production (m3/Ton) |
Appendix A
References
- Annual Report 2015 EPPO, Energy Policy and Planning Office (EPPO). Available online: http://www.eppo.go.th/images/Infromation_service/EppoAnnualReport/EPPOAnnualReport2015.pdf (accessed on 2 March 2016).
- Tran, T.; Da, G.; Moreno-Santander, M.A.; Velez-Hernandez, G.A.; Giraldo-Toro, A.; Piyachomkwan, K.; Sriroth, K.; Dufour, D. A comparison of energy use, water use and carbon footprint of cassava starch production in Thailand, Vietnam and Colombia, Resources. Conserv. Recycl. 2015, 100, 31–40. [Google Scholar]
- Chavalparit, O.; Ongwandee, M. Clean technology for the tapioca starch industry in Thailand. J. Clean. Prod. 2009, 17, 105–110. [Google Scholar]
- Anyanwu, C.N.; Ibeto, C.N.; Ezeoha, S.L.; Ogbuagu, N.J. Sustainability of cassava (Manihot esculenta Crantz) as industrial feedstock, energy and food crop in Nigeria. Renew. Energy 2015, 81, 745–752. [Google Scholar]
- Ghimire, A.; Sen, R.; Annachhatre, A.P. Biosolid management option in Cassava Starch Industries of Thailand: Present practice and future possibilities. Procedia Chem. 2015, 14, 66–75. [Google Scholar]
- Lu, X.; Zhen, G.; Estrada, A.L.; Chen, M.; Ni, J.; Hojo, T.; Kubota, K.; Li, Y.Y. Operation performance and granule characterization of up-flow anaerobic sludge blanket (UASB) reactor treating wastewater with starch as the sole carbon source. Bioresour. Technol. 2015, 180, 264–273. [Google Scholar]
- Phowan, P.; Danvirutai, P. Hydrogen production from cassava pulp hydrolysate by mixed seed cultures: Effect of initial pH, substrate and biomass concentrations. Biomass Bioenergy 2014, 64, 1–10. [Google Scholar]
- Cavaleiro, A.J.; Alves, M.M.; Mota, M. Microbial and the operational response of an anaerobic fixed bed digester to oleic acid overloads. Process. Biochem. 2001, 37, 387–394. [Google Scholar]
- Stergaard, P.A. Comparing electricity, heat and biogas storage impacts on renewable energy integration. Energy 2012, 37, 255–262. [Google Scholar]
- Guan, C.; Loo, L.S.; Wang, K.; Yang, C. Methane storage in carbon pellets prepared via a binderless method. Energy Convers. Manag. 2011, 52, 1258–1262. [Google Scholar]
- Lozano-Castello, D.; Alcaniz-Monge, J.; de la Casa-Lillo, M.A.; Cazorla-Amoros, D.; Linares-Solano, A. Advance in the study of methane storage in porous carbonaceous materials. Fuel 2002, 81, 1777–1803. [Google Scholar]
- Kapdi, S.S.; Vijay, V.K.; Rajesh, S.K.; Prasad, R. Biogas scrubbing, compression and storage: Perspective and prospectus in the Indian context. Renew. Energy 2005, 30, 1195–1202. [Google Scholar]
- Rios, R.B.; Bastos-Neto, M.; Marcelo, R.A., Jr.; Eurico, A.; Torres, B. Experimental analysis of the efficiency on charge/discharge cycle in natural gas storage by adsorption. Fuel 2011, 90, 113–119. [Google Scholar]
- Osorio, F.; Torres, J.C. Biogas purification from anaerobic digestion in a wastewater treatment plant for biofuel production. Renew. Energy 2009, 34, 2164–2171. [Google Scholar]
- Pipatmanomai, S.; Kaewluan, S.; Vitidsant, T. Economic assessment of biogas-to-electricity generation system with H2S removal by activated carbon in a small pig farm. Appl. Energy 2009, 86, 669–674. [Google Scholar]
- Waewsak, C.; Nopharatana, A.; Chaiprasert, P. Neural-fuzzy control system application for monitoring process response and control of anaerobic hybrid reactor in wastewater treatment and biogas production. J. Environ. Sci. 2010, 22, 1883–1890. [Google Scholar]
- Ferreira, G.D.; Bretas, A.S. A non-linear binary program model for electric distribution system reliability optimization. Electr. Power Energy Syst. 2012, 43, 384–392. [Google Scholar]
- Sharma, S.; Rangaiah, G.P.; Cheah, K.S. Multi-objective optimization using MS Excel with an application to design of a falling-film evaporator system. Food Bioprod. Process. 2012, 90, 123–134. [Google Scholar]
- Albernas-Carvajal, Y.; Corsano, G.; Kafarov, V.V.; Cortés, M.G.; Suárez, E.G. Optimal design of pre-fermentation and fermentation stage applying non-linear programming. Energy Convers. Manag. 2014, 87, 1195–1201. [Google Scholar]
- De Jong, Y. Gas storage valuation and optimization. J. Nat. Gas. Sci. Eng. 2015, 24, 365–378. [Google Scholar]
- Upadhyay, S.; Sharma, M.P. Development of the hybrid energy system with cycle charging strategy using particle swarm optimization for a remote area in India. Renew. Energy 2015, 77, 586–598. [Google Scholar]
- Johnston, L.; Diaz-Gonzalez, F.; Gomis-Bellmunt, O.; Corchero-Garcia, C.; Cruz-Zambrano, M. Methodology for the economic optimization of energy storage systems for frequency support in wind power plants. Appl. Energy 2015, 137, 660–669. [Google Scholar]
- Mudasser, M.; Yiridoe, E.K.; Corscadden, K. Cost-benefit analysis of grid-connect wind-biogas hybrid energy production, by turbine capacity and site. Renew. Energy 2015, 80, 573–582. [Google Scholar]
- Dominkovic, D.F.; Cosic, B.; Medic, Z.B.; Duic, N. A hybrid optimization model of biomass trigeneration system combined with pit thermal energy storage. Energy Conserv. Manag. 2015, 104, 90–99. [Google Scholar]
- Amiryar, M.E.; Pullen, K.R. Assessment of the carbon and cost savings of a combined diesel generator, solar photovoltaic, and flywheel energy storage islanded grid system. Energies 2019, 12, 3356–3371. [Google Scholar]


| No. | Utilization Pathway | Description | Storage | Model |
|---|---|---|---|---|
| 1 | k0 | Use biogas to the boiler | Low-pressure | T1S1 |
| 2 | k1 | Use biogas to electricity the whole day if Vk > De | Low-pressure | T1S2 |
| 3 | k2 | Use biogas to electricity the whole day if Vk > De | Medium-pressure | T2S2 |
| 4 | k3 | Use biogas to electricity on-peak periods if Vk > De | Low-pressure | T1S3 |
| 5 | k4 | Use biogas to electricity on-peak periods if Vk > De | Medium-pressure | T2S3 |
| 6 | k5 | Use biogas to electricity on-peak periods if Vk > De | Battery | T4S4 |
| 7 | k6 | Use to upgrade CBG if Vk > De | High-pressure | T3S5 |
Publisher’s Note: MDPI stays neutral with regard to jurisdictional claims in published maps and institutional affiliations. |
© 2021 by the authors. Licensee MDPI, Basel, Switzerland. This article is an open access article distributed under the terms and conditions of the Creative Commons Attribution (CC BY) license (http://creativecommons.org/licenses/by/4.0/).
Share and Cite
Wattanasilp, C.; Songprakorp, R.; Nopharatana, A.; Khompatraporn, C. Techno-Cost-Benefit Analysis of Biogas Production from Industrial Cassava Starch Wastewater in Thailand for Optimal Utilization with Energy Storage. Energies 2021, 14, 416. https://doi.org/10.3390/en14020416
Wattanasilp C, Songprakorp R, Nopharatana A, Khompatraporn C. Techno-Cost-Benefit Analysis of Biogas Production from Industrial Cassava Starch Wastewater in Thailand for Optimal Utilization with Energy Storage. Energies. 2021; 14(2):416. https://doi.org/10.3390/en14020416
Chicago/Turabian StyleWattanasilp, Chatree, Roongrojana Songprakorp, Annop Nopharatana, and Charoenchai Khompatraporn. 2021. "Techno-Cost-Benefit Analysis of Biogas Production from Industrial Cassava Starch Wastewater in Thailand for Optimal Utilization with Energy Storage" Energies 14, no. 2: 416. https://doi.org/10.3390/en14020416
APA StyleWattanasilp, C., Songprakorp, R., Nopharatana, A., & Khompatraporn, C. (2021). Techno-Cost-Benefit Analysis of Biogas Production from Industrial Cassava Starch Wastewater in Thailand for Optimal Utilization with Energy Storage. Energies, 14(2), 416. https://doi.org/10.3390/en14020416