Article

Evaluation of the Worldwide Wave Energy Distribution Based on ERA5 Data and Altimeter Measurements

Department of Mechanical Engineering, Faculty of Engineering, ‘Dunarea de Jos’ University of Galati, 47 Domneasca St., 800 008 Galati, Romania
*
Author to whom correspondence should be addressed.
Energies 2021, 14(2), 394; https://doi.org/10.3390/en14020394
Submission received: 7 December 2020 / Revised: 3 January 2021 / Accepted: 9 January 2021 / Published: 12 January 2021
(This article belongs to the Special Issue Advances and Challenges in Harvesting Ocean Energy)

Abstract

:
There is an increasing necessity in reducing CO2 emissions and implementing clean energy technologies, and over the years the marine environment has shown a huge potential in terms of renewable energy. From this perspective, extracting marine renewable energy represents one of the most important technological challenges of the 21st century. In this context, the objective of the present work is to provide a new and comprehensive understanding concerning the global wave energy resources based on the most recent results coming from two different databases, ERA5 and the European Space Agency Climate Change Initiative for Sea State. In this study, an analysis was first made based only on the ERA5 data and concerns the 30-year period of 1989–2018. The mean wave power, defined as the energy flux per unit of wave-crest length, was evaluated at this step. Besides the spatial distribution of this parameter, its seasonal, inter, and mean annual variability was also assessed on a global scale. As a second step, the mean wave energy density per unit horizontal area was analyzed for a 27-year period (1992–2018) with both ERA5 and the satellite data from the European Space Agency being considered. The comparison indicates a relatively good concordance between the results provided by the two databases in terms of mean wave energy density, although the satellite data indicate slightly higher energy values.

1. Introduction

At present, there is an increased interest to add more renewable energy resources to the energy systems in order to maintain the target that was established in 2015 by the United Nations Framework Convention for Climate Change, the Paris Climate Agreement [1], to limit global warming below 2 °C. A recent study made by the International Renewable Energy Agency (IRENA), based on data provided by previous reports, indicates that the CO2 emissions have increased by 1% per year in the last decade [2]. On the other hand, the analysis made by the International Energy Agency (IEA) regarding the effect of the Covid-19 pandemic on the energy sector shows that the disruptions caused by this pandemic are greater than anything encountered in the recent history [3]. The data analysis regarding the energy demand in the first quarter of 2020 indicates a decrease of about 3.9% compared to the same period of the last year. This is caused especially by the reduced economic activity and mobility.
An updated assessment of the IEA shows also a reduction of energy-related CO2 emissions by 7%. Not all the fuels are equally affected, and surprisingly, compared to the general trend, a slight rise in the contribution of renewables is estimated. Today, two scenarios are modeled by the IEA. The first one is based on the assumption to control the pandemic situation in 2021 and the economy to return quickly to the pre-crisis levels. Under these conditions, the global energy demand is expected to return in early 2023. The pessimistic scenario estimates a two-year delay compared with the first scenario. However, the pandemic aftermath in the economic sector will not produce a decisive break of the CO2 emissions to change the trend of emissions, and for this reason, the deployment of clean energy technologies must continue. Various studies suggest also that the price performance of clean energy compared with conventional fossil fuel in this pandemic crisis can accelerate the sustainable transition [4,5].
There are several renewable sources of energy in different stages of maturity [6], and some of them are in the marine environment [7,8]. Wave energy has remarkable potential, but unfortunately, progress in the development of commercial prototypes has moved quite slowly [9,10,11]. The hydrodynamic power performances of various wave energy converters (WECs) have been reviewed [12,13]. It is obvious that WEC performance also depends on the wave energy potential in the areas where the wave farms are located, and therefore wave energy estimations are required before any deployment.
In this context, the global assessment of the wave power has been the topic of several studies based on the sea state conditions provided either by numerical models [14,15,16,17,18] or satellite measurements [19]. Such a global assessment of the wave power can indicate regional areas with high potential, but they may not provide an exact local picture of where the places with energy concentrations, the so-called “hot spots”, are encountered [20,21,22]. These local energy concentrations are determined especially by the local bathymetry characteristics; to find them, simulations with wave models implemented at various levels (from regional to local levels) using high-resolution bathymetry are necessary.
Several studies at regional and local levels to find the most promising places to catch the wave energy were performed. For each continent, some relevant studies can be mentioned; in the Asian continent, the wave energy resources in Northeast Asia [23] and Indonesia [24] were evaluated for extended periods. The western coasts of Europe are promising locations [25], and various studies have been performed considering various relevant areas as France [26], Portugal [27,28], and Ireland [29]. Furthermore, the potential of the wave energy in the European semi-enclosed seas, the Black Sea [30], and the Mediterranean Sea [31] was also evaluated. Several other studies showed that significant wave energy resources can be found in Australia [32,33] as well as North [34] and South Americas [35,36].
The islands received special attention because these isolated areas need to have energy independence and sustainable development [37,38]. Thus, among many assessments conducted in the island environment, the studies for Menorca (the easternmost part of Spain’s Balearic Islands) in [39], Cape Verde in [40], and Hawaii’s archipelagos in [41] can be mentioned as more significant. In addition to the evaluation of wave energy resources, the inter- and intra-annual variability of the potential power production was estimated, this being an essential element for evaluating the economic viability of the future wave farm projects [42,43]. In the recent years, when the effects of climate change have become increasingly evident and projections of the future sea state conditions indicate significant changes [44], some studies have also been conducted on the evolution of the wave power [45,46,47].
In this context, the present study aims to assess the global wave power and its characteristics using the latest re-analysis data that are available from the European Center for Medium-Range Weather Forecasts (ECMWF). As regards the novelty and the added value of the present work, it has to be first highlighted that any new assessment of wave power resources on a global scale, based on the most up-to-date information, should be considered important.
Moreover, besides an in-depth analysis of wave power characteristics, the novelty and the added value of the present work are seen in the comparison of wave energy densities by considering two different databases, i.e., ERA5 (abbreviation of ECMWF RE-analysis, fifth generation) and CCI-SS (Climate Change Initiative for Sea State), new products of the multi-mission altimeter measurements provided by the European Space Agency (ESA) [48]. This gives a better perspective of the wave energy resources not only on a global scale but also on the convergence between the two datasets compared.

2. Materials and Methods

2.1. Datasets

In order to achieve the proposed objectives, one of them being to assess the distribution of wave power worldwide, it is important to use the most up-to-date data that covers all the important water bodies and provides information about the wave parameters. The ERA5 database, the fifth generation ECMWF re-analysis for the global climate and weather, is the product that meets the above requirements [49]. The ocean wave database included in ERA5 contains information concerning various wave parameters at a global level, from 1979 to the present, with a standard spatial resolution of 0.5° × 0.5°. These wave parameters are estimated from the two-dimensional wave spectra and have an hourly temporal resolution.
In this study, the time series for the two wave parameters with 3 h temporal resolution, corresponding to each grid point, were retrieved from the ERA5 database. The two parameters are the significant wave height estimated from the wave spectra (significant height of combined wind waves and swell) denoted as HS (m) and the wave energy period defined as the ratio of the first negative moment of the wave spectrum to the zeroth moment of the wave spectrum denoted as Te (s). The quality of the significant wave heights was evaluated by comparisons with buoy observations. The scatter index computed as normalized standard deviation shows a lower value for ERA5 data compared with the previous ECMWF re-analysis, indicating the better quality of the new dataset [49].
Another dataset considered in this work is represented by the most recent sea state climate data records based on the multi-mission satellite altimeter measurements of the significant wave height (HS) processed in the framework of the European Space Agency Climate Change Initiative for Sea State (CCI-SS) project [50]. The CCI-SS dataset (version 1.1) contains three types of products, but in this study, we used only the Level 4 product that contains global remote sensing merged with the multi-mission monthly gridded significant wave height (1° × 1° spatial resolution) for the time interval of 1992–2018. The altimeter data used in the CCI-SS dataset v1.1 come from multiple satellite missions as presented in Table 1, all processed in a consistent manner [50,51]. More precisely, from this database, we retrieved the variable defined as the sum of the significant wave height squared values over a fixed resolution grid 1° × 1° and for a specific month, together with the number of significant wave height values.
The altimeter HS measurements included in the CCI-SS dataset were carefully calibrated, and a quality evaluation was performed by looking at comparisons with in situ measurements. The statistical parameters show a good agreement between altimeter and in situ measurements, with low values for bias (±0.1 m) and root mean square errors (around 0.22 m), and high correlation coefficients (around 0.97). An analysis of these data was recently made [52,53].
Whereas CCI-SS provides information only about the significant wave height parameter, and the mean wave energy density per unit horizontal area (Ew) is directly related to the square of HS, the monthly mean wave energy density per unit horizontal area will be evaluated as a second step of the present work. This is computed based on the total of the median significant wave height squared values divided by the number of available data retrieved from CCI-SS database.

2.2. Wave Power and Wave Energy Density Evaluation

The wave energy flux per unit of wave-crest length in deep water, also known as the wave power Pw (W/m), can be computed in a deep water location using the following relationship [54]:
P w = ρ g 2 64 π H S 2 T e
where HS (m) is the significant wave height, Te (s) is the wave energy period, ρ = 1025 kg/m3 is the density of the seawater, while g (m/s) is the gravitational acceleration.
The wave energy flux in the wave propagation direction can also be written as [55]:
P w = E w c g
where Ew (J/m2) is the mean wave energy density per unit horizontal area (the sum of kinetic and potential energy density per unit horizontal area), and cg is the group velocity (m/s). The mean wave energy density per unit horizontal area is calculated as:
E w = ρ g 16 H S 2
It can be noticed from the above relationships that two wave parameters (HS and Te) are necessary for computing Pw, and they are available in the ERA5 database. These two parameters are retrieved from the ERA5 database with a temporal resolution of 3 h over the 30-year time interval (1989–2018). On the other hand, for the evaluation of Ew, we need only HS, which is available in both databases (ERA5 and CCI-SS). By considering the two databases and then compare the results, the mean wave energy density per unit horizontal area can be evaluated in parallel.

3. Results

In this section, the results regarding the wave power computed at the global level based on ERA5 data are first analyzed. Additionally, some other issues regarding the variability of these resources are also discussed. As a next step, an evaluation of the wave energy based on both datasets and a comparison between them is made. Various maps are included in this section as a result of the analysis of several data; in all the maps, the maximum values corresponding to each respective field are marked with a white circle.

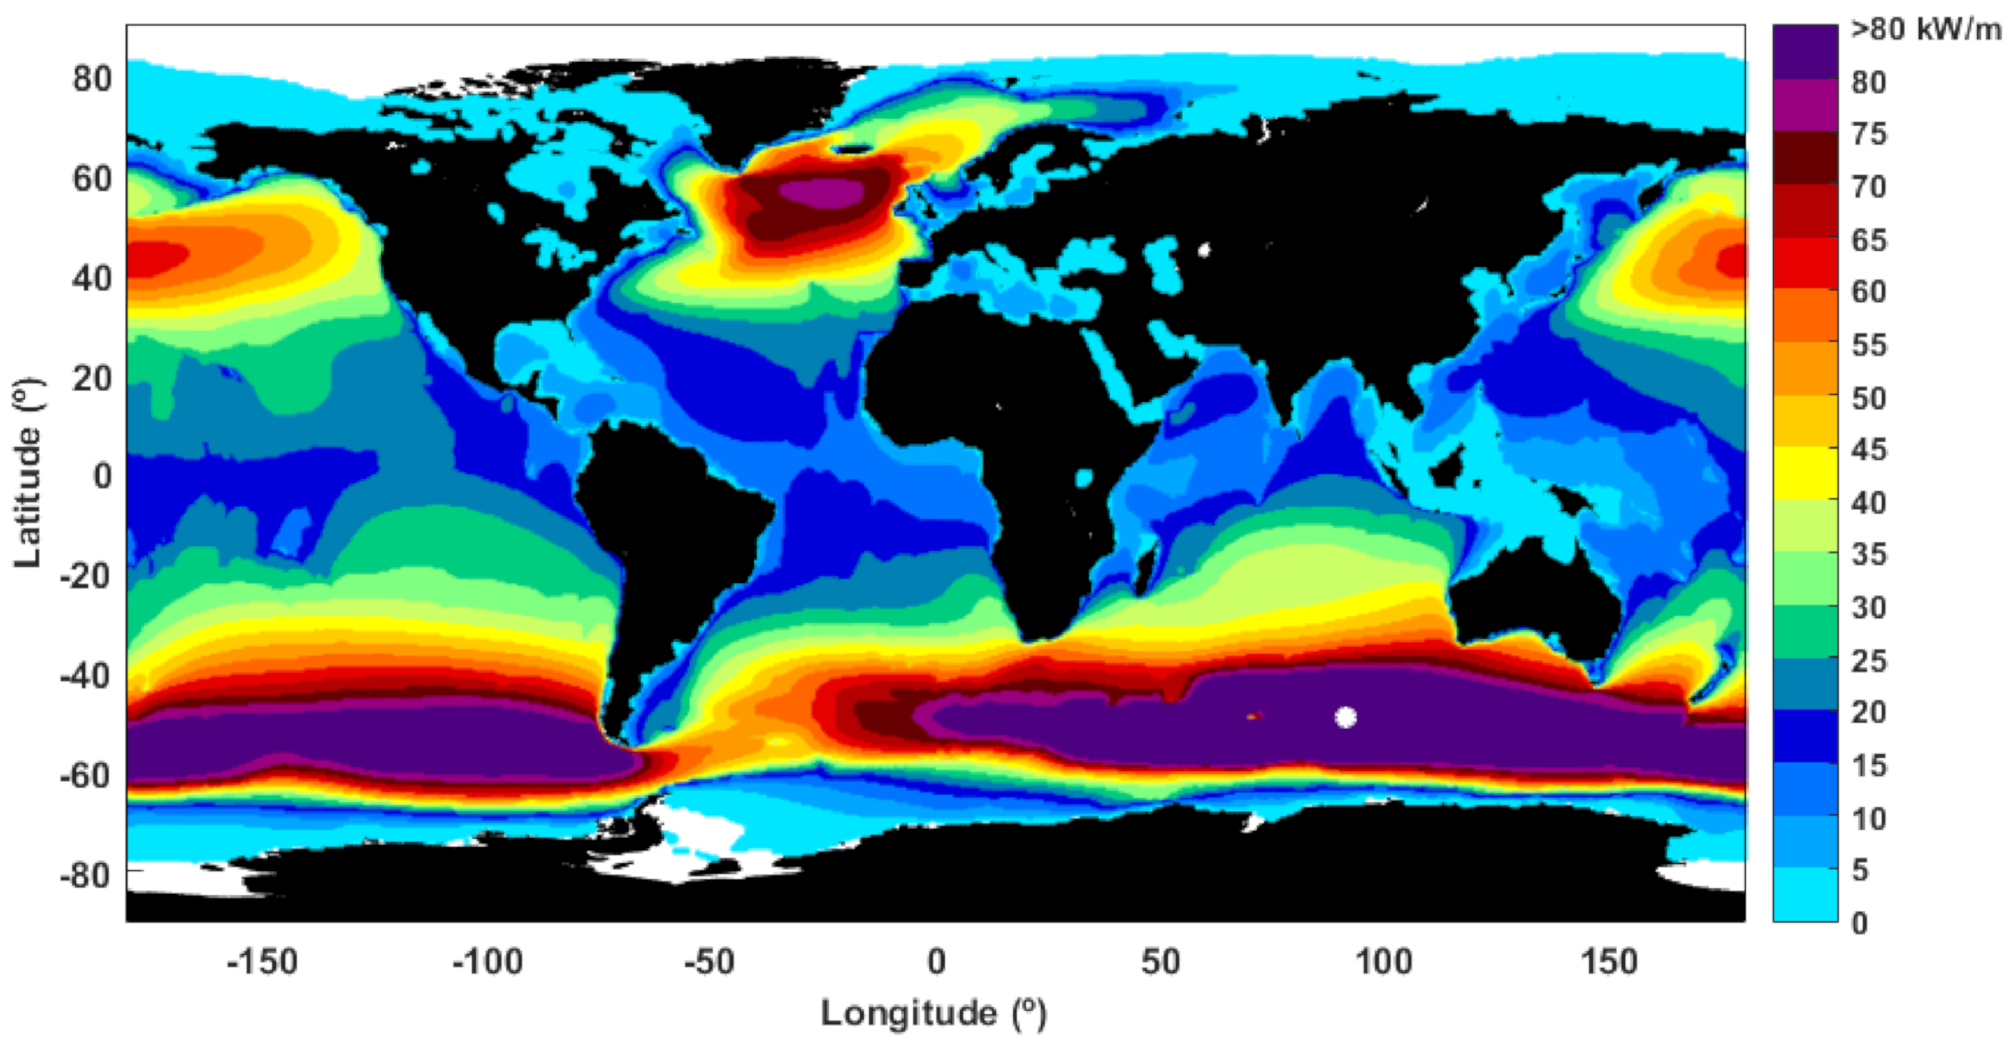
3.1. Global Wave Power According to ERA5 Database

The time series of the wave parameters (HS and Te) with 3 h temporal resolution retrieved from the ERA5 database were used to compute the wave power time series in each grid point. Then, they were averaged, and the global mean wave power map was designed (Figure 1) for the entire 30-year time interval 1989–2018. The areas from the Northern and Southern Hemispheres covered by ice are represented with white color. The maximum value of the entire mean wave power field is around 119 kW/m and is located in the Southern Hemisphere. The higher wave power potential presents a fairly large spatial variability, with the highest values between the latitudes 40° and 60° of both Northern and Southern Hemispheres.
It can be also noticed from Figure 1 that in the South Pacific and Atlantic Oceans and in the southern part of the Indian Ocean over extended areas, the highest values of the mean wave power (higher than 80 kW/m) can be found. This is due to the influence of the Southern Ocean (an extended water body without any land that encircles Antarctica) with extended fetches for wave developments and an upward trend of the HS associated with the global warming [56,57]. The most energetic coastal regions are in the southwestern parts of South America, South Africa, and also in the southern coast of Australia. The North Atlantic is the most energetic zone of the Northern Hemisphere where the highest values are found (around 80 kW/m). Near the coasts, the highest values of the wave power are noticed on the western sides of Europe and North America.
An overview of the global wave power statistical distribution is provided through the computation of the percentiles and their representation as maps. The 50th, 75th, 90th, and 95th percentiles of the wave power based on ERA5 data over the 30-year interval considered are illustrated in Figure 2. As it is known, a percentile is a kind of quantile that divides the given probability distribution into 100 equal intervals. This allows for the analysis of the data in terms of percentages. For example, the 95th percentile is a value below which 95% of the observations are found, and above which are 5%. The 50th percentile represents the median of the distribution (or second quartile Q2), and the 75th percentile is the third quartile (Q3). It can be noticed from Figure 2 that the maximum value for all percentiles is located in the Southern Hemisphere (more or less the same position as the maximum value of the mean wave power).
The 50th percentile (median value) does not exceed 50 kW/m in the Northern Hemisphere while in the Southern Hemisphere between the latitudes 40° and 60°, the values are in general higher than 50 kW/m with a maximum of 93 kW/m (except a small area in the southeastern side of South America where the lowest values of the southern region are always encountered). For the 75th percentile, the same distribution pattern of the greatest values is maintained as in the case of the 50th percentile. However, the maximum value now reaches about 151 kW/m. As regards the 90th and 95th percentiles, the magnitudes encountered in both hemispheres are more similar, and in extended areas their values are higher than 160 kW/m, while the maximum values reached 229 kW/m and 294 kW/m, respectively.

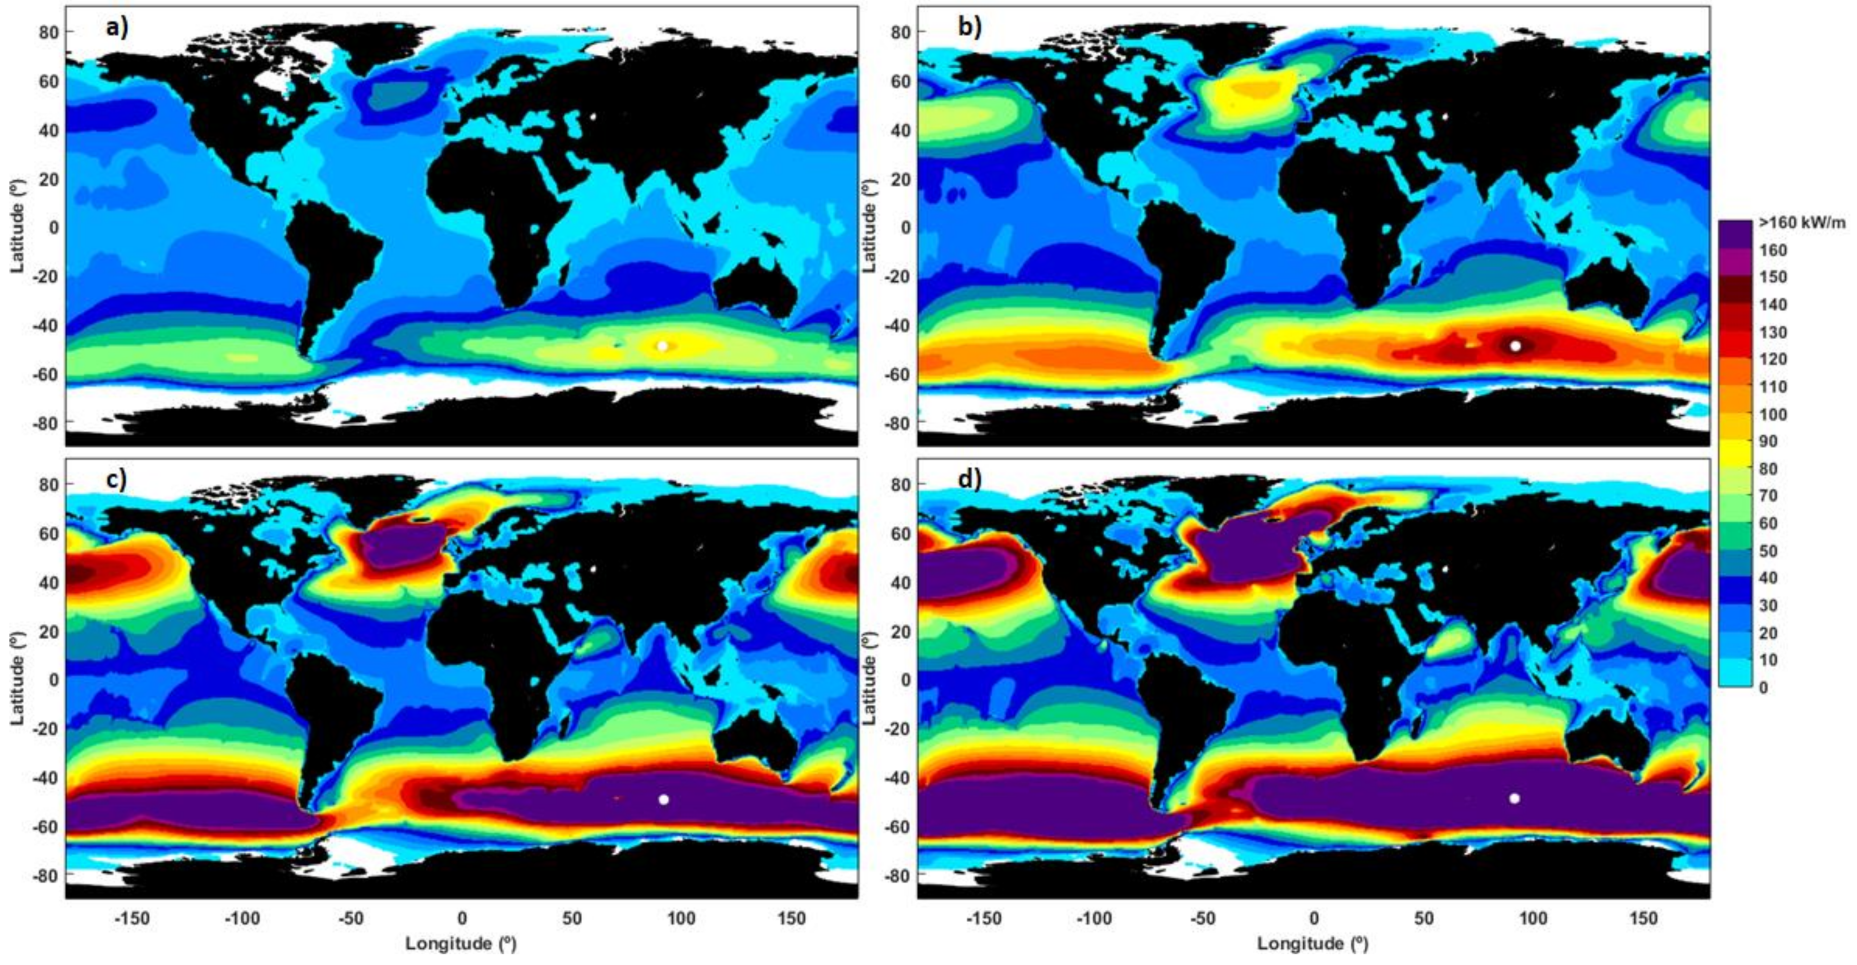
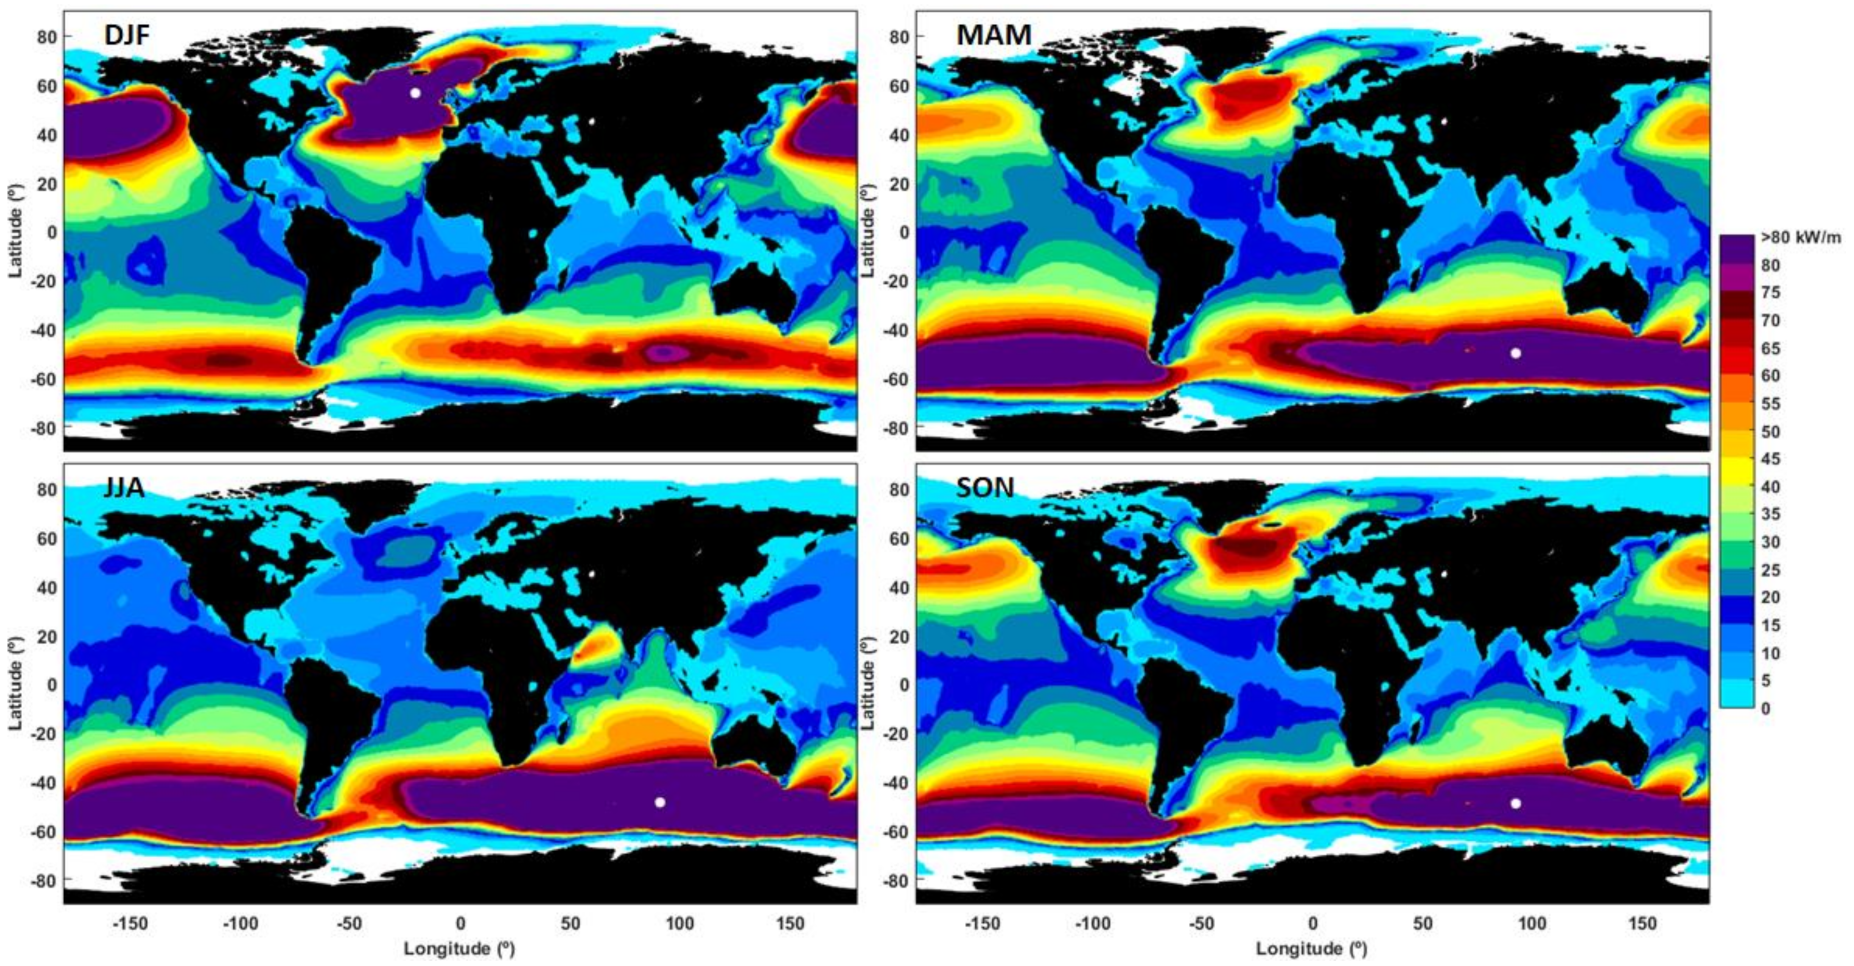
3.2. Wave Power Variability

First, the seasonal variability was analyzed using the quarterly partition for the months of the year that corresponds to the seasons from the Northern Hemisphere. Thus, winter covers the months December, January, and February (DJF); spring corresponds to March, April, and May (MAM); summer to June, July, and August (JJA); and autumn to September, October, and November (SON). Figure 3 shows the wave power means corresponding to each season and computed using the 30 years of ERA5 data considered.
From the analysis of the maps presented in Figure 3, it can be observed that in the Northern Hemisphere, the wave power is more affected by the seasonality; the greatest differences are between DJF and JJA. At the global level, there are two peaks in terms of the maximum values of the mean wave power. Thus, for DJF, a value of 146 kW/m was noted, this being the only season when the maximum value is found at the northern latitudes; the value is located around the latitude of 60° N, while in JJA (i.e., the austral winter), the maximum is located around the latitude 50° S and has a value of 154 kW/m. Between the mean wave power values encountered in the transitional seasons as MAM and SON, no significant differences exist, and the maximum values are around 120 kW/m.
To further evaluate the wave power variability, two more indexes that usually are considered in the climate evaluations were computed. These indexes are the inter-annual variability (IAV) and the mean annual variability (MAV). The first one provides a measure of the year-to-year variability over a period (in this case the 30-year time interval from 1989 to 2018) while the second one indicates the variability within each year. The relationships used to compute these indexes are found in [58]:
IAV = σ x k ¯ x ¯ × 100
MAV = σ k x k ¯ ¯
where x denotes the time series of the wave power over a period of years, σ is the standard deviation, indexes k refer to the year, and the overbar denotes an average.
The inter-annual variability of the wave power is illustrated in Figure 4; it shows that a strong variability is present in the regions with intermittent ice coverage and also in the enclosed or semi-enclosed basins, where the waves are highly influenced by the wind while swell is rarely present (see for example Black Sea, Mediterranean Sea, Caribbean Sea, Gulf of Mexico, northern side of Australia, and the seas surrounding Indonesia, etc.). The regions with low values of IAV (below 10%) are the South Pacific and the Atlantic Ocean and also the Indian Ocean. In the North Atlantic Ocean, the year-to-year variability may be associated with the influence of Arctic Oscillation (AO).
Figure 5 presents the values resulted for the global MAV index that shows the variability within each year. As expected, the greatest variability within each year is found in the Northern Hemisphere. Thus, the MAV index in the northern part of the Atlantic and Pacific Oceans is highly influenced by the seasonal differences in terms of wave power, especially those existing between summer and winter wave power values (in JJA, the lowest wave powers are encountered, while in DJF, the highest wave power values are found).
The enclosed and semi-enclosed basins are also drastically affected by the seasonal variability of the wave power as well as the zone in which the ice coverage is variable throughout the year. Contrary to the above-mentioned oceans, in the Indian Ocean and the South China Sea, only two seasonal patterns are present, and they are related to monsoons. The lower mean annual variability of the wave power is in general at the tropics (from 25° S to 20° N), and this is caused by the relatively constant waves throughout the year that can be found in this region. The region from 35° S to 45° S presents a moderate fluctuation influenced by the presence of swell [59].
At this point, it has to be noted that the patterns of the IAV and MAV indexes are in line with those computed by Stopa et al. [58] for the significant wave height, but the values for wave power are higher. They may be influenced by the power low relationship existing between Pw and HS (where Pw varies as a power of HS).

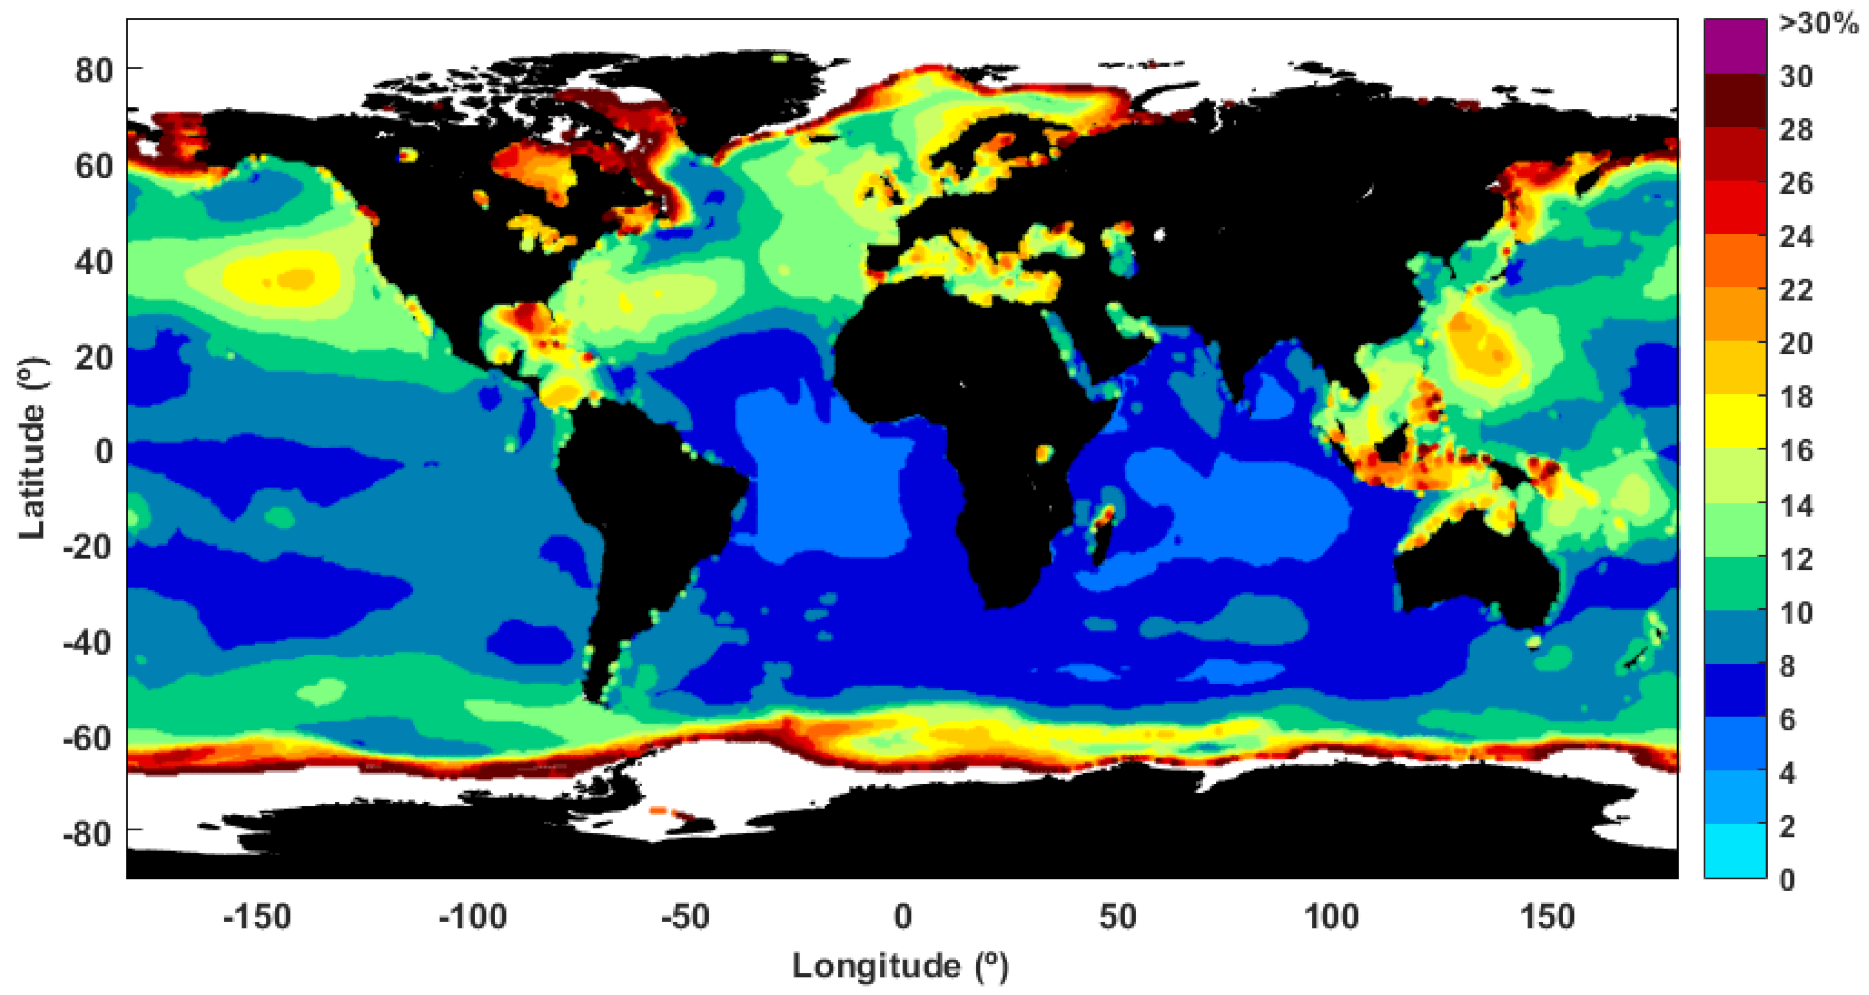
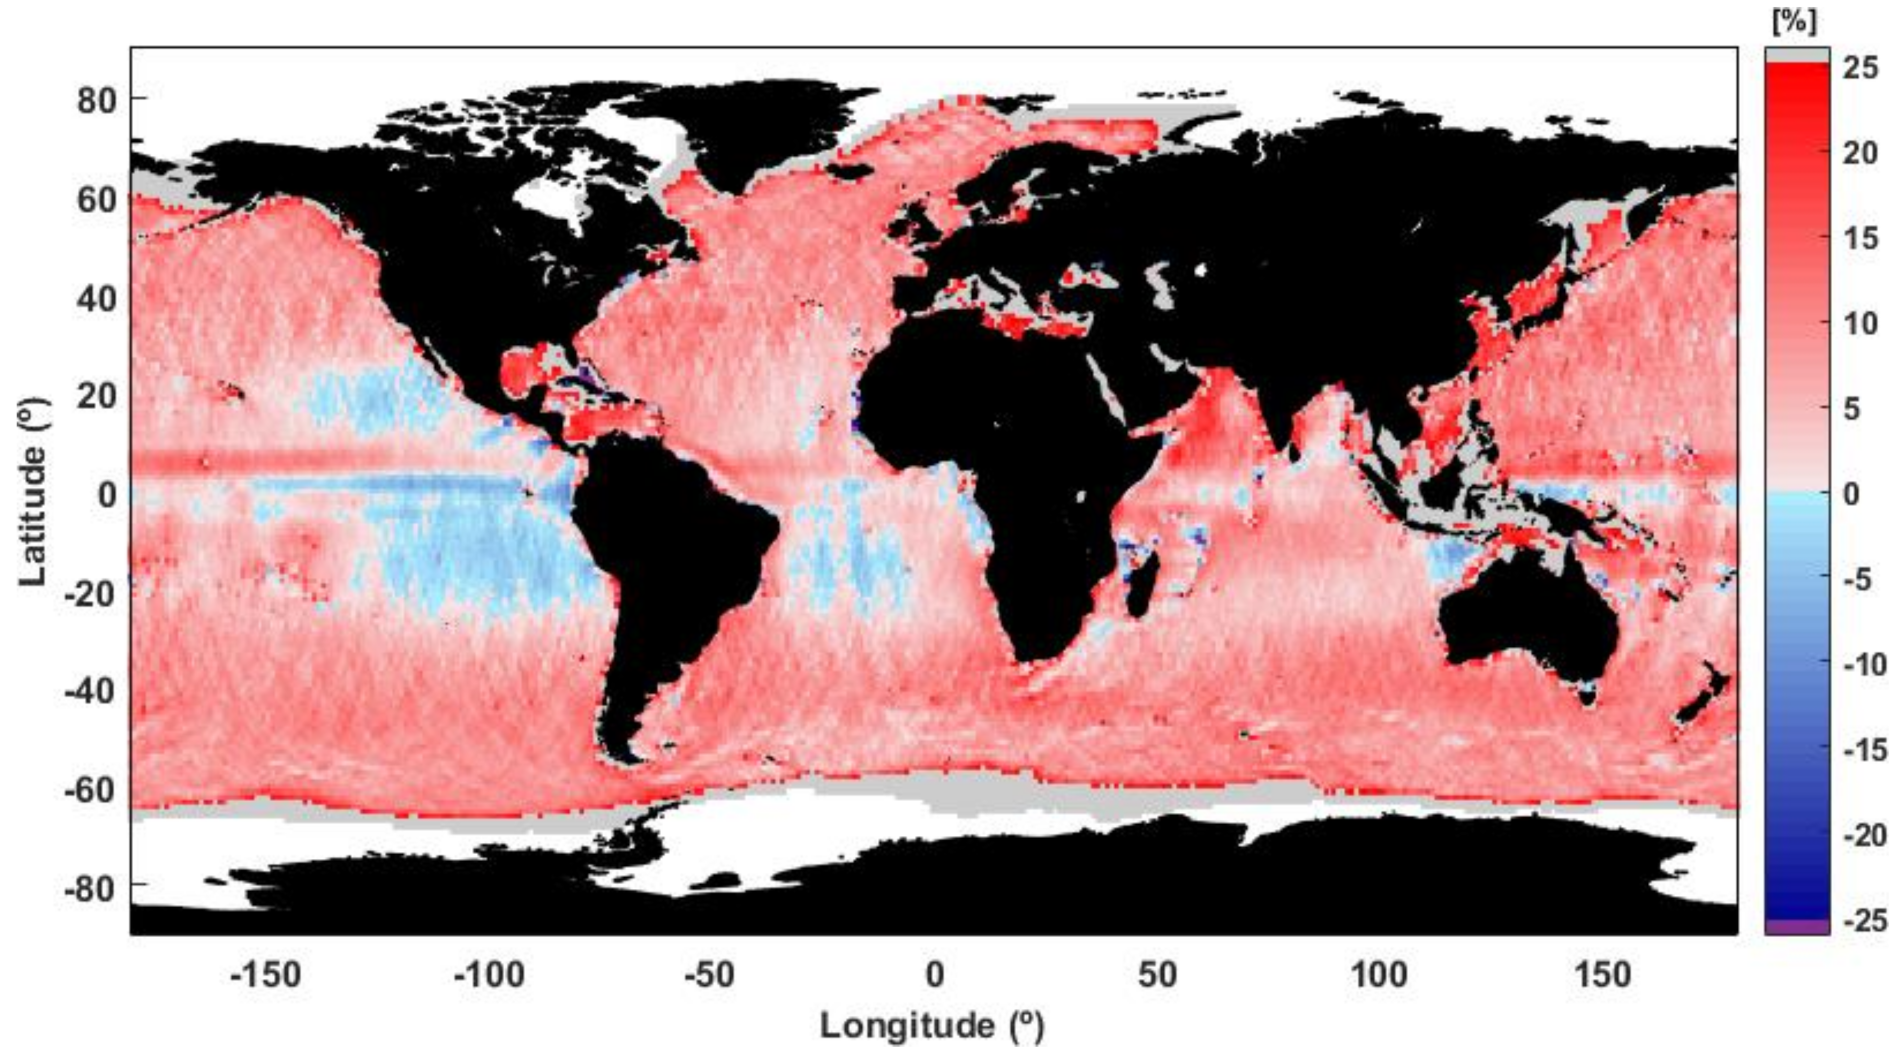
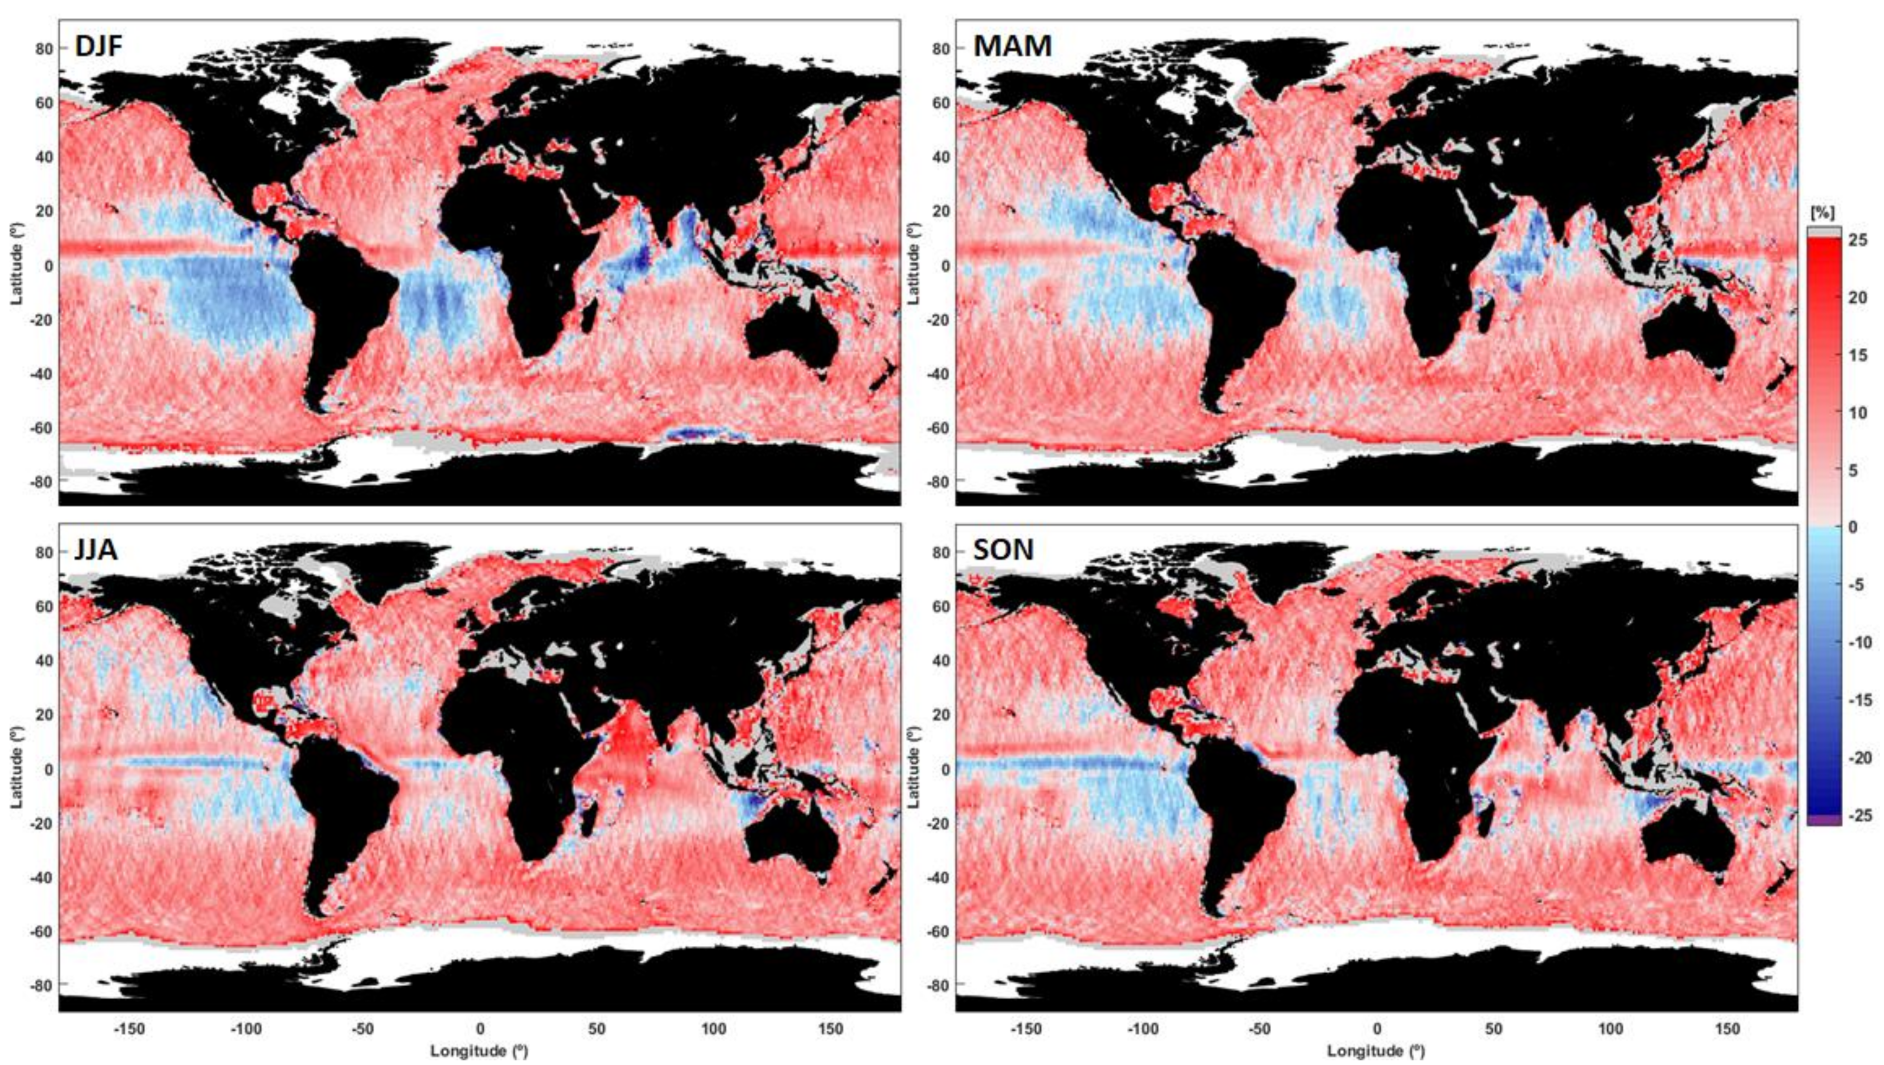
3.3. Comparisons of the Wave Energy Density between CCI-SS and ERA5

Given that until now, in general, the wave energy resources at a global level are assessed based on the wave model results implemented at a global scale, the new CCI-SS database represents an opportunity to use altimeter measurements for wave energy evaluation. At present, the altimeter measurements are considered better in covering the world water basins, and also the accuracy of the measurements is increased. An important objective of the CCI-SS project is to improve the measurements near the coastal areas, and from this perspective, improved new data versions are expected to come soon. Furthermore, the computation of the relative differences between the wave energy density evaluated based on CCI-SS and ERA5 data shows us the robustness of the new altimeter data for the wave energy assessment.
Based on the CCI-SS data described in the previous section, the mean wave energy density (Ew-CCI) was computed over a 27-year time interval (1992–2018) with Equation (3). Thus, the mean Ew-CCI over each month was computed, as well as the average for the whole period. This was made using the values retrieved from the CCI-SS database, namely the total of the median significant wave height squared values over a specific month and the number of the median significant wave height. As mentioned, the CCI-SS gridded data (Level 4 product) have a 1° × 1° spatial resolution.
The Ew-CCI worldwide distribution is illustrated in Figure 6; the white pixels represent the grid points where no data are available due to the presence of ice or where the percentage of the available data is below 50% of the time series (i.e., the minimum criterion to compute a mean was not met). The Ew-CCI maxima (around 17 kJ/m2) is also located in the Southern Hemisphere where the higher values of the wave energy density are found. Practically, in both hemispheres the higher values are in the same latitude band; this shows that a similar ratio is maintained between the northern and southern values as in the case of the parameter Pw.
Furthermore, in order to have the same basis for comparison, the mean wave energy density was calculated using both data (CCI-SS and ERA5). It should be highlighted that the information regarding HS was extracted from the ERA5 files in the points matching the CCI-SS grid for the same period covered by the CCI-SS data (1992–2018). The monthly average values of Ew-ERA5 are computed, and later on the average over the entire period and the results are presented in Figure 7. For the ERA5 data, the maximum value of Ew-ERA is around 15 kJ/m2 and has approximately the same location as in the case of CCI-SS data.
Similar patterns for the global distribution of the mean wave energy density computed that was based on the altimeter measurements (CCI-SS L4 product) and was estimated from the ERA5 data are presented in Figure 6 and Figure 7, respectively. As in the case of the distribution of the wave power computed based only on the ERA5 data (Figure 1), Ew shows higher values in the mid-latitudes of both hemispheres. In the enclosed or semi-enclosed seas (as in the Black Sea, Red Sea, or the Caspian Sea), the Ew values are lower for these areas, as well as in the sheltered regions (as in the Gulf of Mexico or Indonesia).
In order to have a better image of the maximum values of the mean wave energy (Ew) registered in each hemisphere according to the two datasets, these maximum values are illustrated in Figure 8 (SH: Southern Hemisphere; NH: Northern Hemisphere). The evaluation was made both for all data and each season separately. As previously mentioned, the partition for the months of the year corresponds to the seasons from NH. It can be noticed that the maximum values computed in SH are in general about one and a half times larger than in NH, for both datasets. The results also show that in each hemisphere, the Ew maximum values computed from CCI-SS dataset are higher by about 11% in comparison with those resulted from ERA5. Only in DJF, the Ew maximum values computed from CCI-SS are higher by about 50% and 21% in SH and NH, respectively.
The comparison shows that higher Ew values were estimated based on CCI-SS data; to find the magnitude of these differences, the normalized differences (%) between the climatological means of Ew-CCI and Ew-ERA5 (Ew-CCI minus Ew-ERA5 normalized by Ew-CCI) are evaluated and presented in Figure 9. The values outside the color scale are represented in gray for those above 25% and in magenta for those below −25%. The relative differences for each season were also computed, and Figure 10 presents their global spatial distribution.
In general, in all figures, the minimum relative differences are around −40% (with the highest values corresponding to the locations around Bahamas Islands), while the maximum relative differences are around +35%, located in general in the areas where the ice coverage is variable. Over most of the water bodies, relative differences are positive, in general until 5%, indicating that Ew-CCI is higher than Ew-ERA5. In the eastern side of the Pacific Ocean and South Atlantic, from the equator to 25° latitude in both hemispheres, there are extended regions with negative relative differences (lower than −5%). The enclosed basins and sheltered regions (generally the same areas previously mentioned) exhibit the highest positive relative differences.
In the intermediate seasons (MAM and SON), the same relative differences are maintained over the globe, with some exceptions in the Arabian Sea and in the northwestern part of the Indian Ocean (see Figure 10). Not surprisingly, between the relative differences computed for DJF and JJA, the highest discrepancies appear. These can be eventually connected to the extreme events generated by the extratropical storms acting in the Northern Hemisphere, the eastern tropical Pacific events, and the influence of the swell coming in the South Atlantic and Pacific Oceans and from the Southern Ocean in the Southern Hemisphere in winter (corresponding to JJA) [60,61].
Thus, the clearest example regarding the modification of the relative differences occurs in the Arabian Sea and the northwestern part of the Indian Ocean. In such places, it can be seen that in over extended areas, the relative differences pass from negative values in winter to positive values in summer. The Arabian Sea is generally a calm region (see [58]), but in summer (JJA) it is affected by a southwesterly jet that develops close to the African coast and is associated with the Northern Indian Ocean summer monsoon [61,62]. For this reason, a greater mean annual variability of the wave climate (MAV) is encountered in this region [63]. In addition, a recent study [64] shows that in the Arabian Sea, HS from ERA5 presents some discrepancies in the function of the sea state conditions, related especially to the pre- and post-monsoon seasons. Thus, an overestimation in the swell conditions was observed. In DJF and MAM, an area with more pronounced positive relative differences (compared with Figure 9) is found along the equator. On the other hand, on the eastern side of the Pacific Ocean and the South Atlantic, the highest negative relative differences are in these seasons, while in the next two seasons (JJA and SON), both the positive and negative relative differences attenuate, approaching zero percentage.
The differences between the Ew values can be also explained by the various errors existing in both databases. Thus, it should be noted that although both databases are built based on previous experience in processing satellite measurements or simulating wave conditions, they have been available for research only for a very short time, and therefore there are few studies on data quality. Although the wave simulations for ERA5 were performed with updated bathymetry and using an improved wave model, errors may still be present due to the coarse resolution of the computational grid (especially in coastal areas or enclosed basins); these can be also due to errors in the wind field that was used to force the wave model or some model parameterizations considered [65]. Moreover, some errors can be present in the altimeter measurements, especially in the coastal areas. It is obvious that the values of the wave energy densities computed based on both datasets are strongly influenced by the values of the significant wave height. The existing errors in the HS evaluation by means of numerical modelling or measurement are also propagated as errors in Ew. A detailed analysis of the significant wave height provided by both databases was performed by Dodet et al. [50].

4. Conclusions

The recent ERA5 re-analysis data and also the new CCI-SS products of the multi-mission altimeter measurements present a good opportunity for an up-to-date assessment of the global wave energy resources. From this perspective, the wave power and the wave energy density at a global scale were evaluated with these newly available data. Since the altimeter measurements provide information only about the significant wave height, the wave energy density, which can be derived only from this parameter, is computed using data from both databases followed by a comparison between the results. As the wave power relationship indicates, the values of the two wave parameters are necessary (HS and Te) for computing the wave power, and they can be provided at this moment only by the ERA5 database.
The wave power at the global scale was evaluated over 30 years (1989–2018), and the results show that the highest values are in a latitude band of 40–60° in both hemispheres. The maximum mean wave power value reaches 119 kW/m, and it is located in the Southern Hemisphere. On the other hand, the lowest wave power values are in the enclosed or semi-enclosed water bodies (as in the Black Sea, the Mediterranean Sea, or the Red Sea), or in sheltered coastal regions (as in the Gulf of Mexico or Indonesia). The wave power fields have similar patterns with those from some previous assessments (see for example, [14,66]) where other re-analysis databases were considered. In the first study, 15 years (2000–2014) of data from ERA-Interim [67] was used, while in the second, the above-mentioned GOW (Global Ocean Waves [68]) re-analysis covering the period from 1948 to 2008 was analyzed. Small differences exist in the maximum values (around 127 kW/m and 140 kW/m), but their locations are more or less in the same place.
The global wave power statistical distribution shows that the 50th percentile in the Northern Hemisphere is up until 50 kW/m, while in the Southern Hemisphere it reaches a value of 93 kW/m. Concerning the 90th and 95th percentiles, both hemispheres have similar values (being in extended areas higher than 160 kW/m), with the maximum reaching 229 kW/m and 294 kW/m, respectively, and with small areas around them being higher than 180–200 kW/m. The variability (seasonal, mean annual, and inter-annual) of the wave resources was also evaluated. The Northern Hemisphere is more affected by the seasonal variability, showing high differences between DJF and JJA, and also high values of the indexes MAV and IAV.
In the next step, the wave energy density based on both databases (ERA5 and CCI-SS) was assessed at a global scale. A good agreement between the results was found, and similar patterns were noticed. However, some disagreements indicated by the relative differences have also been observed. The high relative differences (positive or negative) appear to be in the Arabian Sea and in the northwestern part of the Indian Ocean, areas that are affected by the southwesterly jet associated with the Asian summer monsoon.
In the enclosed basins and sheltered coastal regions, the highest positive differences were noticed (CCI-SS results being higher than those from ERA5). This suggests that in these small areas characterized in general by low significant wave heights, the altimeter measurements may overestimate the HS parameter. Further investigations considering the new version of the CCI-SS products will be carried out, taking into consideration the project objectives, which will be focused on to improve the assessment of the wave parameters in the coastal regions.
Finally, it should be highlighted that although the technology for the wave energy extraction is not yet fully effective, the very high dynamics as regards the offshore wind is expected to induce momentum to the wave energy industry as well [69,70]. From this perspective, a first step would be to collocate wave farms in the vicinity of the already operating wind farms; in this way, both the capital and operational costs would be substantially decreased [71,72]. Furthermore, another expected advantage of the future wave energy farms is that by absorbing the incoming wave energy in the nearshore, they can also provide coastal protection [73,74], bringing a beneficial role in the balance of the nearshore processes.

Author Contributions

Conceptualization, methodology, L.R. and E.R.; formal analysis, investigation, L.R.; writing—original draft preparation, L.R.; writing—review and editing, E.R.; visualization, L.R. and E.R. All authors have read and agreed to the published version of the manuscript.

Funding

This research was funded by the European Space Agency, Climate Change Initiative (CCI) for Sea State project, ESA grant number 4000123651/18/I-NB.

Institutional Review Board Statement

Not applicable.

Informed Consent Statement

Not applicable.

Data Availability Statement

The data used in this study are openly available. ERA5 data used in this study were obtained from the ECMWF data server. CCI Sea State data are available for download from https://climate.esa.int/en/projects/sea-state/data/.

Conflicts of Interest

The authors declare no conflict of interest.

References

  1. United Nations Framework Convention on Climate Change, The Paris Agreement|UNFCCC. Available online: https://unfccc.int/process-and-meetings/the-paris-agreement/the-paris-agreement (accessed on 30 October 2020).
  2. IRENA Global Renewables Outlook: Energy Transformation 2050. Available online: https://www.irena.org/publications/2020/Apr/Global-Renewables-Outlook-2020/publications/2020/Apr/Global-Renewables-Outlook-2020 (accessed on 28 October 2020).
  3. IEA. World Energy Outlook. 2020. Available online: https://www.iea.org/reports/%0brenewable-energy-market-update (accessed on 28 October 2020).
  4. Kuzemko, C.; Bradshaw, M.; Bridge, G.; Goldthau, A.; Jewell, J.; Overland, I.; Scholten, D.; van de Graaf, T.; Westphal, K. Covid-19 and the Politics of Sustainable Energy Transitions. Energy Res. Soc. Sci. 2020, 68, 101685. [Google Scholar] [CrossRef] [PubMed]
  5. Hepburn, C.; O’Callaghan, B.; Stern, N.; Stiglitz, J.; Zenghelis, D. Will COVID-19 Fiscal Recovery Packages Accelerate or Retard Progress on Climate Change? Oxf. Rev. Econ. Policy 2020, 36, S359–S381. [Google Scholar] [CrossRef]
  6. Østergaard, P.A.; Duic, N.; Noorollahi, Y.; Kalogirou, S. Latest Progress in Sustainable Development Using Renewable Energy Technology. Renew. Energy 2020, 162, 1554–1562. [Google Scholar] [CrossRef]
  7. Soukissian, T.H.; Denaxa, D.; Karathanasi, F.; Prospathopoulos, A.; Sarantakos, K.; Iona, A.; Georgantas, K.; Mavrakos, S. Marine Renewable Energy in the Mediterranean Sea: Status and Perspectives. Energies 2017, 10, 1512. [Google Scholar] [CrossRef] [Green Version]
  8. Soukissian, T.; Karathanasi, F.; Belibassakis, K.; Kontoyiannis, H. Marine Renewable Energy in the Greek Seas. In The Handbook of Environmental Chemistry; Springer: Berlin/Heidelberg, Germany, 2020; pp. 1–22. [Google Scholar]
  9. Guanche, R.; de Andrés, A.D.; Simal, P.D.; Vidal, C.; Losada, I.J. Uncertainty Analysis of Wave Energy Farms Financial Indicators. Renew. Energy 2014, 68, 570–580. [Google Scholar] [CrossRef]
  10. Neill, S.P.; Hashemi, M.R. Wave Power Variability over the Northwest European Shelf Seas. Appl. Energy 2013, 106, 31–46. [Google Scholar] [CrossRef]
  11. Maria-Arenas, A.; Garrido, A.J.; Rusu, E.; Garrido, I. Control Strategies Applied to Wave Energy Converters: State of the Art. Energies 2019, 12, 3115. [Google Scholar] [CrossRef] [Green Version]
  12. Rusu, E.; Onea, F. A Review of the Technologies for Wave Energy Extraction. Clean Energy 2018, 2, 10–19. [Google Scholar] [CrossRef] [Green Version]
  13. Babarit, A. A Database of Capture Width Ratio of Wave Energy Converters. Renew. Energy 2015, 80, 610–628. [Google Scholar] [CrossRef]
  14. Rusu, L.; Onea, F. The Performance of Some State-of-the-Art Wave Energy Converters in Locations with the Worldwide Highest Wave Power. Renew. Sustain. Energy Rev. 2017, 75, 1348–1362. [Google Scholar] [CrossRef]
  15. Gunn, K.; Stock-Williams, C. Quantifying the Global Wave Power Resource. Renew. Energy 2012, 44, 296–304. [Google Scholar] [CrossRef]
  16. Lavidas, G.; Kamranzad, B. Assessment of Wave Power Stability and Classification with Two Global Datasets. Int. J. Sustain. Energy 2020. [Google Scholar] [CrossRef]
  17. Onea, F.; Rusu, E. Sustainability of the Reanalysis Databases in Predicting the Wind and Wave Power along the European Coasts. Sustainability 2018, 10, 193. [Google Scholar] [CrossRef] [Green Version]
  18. Martinez, A.; Iglesias, G. Wave Exploitability Index and Wave Resource Classification. Renew. Sustain. Energy Rev. 2020, 134, 110393. [Google Scholar] [CrossRef]
  19. Mo̸rk, G.; Barstow, S.; Kabuth, A.; Pontes, M.T. Assessing the Global Wave Energy Potential; American Society of Mechanical Engineers Digital Collection (OMAE2010): New York, NY, USA, 2010; pp. 447–454. [Google Scholar]
  20. Akpınar, A.; Jafali, H.; Rusu, E. Temporal Variation of the Wave Energy Flux in Hotspot Areas of the Black Sea. Sustainability 2019, 11, 562. [Google Scholar] [CrossRef] [Green Version]
  21. Belibassakis, K.; Bonovas, M.; Rusu, E. A Novel Method for Estimating Wave Energy Converter Performance in Variable Bathymetry Regions and Applications. Energies 2018, 11, 2092. [Google Scholar] [CrossRef] [Green Version]
  22. Kamranzad, B.; Etemad-Shahidi, A.; Chegini, V. Developing an Optimum Hotspot Identifier for Wave Energy Extracting in the Northern Persian Gulf. Renew. Energy 2017, 114, 59–71. [Google Scholar] [CrossRef]
  23. Kamranzad, B.; Takara, K. A Climate-Dependent Sustainability Index for Wave Energy Resources in Northeast Asia. Energy 2020, 209, 118466. [Google Scholar] [CrossRef]
  24. Triasdian, B.; Indartono, Y.S.; Ningsih, N.S. Energy Capture Potential of Existing Wave Energy Converters for Indonesian Sea. AIP Conf. Proc. 2018, 1984, 030002. [Google Scholar] [CrossRef]
  25. Rusu, L.; Onea, F. Assessment of the Performances of Various Wave Energy Converters along the European Continental Coasts. Energy 2015, 82, 889–904. [Google Scholar] [CrossRef]
  26. Gonçalves, M.; Martinho, P.; Guedes Soares, C. A 33-Year Hindcast on Wave Energy Assessment in the Western French Coast. Energy 2018, 165, 790–801. [Google Scholar] [CrossRef]
  27. Rusu, E.; Guedes Soares, C. Wave Energy Assessments in the Coastal Environment of Portugal Continental; American Society of Mechanical Engineers Digital Collection (OMAE2008): New York, NY, USA, 2008; pp. 761–772. [Google Scholar]
  28. Silva, D.; Rusu, E.; Guedes Soares, C. High-Resolution Wave Energy Assessment in Shallow Water Accounting for Tides. Energies 2016, 9, 761. [Google Scholar] [CrossRef] [Green Version]
  29. Gallagher, S.; Tiron, R.; Whelan, E.; Gleeson, E.; Dias, F.; McGrath, R. The Nearshore Wind and Wave Energy Potential of Ireland: A High Resolution Assessment of Availability and Accessibility. Renew. Energy 2016, 88, 494–516. [Google Scholar] [CrossRef]
  30. Rusu, L. The Wave and Wind Power Potential in the Western Black Sea. Renew. Energy 2019, 139, 1146–1158. [Google Scholar] [CrossRef]
  31. Lavidas, G.; Venugopal, V. A 35 Year High-Resolution Wave Atlas for Nearshore Energy Production and Economics at the Aegean Sea. Renew. Energy 2017, 103, 401–417. [Google Scholar] [CrossRef] [Green Version]
  32. Morim, J.; Cartwright, N.; Etemad-Shahidi, A.; Strauss, D.; Hemer, M. Wave Energy Resource Assessment along the Southeast Coast of Australia on the Basis of a 31-Year Hindcast. Appl. Energy 2016, 184, 276–297. [Google Scholar] [CrossRef]
  33. Cuttler, M.V.W.; Hansen, J.E.; Lowe, R.J. Seasonal and Interannual Variability of the Wave Climate at a Wave Energy Hotspot off the Southwestern Coast of Australia. Renew. Energy 2020, 146, 2337–2350. [Google Scholar] [CrossRef]
  34. Allahdadi, M.N.; Gunawan, B.; Lai, J.; He, R.; Neary, V.S. Development and Validation of a Regional-Scale High-Resolution Unstructured Model for Wave Energy Resource Characterization along the US East Coast. Renew. Energy 2019, 136, 500–511. [Google Scholar] [CrossRef]
  35. Guillou, N.; Chapalain, G. Assessment of Wave Power Variability and Exploitation with a Long-Term Hindcast Database. Renew. Energy 2020, 154, 1272–1282. [Google Scholar] [CrossRef]
  36. López, M.; Veigas, M.; Iglesias, G. On the Wave Energy Resource of Peru. Energy Convers. Manag. 2015, 90, 34–40. [Google Scholar] [CrossRef]
  37. Duić, N.; Krajačić, G.; da Graça Carvalho, M. RenewIslands Methodology for Sustainable Energy and Resource Planning for Islands. Renew. Sustain. Energy Rev. 2008, 12, 1032–1062. [Google Scholar] [CrossRef]
  38. Rusu, E.; Onea, F. An Assessment of the Wind and Wave Power Potential in the Island Environment. Energy 2019, 175, 830–846. [Google Scholar] [CrossRef]
  39. Sierra, J.P.; Casas-Prat, M.; Campins, E. Impact of Climate Change on Wave Energy Resource: The Case of Menorca (Spain). Renew. Energy 2017, 101, 275–285. [Google Scholar] [CrossRef]
  40. Bernardino, M.; Rusu, L.; Guedes Soares, C. Evaluation of the Wave Energy Resources in the Cape Verde Islands. Renew. Energy 2017, 101, 316–326. [Google Scholar] [CrossRef]
  41. Stopa, J.E.; Filipot, J.-F.; Li, N.; Cheung, K.F.; Chen, Y.-L.; Vega, L. Wave Energy Resources along the Hawaiian Island Chain. Renew. Energy 2013, 55, 305–321. [Google Scholar] [CrossRef]
  42. Morim, J.; Cartwright, N.; Hemer, M.; Etemad-Shahidi, A.; Strauss, D. Inter- and Intra-Annual Variability of Potential Power Production from Wave Energy Converters. Energy 2019, 169, 1224–1241. [Google Scholar] [CrossRef]
  43. Rusu, L.; Ganea, D.; Mereuta, E. A Joint Evaluation of Wave and Wind Energy Resources in the Black Sea Based on 20-Year Hindcast Information. Energy Explor. Exploit. 2017, 36, 335–351. [Google Scholar] [CrossRef]
  44. Morim, J.; Hemer, M.; Wang, X.L.; Cartwright, N.; Trenham, C.; Semedo, A.; Young, I.; Bricheno, L.; Camus, P.; Casas-Prat, M.; et al. Robustness and Uncertainties in Global Multivariate Wind-Wave Climate Projections. Nat. Clim. Chang. 2019, 9, 711–718. [Google Scholar] [CrossRef] [Green Version]
  45. Rusu, L. A Projection of the Expected Wave Power in the Black Sea until the End of the 21st Century. Renew. Energy 2020, 160, 136–147. [Google Scholar] [CrossRef]
  46. Ribeiro, A.S.; deCastro, M.; Rusu, L.; Bernardino, M.; Dias, J.M.; Gomez-Gesteira, M. Evaluating the Future Efficiency of Wave Energy Converters along the NW Coast of the Iberian Peninsula. Energies 2020, 13, 3563. [Google Scholar] [CrossRef]
  47. Rusu, L. Evaluation of the near Future Wave Energy Resources in the Black Sea under Two Climate Scenarios. Renew. Energy 2019, 142, 137–146. [Google Scholar] [CrossRef]
  48. ESA. European Space Agency Climate Change Initiative for Sea State: Project Website and Data Access. Available online: https://climate.esa.int/en/projects/sea-state/ (accessed on 4 June 2020).
  49. Hersbach, H.; Bell, B.; Berrisford, P.; Hirahara, S.; Horányi, A.; Muñoz-Sabater, J.; Nicolas, J.; Peubey, C.; Radu, R.; Schepers, D.; et al. The ERA5 Global Reanalysis. Q. J. R. Meteorol. Soc. 2020, 146, 1999–2049. [Google Scholar] [CrossRef]
  50. Dodet, G.; Piolle, J.-F.; Quilfen, Y.; Abdalla, S.; Accensi, M.; Ardhuin, F.; Ash, E.; Bidlot, J.-R.; Gommenginger, C.; Marechal, G.; et al. The Sea State CCI Dataset v1: Towards a Sea State Climate Data Record Based on Satellite Observations. Earth Syst. Sci. Data 2020, 12, 1929–1951. [Google Scholar] [CrossRef]
  51. Piollé, J.-F.; Dodet, G.; Quilfen, Y. ESA Sea State Climate Change Initiative (Sea_State_cci). Global Remote Sensing Merged Multi-Mission Monthly Gridded Significant Wave Height, L4 Product, Version 1.1. Available online: https://climate.esa.int/en/projects/sea-state/data/ (accessed on 3 September 2020).
  52. Timmermans, B.W.; Gommenginger, C.P.; Dodet, G.; Bidlot, J.-R. Global Wave Height Trends and Variability from New Multimission Satellite Altimeter Products, Reanalyses, and Wave Buoys. Geophys. Res. Lett. 2020, 47, e2019GL086880. [Google Scholar] [CrossRef]
  53. Quartly, G.D.; Kurekin, A.A. Sensitivity of Altimeter Wave Height Assessment to Data Selection. Remote Sens. 2020, 12, 2608. [Google Scholar] [CrossRef]
  54. Herbich, J.B. Handbook of Coastal Engineering; McGraw-Hill: New York, NY, USA, 2000; ISBN 978-0-07-134402-9. [Google Scholar]
  55. Holthuijsen, L.H. Waves in Oceanic and Coastal Waters, 1st ed.; Cambridge University Press: Cambridge, UK, 2010; ISBN 978-0-521-12995-4. [Google Scholar]
  56. Babanin, A.V.; Rogers, W.E.; de Camargo, R.; Doble, M.; Durrant, T.; Filchuk, K.; Ewans, K.; Hemer, M.; Janssen, T.; Kelly-Gerreyn, B.; et al. Waves and Swells in High Wind and Extreme Fetches, Measurements in the Southern Ocean. Front. Mar. Sci. 2019, 6. [Google Scholar] [CrossRef] [Green Version]
  57. Reguero, B.G.; Losada, I.J.; Méndez, F.J. A Recent Increase in Global Wave Power as a Consequence of Oceanic Warming. Nat. Commun. 2019, 10. [Google Scholar] [CrossRef] [Green Version]
  58. Stopa, J.E.; Cheung, K.F.; Tolman, H.L.; Chawla, A. Patterns and Cycles in the Climate Forecast System Reanalysis Wind and Wave Data. Ocean. Model. 2013, 70, 207–220. [Google Scholar] [CrossRef]
  59. Semedo, A.; Sušelj, K.; Rutgersson, A.; Sterl, A. A Global View on the Wind Sea and Swell Climate and Variability from ERA-40. J. Clim. 2011, 24, 1461–1479. [Google Scholar] [CrossRef]
  60. Aguirre, C.; Rutllant, J.A.; Falvey, M. Wind Waves Climatology of the Southeast Pacific Ocean. Int. J. Climatol. 2017, 37, 4288–4301. [Google Scholar] [CrossRef]
  61. Young, I.R. Seasonal Variability of the Global Ocean Wind and Wave Climate. Int. J. Climatol. 1999, 19, 931–950. [Google Scholar] [CrossRef]
  62. Chaichitehrani, N.; Allahdadi, M.N. Overview of Wind Climatology for the Gulf of Oman and the Northern Arabian Sea. Am. J. Fluid Dyn. 2018, 8, 1–9. [Google Scholar]
  63. Stefanakos, C. Intercomparison of Wave Reanalysis Based on ERA5 and WW3 Databases. In Proceedings of the International Society of Offshore and Polar Engineers, Honolulu, HI, USA, 16–21 June 2019. [Google Scholar]
  64. Bruno, M.F.; Molfetta, M.G.; Totaro, V.; Mossa, M. Performance Assessment of ERA5 Wave Data in a Swell Dominated Region. J. Mar. Sci. Eng. 2020, 8, 214. [Google Scholar] [CrossRef] [Green Version]
  65. Allahdadi, M.N.; He, R.; Neary, V.S. Predicting Ocean Waves along the US East Coast during Energetic Winter Storms: Sensitivity to Whitecapping Parameterizations. Ocean. Sci. 2019, 15, 691–715. [Google Scholar] [CrossRef] [Green Version]
  66. Reguero, B.G.; Losada, I.J.; Méndez, F.J. A Global Wave Power Resource and Its Seasonal, Interannual and Long-Term Variability. Appl. Energy 2015, 148, 366–380. [Google Scholar] [CrossRef]
  67. Dee, D.P.; Uppala, S.M.; Simmons, A.J.; Berrisford, P.; Poli, P.; Kobayashi, S.; Andrae, U.; Balmaseda, M.A.; Balsamo, G.; Bauer, D.P.; et al. The ERA-Interim Reanalysis: Configuration and Performance of the Data Assimilation System. Q. J. R. Meteorol. Soc. 2011, 137, 553–597. [Google Scholar] [CrossRef]
  68. Reguero, B.G.; Menéndez, M.; Méndez, F.J.; Mínguez, R.; Losada, I.J. A Global Ocean Wave (GOW) Calibrated Reanalysis from 1948 Onwards. Coast. Eng. 2012, 65, 38–55. [Google Scholar] [CrossRef]
  69. Onea, F.; Ciortan, S.; Rusu, E. Assessment of the Potential for Developing Combined Wind-Wave Projects in the European Nearshore. Energy Environ. 2017, 28, 580–597. [Google Scholar] [CrossRef]
  70. Onea, F.; Rusu, E. The Expected Efficiency and Coastal Impact of a Hybrid Energy Farm Operating in the Portuguese Nearshore. Energy 2016, 97, 411–423. [Google Scholar] [CrossRef]
  71. Ruiz, A.; Onea, F.; Rusu, E. Study Concerning the Expected Dynamics of the Wind Energy Resources in the Iberian Nearshore. Energies 2020, 13, 4832. [Google Scholar] [CrossRef]
  72. Ribeiro, A.; Costoya, X.; de Castro, M.; Carvalho, D.; Dias, J.M.; Rocha, A.; Gomez-Gesteira, M. Assessment of Hybrid Wind-Wave Energy Resource for the NW Coast of Iberian Peninsula in a Climate Change Context. Appl. Sci. 2020, 10, 7395. [Google Scholar] [CrossRef]
  73. Raileanu, A.; Onea, F.; Rusu, E. An Overview of the Expected Shoreline Impact of the Marine Energy Farms Operating in Different Coastal Environments. J. Mar. Sci. Eng. 2020, 8, 228. [Google Scholar] [CrossRef] [Green Version]
  74. Bento, A.R.; Rusu, E.; Martinho, P.; Guedes Soares, C. Assessment of the Changes Induced by a Wave Energy Farm in the Nearshore Wave Conditions. Comput. Geosci. 2014, 71, 50–61. [Google Scholar] [CrossRef]
Figure 1. Mean wave power over the 30-year time interval considered (1989–2018) based on date from ERA5 (i.e., ECMWF RE-analysis, fifth generation).
Energies 14 00394 g001
Figure 2. Wave power percentiles based on ERA5 data over the 30-year time interval (1989–2018): (a) 50th percentile, (b) 75th percentile, (c) 90th percentile, (d) 95th percentile.
Energies 14 00394 g002
Figure 3. Seasonal variability of the mean wave power over the 30-year time interval (from 1989 to 2018) based on ERA5 data (the seasons correspond to the Northern Hemisphere): winter (DJF: December, January, February), spring (MAM; March, April, May), summer (JJA: June, July, August), autumn (SON: September, October, November).
Energies 14 00394 g003
Figure 4. Inter-annual variability (IAV) for ERA5 wave power over the 30-year time interval (1989–2018).
Energies 14 00394 g004
Figure 5. Mean annual variability (MAV) for wave power over the 30-year time interval (1989–2018).
Energies 14 00394 g005
Figure 6. Mean wave energy density (Ew-CCI) over the 27-year time interval (1992–2018) based on data from CCI-SS (Climate Change Initiative for Sea State).
Energies 14 00394 g006
Figure 7. Mean wave energy density (Ew-ERA5) over the 27-year time interval (1992–2018) based on ERA5.
Energies 14 00394 g007
Figure 8. Maximum values of the mean Ew-CCI and Ew-ERA5 in the Southern and Northern Hemispheres, 27-year time interval (1992–2018), for total data and each season considered.
Energies 14 00394 g008
Figure 9. Normalized differences (%) between climatological means of Ew-CCI and Ew-ERA5 over the 27-year time interval (1992–2018).
Energies 14 00394 g009
Figure 10. Normalized differences (%) between climatological means of Ew-CCI and Ew-ERA5 over the 27-year time interval (1992–2018); the seasons correspond to the Northern Hemisphere: winter (DJF), spring (MAM), summer (JJA), autumn (SON).
Energies 14 00394 g010
Table 1. Altimeter missions used for the Sea State CCI dataset for the time interval 1992–2018 (information processed from [50]).
MissionCovered PeriodRepeat Period (Days)
ERS-11992−200035
TOPEX1992−200610
ERS-21995−201135
GFO1998−200817
JASON-12001−201310
ENVISAT2002−201235
JASON-22008−201810
CRYOSAT-22010−2018369
SARAL2013−201835
JASON-32016−201810
Publisher’s Note: MDPI stays neutral with regard to jurisdictional claims in published maps and institutional affiliations.

