Article

Simultaneous Synergy in CH4 Yield and Kinetics: Criteria for Selecting the Best Mixtures during Co-Digestion of Wastewater and Manure from a Bovine Slaughterhouse

1
Grupo de Investigación en Tecnologías de Valorización de Residuos y Fuentes Agrícolas e Industriales para la Sustentabilidad Energética (INTERFASE), Escuela de Ingeniería Química, Universidad Industrial de Santander—UIS, Carrera 27, Calle 9 Ciudad Universitaria, Bucaramanga 680002, Colombia
2
Energy 2050, Department of Mechanical Engineering, Faculty of Engineering, University of Sheffield, Sheffield S3 7RD, UK
*
Author to whom correspondence should be addressed.
Energies 2021, 14(2), 384; https://doi.org/10.3390/en14020384
Submission received: 19 October 2020 / Revised: 6 December 2020 / Accepted: 8 January 2021 / Published: 13 January 2021
(This article belongs to the Special Issue Biogas for Rural Areas)

Abstract

:
Usually, slaughterhouse wastewater has been considered as a single substrate whose anaerobic digestion can lead to inhibition problems and low biodegradability. However, the bovine slaughter process generates different wastewater streams with particular physicochemical characteristics: slaughter wastewater (SWW), offal wastewater (OWW) and paunch wastewater (PWW). Therefore, this research aims to assess the anaerobic co-digestion (AcoD) of SWW, OWW, PWW and bovine manure (BM) through biochemical methane potential tests in order to reduce inhibition risk and increase biodegradability. A model-based methodology was developed to assess the synergistic effects considering CH4 yield and kinetics simultaneously. The AcoD of PWW and BM with OWW and SWW enhanced the extent of degradation (0.64–0.77) above both PWW (0.34) and BM (0.46) mono-digestion. SWW Mono-digestion showed inhibition risk by NH3, which was reduced by AcoD with PWW and OWW. The combination of low CH4 potential streams (PWW and BM) with high potential streams (OWW and SWW) presented stronger synergistic effects than BM-PWW and SWW-OWW mixtures. Likewise, the multicomponent mixtures performed overall better than binary mixtures. Furthermore, the methodology developed allowed to select the best mixtures, which also demonstrated energy and economic advantages compared to mono-digestions.

1. Introduction

The global meat industry consumes 24% of the total water used for food and beverage production. [1]. Beef production has one of the largest water footprints among all foods (15,400 m3 t−1 of meat) [2]. Animal slaughter and meat processing are the main contributors to the footprint, in terms of water use and wastewater generation. Slaughterhouse wastewater volumes have been reported to be between 0.57 m3 bovine−1 [3] and 4.22 m3 bovine−1 [4]. These wastewaters are characterized by a chemical oxygen demand (COD) between 2000 mg L−1 [5] and 20,400 mg L−1 [6].
The slaughter bovine process varies depending on the available technologies; however, in general, it consists of four stages and generates similar wastewater streams: (i) cattle-yard wastewater (CWW), generated from the preliminary washing of livestock and yards, containing urine and feces; (ii) slaughter wastewater (SWW), which contains blood, rich in protein; (iii) paunch wastewater (PWW), generated in the removal of the digestive tract content, with structural carbohydrates in the form of lignocellulosic material; (iv) offal wastewater (OWW) from the cleaning of the white viscera, therefore containing particles of meat and fat. In middle- and high-income countries, slaughterhouse wastewater streams are generally treated before discharge into local watercourses or sewer systems. Primary treatments are the most common; however, they are costly and sometimes insufficient [7].
Anaerobic digestion is an efficient technology for waste treatment and valorization since compounds are degraded into a biogas (55–70% volume of CH4) and a nutrient-rich sludge [1]. In developing countries, tubular digesters are the most widely used in rural homes, farms and rural sector companies (agricultural and livestock) due to their simple construction and operation [8]. Furthermore, tubular digesters have demonstrated to be adequate for the anaerobic digestion of slaughterhouse wastewater [9]. However, given the biochemical composition of animal slaughter waste (rich in lipids, proteins and lignocellulosic material), anaerobic digestion of these wastes can lead to several problems. During anaerobic digestion, proteins break down to NH3 [10] while lipids hydrolysis produces long-chain fatty acids (LCFA) [11], which can inhibit the process and reduce the biogas production and waste treatment rates. The tolerance of the microbial consortia to inhibitors is characterized by an inhibition coefficient (KI50), which indicates the concentration where the uptake rate is half the maximum [12]. Likewise, the lignocellulosic material from ruminal content presents a low hydrolysis rate coefficient (between 0.10 and 0.12 d−1) [12,13] causing slow anaerobic degradation rates. Slow degradation kinetics require long hydraulic retention times (HRT) [14] and, for a given organic load rate, full-scale results in a larger reactor volume [15]. This leads to a rise in investment, since more than 50% of the fixed costs correspond to the digester [16]. The above problems may limit the widespread tubular digester use for slaughterhouse wastewater treatment.
Anaerobic Co-digestion (AcoD) has been used as an approach to mitigate the aforementioned drawbacks, given the potential synergies between co-substrates towards the reduction of inhibition and increase of both the extent and rate of biodegradation. In this regard, most AD studies consider slaughterhouse wastewater as a single substrate (a mixture of CWW, SWW, OWW and PWW in the proportion of its generation). However, in a study by Jensen et al. (2014) [4], it was evidenced how each stream has particular characteristics and can be treated as an individual substrate. Moreover, bovine manure (BM) is an excellent base substrate (carrier) [17]. Therefore, an adequate mixture of these substrates can enhance the performance of the anaerobic digestion process, without requiring further external substrates. Nonetheless, to the best of authors’ knowledge, the AcoD of different slaughter wastewater streams has not been explored in previous studies.
Usually, AcoD studies have evaluated the synergy between co-substrates focused on CH4 yield [18,19] while the kinetics (rate of degradation) in most cases is evaluated with mathematical models, without determining whether there is synergy in the kinetic factors [17,20]. Thus far, three methodologies have been published to assess synergy in kinetic parameters. Pagés-Diaz et al. (2014) [21] implemented a mixture design to evaluate an AcoD process, then adjusted the results to statistical models and estimated the significance of the regression coefficients. This methodology is extensive and its precision depends on the correct selection of the statistical model to evaluate the synergy. Ebner et al. (2016) [22] proposed a co-digestion rate index (CRI) based on the ratio of the experimental apparent hydrolysis rate coefficient over its expected value. The authors demonstrated, through numerical estimation, how the weighted geometric mean of the hydrolysis rates of the single substrates is the best estimate for the expected combined co-digestion rate. The numerical procedure added the curves of pairs of substrates, fitted the first-order model to the experimental co-digestion data and compared the resulting hydrolysis rate coefficient with different statistical means of the individual substrates. Thus, the application of the above methodology to other kinetic models (with more parameters compared to the first-order model) could be too complex. Donoso-Bravo et al. (2019) [23] presented a simpler method that consists of the linear combination (weighted arithmetic mean) of the kinetic parameters, which could be applied to any model. However, this methodology does not consider the complexity of kinetic interaction and the error introduced by an approximation with arithmetic mean. Thus, the above approaches can be tedious or lead to uncertainties in the evaluation of the kinetic synergy.
Based on the above review of co-digestion studies and modeling, the main contributions of this study are: (i) the evaluation of the performance of AcoD of novel mixtures of bovine slaughterhouse wastewater streams and manure, with a focus on reducing potential inhibition and biodegradability problems; (ii) the development of a methodology to assess the synergy between co-substrates, which considers both CH4 yield and kinetics in a practical and accurate way, (iii) the application of the methodology to select the best mixtures between slaughterhouse wastewater streams and BM. The methodology proposed in the current study differs from those reported in the literature since the synergy was evaluated directly from the expected biochemical methane potential (BMP) curves without approximations (statistical models, arithmetic mean or geometric mean), which reduces the errors in parameters estimation. In addition, the energy and economic feasibility of the AcoD of synergistic mixtures was evaluated from the results of the BMP assays and the modeling.

2. Materials and Methods

The current study employed a four-part methodology: (1) experimental evaluation of AcoD of slaughterhouse wastewater streams and BM, (2) implementation and evaluation of kinetic models, (3) evaluation of synergistic effects and (4) energy and economic analysis of the implementation of AcoD in slaughterhouses. For the first part, the substrates and inoculum were collected. Then, a statistical mixture design was applied to prepare different combinations of wastewater streams and BM, which were tested by BMP assays to obtain the ultimate experimental specific CH4 yield (Bo). The theoretical specific CH4 yield (Both) was calculated from the composition of the mixtures; thereafter, the extent of degradation (fd) was calculated from the value of Bo and Both. In the second part, both the first-order and the modified Gompertz models were calibrated against the BMP experimental data, and the most suitable kinetic model was selected based on fit. In the third part, the synergistic effects of AcoD on CH4 yield and kinetics were evaluated by a comparison between the experimental and the model-based expected values. Finally, taking as a case study a Colombian slaughterhouse, the energy and economic feasibility of AcoD of synergistic mixtures was evaluated by the electrical and thermal potentials, the payback period (PBP), Net Present Value (NPV) and Internal Rate of Return (IRR).

2.1. Evaluation of Anaerobic Co-Digestion (AcoD)

2.1.1. Substrates and Inoculum Origin

Fresh bovine manure (BM) and samples of slaughter wastewater (SWW), offal wastewater (OWW) and paunch wastewater (PWW) were obtained from a Colombian slaughterhouse (Floridablanca-Santander: Latitude 7°3′14.82″ N and longitude 73°7′55.82″ W). The OWW stream comes from the cleaning of white viscera (intestines and stomachs). The wastewater from the cleaning of red viscera (liver, heart, tongue, lungs, kidney and spleen) makes up the SWW stream. The main operational characteristics of the case study slaughterhouse are presented in Table 1.
The substrates were characterized by measuring pH, total solids content (TS), volatile solids content (VS), chemical oxygen demand (COD), total alkalinity (TA), total volatile fatty acids (TVFAs) and biochemical composition (carbohydrates, lipids and proteins) (Table 2)
The reactors were inoculated with mesophilic sludge from a small biogas plant located in an organic farm (Floridablanca-Santander, Colombia: Latitude 7°01′0.07″ N and longitude 73°08′13.3″ W). The main characteristics of the inoculum used were: 33.70 ± 0.11 kg TS m−3, 19.95 ± 0.14 kg VS m−3, 8.09 ± 0.03 pH, TA of 2.57 ± 0.10 kg CaCO3 m−3, TVFAs of 1.42 ± 0.12 kg CH3COOH m−3, specific methanogenic activity (SMA) of 0.035 ± 0.005 kg COD kg−1 VS d−1 and a coefficient of inhibition by NH3 (KI50-NH3) of 18.53 ± 0.34 mg L−1. The same inoculum source has been utilized in previous studies [24].

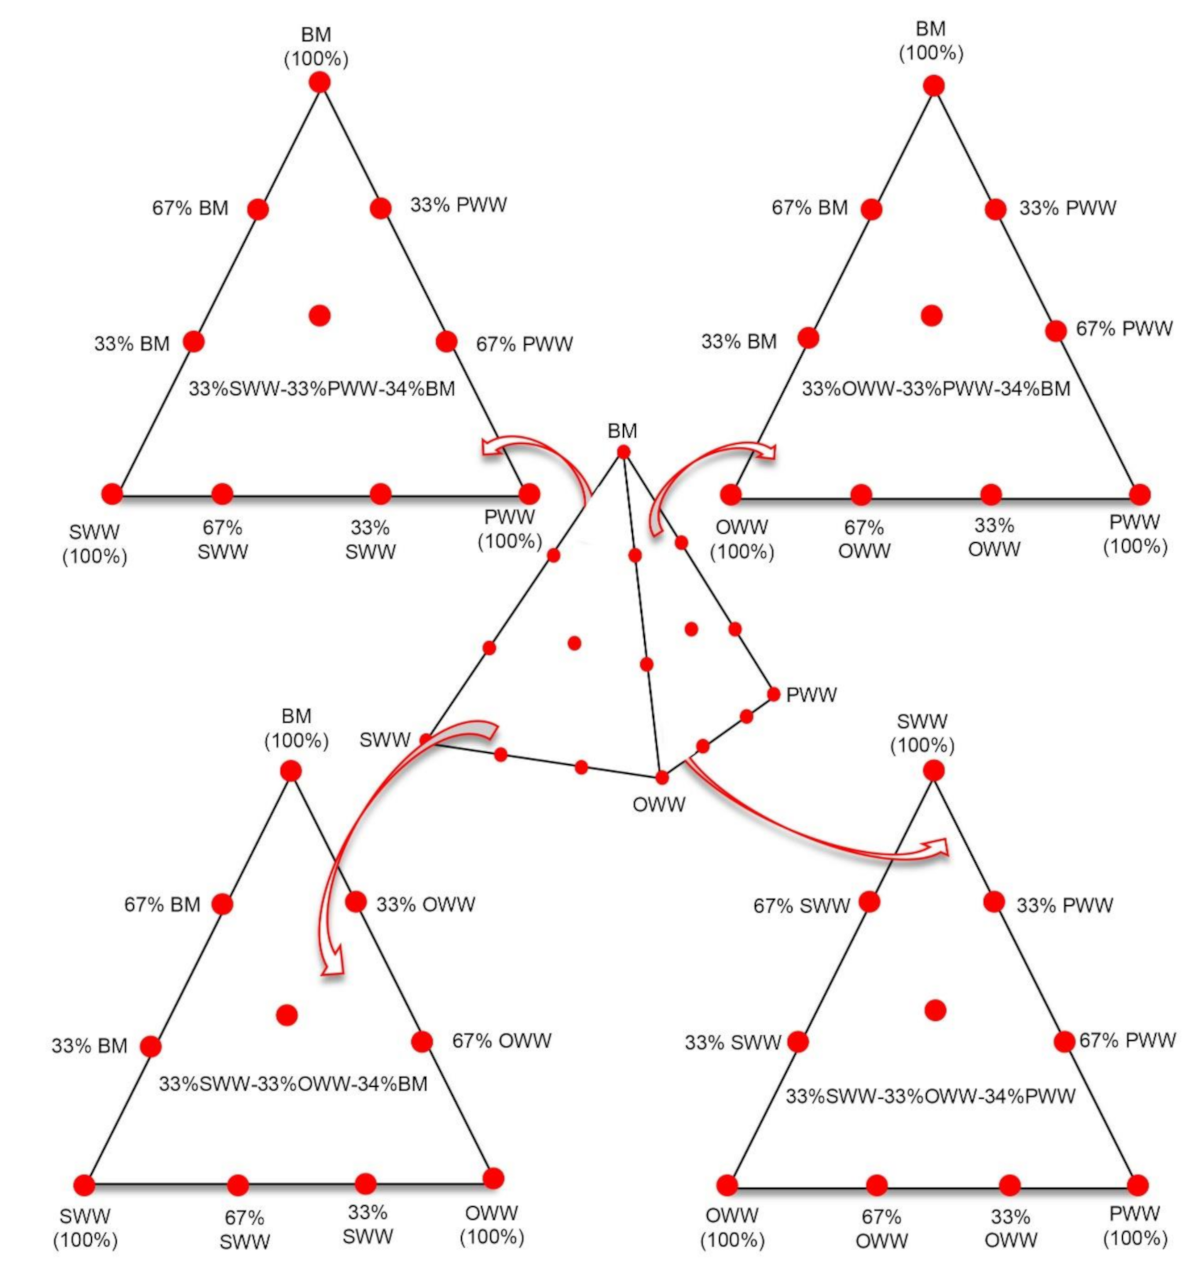
2.1.2. Experimental Mixture Design

In order to eliminate the randomness of blending, the assay was based on a simplex lattice design {4,3} augmented with the overall centroid. Mixtures were based on the organic load expressed in VS. The mixture design was created using STATGRAPHICS Centurion XVI (StatPoint Technologies, Inc. Warrenton, VA, USA) and represented graphically as a tetrahedron made up of a triangular base and three triangular faces called simplex (Figure 1). Each simplex consisted of 10 points (mixture ratios) where vertices corresponded to ratios with 100% single substrate. The upper vertex of the tetrahedron was the pure BM ratio. Vertices on the base of tetrahedron comprised pure ratios of 100% SWW, 100% OWW, and 100% PWW. Points on the axis corresponded to binary mixtures. Interiors points on each simplex corresponded to ternary mixtures. Additionally, there is a central point in the tetrahedron, for a total of 21 mixtures (Table 3).

2.1.3. Ultimate Experimental Specific CH4 Yield (Bo)

In order to determine the ultimate experimental specific yield Bo, BMPs assays were run according to the protocol presented by Holliger et al. (2016) [25] for organic material in 100 mL digesters (60 mL working volume). Assays were prepared with an inoculum to substrate ratio (ISR) of 2 (based on the amount of VS). For all the assays, the initial pH was between 7.0 and 8.0 and the buffer capacity, expressed as the ratio of total volatile fatty acid and total alkalinity (TVFAs/TA) [26], ranged from 0.2 to 0.4; these values are within the recommended range by the BMP protocol, and therefore, no buffers were added to adjust them. The digesters were flushed with pure N2 and sealed using butyl rubber and an aluminum cap. Blanks, containing inoculum and deionized water to replace the substrate, were used to estimate the endogenous CH4 production of the inoculum. All digesters were incubated at 37 ± 2 °C and mixed by manual inversion once per day. The CH4 production was quantified by the volumetric displacement of an alkaline solution. The accumulated volume of CH4 displaced was adjusted to standard temperature and pressure conditions (STP: 273 K and 1 atm) and the specific CH4 yield was expressed on the basis of VS added (m3 CH4 kg−1 VS) [27]. A separate positive control was conducted using cellulose resulting in a CH4 yield of 0.364 ± 0.013 m3 kg−1 VS (88% of the theoretical specific CH4 yield of cellulose). All tests, blanks and control were performed in triplicate. The BMP assays were terminated once the daily CH4 production for all mixtures decreased below 1% of the accumulated volume during three consecutive days, which resulted in a duration of the assays of 30 days.

2.1.4. Theoretical Specific CH4 Yield (Both)

The theoretical specific yield Both allows the prediction of the maximum CH4 production from a specific waste. This can be calculated from the knowledge of the composition of substrates and mixtures in terms of their biochemical fractions (i.e., carbohydrates, proteins, lipids) [28], as shown in Equation (1):
B o t h = 0.415   x _ C a r b o h y d r a t e s + 0.496   x _ P r o t e i n s + 1.014   x _ L i p i d s
The biochemical fractions (x) are given in VS and Both in STP m3 CH4 kg−1 VS; the carbohydrate fraction includes both non-structural and structural carbohydrates.

2.1.5. The Extent of Degradation (fd)

The level of anaerobic biodegradability of a waste can be determined by comparing the ultimate experimental specific CH4 yield Bo with the theoretical value Both, as shown in Equation (2) [29]:
f d = B o B o t h
where fd is a key parameter used to indicate the fraction of the waste that may be transformed into CH4.

2.1.6. Analytical Procedures

TS, VS, COD, pH, total Kjeldahl nitrogen and lipids (Soxhlet) were determined conforming to standard methods [30]. TA and TVFAS were measured according to the method of Lahav and Morgan (2004) [31]. TA was quantified by titration of the sample with a 0.1 N HCl solution to a pH endpoint of 3. Then, the sample was boiled lightly for 3 min to completely remove the dissolved CO2. Thereafter, the amount of NaOH solution 0.1 N required to elevate the pH from 3 to 6.5 was recorded to calculate TVFAs. Cellulose, hemicellulose and lignin were determined from fiber fractions: neutral detergent fiber (NDF), acid detergent fiber (ADF) and lignin. The hemicellulose and cellulose contents were calculated as the differences between NDF and ADF and between ADF and ADL, respectively [32]. Protein composition was calculated from the ratio of 6.25 g protein per g of organic nitrogen. Organic nitrogen was determined by the subtraction between Kjeldahl nitrogen and ammoniacal nitrogen [33]. Non-lignocellulosic carbohydrates (e.g., sugars, starch and pectin) were obtained by difference. SMA and KI50-NH3 of the inoculum were determined following the procedure by Astals et al. (2015) [34]. NH4+ concentration was measured by a test (Spectroquant ammonium test Merck) analogous to APHA 4500-NH3 F [30]. NH3 concentration [mg NH3-N L−1] was determined by Equation (3), where TAN [mg N L−1] is the total ammonia nitrogen in the forms of NH3 and NH4+, Ka is the acid-base equilibrium constant and γ1 is the activity coefficient [35]:
N H 3 N = K a . T A N . γ 1 K a . γ 1 + 10 p H
T A N = N H 3 N + N H 4 + N
At the BMP assays temperature (37 °C) Ka is 1.27 × 10. The values of γ1 were obtained from Equations (5) and (6) [35]:
log γ 1 = 0.5. z i 2 . I 1 + I 0.20. I
I = 1 2 z i 2 . C i
where zi is the valence of the ion i, I is the ionic strength [mol L−1] and Ci is the concentration of the ion i [mol L−1]. For the calculations, the only ion considered was NH4+.

2.2. Kinetic Modeling

The first-order model (Equation (7)) and the modified Gompertz model (Equation (8)) were compared based on their fitting to the BMP curves from AcoD of slaughterhouse wastewater streams and BM. The first-order model has been used in previous studies to describe the cumulative CH4 production of various organic wastes [20,36] when the hydrolysis step is rate-limiting:
B s = P   1 exp k h . t
where Bs [m3 CH4 kg−1 VS] is the simulated specific CH4 yield at time t [d], P [m3 CH4 kg−1 VS] is the simulated ultimate specific CH4 yield and kh is the apparent hydrolysis rate coefficient [d−1]. In cases where biogas production is proportional to the microbial activity, the modified Gompertz model is more suitable than the first-order model [37]:
B s = P   exp exp R m a x   . e P λ t + 1
where λ is the lag-phase [d], Rmax is the maximum specific CH4 production rate [m3 CH4 kg−1 VS d−1] and e is exp (1) = 2.7183.
The models were fitted to curves from BMP assays in Aquasim 2.1d (Swiss Federal Institute of Aquatic Science and Technology—Eawag). Parameters were estimated by a weighted least square method, minimizing the cost function shown in Equation (9) [38]:
χ 2 =   i = 1 n B m , i B s , i r σ m , i 2
where Bm,i is the ith measured value of the accumulated CH4 volume, assumed to be a normally distributed random variable, Bs,i(r) is the model prediction, a function of the set of parameters r to be estimated, at the time corresponding to ith data point and σm,i is the standard error of the measurement Bm,i, calculated from the values of the replicates, which weights each term of the sum. The standard errors of the measurements were calculated according to Holliger et al. (2016) [25] (Equation (10)):
σ m = σ b l a n k 2 + σ s u b s t r a t e 2 2
As a minimization technique, the Secant Algorithm implemented in Aquasim was used. The tolerance for convergence in the objective function was 4 × 10⁻³. In order to check the convergence of the algorithm to the same optimum parameter values, different initial guesses of target parameters were used. The confidence interval of the estimated parameters was expressed as standard error, as calculated by the Secant Algorithm in Aquasim.
The accuracy of model predictions with respect to the experimental results was analyzed by the regression coefficient (R2), and the normalized root mean square error (NRMSE):
NRMSE = i = 1 n B s , i B m , i 2 n B m ¯
where Bs,i, Bm,i and B m ¯ are the simulated, measured and the mean specific CH4 yields, respectively, and n is the number of experimental data points.

2.3. Evaluation of Synergistic Effects

The synergistic effects were evaluated for both the yield and the kinetic of the CH4 production (Table 4). The ϕ factors were calculated following the approach of Castro-Molano et al. (2018) [39].
The expected values of the parameters used were determined from predictive BMP curves (BP) of co-digestion, calculated from the BMP curves (Bm) of the single substrates and assuming that the CH4 production in co-digestion would be the weighted production of the single substrates. For all mixtures, BP was, therefore, calculated as the summation of the products of the experimental Bm of single substrates j by their respective VS fraction in the mixture (αj), as shown in Equation (12):
B P = j = 1 n B m , j · α j
The expected Bo was taken as the ultimate CH4 yield of the predictive curve, whereas the expected kinetic parameters λ, Rmax and kh were obtained from the calibration of the modified Gompertz and first-order models against the values of the predictive BMP curves BP.

2.4. Energy and Economic Considerations

In order to evaluate the feasibility of implementing the AcoD of slaughterhouse wastewater streams and bovine manure, an energetic and economic study was performed based on the results of the BMP assays and modeling. Moreover, the technical and economic advantages of synergistic mixtures were compared to a monodigestion-only scenario. The electrical (PEE) and thermal (PTE) energy potentials [kWh m−3] were calculated by Equations (13) and (14) [40]:
P E E = V S . B o . P c . η E
P T E = V S . B o . P c . η T
where VS is the mixtures volatile solids content [kg m−3], Bo is the ultimate specific CH4 yield [STP m3 CH4 kg−1 VS] obtained from the previous analyses, Pc is the lower heating value of CH4 (10 kWh m−3) and ηE and ηT are the electric and thermal efficiencies, which were assumed to be 25% (electric generator) and 80% (boiler), respectively [41]. Based on PEE and PTE, an economic evaluation was performed considering the design assumptions, CAPEX (capital expenditures), OPEX (operational expenditures) and Benefits, shown in Table 5.
The waste flow values correspond to 10% of the total generated streams in the slaughterhouse considered as a case study (Table 1). The volume of the digester (VD) [m3] for CAPEX was calculated from waste flows (Q) [m3 d−1] and the HRT [d], considering an operational volume of 75% of the total digester volume (Equation (15)) [8]:
V D = Q . H R T . 0.75 1
HRT was estimated as the difference between the duration time of the BMP assays and the λ obtained from the modified Gompertz Model [14]. The cost of the digester was calculated based on the volumes and prices available on the Colombian market for plastic tubular digesters. Slaughterhouses need steam and hot water for cleaning, so usually, they have boilers for this purpose. Therefore, the economic analysis did not consider further CAPEX costs for the conversion of CH4 to thermal energy. In the OPEX, the labor costs correspond to the payment of a legal Colombian minimum wage, corresponding to the one worker that is needed to operate the anaerobic digestion system (8 h a day, 6 days a week, 1.52 US $ h−1 including social benefits). Regarding the benefits, the electricity and natural gas prices and cost of wastes treatment were supplied by the case study slaughterhouse.
The aforementioned data allowed to calculate the payback period (PBP), net present value (NPV) and internal rate of return (IRR). An equipment lifetime of 10 years was considered, with a discount rate of 10% and inflation of 3.85%.

2.5. Statistical Analysis

A one-way ANOVA (Analysis of Variance) facilitated the data analysis and detection of significant differences between mixtures with respect to variables Bo and fd (p-values < 0.05), and allowed to estimate the standard deviation.

3. Results and Discussion

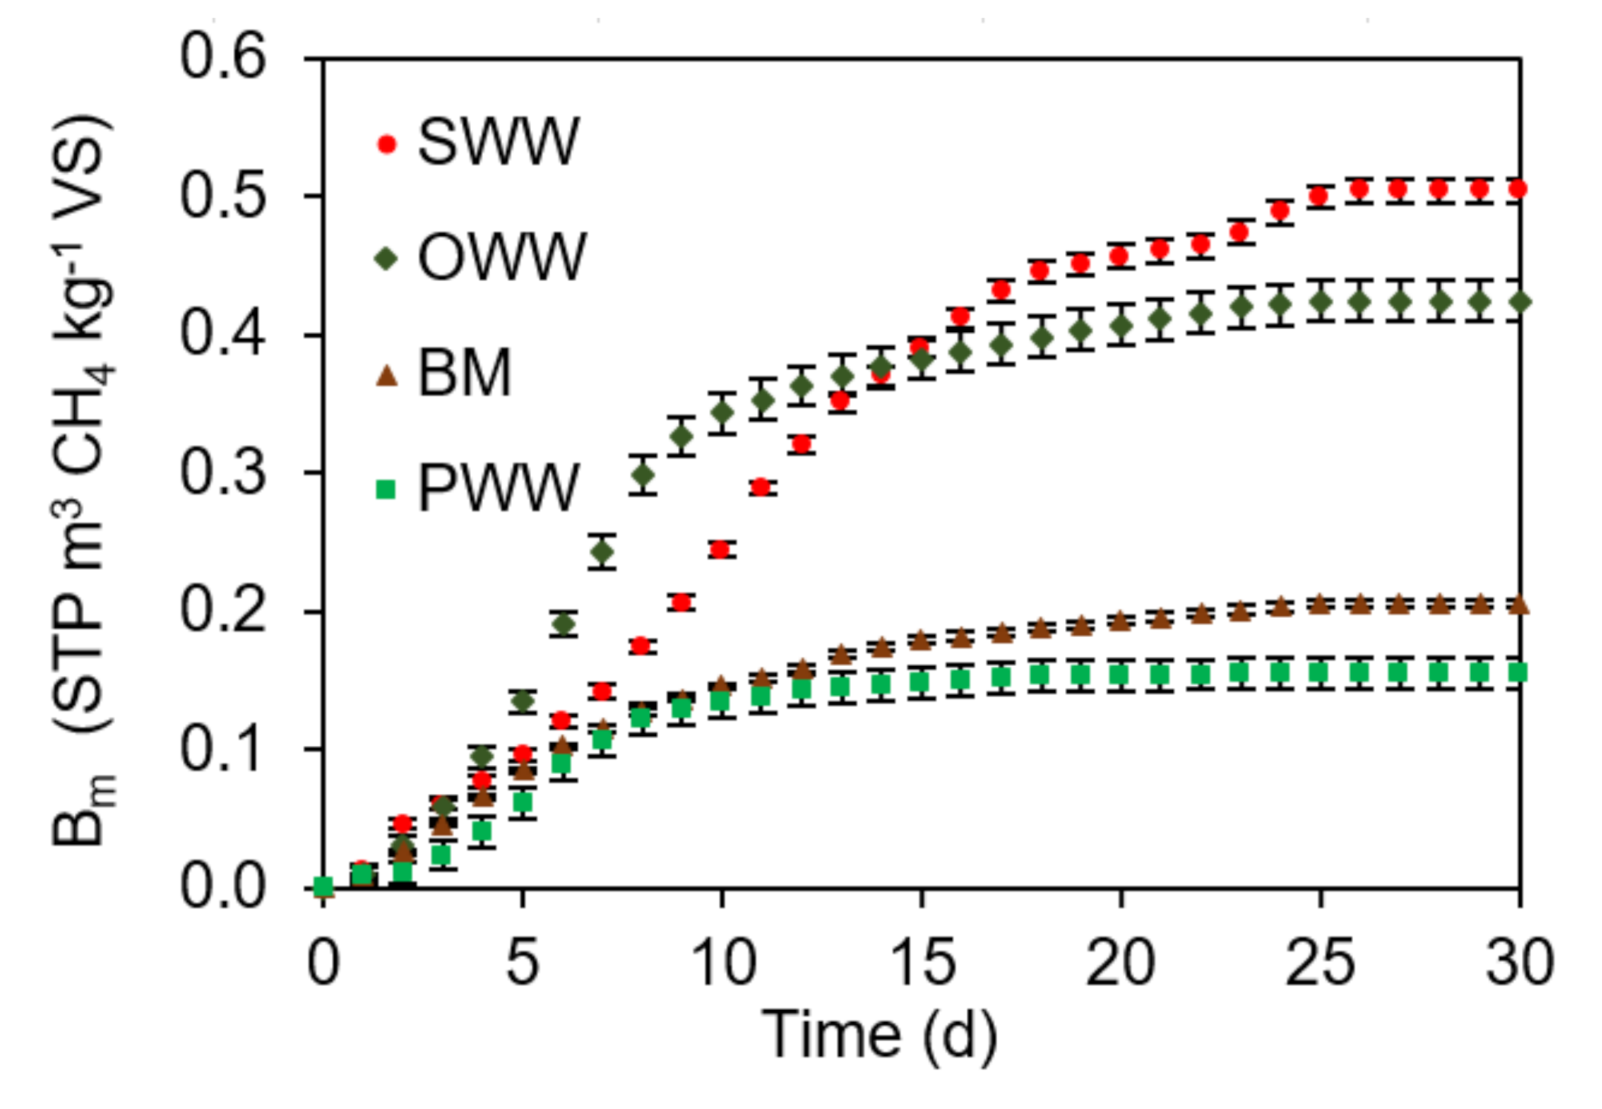
3.1. Ultimate Experimental Specific CH4 Yield (Bo) of Single Substrates

The results from the BMP assays of the single substrates are shown in Figure 2. Depending on the prevalent biochemical composition of the substrates, it is possible to divide the results into two groups. The first group includes the substrates with lignocellulosic nature, namely the Paunch Wastewater (PWW) and Bovine Manure (BM), which had low CH4 production due to their high content in scarcely degradable lignocellulose (Table 2): from the start of the BMP assay until day 12, the cumulative CH4 yields of both substrates were almost similar (Figure 2). However, from day 12, the increase of the PWW yield slowed down and approached its plateau, whereas the BM yield continued to rise until reaching its stable value from approximately day 25. The above behaviors are similar to those found in previous studies on digestion of bovine manure [44] and PWW [13], showing a relatively higher rate of degradation of PWW compared to manure.
BM resulted in a Bo, at 30 days, of 0.206 ± 0.003 m3 CH4 kg−1 VS and an fd of 0.46 ± 0.00, which are in the range of Bo values reported for dairy manure (0.089–0.303 m3 CH4 kg−1 VS) [44,45] and close to the biodegradability published in previous studies (0.54) [22]. PWW resulted in a Bo and an fd of 0.154 ± 0.011 m3 CH4 kg−1 VS and 0.34 ± 0.01, respectively. These values are lower than those found for PWW in Australian slaughterhouses (0.309 m3 CH4 kg−1 VS and 0.84) [13]. Since the composition of ruminal content depends on how long the grass remains in the stomachs of animals [46], the above differences can be attributed to variations in the animals handling before slaughter. According to Australian regulation, animals must stay 24 h in yards before slaughter to be checked and to ensure that they are healthy [47]. However, in Colombian slaughterhouses, animals can be slaughtered 6 h after arrival [48].
The second group is formed by Offal Wastewater (OWW) and Slaughter Wastewater (SWW), which, contrary to the first group, are richer in lipids and proteins (Table 2), resulting in a relatively higher CH4 production (Figure 2). During the first 3 days, the CH4 yield of OWW and SWW did not present significant differences (p > 0.05). However, from day 4 to 10, the CH4 yield of OWW increased at a higher rate than SWW and then slowed down from day 11 until it reached a steady-state at about day 25. On the other hand, in the case of SWW, the CH4 yield presented an almost constant increase until about day 17, where it declined and achieved a plateau on day 25. Previous studies have shown how anaerobic digestion of wastes with high lipid concentrations result in a long lag period, due to LCFA accumulation and inhibition. For instance, Jensen et al. (2014) [4] reported a lag period of 18 days during anaerobic digestion of lipid-rich wastewater (10 g/L). In turn, Harris et al. (2018) [49] evidenced 7 days of lag period for anaerobic digestion of DAF (dissolved air flotation) sludge (10.5 g lipid/L). Likewise, Andriamanohiarisoamanana et al. (2017) [17] found that the BMP curve of crude glycerol presented an atypical shape (constant increase in the first 5 days followed by a slow CH4 production until day 15 and then an exponential behavior) due to LCFA inhibition. On the contrary, in the current study, the BMP assays of SWW and OWW started CH4 production from the first day, their curves had a typical behavior and their lipids concentration was lower than 10 g/L. This indicates how LCFA is unlikely to be a source of inhibition during anaerobic digestion of the tested slaughterhouse wastewater streams.
Ammonia is another potential cause of inhibition, which results from substrates with high protein content. In this regard, the BMP assay with SWW presented a final NH3 concentration of 21.12 ± 0.25 mg L−1, which is higher than the measured inhibition coefficient KI50-NH3 of the inoculum (18.53 ± 0.34 mg L−1). Various studies investigated ammonia inhibition effects on BMP assays and reported experimental curves that were qualitatively similar to the present study. For instance, Nielsen and Angelidaki (2008) [50] evaluated the anaerobic digestion in BMP assays of cattle manure, with different initial total-N concentrations. The ammonia inhibition was evidenced in the slope of the cumulative CH4 curves, which decreased with increasing initial nitrogen. In particular, samples with a total-N concentration of 3.0 g L−1 and 3.5 g L−1 achieved the same ultimate CH4 yield. However, the former sample reached 80% of its ultimate CH4 yield at 13 days while the latter reached 80% at 21 days; this result also highlights how ammonia inhibition follows a threshold behavior [35]. Similarly, Cuetos et al. (2017) [51] investigated the effect of active carbon addition in the anaerobic digestion of poultry blood (which is similar to the slaughter wastewater of this study). The experiments with lower activated carbon contents resulted in NH3 inhibition and a significantly lower rate at the beginning of the BMP curve (specifically, during the first 13 days). The aforementioned analysis and studies confirm the likelihood of NH3 accumulation and inhibition during the mono-digestion of SWW.
SWW and OWW BMP assays resulted in a Bo of 0.505 ± 0.008 and 0.425 ± 0.015 m3 CH4 kg−1 VS, respectively. Although OWW has the highest lipids content, it presented lower Bo than SWW due to the concomitant presence of lignocellulosic material (Table 2). The Bo of SWW was close to the values of 0.500 and 0.570 m3 CH4 kg−1 VS reported in the studies of Jensen et al. (2014; 2015) [4,52], while the fd resulted in a value of 0.80 ± 0.01, which is close to the results of a similar BMP study investigating blood biodegradability (fd of 0.77) [12]. On the other hand, the Bo of OWW is lower when compared to studies investigating similar substrates. For instance, Jensen et al. (2014) [4] found a Bo between 0.721 and 0.931 m3 CH4 kg−1 VS for an offal wastewater stream. Nevertheless, this wastewater also contained the waste stream from the cleaning of red viscera, resulting in a higher lipid concentration (up to 11.64 kg m−3) compared to the OWW stream in the current study, thus explaining the relatively higher Bo. Regarding the fd from OWW (0.63 ± 0.02), to the best of the author’s knowledge, there is no available comparison in the literature.

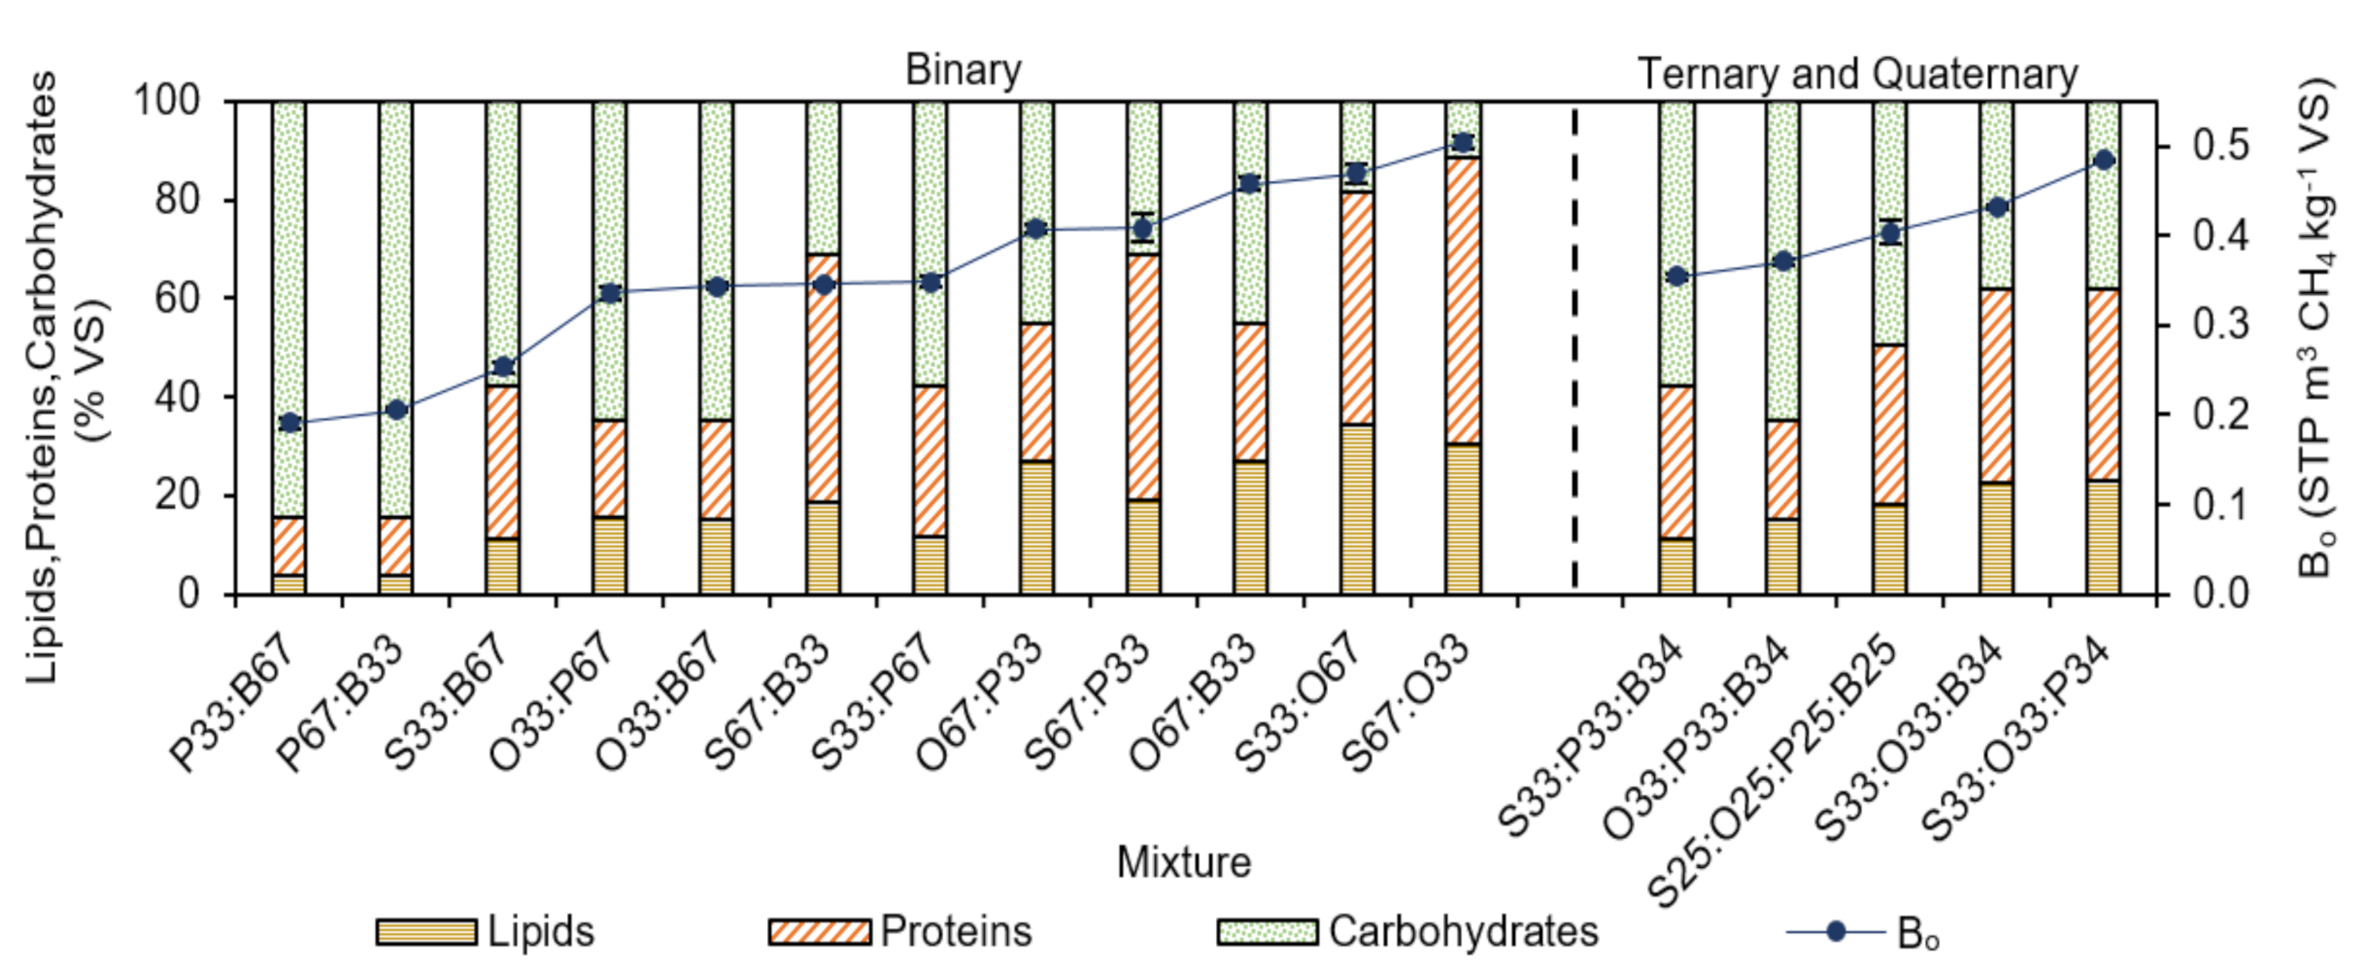
3.2. Experimental Ultimate Specific CH4 Yield of AcoD

Figure 3 shows the composition (lipids, proteins and carbohydrates) and the ultimate experimental yield Bo of the different AcoD mixtures evaluated (the BMP curves are depicted in Supplementary Data Figure S1). On the whole, for both binary and multicomponent mixtures, the Bo increased directly with the proportion of lipids and decreased with the proportion of carbohydrates. Therefore, the highest Bo corresponds to the binary mixtures of SWW and OWW (S33:O67 and S67:O33) and the ternary mixtures where SWW and OWW were present simultaneously (S33:O33:B34 and S33:O33:P34).
The ternary and quaternary mixtures had significantly higher Bo (p < 0.05) than binary mixtures with a similar biochemical composition. For instance, the combinations with the mixing ratio of S33:B67 and S33:P33:B34 have almost the same composition (~11%VS lipids, ~31%VS protein and ~58%VS carbohydrates); however, the latter mixture showed a Bo 40% higher than the former. Likewise, the ternary mixture O33:P33:B34 exhibited a Bo 10% higher than binary mixtures O33:P67 and O33:B67, despite having similar compositions (~15%VS lipids, ~20%VS protein and ~65%VS carbohydrates). When comparing the ternary mixtures with the highest Bo (mixtures S33:O33:B34 and S33:O33:P34) to the binary mixture with the highest Bo (S67:O33), the ternary mixtures have similar Bo (4–14% difference), while having 33% fewer proteins and 25% fewer lipids than the binary mixture. The above evidence a higher synergy between macromolecules on CH4 production in multicomponent mixtures than in binary mixtures. This result is in agreement with the study by Astals et al. (2014) [12], who suggested that in addition to macro-composition, the structure of the substrates also affects their interaction. In this sense, there are differences in carbohydrates structure between PWW and BM and the kind of proteins between SWW and OWW.
The effects of AcoD on the reduction of initial lignocellulosic material composition and final NH3 concentration (see Supplementary Data Table S1 for NH3 calculation details) are shown in Table 6, taking biodegradability (fd) as an indicator. In the case of BM and PWW, the co-digestion with OWW and SWW in binary or multicomponent mixtures allowed to achieve mixtures with relatively lower lignocellulosic content; this reduced the recalcitrant character of the mixture and as a consequence increased the biodegradability fd above the values of both BM and PWW mono-digestion (0.46 and 0.34, respectively). On the contrary, the binaries AcoD between BM and PWW presented a high lignocellulosic composition, which resulted in an fd around 0.44. Previous studies have demonstrated that the AcoD with lignocellulosic residues is an alternative to enhance the C/N ratio of animal manure; however, this requires pretreatment [53].
In the case of OWW, all its mixtures presented higher fd than its mono-digestion (0.63), since fatty wastes are suitable co-substrates to lignocellulosic and protein wastes [12]. In turn, SWW showed the highest degradability of individual substrates (0.80) due to its content of soluble proteins in the blood (e.g., albumin and globulin), which are hydrolyzed fast and then converted to CH4 while producing NH3. In the case of SWW, AcoD offers the opportunity to reduce the risk of ammonia inhibition, through mixtures with substrates with lower protein content. For instance, the addition of PWW to SWW in binary mixtures allowed to reduce the inhibition risk by NH3 and achieved an fd around 0.7. The ternary mixture with a mixing ratio S33:O33:P34 exhibited an fd (0.83) higher than SWW mono-digestion, which is consistent with its balanced composition of carbohydrates, lipids and proteins (Figure 3).
On the other hand, important inhibition risk occurred during binary AcoD mixtures between BM and SWW, as indicated by the final NH3 concentration being higher than KI50-NH3, which led to a significantly lower fd (p < 0.05) than the other AcoD mixtures of SWW. A similar result was presented by Andriamanohiarisoamanana et al. (2017) [17], who investigated the AcoD of meat and bone meal and manure in BMP assays. This study showed how the increase of meat and bone meal content from 10% to 66%VS caused inhibition by NH3 and, as a consequence, the conversion rate of meat and bone meal to CH4 was reduced. In the current study, the inhibitory effects between SWW and BM were mitigated in ternary and quaternary mixtures by dilution with OWW and PWW. Similarly, previous studies have highlighted lignocellulosic as a suitable co-substrate for anaerobic digestion of blood. For instance, López et al. (2006) [54] evaluated the AcoD of ruminal content and blood in batch digesters. The results showed an organic matter degradation from 55 to 70% when ruminal content/blood ratio (on a TS basis) varied between 2 and 8; the authors highlighted how during AcoD blood generates extra buffer capacity and brings micronutrients to the system. Cuetos et al. (2013) [55] conducted batch experiments on AcoD of poultry blood with maize residues. When maize concentration increased from 15% to 70% (VS basis), the CH4 production raised from 0.130 to 0.188 m3 kg−1 VS. Similarly, also in CSRT digesters, the AcoD of blood and organic fraction of municipal solid waste has been implemented in order to achieve stable operations, with a CH4 yield between 0.200 and 0.289 m3 kg−1 VS [56].
Because of the aforementioned drawbacks, the mixtures between BM and PWW and between BM and SWW can lead to low values of biodegradability and instabilities, respectively, in the digestion process (see bold/italic values in Table 6). Hence, these mixtures were excluded from the following sections to focus on the seemingly synergistic mixtures.

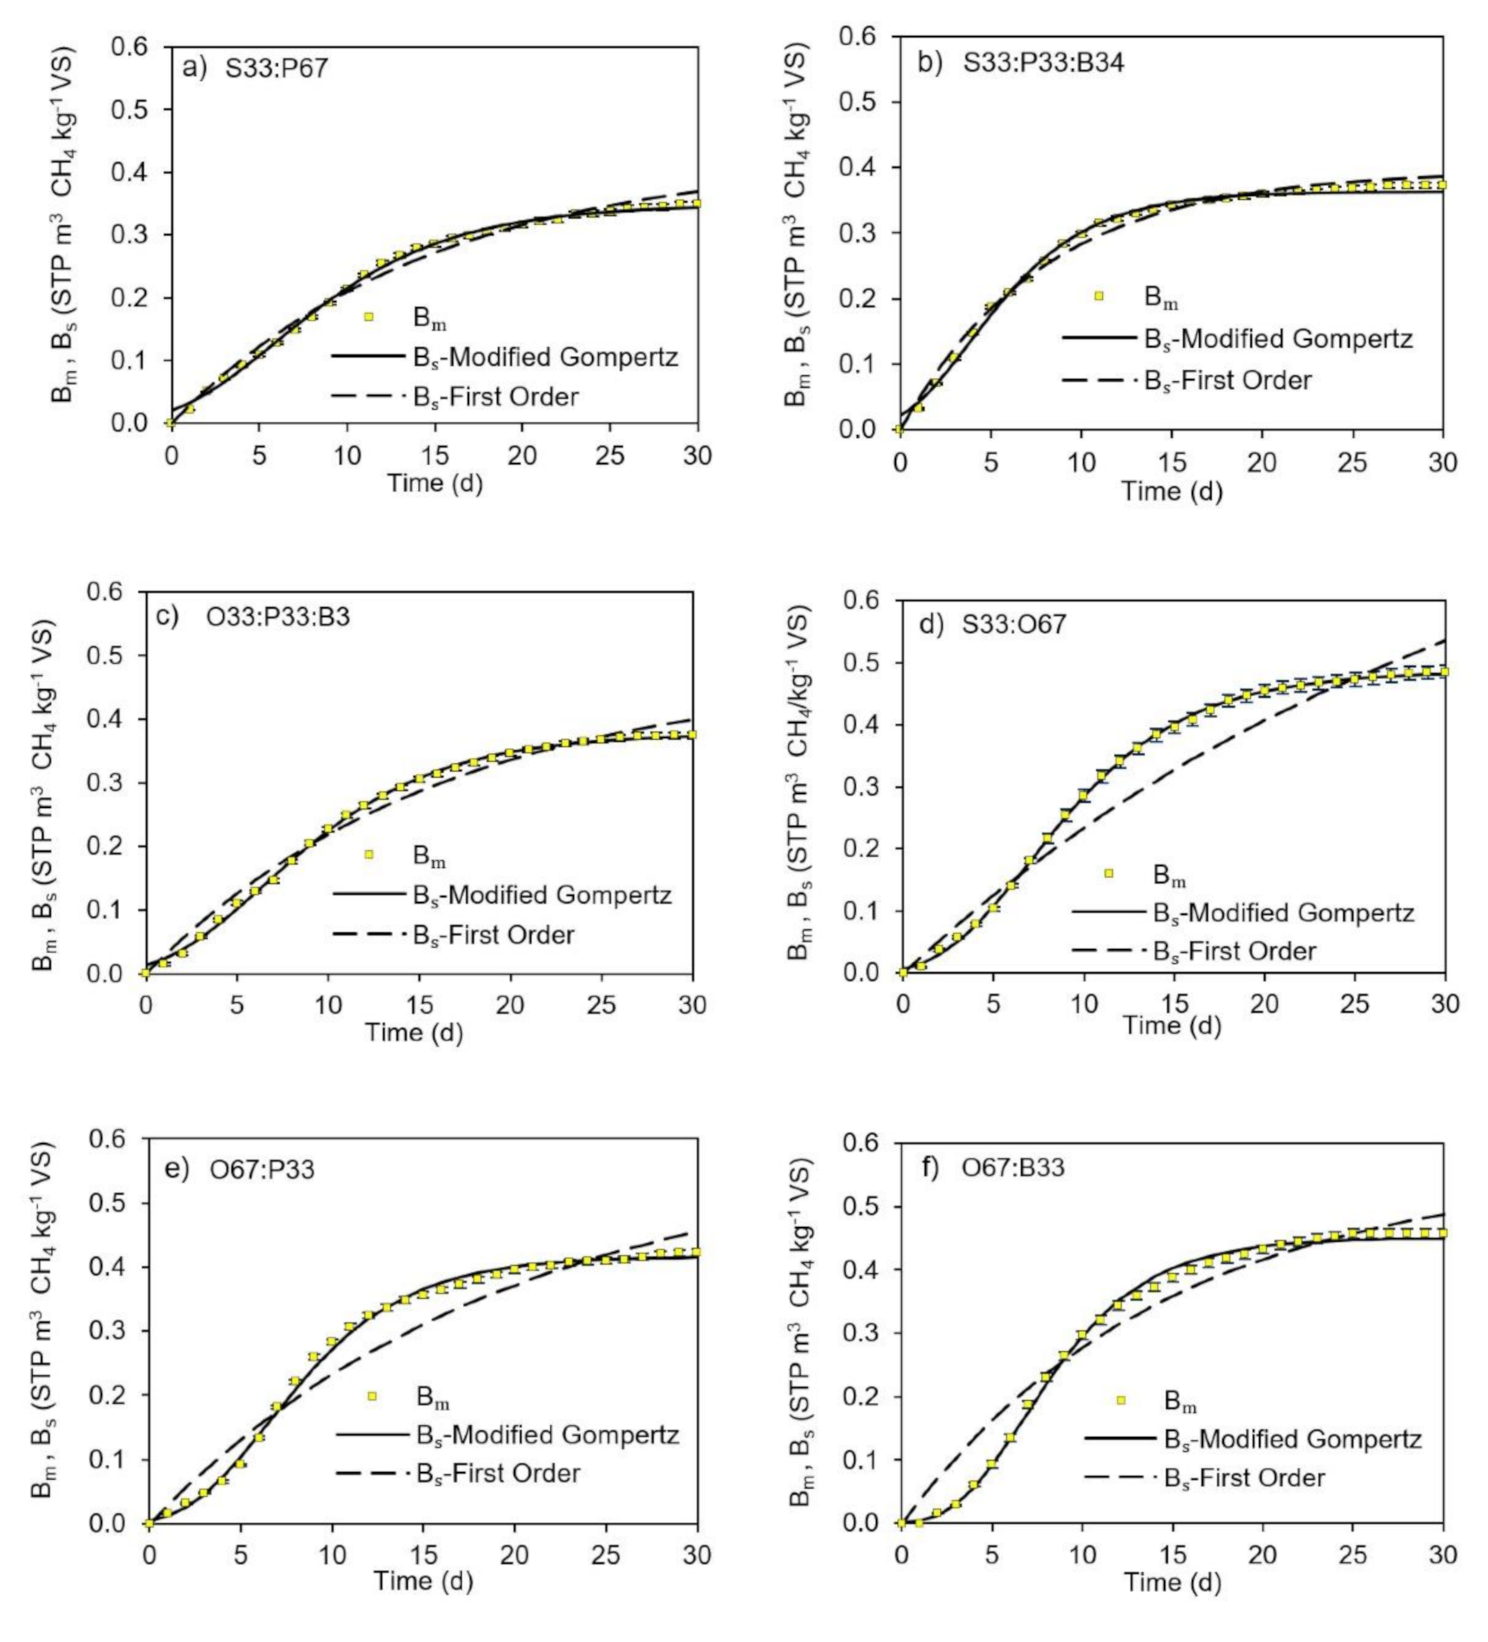
3.3. Kinetic Model Selection

The goodness of fit of the Gompertz and first-order models, and the respective estimated kinetic parameters, are summarized in Table 7. The best model was selected based on two statistical criteria: the normalized root mean square error (NRMSE) and the regression coefficient (R2). NRMSE is the standard deviation of the prediction errors (residuals). Thus, NRMSE is a measure of how far the experimental points are from the simulated curves. R2 provides a further measure of how well the model can reproduce the experimental data. For all mixtures, the Gompertz model resulted in a better fit of the experimental data compared to the first-order model. In particular, the ranges of NRMSE and R2 were 0.011–0.044 and 0.992–0.999, respectively, in the modified Gompertz model and 0.037–0.134 and 0.918–0.988, respectively, in the first-order model. The confidence interval of the estimated parameters for Gompertz (reported as standard error, and shown in Supplementary Data Table S2), is in all cases below 3% for the simulated ultimate yield P and below 4% for the maximum specific CH4 production rate Rmax. For the lag-phase λ, the average error is 17%, with the highest value of 70% in the case S33:P33:B34, due to the smallest estimated value of the lag-phase (0.152 days). Given the better goodness of fit and the acceptable parameter identifiability, the Gompertz kinetics was selected for the following model-based analysis of the AcoD synergy (Section 3.4).
Figure 4 shows a selection of six AcoD BMP experimental data, together with the fitted Gompertz and first-order model; the complete set of curves is shown in Supplementary Data Figure S2. Figure 4a–c show three experiments which resulted in the smallest differences in the goodness of fit between the two models, with all cases achieving high values of the regression coefficient (R2 > 0.98). These experiments correspond to the AcoD mixtures S33:P67; S33:P33:B34 and O33:P33:B34; it can be noted how they all have relevant content of the lignocellulosic substrates manure (BM) and paunch (PWW). In these cases, hydrolysis is significantly the rate-limiting step in the CH4 production [53]. For first-order models, the hydrolysis rate coefficient of these mixtures resulted in the range 0.06–0.12 d−1, which is similar to the value of 0.1 d−1 reported for paunch content by Jensen et al. (2016) [13].
On the other hand, Figure 4d–f shows the three experiments that presented the greatest deviation from the first-order model, namely, S33:O67, O67:P33 and O67:B33. It can be noted how these cases have a relevant content of lipid-rich offal wastewater (OWW). The lipid content from these mixtures caused an initial low CH4 production, which is reflected in a significant value of the lag-phase (λ) between 2 and 3 days. After the lag-phase the CH4 production occurred at a relatively high rate (Rmax between 0.036 and 0.044 m3 CH4 kg−1 VS d−1), which is comparable to the other mixtures. Similar behavior is reported by Astals et al. (2014) [12] in the anaerobic digestion of olive oil; the authors attributed the behavior to an initial LCFA absorption onto the surface of the microorganisms, which is followed rapidly by conversion to CH4.
In general, ternary and quaternary AcoD mixtures had lower λ values (range: 0.152–1.466 days; average 0.95 days) compared to binary mixtures (range: 0.281–2.982 days; average: 1.61 days) (Table 7). The λ range obtained in the current research is lower than values reported in previous research on slaughterhouse wastewater anaerobic digestions, with the work of Jensen et al. (2014) [4] reporting values of up to 18 days for lipid-rich streams. There is limited information on Rmax in the anaerobic digestion of slaughterhouse wastewater. Hernández-Fydrych et al. (2019) [57] analyzed the CH4 production kinetics of pretreated combined slaughterhouse wastewater by BMP assays. The authors fitted a Gompertz model and calculated a Rmax of 0.0125 and 0.0140 m3 CH4 kg−1 VS d−1 for autoclaving and mechanical pretreatment, respectively. These values are lower than those found in this study (0.022–0.044 m3 CH4 kg−1 VS d−1). Therefore, the possibility of controlling the mixture ratios of slaughterhouse wastewater streams in anaerobic co-digestion can have kinetics advantages, when compared to the digestion of the wastewaters’ individual streams or combined as a whole.

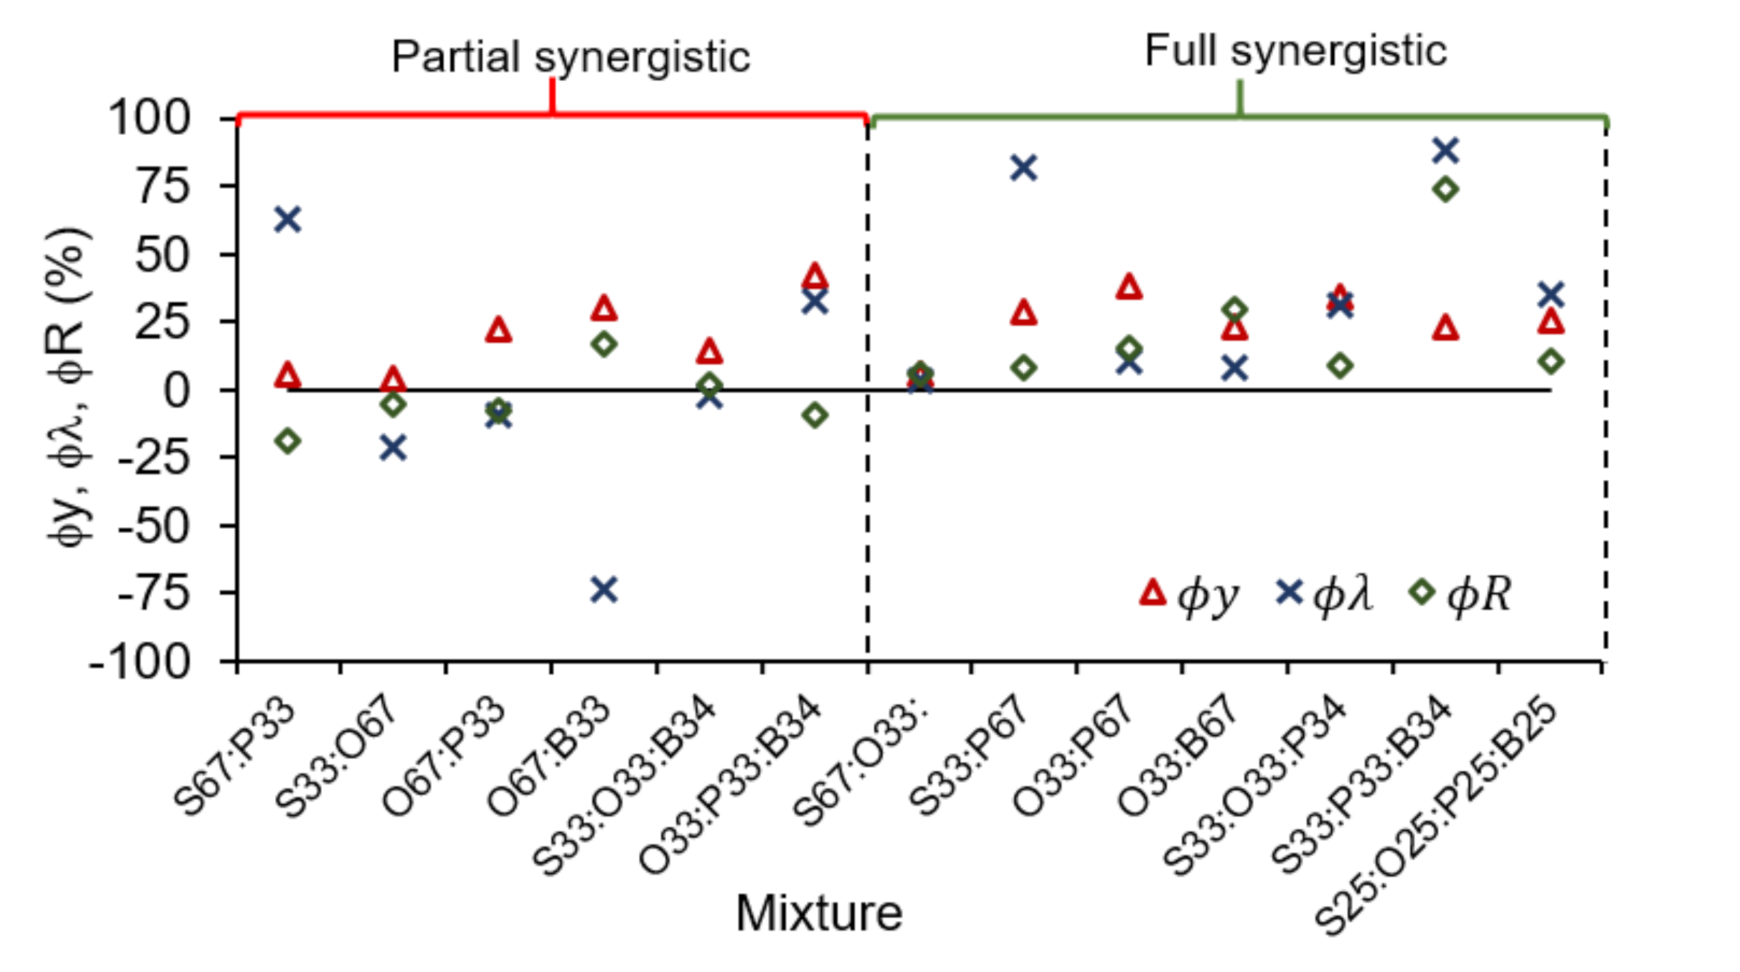
3.4. Evaluation of Synergy Effects

Figure 5 represents the synergistic effects of AcoD based on CH4 yield (ϕy), lag-phase (ϕλ) and CH4 production rate (ϕR). The predictive BMP curves along with the modified Gompertz plots are depicted in Supplementary Data Figure S3. All mixtures resulted in an experimental CH4 yield higher than the expected (ϕy > 0). This result agrees with the evaluation presented in Table 6 and reaffirms the AcoD ability to reduce the inhibition risk by NH3 and to improve the biodegradability of slaughterhouse wastewater and manure. Regarding the kinetic synergy, antagonistic effects were observed in some mixtures (left side of Figure 5). Four AcoD mixtures resulted in a negative synergy with respect to the lag-phase (ϕλ < 0); these mixtures were characterized by a relatively high lipid proportion (23–34%VS), which slowed down the production of CH4 during the first 2 or 3 days (Table 7). This observation is in agreement with the study on AcoD of dairy manure, meat, bone meal and crude glycerol carried out by Andriamanohiarisoamanana et al. (2017) [17], where an increase of glycerol proportion from 13%VS to 37%VS doubled λ. Additionally, antagonistic effects for Rmax (ϕR < 0) were presented in four AcoD experiments.
Comparing the binary and multicomponent AcoD, greater synergy was observed in the latter. The binary mixtures exhibited synergistic factors between 4.2% and 38.0% for ϕy, between 3.4% and 81.5% for ϕλ and 5.6% and 29.5% for ϕR. Meanwhile, the ternary and quaternary mixtures showed synergistic factors between 14.5% and 41.9% for ϕy, between 31.1% and 87.9% for ϕλ and 2.1% and 73.9% for ϕR. This highlights the advantage of multi-component AcoD over binary ones, both in the final CH4 yield and in the kinetics of production. Similar findings were found by Ara et al. (2015) [18] during AcoD of organic fraction of municipal solid waste, primary sludge and thickened waste activated sludge; the ternary mixtures exhibited CH4 yields between 12 and 27% higher than binary mixtures. Additionally, Castro-Molano et al. (2018) [39] observed higher ϕy factors in ternary mixtures (25–167%) than binary mixtures (5–68%) when chicken manure was co-digested with industrial wastes.
The results showed seven mixtures in which all three synergistic factors were positive (ϕy > 0, ϕλ > 0 and ϕR > 0); these mixtures were considered fully synergistic and depicted on the right side of Figure 5. However, the synergistic effects in the AcoD with the mixing ratio of S67:O33 were relatively small, with values below 10%; these small values of synergy are generally considered not significant in AcoD studies [23]. Furthermore, the binary mixtures with significant synergy presented the BM or PWW as main substrates. This analysis suggests that when wastes with potential high CH4 yield (e.g., SWW and OWW) are combined with the wastes with lower potential (e.g., BM and PWW), strong positive interactions are generated; on the other hand, weaker interactions occur when mixing wastes with similar characteristic (e.g., SWW with OWW and BM with PWW). Similar evidence can be found in the literature, such as in a study by Astals et al. (2014) [12], where the AcoD of DAF sludge and blood did not present significant synergy in CH4 production; however, when DAF sludge was blended with paunch waste, the resulting CH4 yield was 15% higher than expected. Likewise, Pagés-Diaz et al. (2014) [21] found antagonist effects in CH4 production rate and no significant interaction in CH4 yield when manure was co-digested with various crops (green fruit, vegetable residues and straw). Nevertheless, the AcoD of manure with slaughterhouse wastes presented significant synergy in both the production rate and yield of CH4.
The six mixtures with significant full synergy correspond to the combinations: S33:P67; O33:P67; O33:B67; S33:O33:P34; S33:P33:B34 and S25:O25:P25:O25. These AcoD presented a lipids composition relatively lower (11–23%VS) than the rest of the mixtures (19–34%VS), while the carbohydrates and proteins did not show noticeable differences. Thus, it seems that the lipid concentration is the one that most influences the AcoD of slaughterhouses wastewater streams and BM, since a high concentration can improve CH4 yield; however, it negatively affects the kinetics. The aforementioned fully synergistic mixtures could improve the anaerobic digestion performance of slaughterhouse wastewater streams and manure in tubular digesters. In this sense, the current results are a starting point for a second stage of investigation where the synergistic mixtures will be tested in semi-continuous laboratory trials. This will allow to determine the effect of operational variables HRT and OLR and compare the synergistic effects achieved in the batch test with the synergy in semi-continuous processes, using the same model-based analysis described in this paper. The semi-continuous operation may result in the adaptation of the microbial community to inhibitors, therefore changing the absolute value of the synergistic effects while maintaining a similar qualitative evaluation of the synergy as achieved through batch tests [58].

3.5. Energy and Economic Feasibility

Table 8 shows a summary of the energy and economic study for the implementation of anaerobic digestion of the slaughterhouse wastewater streams and BM in mono-digestion and AcoD scenarios (see Supplementary Data from Tables S3–S8 for complete data). Mixtures present 27% more energy potential than single substrates as a consequence of the synergistic effect on methane yield (ϕy). Likewise, the anaerobic digestion of the mixtures would need almost 30 m3 less digester volume compared to anaerobic digestion of the single substrates. This is due to the synergistic effects on kinetics, which reduce the estimated HRT on average by 3 days.
According to the energy potentials, the treatment of slaughterhouse wastewater streams and BM through anaerobic digestion would allow an energy saving between 0.91 and 1.21 US$ m−3 of waste in the mono-digestion scenario and between 1.16 and 1.53 US$ m−3 of waste in the AcoD scenario. These values added with the saving related to the avoided costs of current waste treatment (1.30 US$ m−3 of waste) result in an economic benefit from 2.21 to 2.51 US$ m−3 of waste and from 2.46 to 2.83 US$ m−3 of waste for mono-digestion and AcoD scenarios, respectively. The economic assessment shows that the CH4 transformation into electric energy leads to higher NPV and IRR compared to the transformation into thermal energy. This is due to the low price of natural gas (0.026 US$ kWh−1) compared to electricity (0.114 US$ kWh−1). However, in both cases (electrical and thermal generation), the PBP is lower than the equipment lifetime (10 years), NPV is positive and IRR is higher than the discount rate (10%). These results confirm the energetic and economic feasibility of anaerobic digestion of slaughterhouse wastewater streams and manure. Moreover, the economic parameters (PBP, NPV and IRR) are better in the AcoD scenario than the mono-digestion scenario. This demonstrates that the synergistic effects of the mixtures also translate into economic advantages.
In developing countries, most slaughterhouses are located in small towns and supply only the local demand for meat (rural population mainly) [7]. Therefore, these slaughterhouses have low income, which limits their investment capacity in technology. In this sense, the tubular digester is a suitable alternative for waste treatment, given its low capital cost (compared to other kind of reactors), its simplicity of operation and lack of energy requirements for its operation [8]. Additionally, this type of waste management and renewable energy projects can access green financing. For instance, the Latin American banking sector has been developing a series of green products to finance projects that mitigate global warming [59]. Regarding Colombia, the country will issue green bonds in 2021 directed to finance sustainable and environmentally friendly projects [60].

4. Conclusions

The current results show that, except for binary mixtures between slaughter wastewater (SWW) and bovine manure (BM) and between BM and paunch wastewater (PWW), the AcoD enhanced the biodegradability and reduced the inhibition risk by NH3 compared to the mono-digestion of slaughterhouse wastewater streams and BM. The synergy evaluation evidenced stronger positive effects when combining substrates with low methane potential (BM and PWW) with substrates with high potential (SWW and offal wastewater (OWW)) compared to binary mixtures BM-PWW and SWW-OWW. Likewise, the multicomponent mixtures performed better overall than the binary mixtures. The applied methodology allowed to select the mixtures with the best anaerobic digestion performance based on the CH4 yield and kinetics criteria, which also present energetic and economic advantages over the single substrates. Therefore, the treatment of slaughterhouse wastewater streams and manure by AcoD in tubular digesters would be feasible. For small slaughterhouses, the implementation of the anaerobic digestion technology could be financed through green products offered by the banking sector.

Supplementary Materials

The following are available online at https://www.mdpi.com/1996-1073/14/2/384/s1, Figure S1: Experimental (Bm) and predictive (Bp) accumulative CH4 production of AcoD of slaughterhouse wastewater streams and bovine manure, Figure S2: Experimental (Bm) and simulated (Bs) accumulative CH4 production of AcoD of slaughterhouse wastewater streams and bovine manure, Figure S3: Predictive (Bp) accumulative CH4 production of AcoD of slaughterhouse wastewater streams and bovine manure with the Modified Gompertz model fit, Table S1: Summary of NH3 calculation data, Table S2: Standard error of the estimated parameters for the first-order model and the modified Gompertz model, Table S3: Energetic evaluation for the mono-digestion scenario, Table S4: Economic evaluation for electrical energy generation in the mono-digestion scenario, Table S5: Economic evaluation for thermal energy generation in the mono-digestion scenario, Table S6: Energetic evaluation for the AcoD scenario, Table S7: Economic evaluation for electrical energy generation in the AcoD scenario, Table S8: Economic evaluation for thermal energy generation in the AcoD scenario.

Author Contributions

Conceptualization, Z.S., L.C. and H.E.; methodology, Z.S.; software, D.P.; validation, D.P., L.C. and H.E.; formal analysis, Z.S. and D.P.; investigation, Z.S.; resources, L.C. and H.E.; data curation, L.C.; writing—original draft preparation, Z.S.; writing—review and editing, D.P., L.C. and H.E.; visualization, Z.S.; supervision, L.C. and H.E.; project administration, Z.S.; funding acquisition, H.E. All authors have read and agreed to the published version of the manuscript.

Funding

This research received no external funding.

Institutional Review Board Statement

Not applicable.

Informed Consent Statement

Not applicable.

Data Availability Statement

The data presented in this study are available in supplementary material available online at www.mdpi.com/xxx/s1. Additional data may be requested from the corresponding author.

Acknowledgments

This work was financially supported by the Colombian Departamento Administrativo de Ciencia, Tecnología e Innovación (Colciencias)-convocatoria 785 de 2017 and Universidad Industrial de Santander (UIS). The authors are grateful to ColBeef slaughterhouse for facilitating the technical and economic information and samples for the development of this study. Davide Poggio is grateful for the financial support from British Council Newton Fund (Institutional Links grant 527677146).

Conflicts of Interest

The authors declare no conflict of interest.

References

  1. Bustillo-Lecompte, C.; Mehrvar, M. Slaughterhouse wastewater characteristics, treatment, and management in the meat processing industry: A review on trends and advances. J. Environ. Manag. 2015, 161, 287–302. [Google Scholar] [CrossRef] [PubMed]
  2. Mekonnen, M.M.; Hoekstra, A.Y. A Global Assessment of the Water Footprint of Farm Animal Products. Ecosystems 2012, 15, 401–415. [Google Scholar] [CrossRef] [Green Version]
  3. Geraghty, R. Sustainable Practices in Irish Beef Processing; Enterprise Ireland: Dublin, Ireland, 2009. [Google Scholar]
  4. Jensen, P.; Sullivan, T.W.; Carney, C.; Batstone, D.J. Analysis of the potential to recover energy and nutrient resources from cattle slaughterhouses in Australia by employing anaerobic digestion. Appl. Energy 2014, 136, 23–31. [Google Scholar] [CrossRef]
  5. Caixeta, C.E.; Cammarota, M.C.; Xavier, A.M. Slaughterhouse wastewater treatment: Evaluation of a new three-phase separation system in a UASB reactor. Bioresour. Technol. 2002, 81, 61–69. [Google Scholar] [CrossRef]
  6. Saddoud, A.; Sayadi, S. Application of acidogenic fixed-bed reactor prior to anaerobic membrane bioreactor for sustainable slaughterhouse wastewater treatment. J. Hazard. Mater. 2007, 149, 700–706. [Google Scholar] [CrossRef]
  7. World Bank. Global Study of Livestock Markets, Slaughterhouses and Related Waste Management Systems; Final Report; World Bank: Tokyo, Japan, 2009. [Google Scholar]
  8. Kinyua, M.N.; Rowse, L.E.; Ergas, S. Review of small-scale tubular anaerobic digesters treating livestock waste in the developing world. Renew. Sustain. Energy Rev. 2016, 58, 896–910. [Google Scholar] [CrossRef] [Green Version]
  9. Martí-Herrero, J.; Alvarez, R.; Flores, T. Evaluation of the low technology tubular digesters in the production of biogas from slaughterhouse wastewater treatment. J. Clean. Prod. 2018, 199, 633–642. [Google Scholar] [CrossRef]
  10. Wang, H.; Zhang, Y.; Angelidaki, I. Ammonia inhibition on hydrogen enriched anaerobic digestion of manure under mesophilic and thermophilic conditions. Water Res. 2016, 105, 314–319. [Google Scholar] [CrossRef] [Green Version]
  11. Zonta, Z.J.; Alves, M.M.; Flotats, X.; Palatsi, J. Modelling inhibitory effects of long chain fatty acids in the anaerobic digestion process. Water Res. 2013, 47, 1369–1380. [Google Scholar] [CrossRef] [Green Version]
  12. Astals, S.; Batstone, D.; Mata-Alvarez, J.; Jensen, P. Identification of synergistic impacts during anaerobic co-digestion of organic wastes. Bioresour. Technol. 2014, 169, 421–427. [Google Scholar] [CrossRef] [Green Version]
  13. Jensen, P.; Mehta, C.M.; Carney, C.; Batstone, D.J. Recovery of energy and nutrient resources from cattle paunch waste using temperature phased anaerobic digestion. Waste Manag. 2016, 51, 72–80. [Google Scholar] [CrossRef] [PubMed]
  14. Kafle, G.K.; Kim, S.-H. Kinetic Study of the Anaerobic Digestion of Swine Manure at Mesophilic Temperature: A Lab Scale Batch Operation. J. Biosyst. Eng. 2012, 37, 233–244. [Google Scholar] [CrossRef]
  15. Fogler, S. Conversion and reactor sizing. In Elements of Chemical Reaction Engineering, 5th ed.; Prentice Hall: Kendallville, IN, USA, 2016; pp. 31–68. [Google Scholar]
  16. Devuyst, E.; Pryor, S.W.; Lardy, G.; Eide, W.; Wiederholt, R. Cattle, ethanol, and biogas: Does closing the loop make economic sense? Agric. Syst. 2011, 104, 609–614. [Google Scholar] [CrossRef]
  17. Andriamanohiarisoamanana, F.J.; Saikawa, A.; Tarukawa, K.; Qi, G.; Pan, Z.; Yamashiro, T.; Iwasaki, M.; Ihara, I.; Nishida, T.; Umetsu, K. Anaerobic co-digestion of dairy manure, meat and bone meal, and crude glycerol under mesophilic conditions: Synergistic effect and kinetic studies. Energy Sustain. Dev. 2017, 40, 11–18. [Google Scholar] [CrossRef]
  18. Ara, E.; Sartaj, M.; Kennedy, K. Enhanced biogas production by anaerobic co-digestion from a trinary mix substrate over a binary mix substrate. Waste Manag. Res. 2015, 33, 578–587. [Google Scholar] [CrossRef]
  19. Wang, X.; Yang, G.; Li, F.; Feng, Y.; Ren, G.; Han, X. Evaluation of two statistical methods for optimizing the feeding composition in anaerobic co-digestion: Mixture design and central composite design. Bioresour. Technol. 2013, 131, 172–178. [Google Scholar] [CrossRef]
  20. Dennehy, C.; Lawlor, P.G.; Croize, T.; Jiang, Y.; Morrison, L.; Gardiner, G.E.; Zhan, X. Synergism and effect of high initial volatile fatty acid concentrations during food waste and pig manure anaerobic co-digestion. Waste Manag. 2016, 56, 173–180. [Google Scholar] [CrossRef]
  21. Pagés-Díaz, J.; Pereda-Reyes, I.; Taherzadeh, M.J.; Sárvári-Horváth, I.; Lundin, M. Anaerobic co-digestion of solid slaughterhouse wastes with agro-residues: Synergistic and antagonistic interactions determined in batch digestion assays. Chem. Eng. J. 2014, 245, 89–98. [Google Scholar] [CrossRef] [Green Version]
  22. Ebner, J.H.; Labatut, R.A.; Lodge, J.S.; Williamson, A.A.; Trabold, T.A. Anaerobic co-digestion of commercial food waste and dairy manure: Characterizing biochemical parameters and synergistic effects. Waste Manag. 2016, 52, 286–294. [Google Scholar] [CrossRef]
  23. Donoso-Bravo, A.; Ortega, V.; Lesty, Y.; Bossche, H.V.; Olivares, D. Addressing the synergy determination in anaerobic co-digestion and the inoculum activity impact on BMP test. Water Sci. Technol. 2019, 80, 387–396. [Google Scholar] [CrossRef]
  24. Mendieta, O.; Castro, L.; Rodríguez, J.; Escalante, H. Synergistic effect of sugarcane scum as an accelerant co-substrate on anaerobic co-digestion with agricultural crop residues from non-centrifugal cane sugar agribusiness sector. Bioresour. Technol. 2020, 303, 122957. [Google Scholar] [CrossRef] [PubMed]
  25. Holliger, C.; Alves, M.; Andrade, D.; Angelidaki, I.; Astals, S.; Baier, U.; Bougrier, C.; Buffière, P.; Carballa, M.; De Wilde, V.; et al. Towards a standardization of biomethane potential tests. Water Sci. Technol. 2016, 74, 2515–2522. [Google Scholar] [CrossRef] [PubMed]
  26. Callaghan, F.; Wase, D.; Thayanithy, K.; Forster, C. Continuous co-digestion of cattle slurry with fruit and vegetable wastes and chicken manure. Biomass Bioenergy 2002, 22, 71–77. [Google Scholar] [CrossRef]
  27. Angelidaki, I.; Alves, M.M.; Bolzonella, D.; Borzacconi, L.; Campos, J.L.; Guwy, A.J.; Kalyuzhnyi, S.; Jenicek, P.; Van Lier, J.B. Defining the biomethane potential (BMP) of solid organic wastes and energy crops: A proposed protocol for batch assays. Water Sci. Technol. 2009, 59, 927–934. [Google Scholar] [CrossRef] [PubMed] [Green Version]
  28. Maya-Altamira, L.; Baun, A.; Angelidaki, I.; Schmidt, J.E. Influence of wastewater characteristics on methane potential in food-processing industry wastewaters. Water Res. 2008, 42, 2195–2203. [Google Scholar] [CrossRef]
  29. Raposo, F.; Fernández-Cegrí, V.; De La Rubia, M.; Ángeles Borja, R.; Béline, F.; Cavinato, C.; Demirer, G.N.; Fernández, B.; Fernández-Polanco, M.; Frigon, J.C.; et al. Biochemical methane potential (BMP) of solid organic substrates: Evaluation of anaerobic biodegradability using data from an international interlaboratory study. J. Chem. Technol. Biotechnol. 2011, 86, 1088–1098. [Google Scholar] [CrossRef]
  30. APHA-AWWA-WEF. Standard Methods for the Examination of Water and Wastewater, 23rd ed.; American Public Health Association: Washington, D.C., USA, 2017. [Google Scholar]
  31. Lahav, O.; Morgan, B. Titration methodologies for monitoring of anaerobic digestion in developing countries? A review. J. Chem. Technol. Biotechnol. 2004, 79, 1331–1341. [Google Scholar] [CrossRef] [Green Version]
  32. Van Soest, P.; Robertson, J.; Lewis, B. Methods for Dietary Fiber, Neutral Detergent Fiber, and Nonstarch Polysaccharides in Relation to Animal Nutrition. J. Dairy Sci. 1991, 74, 3583–3597. [Google Scholar] [CrossRef]
  33. Passos, F.; Ortega, V.; Donoso-Bravo, A. Thermochemical pretreatment and anaerobic digestion of dairy cow manure: Experimental and economic evaluation. Bioresour. Technol. 2017, 227, 239–246. [Google Scholar] [CrossRef]
  34. Astals, S.; Batstone, D.; Tait, S.; Jensen, P. Development and validation of a rapid test for anaerobic inhibition and toxicity. Water Res. 2015, 81, 208–215. [Google Scholar] [CrossRef]
  35. Astals, S.; Peces, M.; Batstone, D.; Jensen, P.; Tait, S. Characterising and modelling free ammonia and ammonium inhibition in anaerobic systems. Water Res. 2018, 143, 127–135. [Google Scholar] [CrossRef] [PubMed] [Green Version]
  36. Shen, J.; Yan, H.; Zhang, R.; Liu, G.; Chen, C. Characterization and methane production of different nut residue wastes in anaerobic digestion. Renew. Energy 2018, 116, 835–841. [Google Scholar] [CrossRef]
  37. Pan, X.; Wang, L.; Lv, N.; Ning, J.; Zhou, M.; Wang, T.; Li, C.; Zhu, G. Impact of physical structure of granular sludge on methanogenesis and methanogenic community structure. RSC Adv. 2019, 9, 29570–29578. [Google Scholar] [CrossRef] [Green Version]
  38. Poggio, D.; Walker, M.; Nimmo, W.; Ma, L.; Pourkashanian, M. Modelling the anaerobic digestion of solid organic waste–Substrate characterisation method for ADM1 using a combined biochemical and kinetic parameter estimation approach. Waste Manag. 2016, 53, 40–54. [Google Scholar] [CrossRef] [Green Version]
  39. Molano, L.C.; Escalante, H.; Lambis-Benítez, L.E.; Marín-Batista, J.D. Synergistic effects in anaerobic codigestion of chicken manure with industrial wastes. DYNA 2018, 85, 135–141. [Google Scholar] [CrossRef]
  40. Escalante, H.; Castro, L.; Amaya, M.; Jaimes, L.; Jaimes-Estévez, J. Anaerobic digestion of cheese whey: Energetic and nutritional potential for the dairy sector in developing countries. Waste Manag. 2018, 71, 711–718. [Google Scholar] [CrossRef]
  41. Ali, M.M.; Ndongo, M.; Bilal, B.; Yetilmezsoy, K.; Youm, I.; Bahramian, M. Mapping of biogas production potential from livestock manures and slaughterhouse waste: A case study for African countries. J. Clean. Prod. 2020, 256, 120499. [Google Scholar] [CrossRef]
  42. Haitai Power Machinery. Available online: http://www.hitepower.com/index.jsp (accessed on 18 November 2020).
  43. González-González, A.; Collares-Pereira, M.; Cuadros, F.; Fartaria, T. Energy self-sufficiency through hybridization of biogas and photovoltaic solar energy: An application for an Iberian pig slaughterhouse. J. Clean. Prod. 2014, 65, 318–323. [Google Scholar] [CrossRef]
  44. Jin, Y.; Hu, Z.; Wen, Z. Enhancing anaerobic digestibility and phosphorus recovery of dairy manure through microwave-based thermochemical pretreatment. Water Res. 2009, 43, 3493–3502. [Google Scholar] [CrossRef]
  45. Zheng, Z.; Liu, J.; Yuan, X.; Wang, X.; Zhu, W.; Yang, F.; Cui, Z. Effect of dairy manure to switchgrass co-digestion ratio on methane production and the bacterial community in batch anaerobic digestion. Appl. Energy 2015, 151, 249–257. [Google Scholar] [CrossRef]
  46. Matthews, C.; Crispie, F.; Lewis, E.; Reid, M.; O’Toole, P.W.; Cotter, P.D. The rumen microbiome: A crucial consideration when optimising milk and meat production and nitrogen utilisation efficiency. Gut Microbes 2019, 10, 115–132. [Google Scholar] [CrossRef] [PubMed]
  47. RSPCA. How Are Animals Killed for Food? Available online: https://kb.rspca.org.au/knowledge-base/how-are-animals-killed-for-food/ (accessed on 1 October 2020).
  48. Ministry of Health and Social Protection. Resolution No. 240/2013; Ministry of Health and Social Protection: Bogota, Colombia, 2013. [Google Scholar]
  49. Harris, P.W.; Schmidt, T.; McCabe, B.K. Bovine bile as a bio-surfactant pre-treatment option for anaerobic digestion of high-fat cattle slaughterhouse waste. J. Environ. Chem. Eng. 2018, 6, 444–450. [Google Scholar] [CrossRef]
  50. Nielsen, H.B.; Angelidaki, I. Strategies for optimizing recovery of the biogas process following ammonia inhibition. Bioresour. Technol. 2008, 99, 7995–8001. [Google Scholar] [CrossRef] [PubMed]
  51. Cuetos, M.J.; Martinez, E.J.; Moreno, R.; Gonzalez, R.; Otero, M.; Gómez, X. Enhancing anaerobic digestion of poultry blood using activated carbon. J. Adv. Res. 2017, 8, 297–307. [Google Scholar] [CrossRef]
  52. Jensen, P.; Yap, S.; Boyle-Gotla, A.; Janoschka, J.; Carney, C.; Pidou, M.; Batstone, D.J. Anaerobic membrane bioreactors enable high rate treatment of slaughterhouse wastewater. Biochem. Eng. J. 2015, 97, 132–141. [Google Scholar] [CrossRef] [Green Version]
  53. Neshat, S.A.; Mohammadi, M.; Darzi, G.N.; Lahijani, P. Anaerobic co-digestion of animal manures and lignocellulosic residues as a potent approach for sustainable biogas production. Renew. Sustain. Energy Rev. 2017, 79, 308–322. [Google Scholar] [CrossRef]
  54. López, I.; Passeggi, M.; Borzacconi, L. Co-digestion of ruminal content and blood from slaughterhouse industries: Influence of solid concentration and ammonium generation. Water Sci. Technol. 2006, 54, 231–236. [Google Scholar] [CrossRef]
  55. Cuetos, M.; Gómez, X.; Martínez, E.J.; Fierro, J.; Otero, M. Feasibility of anaerobic co-digestion of poultry blood with maize residues. Bioresour. Technol. 2013, 144, 513–520. [Google Scholar] [CrossRef]
  56. Zhang, Y.; Banks, C. Co-digestion of the mechanically recovered organic fraction of municipal solid waste with slaughterhouse wastes. Biochem. Eng. J. 2012, 68, 129–137. [Google Scholar] [CrossRef] [Green Version]
  57. Hernández-Fydrych, V.C.; Benítez-Olivares, G.; Meraz-Rodríguez, M.A.; Salazar-Peláez, M.L.; Fajardo-Ortiz, M.C. Methane production kinetics of pretreated slaughterhouse wastewater. Biomass Bioenergy 2019, 130, 105385. [Google Scholar] [CrossRef]
  58. Koch, K.; Hafner, S.D.; Weinrich, S.; Astals, S.; Holliger, C. Power and Limitations of Biochemical Methane Potential (BMP) Tests. Front. Energy Res. 2020, 8, 8. [Google Scholar] [CrossRef]
  59. Feleban; Eco Business Fund; IFC. What Is the Latin American Banking Sector Doing to Mitigate Climate Change? Report 2017; Feleban; Eco Business Fund; IFC: Washington, DC, USA, 2017. [Google Scholar]
  60. Portafolio. Colombia Emitirá Bonos Verdes Desde El Próximo Año. 2020. Available online: https://www.portafolio.co/economia/finanzas/colombia-emitira-bonos-verdes-desde-el-proximo-ano-538462 (accessed on 17 November 2020).
Figure 1. Simplex-lattice mixture design tested for anaerobic co-digestion (AcoD) of slaughterhouse wastewater streams (SWW: slaughter wastewater; OWW: offal wastewater; PWW: paunch wastewater) and bovine manure (BM).
Energies 14 00384 g001
Figure 2. Accumulated CH4 production of wastewater streams (SWW: slaughter wastewater; OWW: offal wastewater; PWW: paunch wastewater) and manure (BM) from a bovine slaughterhouse.
Energies 14 00384 g002
Figure 3. Biochemical composition of the different AcoD mixtures (left axis) and the resulting ultimate specific CH4 yield (right axis). On the X-axis, the letter represents the waste stream (S: slaughter wastewater; O: offal wastewater; P: paunch wastewater; B: bovine manure) and the number its %VS in the mixture.
Energies 14 00384 g003
Figure 4. Accumulative CH4 production from experimental data (Bm) and calibrated model (Bs) of the mixtures with the smallest deviations (ac) and the greatest deviations (df) from the first-order model. The letter represents the waste stream (S: slaughter wastewater; O: offal wastewater; P: paunch wastewater; B: bovine manure) and the number its %VS in the mixture.
Energies 14 00384 g004
Figure 5. Synergistic effects of AcoD of slaughterhouse wastewater streams and bovine manure. The left side represents the mixtures that presented an antagonistic effect, while the right side indicates the mixtures with synergy in all the parameters (ϕy > 0; ϕλ and ϕR > 0). The letter represents the waste stream (S: slaughter wastewater; O: offal wastewater; P: paunch wastewater; B: bovine manure) and the number its %VS in the mixture.
Energies 14 00384 g005
Table 1. Operational characteristics of the case study slaughterhouse.
Parameter aUnitValue
Average slaughter capacityBovines d−1327
Flow of SWW m3 d−145.34
Flow of OWW m3 d−1111.60
Flow of PWW m3 d−1139.50
Flow of BM t d−17.70
Thermal energy consumptionkWh d−18594.90
Electrical energy consumptionkWh d−14743.28
a SWW: slaughter wastewater; OWW: offal wastewater; PWW: paunch wastewater; BM: bovine manure.
Table 2. Characteristics of slaughterhouse wastewater streams and BM. Results are reported as an average of three measurements (±95% confidence interval).
Parameter aUnitSWW bOWW bPWW bBM b
pH--6.72 ± 0.086.90 ± 0.087.80 ± 0.087.38 ± 0.06
TSkg m−38.28 ± 0.1212.53 ± 0.2218.23 ± 0.93242.14 ± 1.04
VSkg m−37.63 ± 0.2110.96 ± 0.2315.99 ± 0.98154.22 ± 1.50
CODkg m−39.39 ± 0.049.75 ± 0.088.35 ± 0.1437.06 ± 1.66
TVFAskg CH3COOH m−3 0.72 ± 0.000.88 ± 0.071.25 ± 0.072.40 ± 0.00
TAKg CaCO3 m−3 0.80 ± 0.001.38 ± 0.181.75 ± 0.053.25 ± 0.35
Lipids%VS26.538.64.13.3
Proteins%VS69.336.111.612.1
Carb%VS4.212.08.821.4
Cell%VS--2.321.924.8
Hem%VS--6.432.022.1
Lig%VS--4.621.616.3
a Carb: non-structural carbohydrates; Cell: cellulose; Hem: hemicellulose; Lig: lignin. b SWW: slaughter wastewater; OWW: offal wastewater; PWW: paunch wastewater; BM: bovine manure.
Table 3. Mixture design applied in the evaluation of AcoD.
MixtureSWW a (% VS)OWW a (%VS)PWW a (%VS)BM a (%VS)Mixture Type
S100100000Single Substrates
O100010000
P100001000
B100000100
S67:O33673300Binary
S67:P33670330
S67:B33670033
S33:O67336700
S33:P67330670
S33:B67330067
O67:P33067330
O67:B33067033
O33:P67033670
O33:B67033067
P67:B33006733
P33:B67003367
S33:O33:P343333340Ternary
S33:P33:B343303334
S33:O33:B343333034
O33:P33:B340333334
S25:O25:P25:B2525252525Quaternary
a SWW: slaughter wastewater; OWW: offal wastewater; PWW: paunch wastewater; BM: bovine manure.
Table 4. Equations applied to evaluate the synergistic factors ϕ in AcoD of slaughterhouse wastewater streams and BM.
Synergistic Factor aEquationEvaluation
ϕ y B o B o e x p e c t e d   B o e x p e c t e d   100 ϕy,kh,R,λ > 0: the mixture has a synergistic effect.
ϕy,kh,R,λ < 0: the mixture has an antagonistic effect.
ϕy,kh,R,λ = 0: the mixture does not affect the performance of the substrates.
ϕ k h k h k h e x p e c t e d k h e x p e c t e d   100
  ϕ R R m a x R m a x e x p e c t e d R m a x e x p e c t e d   100  
ϕ λ λ e x p e c t e d λ λ e x p e c t e d   100
a ϕy: synergy for CH4 yield; ϕkh: synergy for the apparent hydrolysis rate coefficient; ϕR: synergy for the maximum specific CH4 production rate; ϕλ: synergy for the lag-phase.
Table 5. Parameters and assumptions for the economic study.
UnitValue
Design Assumptions a
Flow of SWW to be treatedm3 d−14.5
Flow of OWW to be treatedm3 d−111.2
Flow of PWW to be treatedm3 d−114.0
Flow of BM to be treatedt d−10.8
Operational volume of digester (liquid fraction) %75 b
CAPEX
Anaerobic digesterUS$ m−396
Electricity generatorUS$5640 c
OPEX
LabourUS$ year−14380
Electricity generator maintenance US$ MWh−114.82 d
Benefits
Electricity savingUS$ kWh−10.114
Natural gas savingUS$ m−30.323
Wastewater treatment savingUS$ m−31.30
a SWW: slaughter wastewater; OWW: offal wastewater; PWW: paunch wastewater; BM: bovine manure. b Data from Escalante et al. (2017) [40]. c Corresponding to a 20-kW biomass electric generator [42]. d Data from González-González et al. (2014) [43].
Table 6. Evaluation of AcoD of slaughterhouse wastewater streams and BM. Results are reported as an average of three measurements (±95% confidence interval). Mono-digestions are presented as a reference.
Mixture aInitial Lignocellulosic Material (%VS)Final NH3 (mg/L)Reduction of Lignocellulosic Material Composition bReduction of Inhibition Risk by NH3 afd c
S1000.021.82 ± 0.25n/an/a0.80 ± 0.01
O10013.310.62 ± 0.27n/an/a0.63 ± 0.02
P10075.57.48 ± 0.25n/an/a0.34 ± 0.01
B10063.27.24 ± 0.21n/an/a0.46 ± 0.00
S67:O334.415.89 ± 0.37++0.78 ± 0.01
S67:P3325.216.73 ± 0.35++0.72 ± 0.03
S67:B3321.123.73 ± 0.33+-0.61 ± 0.01
S33:O678.915.71 ± 0.37++0.71 ± 0.02
S33:P6750.49.91 ± 0.25++0.68 ± 0.01
S33:B6742.122.01 ± 0.33+-0.50 ± 0.01
O67:P3334.18.64 ± 0.37++0.68 ± 0.01
O67:B3329.96.32 ± 0.34++0.77 ± 0.01
O33:P6754.86.62 ± 0.37++0.64 ± 0.01
O33:B6746.610.22 ± 0.34++0.66 ± 0.01
P67:B3371.410.48 ± 0.33-+0.45 ± 0.01
P33:B6767.38.37 ± 0.33-+0.43 ± 0.01
S33:O33:P3429.62.30 ± 0.44++0.83 ± 0.00
S33:P33:B3446.25.43 ± 0.41++0.70 ± 0.01
S33:O33:B3425.52.16 ± 0.42++0.74 ± 0.00
O33:P33:B3450.71.79 ± 0.42++0.71 ± 0.01
S25:O25:P25:B2538.03.56 ± 0.49++0.73 ± 0.01
a The letter represents the waste stream (S: slaughter wastewater; O: offal wastewater; P: paunch wastewater; B: bovine manure) and the number its %VS in the mixture. b Positive and negative effects are indicated by + and − signs, respectively. Mixtures in bold and italic resulted in either high lignocellulosic content or ammonia inhibition. c fd: the extent of degradation.
Table 7. Kinetic parameters of the models fitted to the curves of the biochemical methane potential (BMP) assays.
ModelMixture
S67:O33S67:P33S33:O67S33:P67O67:P33O67:B33O33:P67O33:B67S33:O33:P34S33:P33:B34S33:O33:B34O33:P33:B34S25:O25:P25:B25
First Order
P0.6370.5600.9040.4240.5800.5580.4530.4010.6570.3950.7150.4730.555
kh0.0570.0470.0300.0680.0510.0690.0600.0950.0550.1260.0400.0620.055
NRMSE0.0750.0720.1340.0470.1130.1020.1150.0680.0820.0370.0970.0580.086
R20.9690.9740.9180.9870.9300.9370.9190.9680.9650.9880.9580.9810.961
Modified Gompertz
P0.4940.4350.4860.3490.4170.4510.3420.3440.5040.3630.4500.3770.411
λ1.7340.6972.1420.2812.1522.9821.6901.1871.1450.1521.4661.0450.934
Rmax0.0360.0220.0370.0230.0360.0440.0340.0360.0330.0360.0300.0260.029
NRMSE0.0220.0440.0110.0240.0260.0270.0290.0250.0330.0180.0310.0160.026
R20.9980.9920.9990.9980.9970.9970.9950.9960.9950.9970.9960.9990.997
P: Maximum specific CH4 yield [STP m3 CH4 kg−1 VS]; λ: Lag-phase [d]; Rmax: Maximum specific CH4 production rate [STP m3 CH4 kg−1 VS d−1]; kh: Apparent hydrolysis rate coefficient [d−1]; NRMSE: Normalized root mean square error; R2: Correlation coefficient.
Table 8. Results of the economic study for the implementation of anaerobic digestion of the slaughterhouse wastewater streams and BM.
Scenario aUnitCH4 for Thermal Energy ProductionCH4 for Electrical Energy Production
Mono-digestion
Potential kWh m−3 33.74 10.54
Total volume of digesters m3 888 888
PBP years 5 5
NPV US$ 50,894.00 56,962.88
IRR % 22.77 23.28
AcoD
Potential kWh m−3 42.69 13.34
Total volume of digesters m3 858 858
PBP years 4 4
NPV US$ 70,636.35 79,675.98
IRR % 27.71 28.48
a PBP: payback period; NPV: Net Present Value; IRR: Internal Rate of Return.
Publisher’s Note: MDPI stays neutral with regard to jurisdictional claims in published maps and institutional affiliations.

