Optimal Decision-Making in Photovoltaic System Selection in Saudi Arabia


 ,
,  , and
, and
Abstract
1. Introduction
- Environmental, location, climate and orographic criteria are proposed to identify the suitable locations by a GIS based multi criteria decision making techniques (MCDM).
- To obtain the weights of the criteria which influence the proposed locations, the analytic hierarchy process (AHP) is used. Then, the suitable locations will be evaluated and classified using one of the multi-criteria decision methods, The technique for order preference by similarity to ideal solution (TOPSIS).
2. PV System Site Selection
- Enhancing the performance of the system; if the site has suitable climate conditions such as high solar irradiance, moderate temperatures, and long days hours per year.
- Optimizing the installations by building the PV system on a flat ground, facing the south and avoiding the shadow.
- Minimizing the cost impact; if the system is built near urban areas, power transmission and constructed roads are the main consumption points.
- Reducing the impact on the environment, society, and infrastructures.
2.1. Literature Review
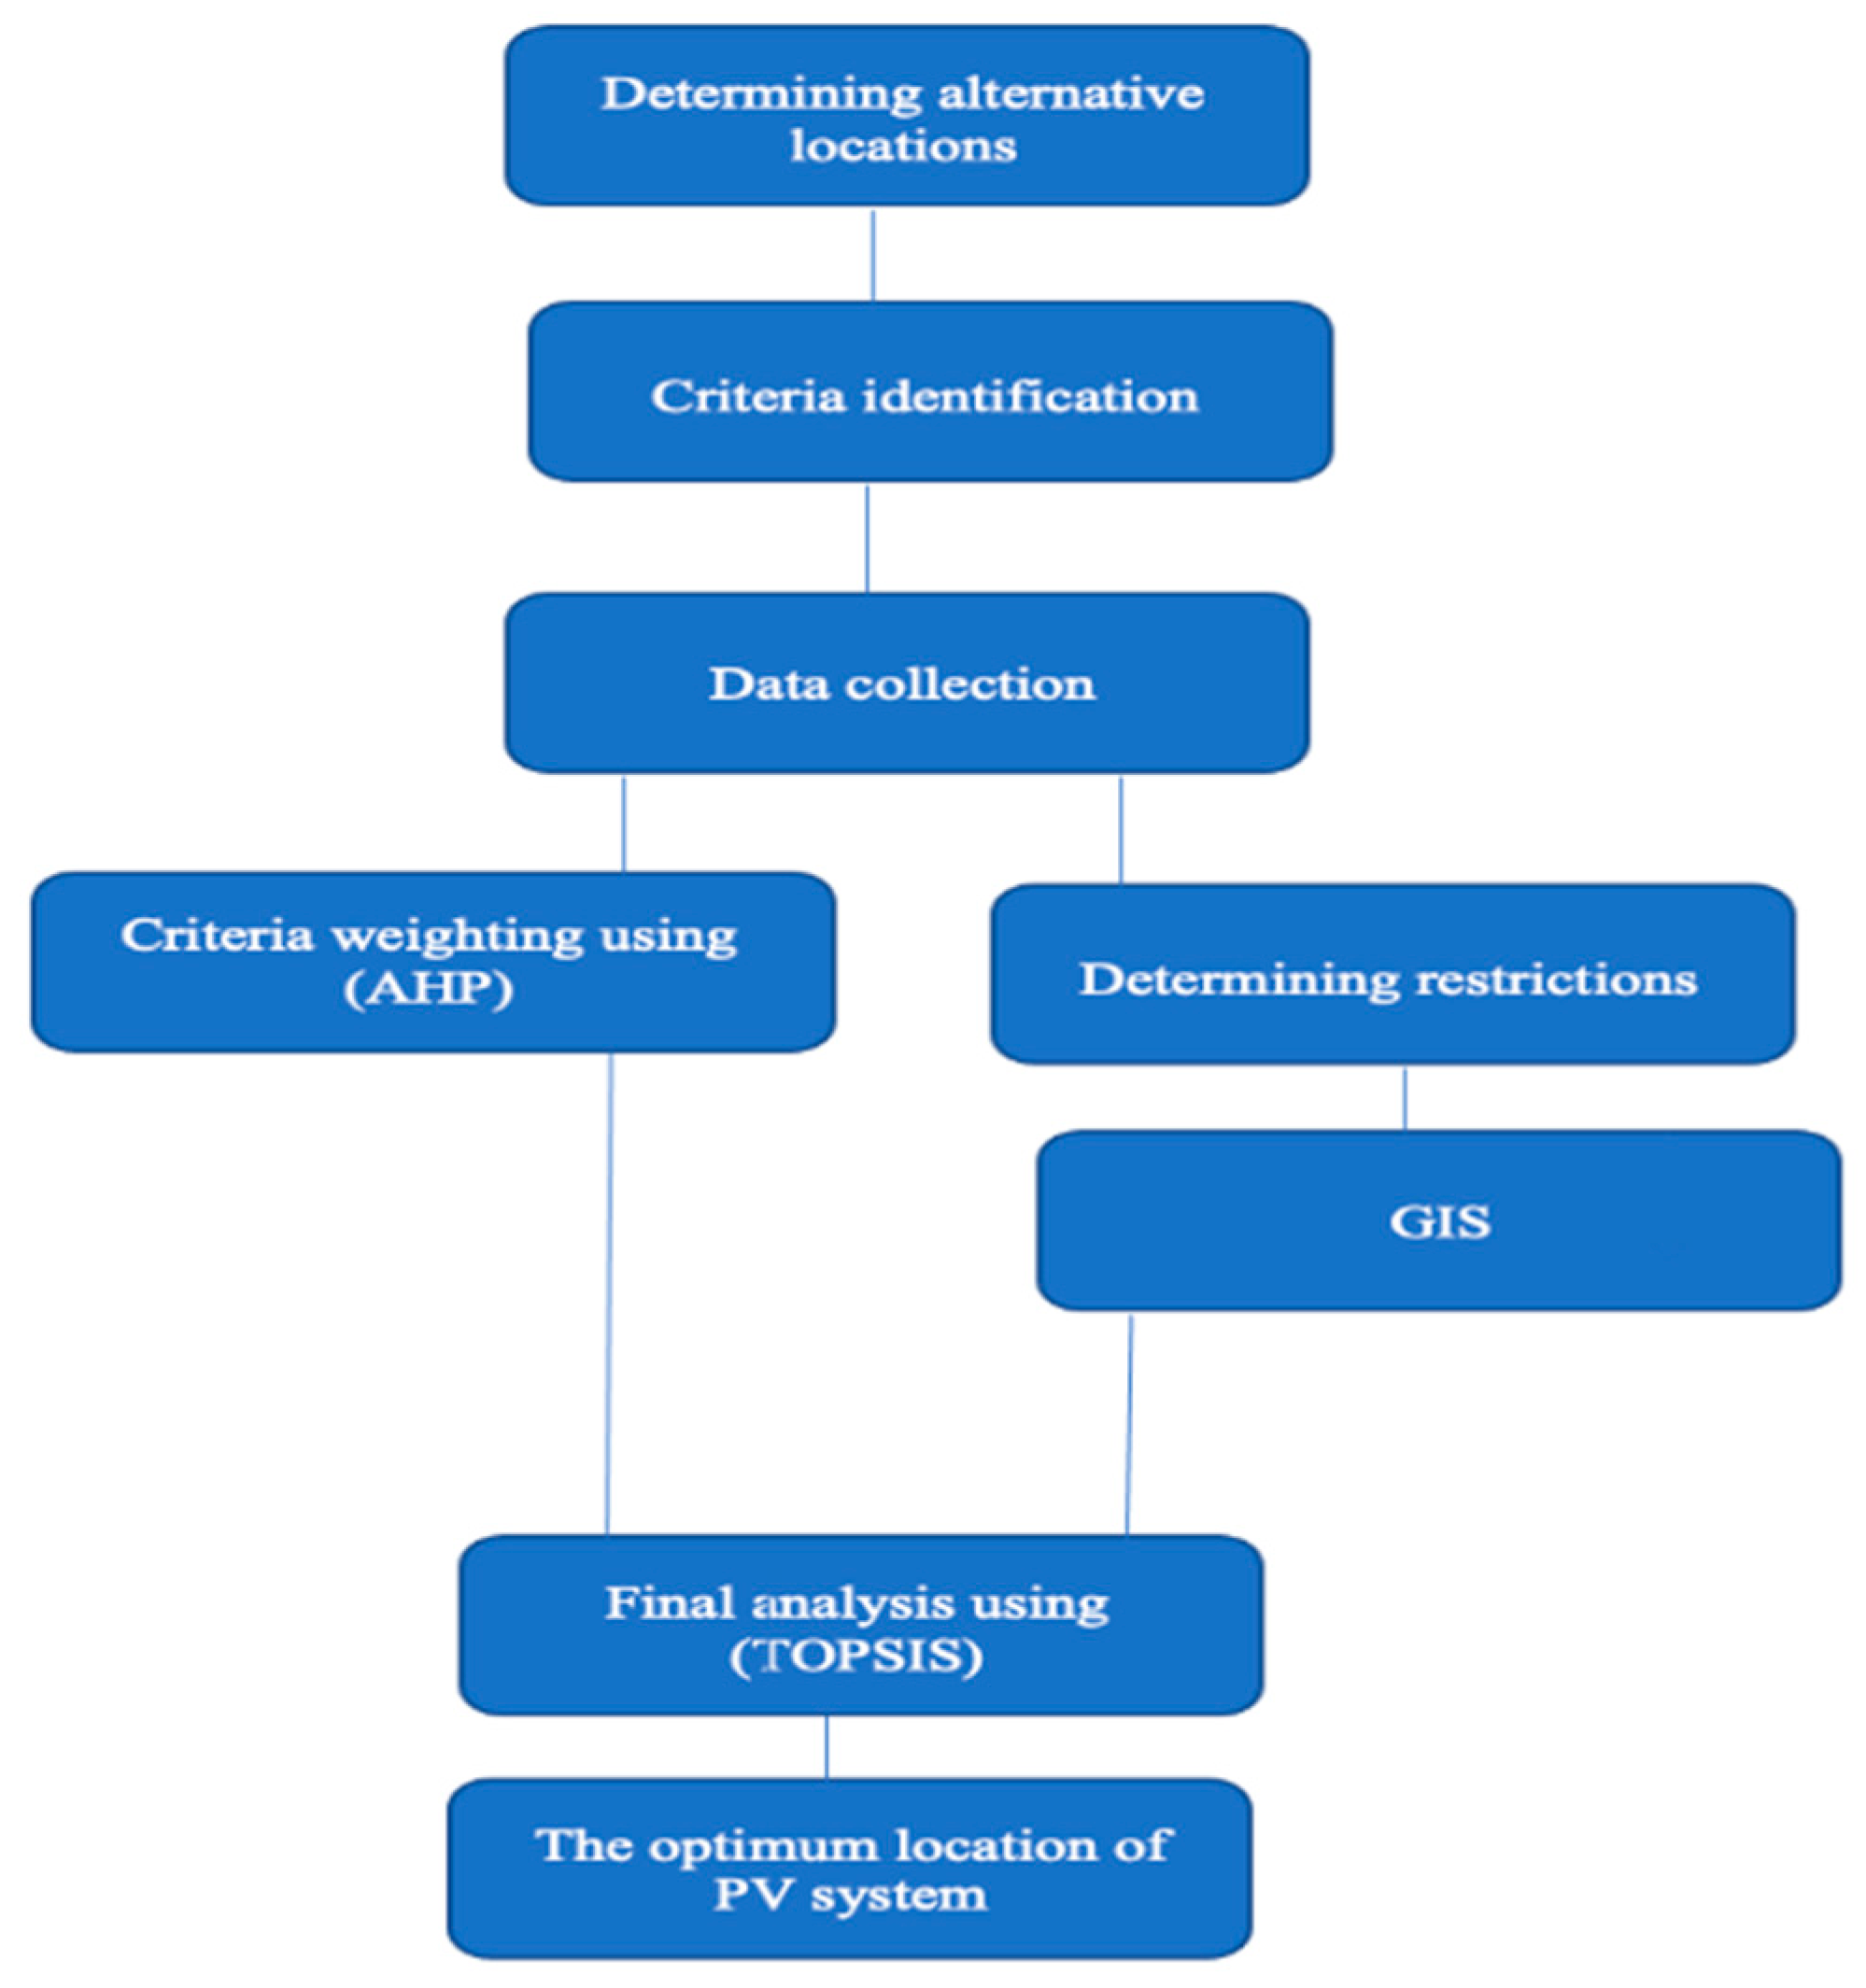
2.2. Selection Methodolgy
- Identifying the criteria that influence the decision of selecting the PV plant location.
- Loading the geodata of the identified criteria into the GIS. The important restriction inputs are applied to discard the unsuitable locations.
- Applying the AHP technique for determining the criteria weights, based on the relative importance of each one.
- Evaluating the remaining alternatives using TOPSIS analysis method.
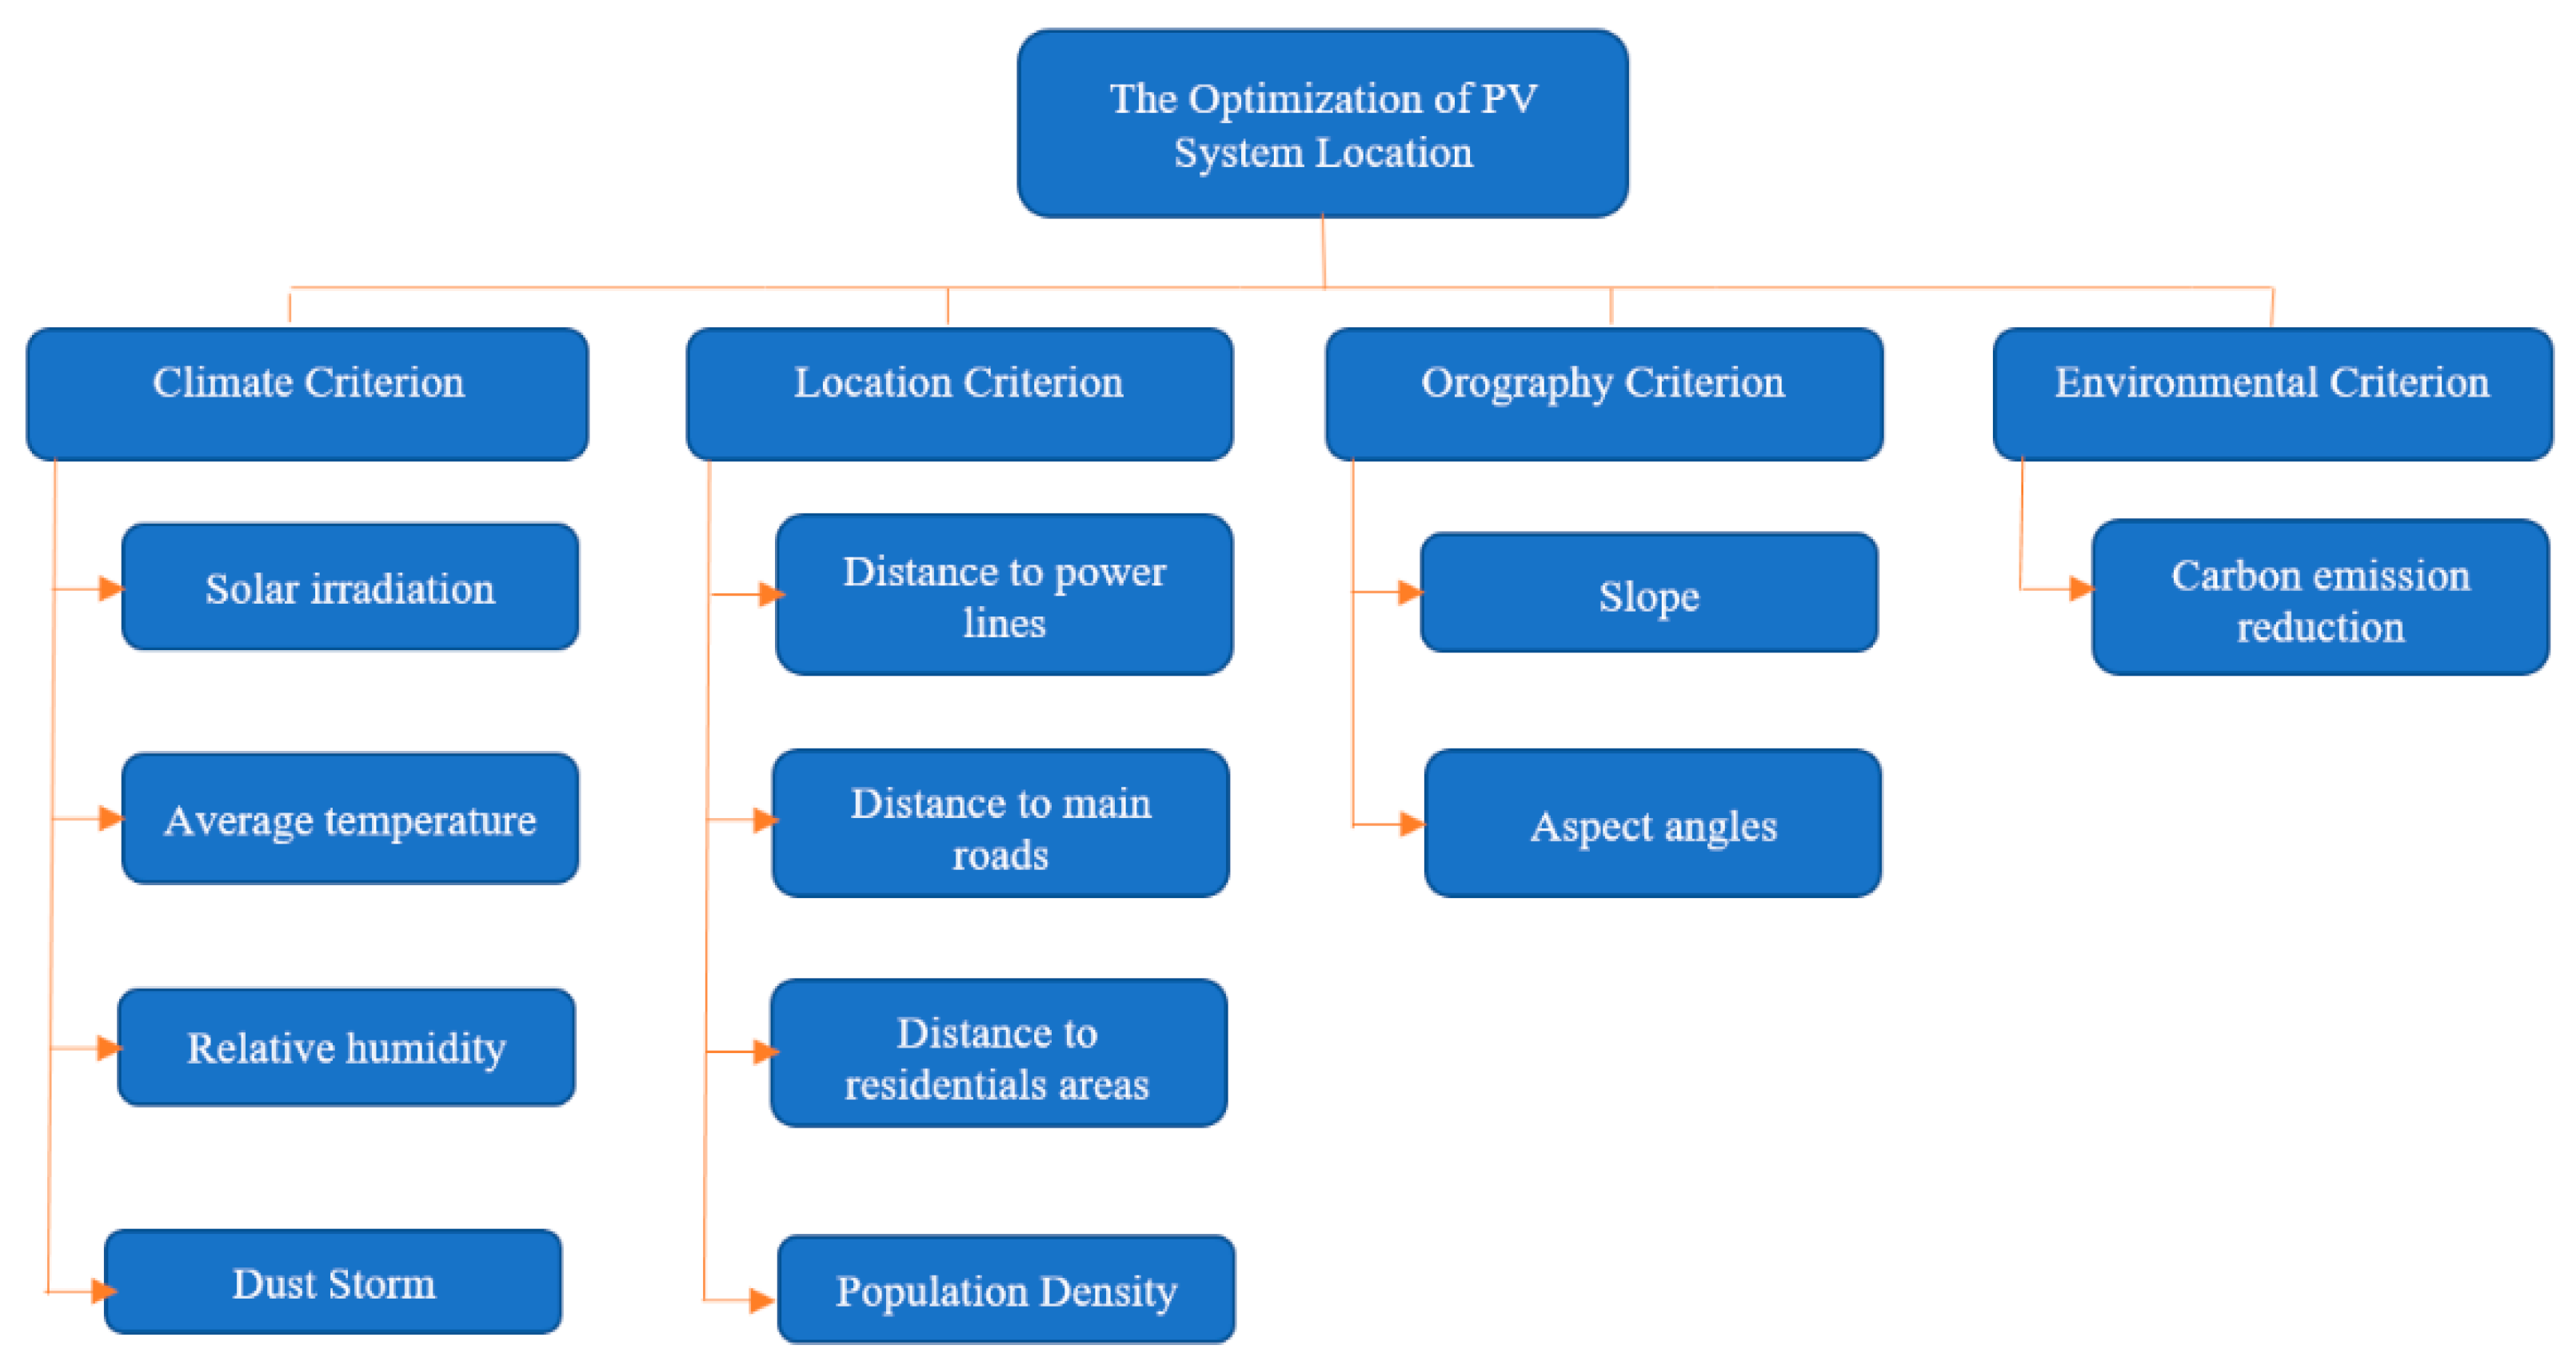
2.2.1. Criteria and Restrictions
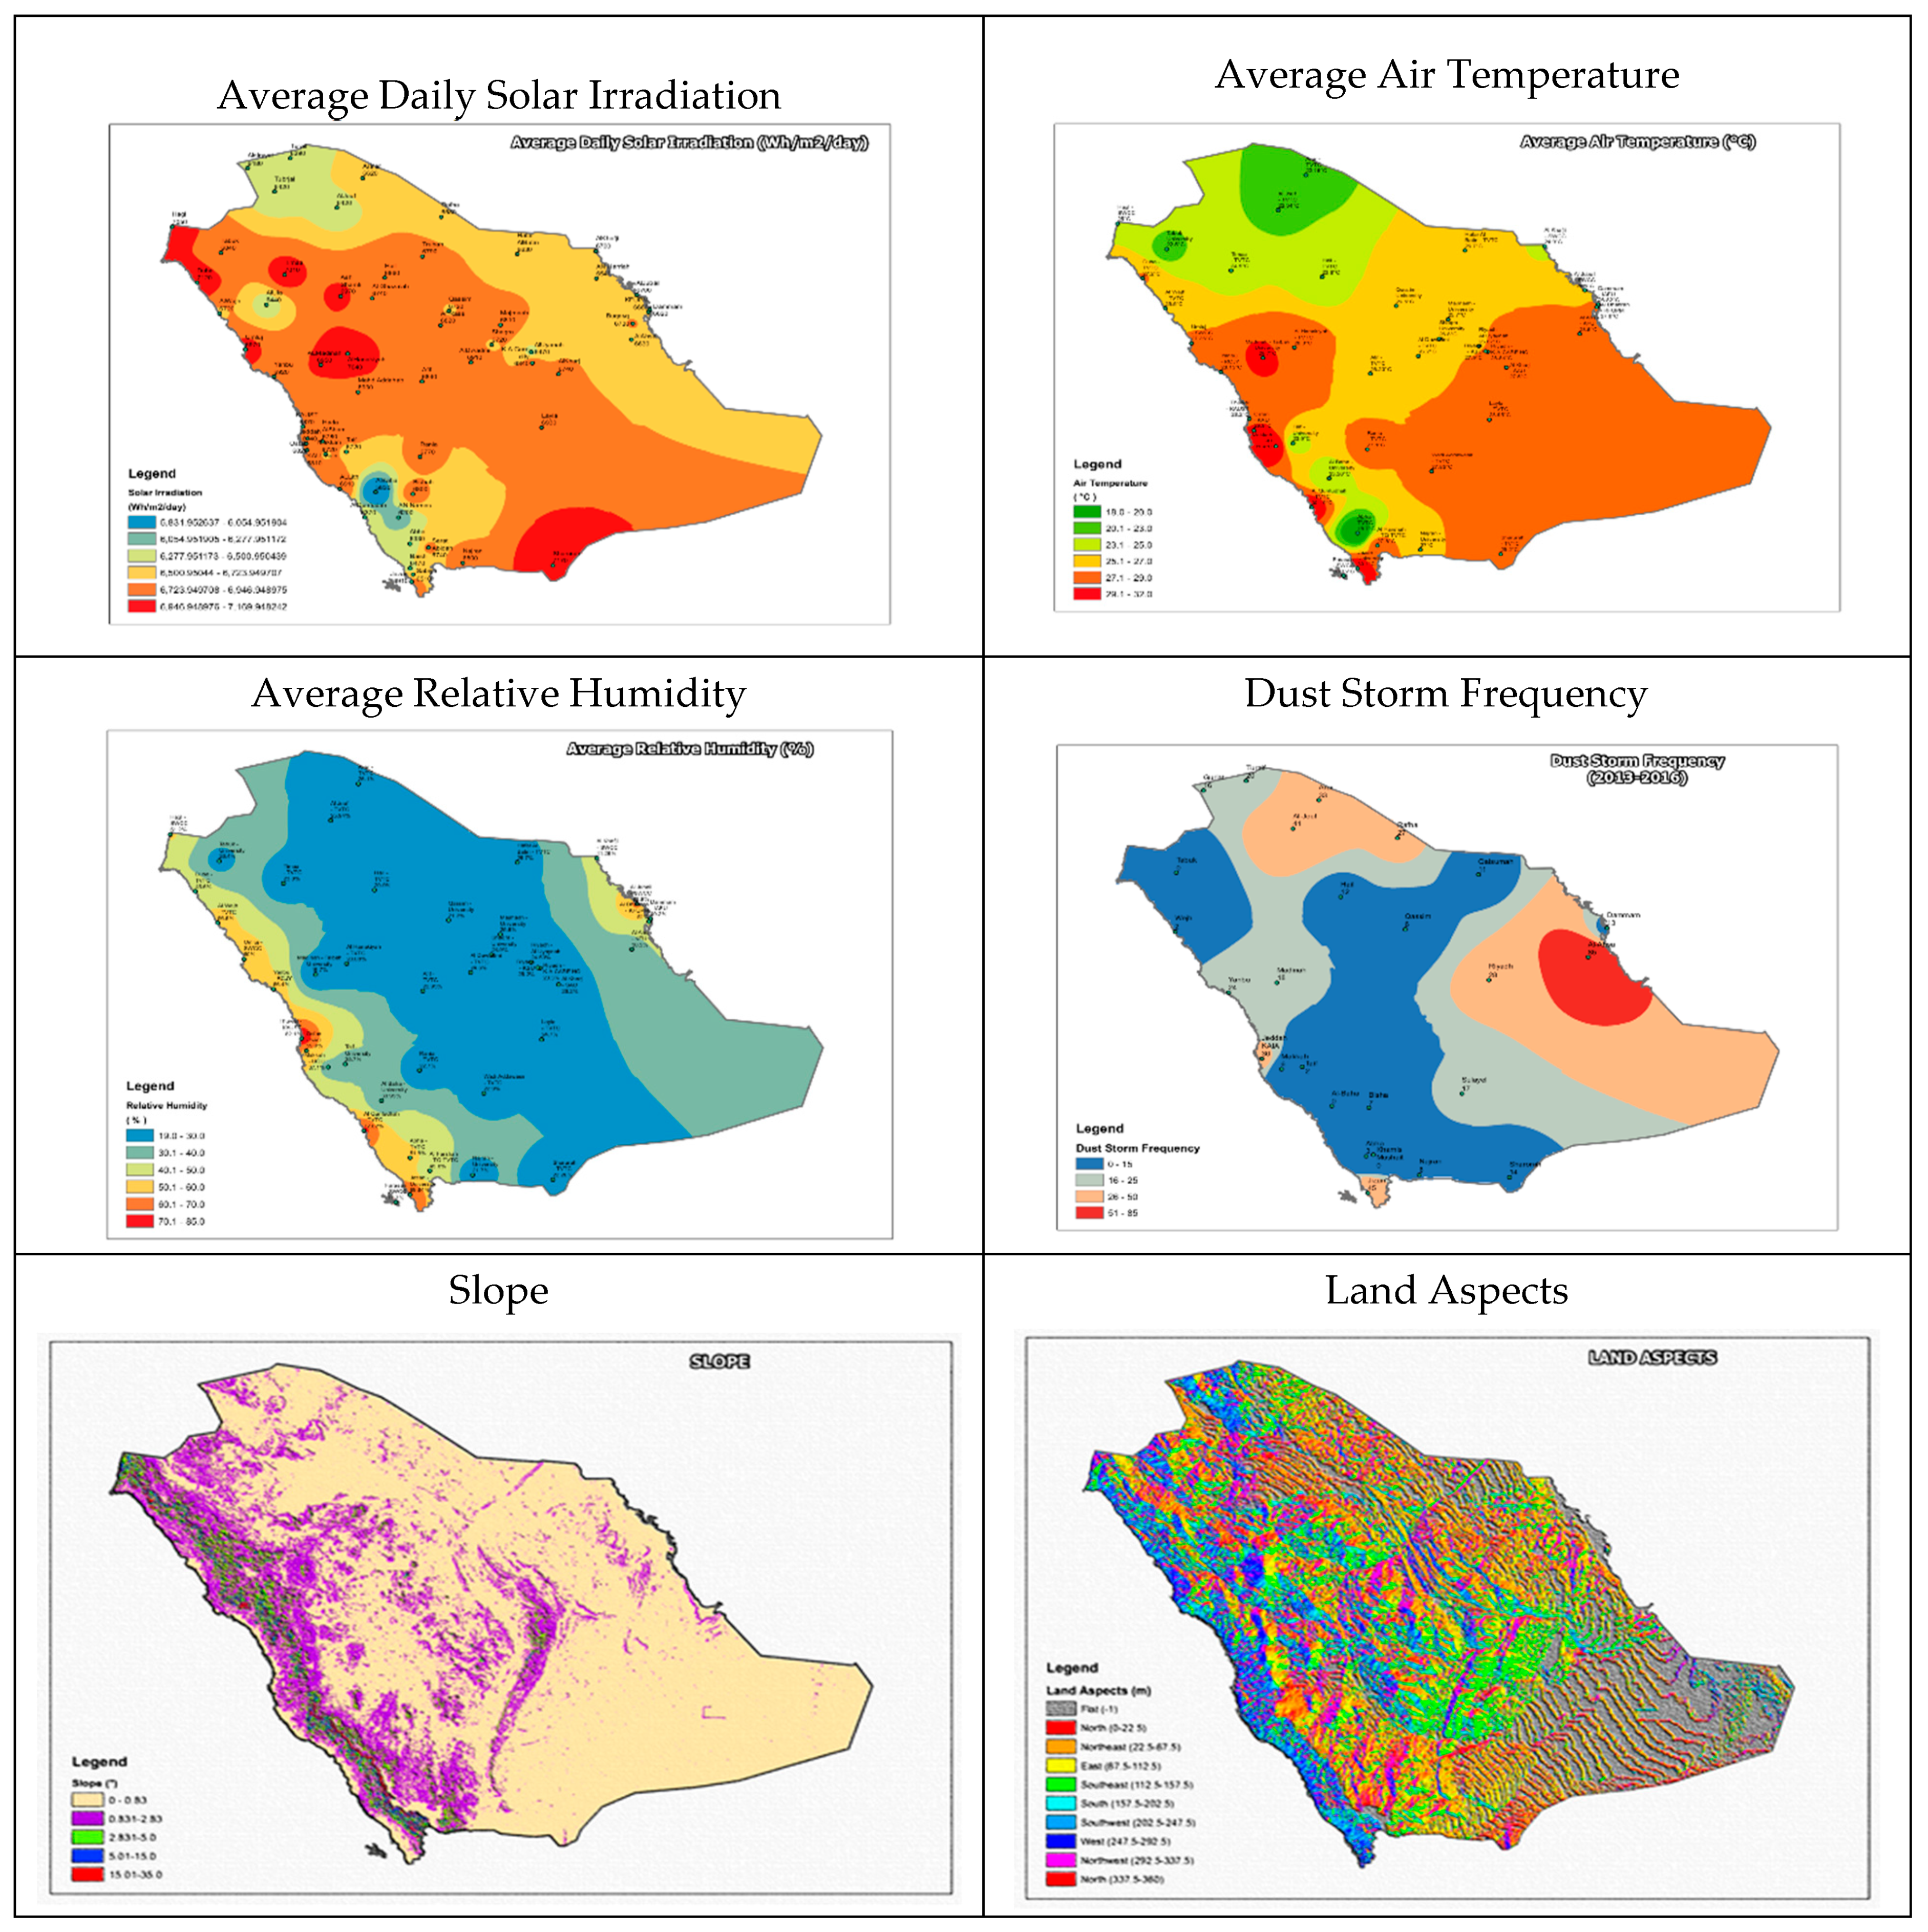
- Solar irradiation (m1): The continuous operation of a PV plant depends on the received solar irradiance, the annual solar radiation is considered as a climatic factor which is used to measure the intensity of sunshine for a candidate site and is normally expressed as an average of several years. The PV power output is related proportionally to the solar radiation. In this study, the annual average daily solar irradiation was calculated for all the locations chosen using PVGIS, which is a web-based calculator developed by the JRC (Joint Research Centre) of the European Commission.
- Average temperature (m2) and relative humidity (m3): As the temperature increases, the output power and the efficiency of the modules decreases [18]. In the contrary, high relative humidity is unlikable for PV module efficiency. Both descend factors are classified as climatic factors too. In this study, the data of the annual temperature and relative humidity were driven from the new network monitoring systems which have been developed by K.A. CARE as part of the Renewable Resource Monitoring and Mapping (RRMM) program.
- Dust storm (m4): The third climatic factor in this study is the dust storms. The Arabian Peninsula has been recognized as one of the five world regions where sand and dust storm generation are especially extreme [47]. Thus, this factor cannot be neglected in regions that have a climate such as Saudi Arabia. In this study, the data of the dust storm frequencies were driven from the presidency of the meteorology and environment of Saudi Arabia over the period of 2013–2016.
- Slope (m5) and orientations (aspect angles) (m6): The slope and aspects of the land are crucial topographical factors which play a considerable role for land suitability for PV system location [37]. Therefore, a land with a slope of more than 5 degree and non-south facing will be eliminated in order to avoid the shadow effect on the generation of the PV system [10]. In this study the data of slope and topographic orientation of Saudi Arabia have been downloaded as a digital elevation data form Alaska Satellite facilities database.
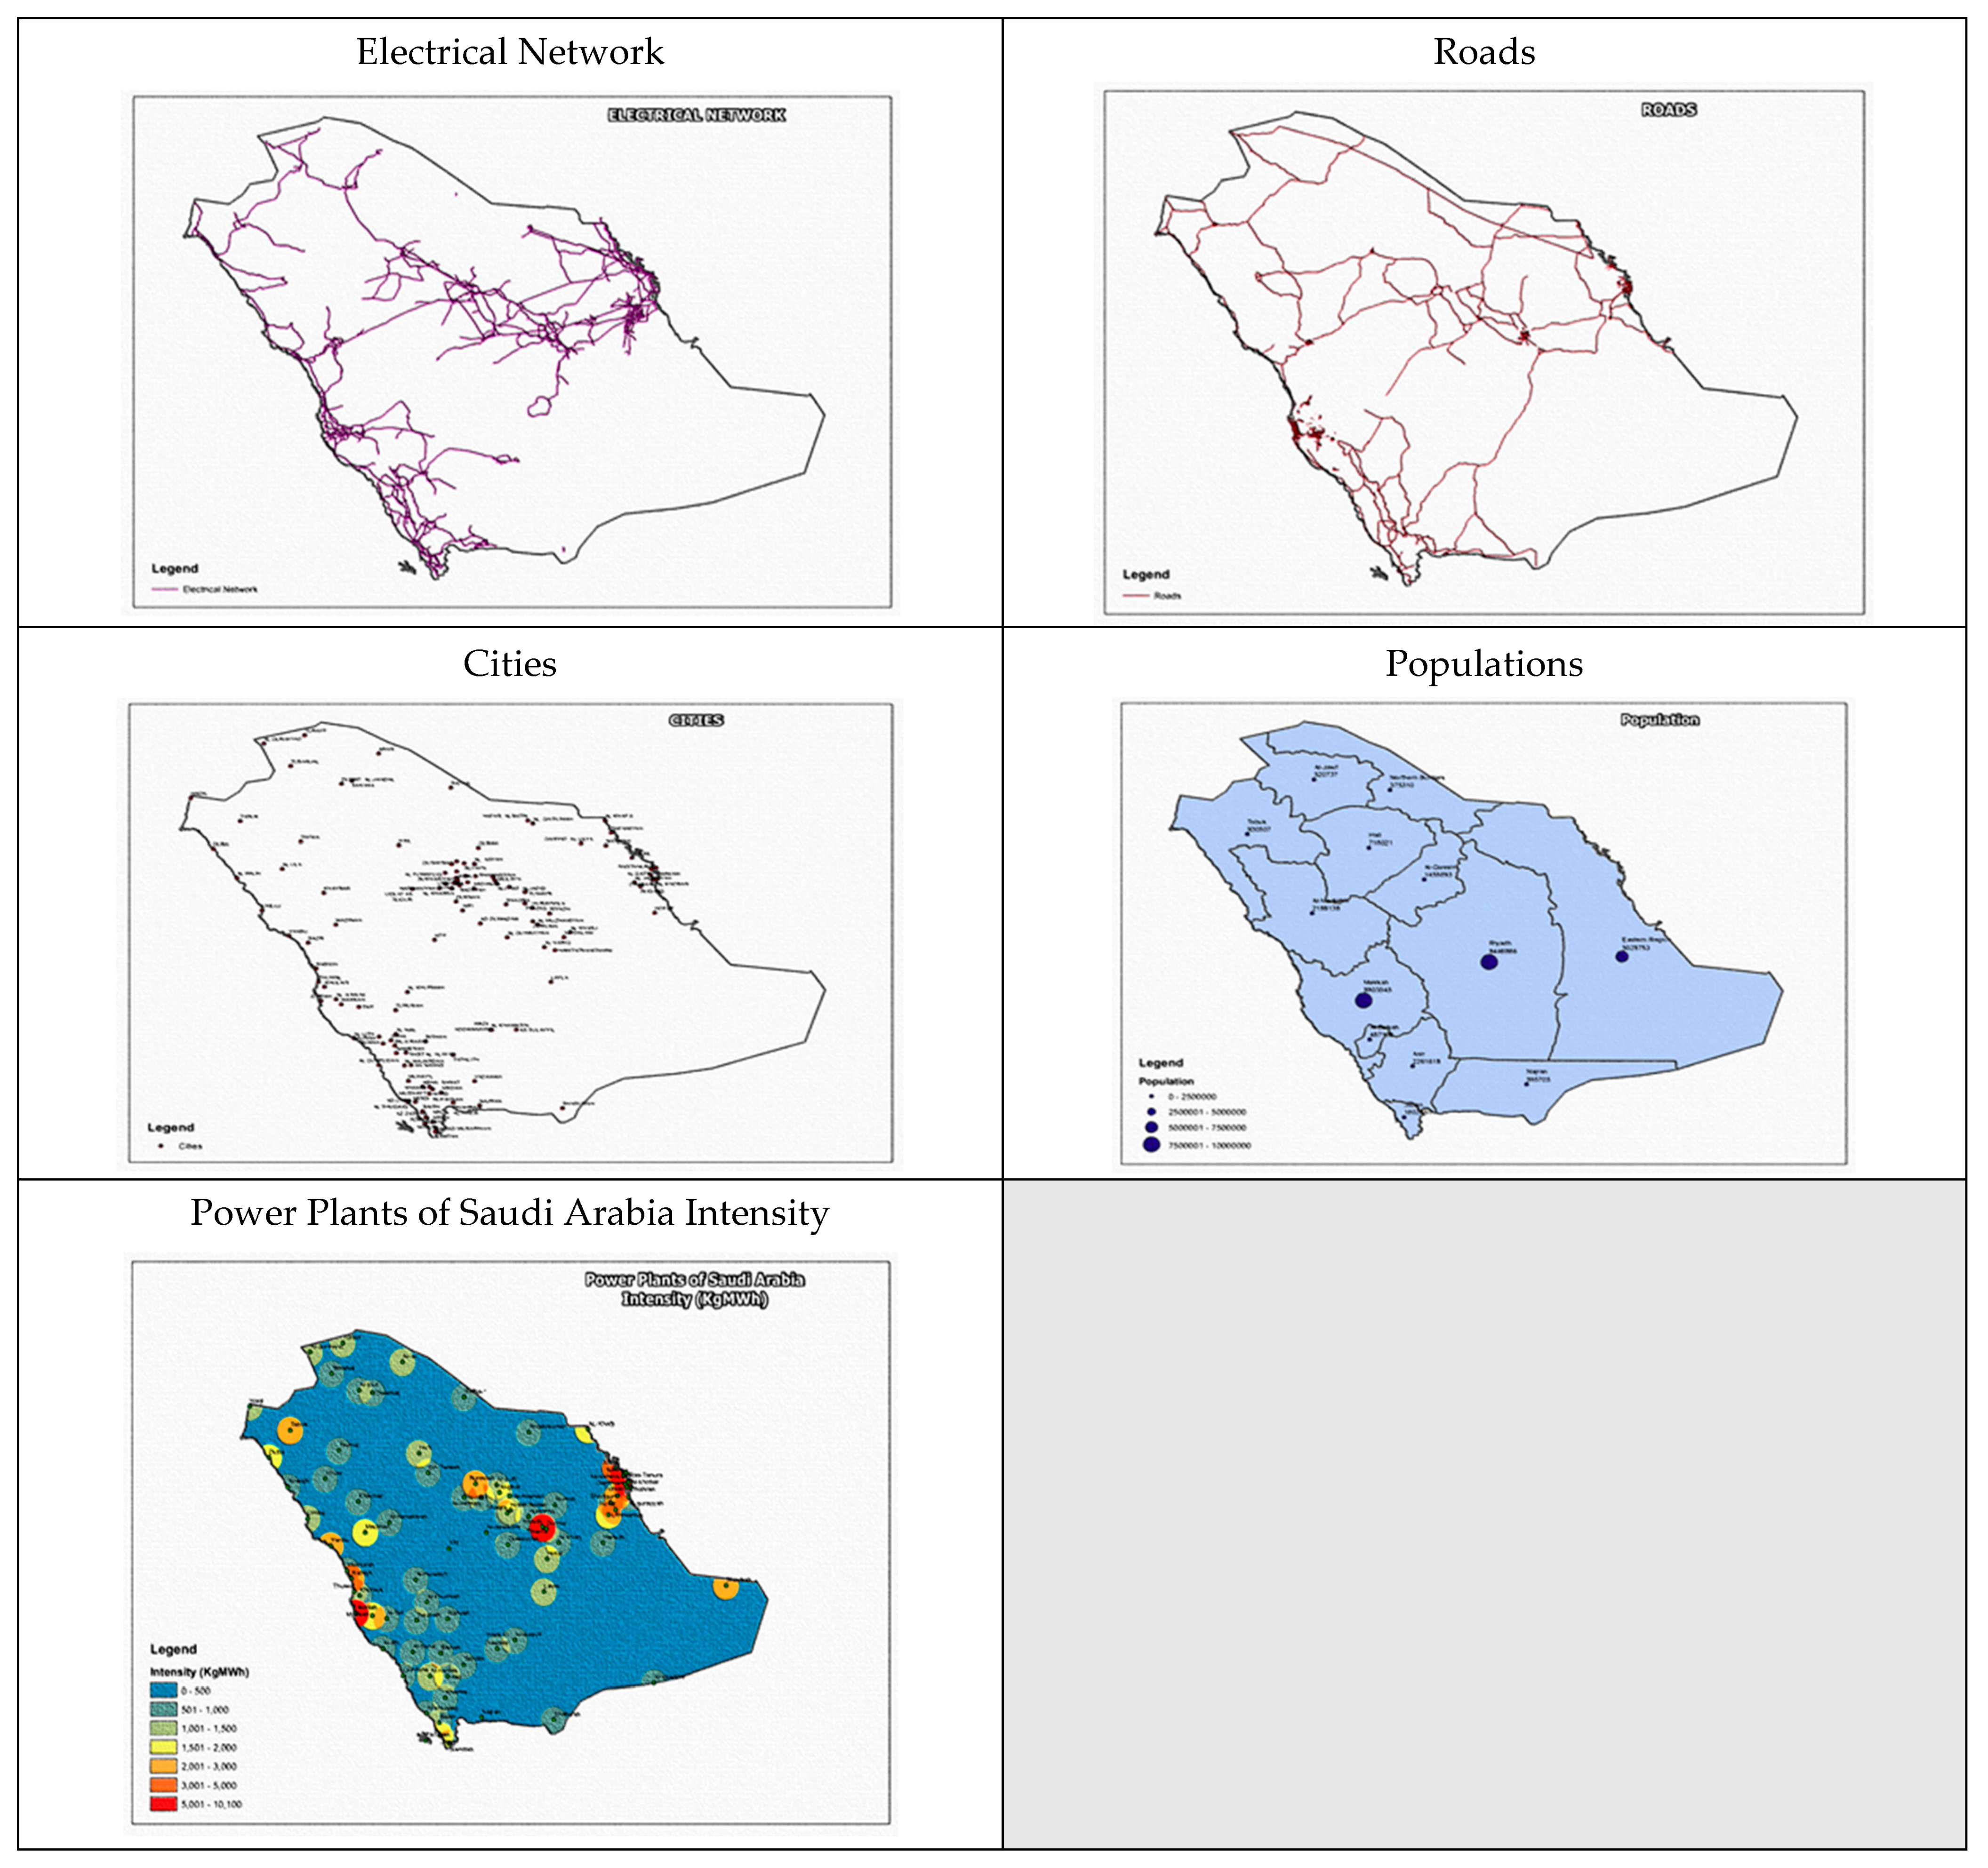
- Distance to power lines (m9), main roads (m10), and residentials areas (m7): The three mentioned sub-criteria here are sometimes classified as a location criterion and economic criterion. Generally, the importance of a solar power plant being close to the road network is for facilitating the transportation of modules and equipment, and the maintenance during and after the construction phase [14]. Moreover, it has to be close enough to residential areas and to the electrical grid to supply the electricity and to avoid constructing new power transmission lines [25]. In this study, the data of the power lines locations were collected from the internal website of Saudi Electricity company, and from KAPSARK data portal for the main roads, and Google Maps for residentials areas. A buffer distance restriction of 2 km for power lines, 0.5 km for main roads, and 50 km for residential areas has been applied to get an optimum location of the PV system.
- Population density (m8): is the fourth sub-criteria that classified as a location criterion. The establishment of a solar system must be close enough to a location that has adequate consumers and well skilled manpower to lower the cost of employing nonlocality manpower to construct, operate and maintain the PV system [30,41]. In this study, the data of the population for each alternative has been derived from KAPSARK data portal.
- Carbon emissions reduction (m11): is one of the critical sub-criteria that classified as an environmental criterion. Many studies discussed the carbon emission savings in terms of the manufacturing supply chain [44]. In this study, a different approach in minimizing the carbon emissions is considered by installing the PV system in the locations that have higher emissions of CO2. Thus, the data of total CO2 of power plants which are speared all over Saudi Arabia has been derived from the KAPSARK data portal and Google Maps.
2.2.2. Criteria Weighting Using AHP Technique
- Pairwise comparison scaling:
- B.
- Pairwise comparison matrix (A):
- C.
- Comparison matrix normalization (:
- D.
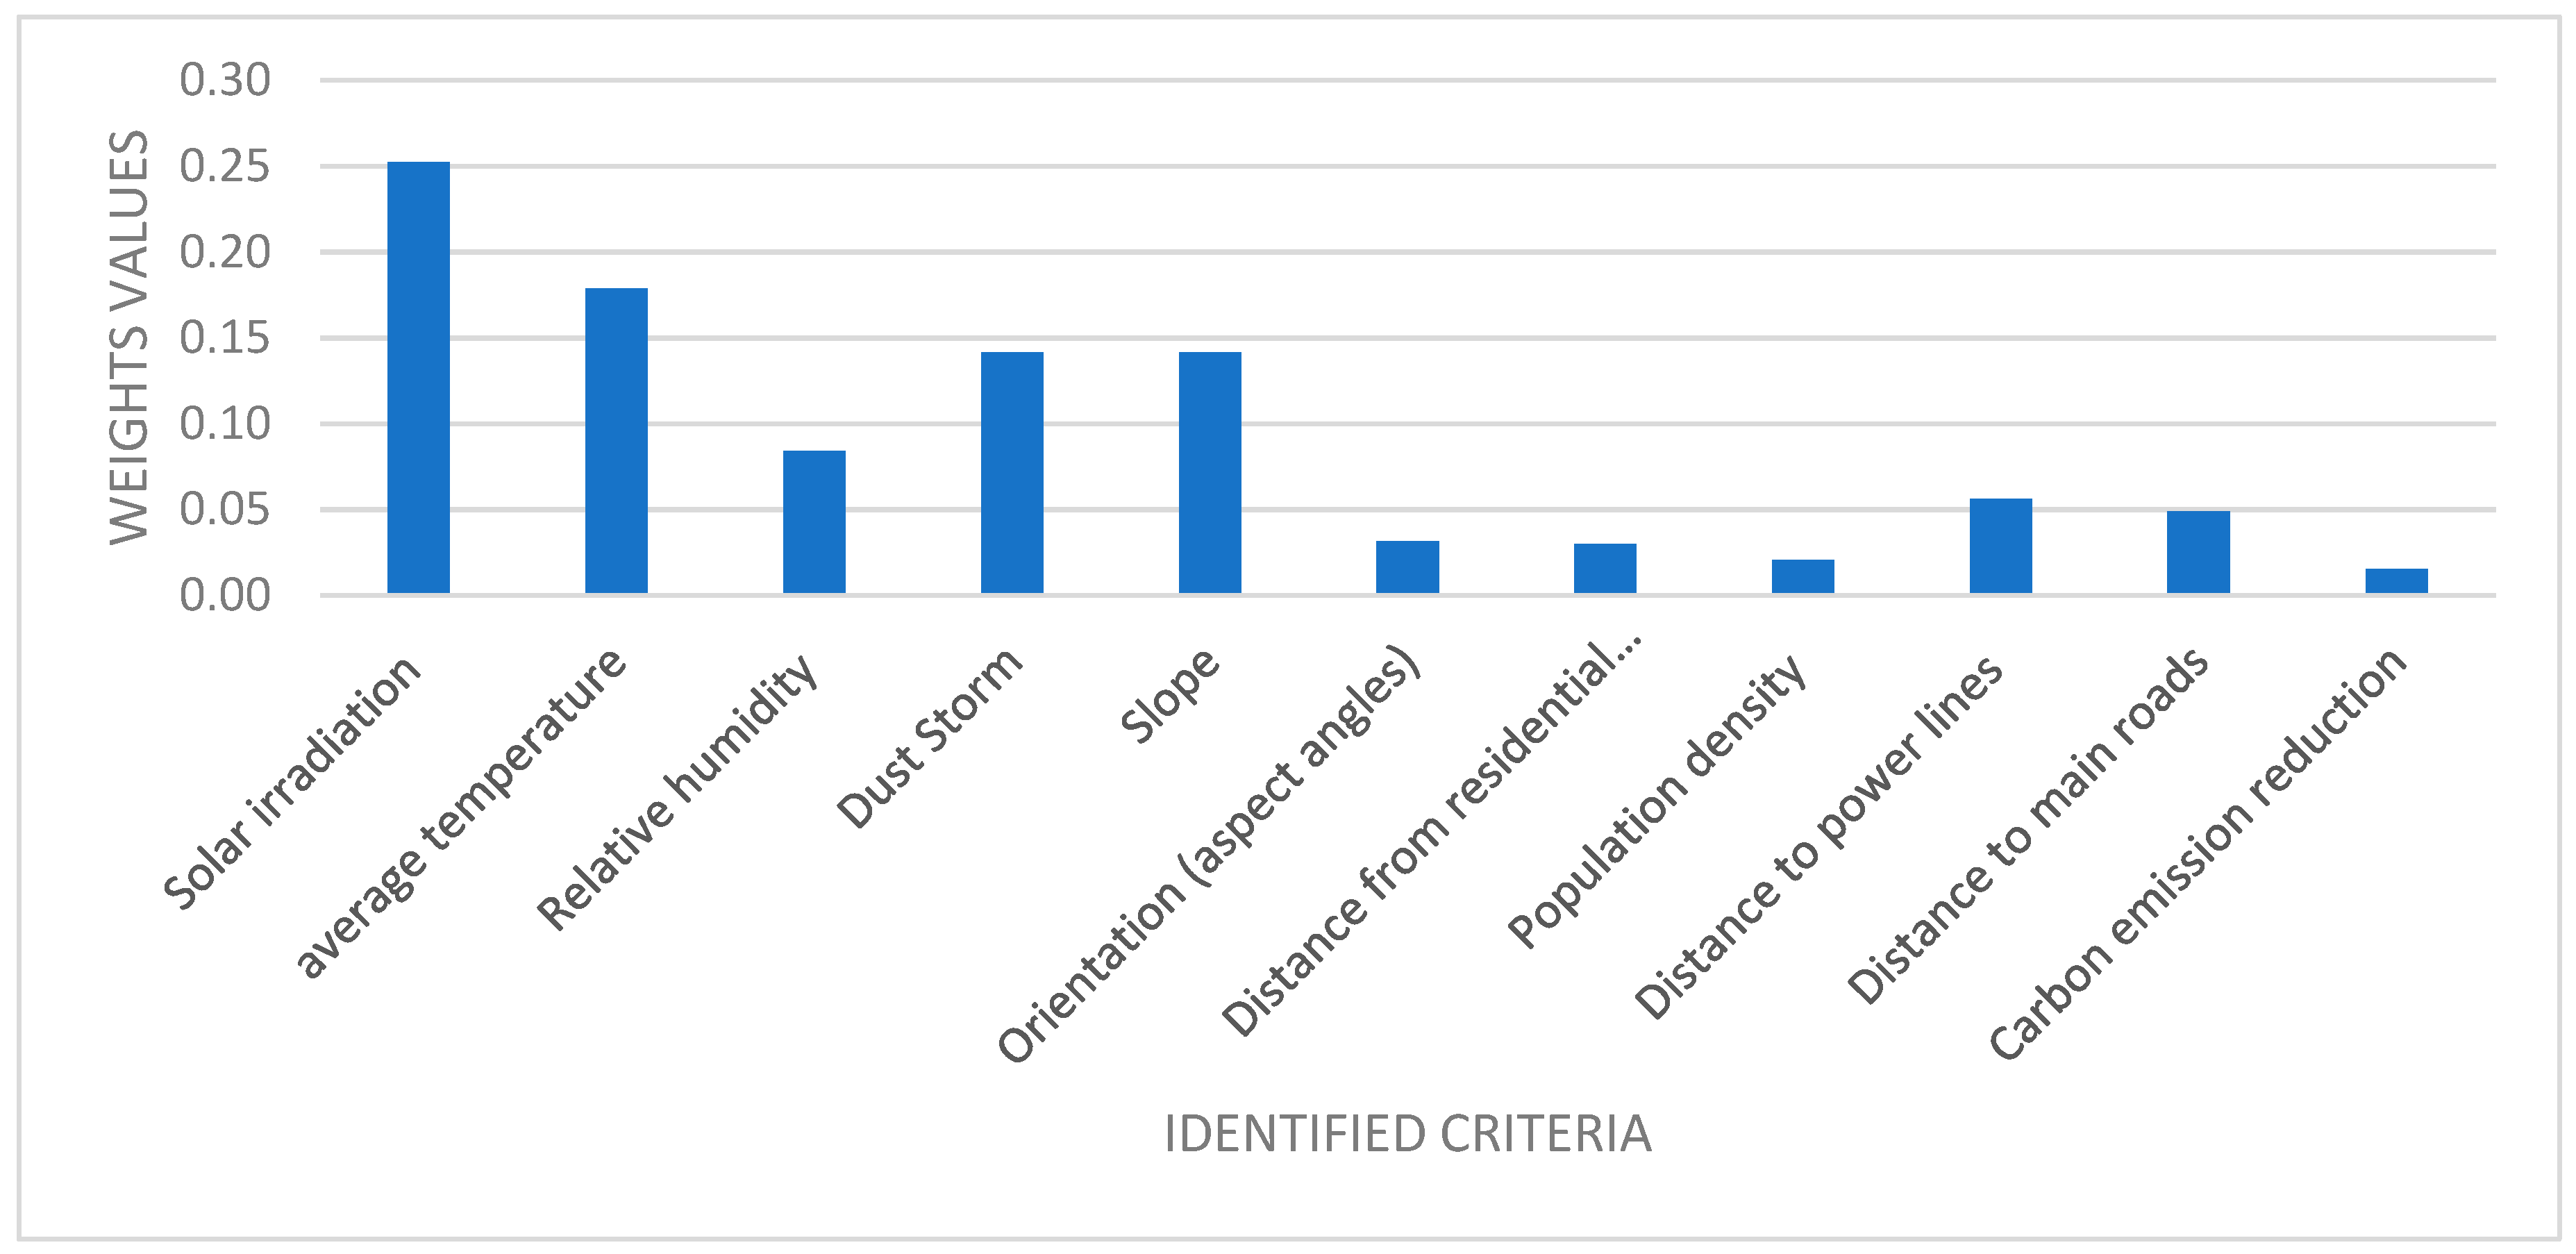
- Compute the overall weight vector (wi):
- E.
- Comparison matrix consistency verification:
2.2.3. Technique for Order Preference by Similarity to Ideal Solution
- A.
- Performance matrix creation and normalization (:
- B.
- Weighted normalized performance matrix ( × wi):
- C.
- Determining the positive and negative ideal solutions (zj+ & zj−):
- D.
- Finding the Euclidean distance from positive and negative ideal solutions (Si+ & Si−):
- E.
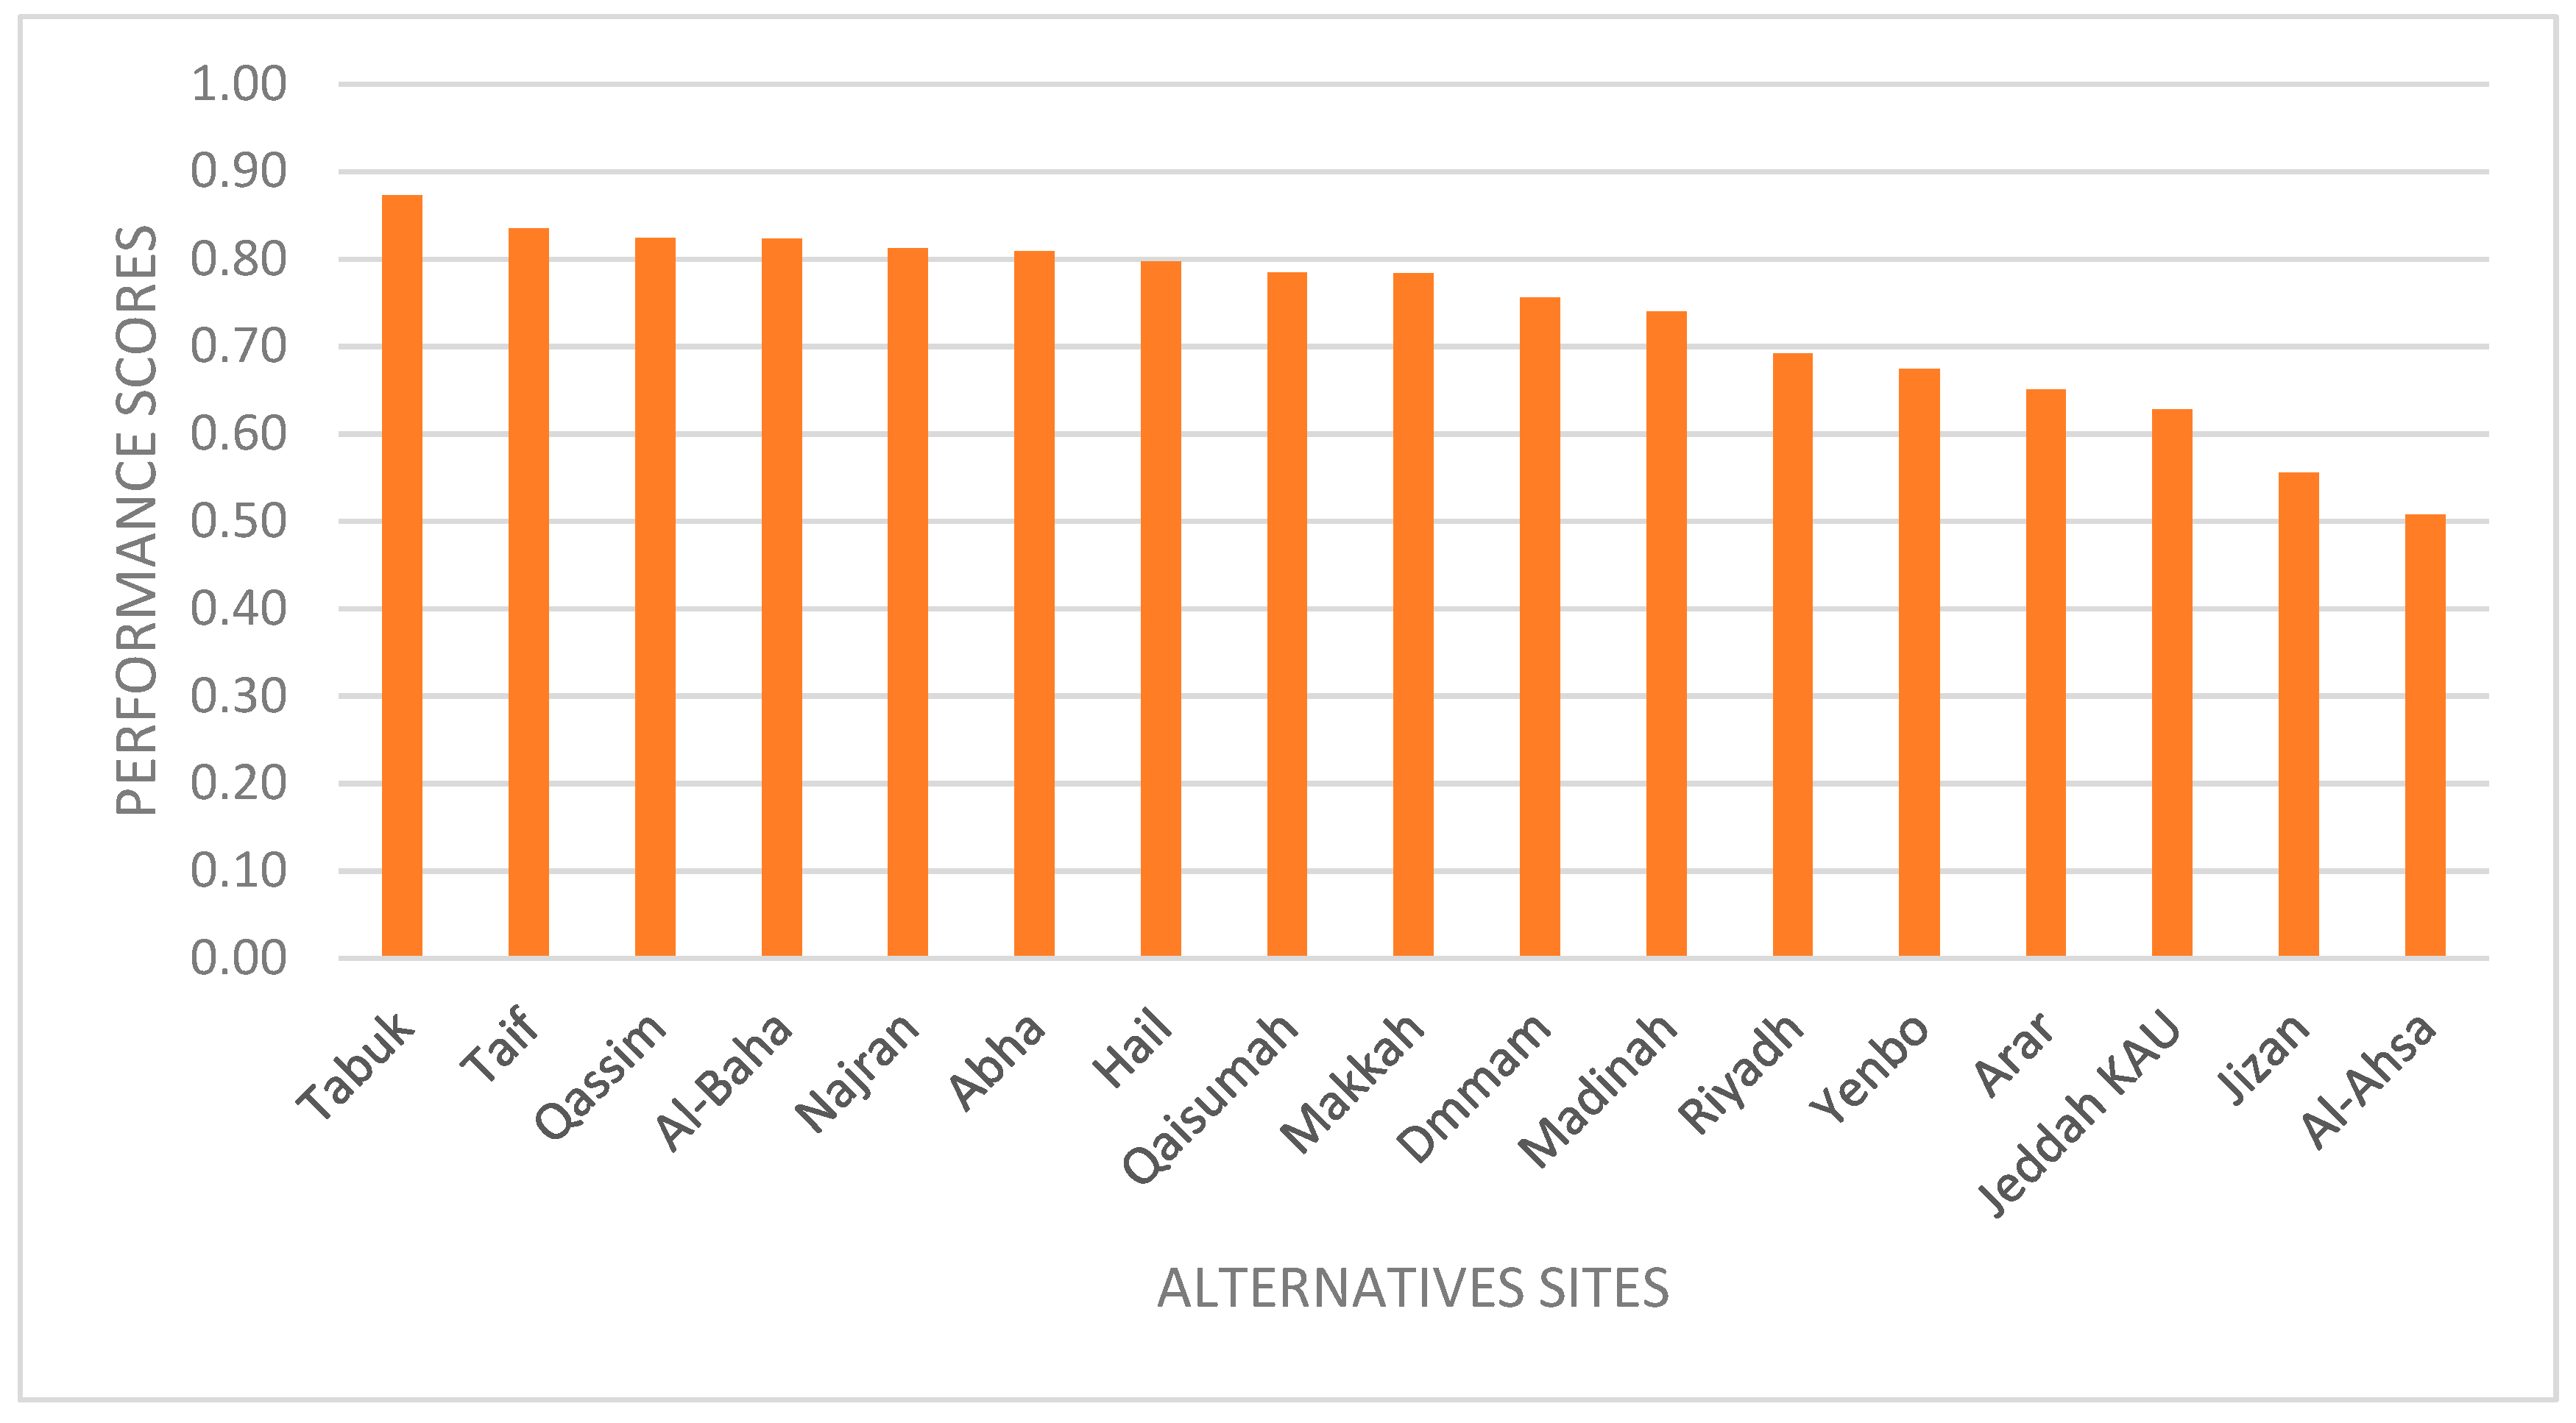
- Calculating the Performance score (Pi):
3. Results and Discussion
4. Conclusions
Author Contributions
Funding
Institutional Review Board Statement
Informed Consent Statement
Data Availability Statement
Acknowledgments
Conflicts of Interest
References
- Annual Report 2018. Saudi Electricity Company, Saudi Arabia. 2018. Available online: https://www.se.com.sa/en-us/Pages/AnnualReports.aspx (accessed on 20 August 2020).
- Global Carbon Atlas. 2018. Available online: http://www.globalcarbonatlas.org/en/content/welcome-carbon-atlas (accessed on 5 September 2020).
- Zell, E.; Gasim, S.; Wilcox, S.; Katamoura, S.; Stoffel, T.; Shibli, H.; Engel-Cox, J.; Al Subie, M. Assessment of solar radiation resources in Saudi Arabia. Sol. Energy 2015, 119, 422–438. [Google Scholar] [CrossRef]
- Renewable Energy Cost Analysis—Solar Photovoltaics. IRENA. Available online: https://www.irena.org/publications/2012/Jun/Renewable-Energy-Cost-Analysis---Solar-Photovoltaics (accessed on 10 July 2020).
- Renewable Power Generation Costs in 2019. IRENA. 2019. Available online: https://www.irena.org (accessed on 30 July 2020).
- Al Garni, H.Z.; Awasthi, A. Solar PV power plant site selection using a GIS-AHP based approach with application in Saudi Arabia. Appl. Energy 2017, 206, 1225–1240. [Google Scholar] [CrossRef]
- Cohen, M.A.; Callaway, D.S. Effects of distributed PV generation on California’s distribution system, Part 1: Engineering simulations. Sol. Energy 2016, 128, 126–138. [Google Scholar] [CrossRef]
- Watson, J.J.; Hudson, M.D. Regional Scale wind farm and solar farm suitability assessment using GIS-assisted multi-criteria evaluation. Landsc. Urban Plan. 2015, 138, 20–31. [Google Scholar] [CrossRef]
- Sanchezlozano, J.M.; Teruel-Solano, J.; Soto-Elvira, P.L.; García-Cascales, M.S. Geographical Information Systems (GIS) and Multi-Criteria Decision Making (MCDM) methods for the evaluation of solar farms locations: Case study in south-eastern Spain. Renew. Sustain. Energy Rev. 2013, 24, 544–556. [Google Scholar] [CrossRef]
- Charabi, Y.; Gastli, A. PV site suitability analysis using GIS-based spatial fuzzy multi-criteria evaluation. Renew. Energy 2011, 36, 2554–2561. [Google Scholar] [CrossRef]
- Rediske, G.; Siluk, J.C.M.; Michels, L.; Rigo, P.D.; Rosa, C.B.; Cugler, G. Multi-criteria decision-making model for assessment of large photovoltaic farms in Brazil. Energy 2020, 197, 117167. [Google Scholar] [CrossRef]
- Sánchez-Lozano, J.M.; García-Cascales, M.S.; Lamata, M.T. Evaluation of suitable locations for the installation of solar thermoelectric power plants. Comput. Ind. Eng. 2015, 87, 343–355. [Google Scholar] [CrossRef]
- Uyan, M. GIS-based solar farms site selection using analytic hierarchy process (AHP) in Karapinar region, Konya/Turkey. Renew. Sustain. Energy Rev. 2013, 28, 11–17. [Google Scholar] [CrossRef]
- Merrouni, A.A.; Elalaoui, F.E.; Mezrhab, A.; Mezrhab, A.; Ghennioui, A. Large scale PV sites selection by combining GIS and Analytical Hierarchy Process. Case study: Eastern Morocco. Renew. Energy 2018, 119, 863–873. [Google Scholar] [CrossRef]
- Sánchez-Lozano, J.; García-Cascales, M.S.; Lamata, M.T. Comparative TOPSIS-ELECTRE TRI methods for optimal sites for photovoltaic solar farms. Case study in Spain. J. Clean. Prod. 2016, 127, 387–398. [Google Scholar] [CrossRef]
- Suh, J.; Brownson, J.R.S. Solar Farm Suitability Using Geographic Information System Fuzzy Sets and Analytic Hierarchy Processes: Case Study of Ulleung Island, Korea. Energies 2016, 9, 648. [Google Scholar] [CrossRef]
- Doljak, D.; Stanojević, G. Evaluation of natural conditions for site selection of ground-mounted photovoltaic power plants in Serbia. Energy 2017, 127, 291–300. [Google Scholar] [CrossRef]
- Habib, S.M.; Suliman, A.E.-R.E.; Al Nahry, A.H.; El Rahman, E.N.A. Spatial modeling for the optimum site selection of solar photovoltaics power plant in the northwest coast of Egypt. Remote Sens. Appl. Soc. Environ. 2020, 18, 100313. [Google Scholar] [CrossRef]
- Aly, A.; Jensen, S.S.; Pedersen, A.B. Solar power potential of Tanzania: Identifying CSP and PV hot spots through a GIS multicriteria decision making analysis. Renew. Energy 2017, 113, 159–175. [Google Scholar] [CrossRef]
- Yunna, W.; Geng, S. Multi-criteria decision making on selection of solar–wind hybrid power station location: A case of China. Energy Convers. Manag. 2014, 81, 527–533. [Google Scholar] [CrossRef]
- Ko, W.; Al-Ammar, E.A.; Almahmeed, M. Development of Feed-in Tariff for PV in the Kingdom of Saudi Arabia. Energies 2019, 12, 2898. [Google Scholar] [CrossRef]
- Al-Saleh, Y.M.; Taleb, H.M. The Economic Viability of Solar Photovoltaics within the Saudi Residential Sector. In Proceedings of the Conference on Technology & Sustainability in the Built Environment, King Saud University, Riyadh, Saudi Arabia, 3–6 January 2010; p. 12. [Google Scholar]
- Alharthi, Y.Z.; Siddiki, M.K.; Chaudhry, G.M. Resource Assessment and Techno-Economic Analysis of a Grid-Connected Solar PV-Wind Hybrid System for Different Locations in Saudi Arabia. Sustainability 2018, 10, 3690. [Google Scholar] [CrossRef]
- Rehman, S.; Ahmed, M.; Mohamed, M.H.; Al-Sulaiman, F.A. Feasibility study of the grid connected 10 MW installed capacity PV power plants in Saudi Arabia. Renew. Sustain. Energy Rev. 2017, 80, 319–329. [Google Scholar] [CrossRef]
- Al Garni, H.Z.; Awasthi, A. Solar PV Power Plants Site Selection. In Advances in Renewable Energies and Power Technologies; Elsevier: Amsterdam, The Netherlands, 2018; pp. 57–75. [Google Scholar]
- Chiabrando, R.; Fabrizio, E.; Garnero, G. The territorial and landscape impacts of photovoltaic systems: Definition of impacts and assessment of the glare risk. Renew. Sustain. Energy Rev. 2009, 13, 2441–2451. [Google Scholar] [CrossRef]
- Pohekar, S.; Ramachandran, M. Application of multi-criteria decision making to sustainable energy planning—A review. Renew. Sustain. Energy Rev. 2004, 8, 365–381. [Google Scholar] [CrossRef]
- Carrión, J.A.; Estrella, A.E.; Toro, F.A.D.M.Z.; Rodríguez, M.; Ridao, A.R. Environmental decision-support systems for evaluation the carrying capacity of land areas: Optimal site selection for grid-connected photovoltaic power plants. Renewa. Sustain. Energy Rev. 2008, 12, 2358–2380. [Google Scholar]
- Sanchezlozano, J.M.; Antunes, C.H.; García-Cascales, M.S.; Dias, L.C. GIS-based photovoltaic solar farms site selection using ELECTRE-TRI: Evaluating the case for Torre Pacheco, Murcia, Southeast of Spain. Renew. Energy 2014, 66, 478–494. [Google Scholar] [CrossRef]
- Sindhu, S.; Nehra, V.; Luthra, S. Investigation of feasibility study of solar farms deployment using hybrid AHP-TOPSIS analysis: Case study of India. Renew. Sustain. Energy Rev. 2017, 73, 496–511. [Google Scholar] [CrossRef]
- Aydin, N.Y.; Kentel, E.; Duzgun, H.S. GIS-based site selection methodology for hybrid renewable energy systems: A case study from western Turkey. Energy Convers. Manag. 2013, 70, 90–106. [Google Scholar] [CrossRef]
- Wang, Q.; M’Ikiugu, M.M.; Kinoshita, I. A GIS-Based Approach in Support of Spatial Planning for Renewable Energy: A Case Study of Fukushima, Japan. Sustainability 2014, 6, 2087–2117. [Google Scholar] [CrossRef]
- Lee, A.H.I.; Kang, H.-Y.; Lin, C.Y.; Shen, K.-C. An Integrated Decision-Making Model for the Location of a PV Solar Plant. Sustainability 2015, 7, 13522–13541. [Google Scholar] [CrossRef]
- Lee, A.H.I.; Kang, H.-Y.; Liou, Y.-J. A Hybrid Multiple-Criteria Decision-Making Approach for Photovoltaic Solar Plant Location Selection. Sustainability 2017, 9, 184. [Google Scholar] [CrossRef]
- Borgogno-Mondino, E.; Fabrizio, E.; Chiabrando, R. Site Selection of Large Ground-Mounted Photovoltaic Plants: A GIS Decision Support System and an Application to Italy. Int. J. Green Energy 2014, 12, 515–525. [Google Scholar] [CrossRef]
- Piyatadsananon, P. Spatial Factors Consideration in Site Selection of Ground-mounted PV Power Plants. Energy Procedia 2016, 100, 78–85. [Google Scholar] [CrossRef]
- Majumdar, D.; Pasqualetti, M.J. Analysis of land availability for utility-scale power plants and assessment of solar photovoltaic development in the state of Arizona, USA. Renew. Energy 2019, 134, 1213–1231. [Google Scholar] [CrossRef]
- Boran, F.E.; Menlik, T.; Boran, K. Multi-criteria Axiomatic Design Approach to Evaluate Sites for Grid-connected Photovoltaic Power Plants: A Case Study in Turkey. Energy Sources Part B Econ. Plan. Policy 2010, 5, 290–300. [Google Scholar] [CrossRef]
- Kereush, D.; Perovych, I. Determining criteria for optimal site selection for solar power plants. Geomat. Landmanag. Landsc. 2017, 4, 39–54. [Google Scholar] [CrossRef]
- Janke, J.R. Multicriteria GIS modeling of wind and solar farms in Colorado. Renew. Energy 2010, 35, 2228–2234. [Google Scholar] [CrossRef]
- Kengpol, A.; Rontlaong, P.; Tuominen, M. Design of a decision support system for site selection using fuzzy AHP: A case study of solar power plant in north eastern parts of Thailand. In Proceedings of the 2012 Proceedings of PICMET ’12: Technology Management for Emerging Technologies, Vancouver, BC, Canada, 29 July–2 August 2012. [Google Scholar]
- Massimo, A.; Dell’Isola, M.; Frattolillo, A.; Ficco, G. Development of a Geographical Information System (GIS) for the Integration of Solar Energy in the Energy Planning of a Wide Area. Sustainability 2014, 6, 5730–5744. [Google Scholar] [CrossRef]
- Sabo, M.L.; Mariun, N.; Hizam, H.; Radzi, M.A.M.; Zakaria, A. Spatial energy predictions from large-scale photovoltaic power plants located in optimal sites and connected to a smart grid in Peninsular Malaysia. Renew. Sustain. Energy Rev. 2016, 66, 79–94. [Google Scholar] [CrossRef]
- Liu, J.; Xu, F.; Lin, S. Site selection of photovoltaic power plants in a value chain based on grey cumulative prospect theory for sustainability: A case study in Northwest China. J. Clean. Prod. 2017, 148, 386–397. [Google Scholar] [CrossRef]
- Anwarzai, M.A.; Nagasaka, K. Utility-scale implementable potential of wind and solar energies for Afghanistan using GIS multi-criteria decision analysis. Renew. Sustain. Energy Rev. 2017, 71, 150–160. [Google Scholar] [CrossRef]
- Zhang, Z.; Gao, J.; Gao, Y.; Yu, W. Two-sided matching decision making with multi-granular hesitant fuzzy linguistic term sets and incomplete criteria weight information. Expert Syst. Appl. 2020, 114311. [Google Scholar] [CrossRef]
- Butt, M.J.; Mashat, A.S. MODIS satellite data evaluation for sand and dust storm monitoring in Saudi Arabia. Int. J. Remote Sens. 2018, 39, 8627–8645. [Google Scholar] [CrossRef]
- Saaty, T.L. Multicriteria Decision Making: The Analytic Hierarchy Process: Planning, Priority Setting Resource Allocation; Thomas, L., Ed.; SAATY McGraw-Hill: New York, NY, USA, 1990. [Google Scholar]
- Hwang, C.-L.; Yoon, K. Methods for Multiple Attribute Decision Making. In Lecture Notes in Economics and Mathematical Systems; Springer: Berlin/Heidelberg, Germany, 1981. [Google Scholar]


| Major Criteria | Sub-Criteria | References |
|---|---|---|
| Climatic | Solar irradiation | [6,9,10,12,13,14,15,16,29,30,31,32,33,34,35] |
| Average temperature | [6,9,10,12,15,29,33,34,35] | |
| Relative humidity | [17,18,36] | |
| Wind speed | [18,33,34,36] | |
| Dust storm | [37] | |
| Sun hour duration | [17,18,33,34,38] | |
| Orography | Slope | [6,9,12,13,15,29,32] |
| Aspect angles | [15,26,27,35,39] | |
| Plot area | [9,12,15,29] | |
| Location | Distance from residential areas (m) | [6,8,9,11,12,13,15,17,29,30,31] |
| Visual impact | [9,30] | |
| Population density | [40,41,42,43] | |
| Distance to power lines | [8,9,10,12,13,14,15,29,30,31,33,34,40,41,43] | |
| Distance to historical areas | [8,37] | |
| Distance to wildlife designations | [8,16,37] | |
| Distance to main roads | [8,9,10,11,12,13,14,15,29,40,43] | |
| Land cover | [40] | |
| Distance to substations | [9,12,15,29] | |
| Economic | Land cost | [41] |
| Construction cost | [41] | |
| Environmental | Carbon emission savings | [44] |
| Agrological capacity | [9,12,29] |
| RES Technology | Site Location | Weighting Method | Analysis Method | References |
|---|---|---|---|---|
| PV | Saudi Arabia | AHP | WSM (Weighted Sum Model) | [6] |
| PV-CSP-Wind | Southern England | AHP | AHP | [8] |
| PV | Murcia, Spain | AHP | TOPSIS | [9] |
| PV | Oman | AHP | FLOWA(Flow Analysis) | [10] |
| PV | Brazil | AHP | TOPSIS | [11] |
| Solar Thermoelectric | Murcia, Spain | AHP | Fuzzy TOPSIS-ELECTRE | [12] |
| PV | Konya, Turkey | AHP | AHP | [13] |
| PV | Eastern Morocco | AHP | AHP | [14] |
| PV | Murcia, Spain | AHP | TOPSIS-ELECTRE TRI | [15] |
| PV | South Korea | Fuzzy Set | AHP | [16] |
| PV | Serbia | AHP | AHP | [17] |
| PV | Northwest cost of Egypt | AHP | WSM (Weighted Sum Model) | [18] |
| PV-CSP | Tanzania | AHP | AHP | [19] |
| PV-CSP-Wind | China | AHP | AHP | [20] |
| PV | Murcia, Spain | ELECTRE TRI | ELECTRE TRI | [29] |
| PV | India | AHP | Fuzzy TOPSIS | [30] |
| Hybrid | Western Turkey | Fuzzy | OWA (Ordered Weighted Averaging) | [31] |
| PV-CSP-Wind | Colorado, USA | WLC | WLC | [40] |
| PV | Northwest China | Grey cumulative | [44] | |
| PV-CSP-Wind | Afghanistan | WLC(Weighted Linear Combination) | [45] |
| m1 (Wh/m2/d) | m2 (C°) | m3 (%) | m4 (#) | m5 (°) | m6 | m7 (Km) | m8 (people) | m9 (Km) | m10 (Km) | m11 (Kg) | |
|---|---|---|---|---|---|---|---|---|---|---|---|
| Abha | 6330 | 18.7 | 51.8 | 3 | 2 | South | 50 | 236,157 | 2 | 1 | 405,314,000 |
| Al-Ahsa | 6630 | 28.5 | 30.5 | 85 | 2 | South | 50 | 660,788 | 2 | 1 | 661,633,000 |
| Al-Baha | 5830 | 23.56 | 30.95 | 0 | 2 | South | 50 | 95,089 | 2 | 1 | 3,278,570 |
| Arar | 6620 | 22.16 | 26.1 | 33 | 2 | South | 50 | 167,057 | 2 | 1 | 173,546,300 |
| Dammam | 6620 | 26.82 | 49.2 | 13 | 2 | South | 50 | 903,312 | 2 | 1 | 26,974,200 |
| Hail | 6860 | 23.8 | 20.9 | 12 | 2 | South | 50 | 310,897 | 2 | 1 | 97,083,250 |
| Jeddah | 6740 | 28.2 | 82.1 | 30 | 2 | South | 50 | 3,430,697 | 2 | 1 | 5,563,960,870 |
| Jizan | 6910 | 30.1 | 69.84 | 45 | 2 | South | 50 | 127,743 | 2 | 1 | 313,196,200 |
| Madinah | 6950 | 29.7 | 19.7 | 18 | 2 | South | 50 | 1,100,093 | 2 | 1 | 157,041,430 |
| Makkah | 6720 | 31.4 | 37.1 | 6 | 2 | South | 50 | 1,534,731 | 2 | 1 | 95,244,410 |
| Najran | 6800 | 27 | 21.7 | 6 | 2 | South | 50 | 298,288 | 2 | 1 | 314,453,000 |
| Qaisumah | 6630 | 26.7 | 25.7 | 11 | 2 | South | 50 | 22,538 | 2 | 1 | 160,493,000 |
| Qassim | 6720 | 26.5 | 21.3 | 6 | 2 | South | 50 | 467,410 | 2 | 1 | 1,905,935,400 |
| Riyadh | 6840 | 27.9 | 25.2 | 28 | 2 | South | 50 | 5,188,286 | 2 | 1 | 1,954,276,620 |
| Tabuk | 6840 | 22.5 | 26.4 | 0 | 2 | South | 50 | 512,629 | 2 | 1 | 6,387,374,830 |
| Taif | 6720 | 23.9 | 35.7 | 2 | 2 | South | 50 | 579,970 | 2 | 1 | 481,743,000 |
| Yenbo | 6920 | 28.15 | 56.4 | 24 | 2 | South | 50 | 233,236 | 2 | 1 | 1,010,612,100 |
| The Importance Scale (aij) of The Criteria | The Description |
|---|---|
| 1 | Criteria i and j are of equal importance |
| 3 | Criteria i is slightly more important than j |
| 5 | Criteria i is moderately more important than j |
| 7 | Criteria i is strongly more important than j |
| 9 | Criteria i is extremely more important than j |
| 2, 4, 6, 8 | Intermediate values |
| m1 | m2 | m3 | m4 | m5 | m6 | m7 | m8 | m9 | m10 | m11 | |
|---|---|---|---|---|---|---|---|---|---|---|---|
| m1 | 1.00 | 2.00 | 5.00 | 3.00 | 3.00 | 7.00 | 7.00 | 8.00 | 4.00 | 5.00 | 9.00 |
| m2 | 0.50 | 1.00 | 4.00 | 2.00 | 2.00 | 6.00 | 6.00 | 7.00 | 3.00 | 4.00 | 8.00 |
| m3 | 0.20 | 0.25 | 1.00 | 0.33 | 0.33 | 3.00 | 4.00 | 5.00 | 3.00 | 4.00 | 5.00 |
| m4 | 0.33 | 0.50 | 3.00 | 1.00 | 1.00 | 4.00 | 5.00 | 6.00 | 5.00 | 6.00 | 7.00 |
| m5 | 0.33 | 0.50 | 3.00 | 1.00 | 1.00 | 4.00 | 5.00 | 6.00 | 5.00 | 6.00 | 7.00 |
| m6 | 0.14 | 0.17 | 0.33 | 0.25 | 0.25 | 1.00 | 1.00 | 2.00 | 0.50 | 0.33 | 3.00 |
| m7 | 0.14 | 0.17 | 0.25 | 0.20 | 0.20 | 1.00 | 1.00 | 2.00 | 0.50 | 0.33 | 3.00 |
| m8 | 0.13 | 0.14 | 0.20 | 0.17 | 0.17 | 0.50 | 0.50 | 1.00 | 0.25 | 0.33 | 2.00 |
| m9 | 0.25 | 0.33 | 0.33 | 0.20 | 0.20 | 2.00 | 2.00 | 4.00 | 1.00 | 2.00 | 5.00 |
| m10 | 0.20 | 0.25 | 0.25 | 0.17 | 0.17 | 3.00 | 3.00 | 3.00 | 0.50 | 1.00 | 4.00 |
| m11 | 0.11 | 0.13 | 0.20 | 0.14 | 0.14 | 0.33 | 0.33 | 0.50 | 0.20 | 0.25 | 1.00 |
| Sum | 3.34 | 5.43 | 17.57 | 8.46 | 8.46 | 31.83 | 34.83 | 44.50 | 22.95 | 29.25 | 54.00 |
| m1 | m2 | m3 | m4 | m5 | m6 | m7 | m8 | m9 | m10 | m11 | |
|---|---|---|---|---|---|---|---|---|---|---|---|
| m1 | 0.30 | 0.37 | 0.28 | 0.35 | 0.35 | 0.22 | 0.20 | 0.18 | 0.17 | 0.17 | 0.17 |
| m2 | 0.15 | 0.18 | 0.23 | 0.24 | 0.24 | 0.19 | 0.17 | 0.16 | 0.13 | 0.14 | 0.15 |
| m3 | 0.06 | 0.05 | 0.06 | 0.04 | 0.04 | 0.09 | 0.11 | 0.11 | 0.13 | 0.14 | 0.09 |
| m4 | 0.10 | 0.09 | 0.17 | 0.12 | 0.12 | 0.13 | 0.14 | 0.13 | 0.22 | 0.21 | 0.13 |
| m5 | 0.10 | 0.09 | 0.17 | 0.12 | 0.12 | 0.13 | 0.14 | 0.13 | 0.22 | 0.21 | 0.13 |
| m6 | 0.04 | 0.03 | 0.02 | 0.03 | 0.03 | 0.03 | 0.03 | 0.04 | 0.02 | 0.01 | 0.06 |
| m7 | 0.04 | 0.03 | 0.01 | 0.02 | 0.02 | 0.03 | 0.03 | 0.04 | 0.02 | 0.01 | 0.06 |
| m8 | 0.04 | 0.03 | 0.01 | 0.02 | 0.02 | 0.02 | 0.01 | 0.02 | 0.01 | 0.01 | 0.04 |
| m9 | 0.07 | 0.06 | 0.02 | 0.02 | 0.02 | 0.06 | 0.06 | 0.09 | 0.04 | 0.07 | 0.09 |
| m10 | 0.06 | 0.05 | 0.01 | 0.02 | 0.02 | 0.09 | 0.09 | 0.07 | 0.02 | 0.03 | 0.07 |
| m11 | 0.03 | 0.02 | 0.01 | 0.02 | 0.02 | 0.01 | 0.01 | 0.01 | 0.01 | 0.01 | 0.02 |
| m1 | m2 | m3 | m4 | m5 | m6 | m7 | m8 | m9 | m10 | m11 |
|---|---|---|---|---|---|---|---|---|---|---|
| 0.25 | 0.18 | 0.08 | 0.14 | 0.14 | 0.03 | 0.03 | 0.02 | 0.06 | 0.05 | 0.02 |
| m1 | m2 | m3 | m4 | m5 | m6 | m7 | m8 | m9 | m10 | m11 | |
|---|---|---|---|---|---|---|---|---|---|---|---|
| 12.21 | 12.32 | 12.28 | 12.64 | 12.64 | 11.38 | 11.25 | 11.33 | 11.45 | 11.20 | 11.56 | 11.84 |
| m1 | m2 | m3 | m4 | m5 | m6 | m7 | m8 | m9 | m10 | m11 | m12 |
|---|---|---|---|---|---|---|---|---|---|---|---|
| 0 | 0 | 0.58 | 0.9 | 1.12 | 1.24 | 1.32 | 1.41 | 1.45 | 1.49 | 1.51 | 1.54 |
| m1 | m2 | m3 | m4 | m5 | m6 | m7 | m8 | m9 | m10 | m11 | |
|---|---|---|---|---|---|---|---|---|---|---|---|
| Abha | 0.23 | 0.17 | 0.30 | 0.03 | 0.24 | * | 0.24 | 0.04 | 0.24 | 0.24 | 0.04 |
| Al-Ahsa | 0.24 | 0.26 | 0.18 | 0.73 | 0.24 | * | 0.24 | 0.10 | 0.24 | 0.24 | 0.07 |
| Al-Baha | 0.21 | 0.22 | 0.18 | 0.00 | 0.24 | * | 0.24 | 0.01 | 0.24 | 0.24 | 0.00 |
| Arar | 0.24 | 0.20 | 0.15 | 0.28 | 0.24 | * | 0.24 | 0.02 | 0.24 | 0.24 | 0.02 |
| Dammam | 0.24 | 0.25 | 0.29 | 0.11 | 0.24 | * | 0.24 | 0.14 | 0.24 | 0.24 | 0.00 |
| Hail | 0.25 | 0.22 | 0.12 | 0.10 | 0.24 | * | 0.24 | 0.05 | 0.24 | 0.24 | 0.01 |
| Jeddah | 0.24 | 0.26 | 0.48 | 0.26 | 0.24 | * | 0.24 | 0.51 | 0.24 | 0.24 | 0.62 |
| Jizan | 0.25 | 0.28 | 0.41 | 0.39 | 0.24 | * | 0.24 | 0.02 | 0.24 | 0.24 | 0.03 |
| Madinah | 0.25 | 0.27 | 0.12 | 0.16 | 0.24 | * | 0.24 | 0.16 | 0.24 | 0.24 | 0.02 |
| Makkah | 0.24 | 0.29 | 0.22 | 0.05 | 0.24 | * | 0.24 | 0.23 | 0.24 | 0.24 | 0.01 |
| Najran | 0.25 | 0.25 | 0.13 | 0.05 | 0.24 | * | 0.24 | 0.04 | 0.24 | 0.24 | 0.03 |
| Qaisumah | 0.24 | 0.25 | 0.15 | 0.09 | 0.24 | * | 0.24 | 0.00 | 0.24 | 0.24 | 0.02 |
| Qassim | 0.24 | 0.24 | 0.13 | 0.05 | 0.24 | * | 0.24 | 0.07 | 0.24 | 0.24 | 0.21 |
| Riyadh | 0.25 | 0.26 | 0.15 | 0.24 | 0.24 | * | 0.24 | 0.78 | 0.24 | 0.24 | 0.22 |
| Tabuk | 0.25 | 0.21 | 0.16 | 0.00 | 0.24 | * | 0.24 | 0.08 | 0.24 | 0.24 | 0.71 |
| Taif | 0.24 | 0.22 | 0.21 | 0.02 | 0.24 | * | 0.24 | 0.09 | 0.24 | 0.24 | 0.05 |
| Yenbo | 0.25 | 0.26 | 0.33 | 0.21 | 0.24 | * | 0.24 | 0.03 | 0.24 | 0.24 | 0.11 |
| m1 | m2 | m3 | m4 | m5 | m6 | m7 | m8 | m9 | m10 | m11 | |
|---|---|---|---|---|---|---|---|---|---|---|---|
| Abha | 0.055 | 0.029 | 0.024 | 0.004 | 0.033 | * | 0.007 | 0.001 | 0.013 | 0.011 | 0.000659 |
| Al-Ahsa | 0.058 | 0.045 | 0.014 | 0.099 | 0.033 | * | 0.007 | 0.002 | 0.013 | 0.011 | 0.001075 |
| Al-Baha | 0.051 | 0.037 | 0.015 | 0.000 | 0.033 | * | 0.007 | 0.000 | 0.013 | 0.011 | 0.000005 |
| Arar | 0.058 | 0.035 | 0.012 | 0.039 | 0.033 | * | 0.007 | 0.000 | 0.013 | 0.011 | 0.000282 |
| Dammam | 0.058 | 0.042 | 0.023 | 0.015 | 0.033 | * | 0.007 | 0.003 | 0.013 | 0.011 | 0.000044 |
| Hail | 0.060 | 0.037 | 0.010 | 0.014 | 0.033 | * | 0.007 | 0.001 | 0.013 | 0.011 | 0.000158 |
| Jeddah | 0.059 | 0.044 | 0.039 | 0.035 | 0.033 | * | 0.007 | 0.010 | 0.013 | 0.011 | 0.009044 |
| Jizan | 0.061 | 0.047 | 0.033 | 0.053 | 0.033 | * | 0.007 | 0.000 | 0.013 | 0.011 | 0.000509 |
| Madinah | 0.061 | 0.047 | 0.009 | 0.021 | 0.033 | * | 0.007 | 0.003 | 0.013 | 0.011 | 0.000255 |
| Makkah | 0.059 | 0.049 | 0.017 | 0.007 | 0.033 | * | 0.007 | 0.005 | 0.013 | 0.011 | 0.000155 |
| Najran | 0.060 | 0.042 | 0.010 | 0.007 | 0.033 | * | 0.007 | 0.001 | 0.013 | 0.011 | 0.000511 |
| Qaisumah | 0.058 | 0.042 | 0.012 | 0.013 | 0.033 | * | 0.007 | 0.000 | 0.013 | 0.011 | 0.000261 |
| Qassim | 0.059 | 0.042 | 0.010 | 0.007 | 0.033 | * | 0.007 | 0.001 | 0.013 | 0.011 | 0.003098 |
| Riyadh | 0.060 | 0.044 | 0.012 | 0.033 | 0.033 | * | 0.007 | 0.015 | 0.013 | 0.011 | 0.003177 |
| Tabuk | 0.060 | 0.035 | 0.012 | 0.000 | 0.033 | * | 0.007 | 0.002 | 0.013 | 0.011 | 0.010383 |
| Taif | 0.059 | 0.038 | 0.017 | 0.002 | 0.033 | * | 0.007 | 0.002 | 0.013 | 0.011 | 0.000783 |
| Yenbo | 0.061 | 0.044 | 0.027 | 0.028 | 0.033 | * | 0.007 | 0.001 | 0.013 | 0.011 | 0.001643 |
| m1 | m2 | m3 | m4 | m5 | m6 | m7 | m8 | m9 | m10 | m11 | |
|---|---|---|---|---|---|---|---|---|---|---|---|
| zj+ | 0.0609 | 0.0294 | 0.0093 | 0.0000 | 0.0329 | * | 0.0069 | 0.0152 | 0.0129 | 0.0111 | 0.0104 |
| zj− | 0.0511 | 0.0494 | 0.0387 | 0.0993 | 0.0329 | * | 0.0069 | 0.0001 | 0.0129 | 0.0111 | 0.0000053 |
| Abha | Al-Ahsa | Al-Baha | Arar | Dammam | Hail | Jeddah | Jizan | Madinah | |
| SI+ | 0.02 | 0.10 | 0.02 | 0.04 | 0.03 | 0.02 | 0.05 | 0.06 | 0.03 |
| SI- | 0.10 | 0.10 | 0.11 | 0.08 | 0.09 | 0.09 | 0.08 | 0.08 | 0.09 |
| Makkah | Najran | Qaisumah | Qassim | Riyadh | Tabuk | Taif | Yenbo | ||
| SI+ | 0.03 | 0.02 | 0.03 | 0.02 | 0.4 | 0.02 | 0.02 | 0.04 | |
| SI- | 0.10 | 0.10 | 0.09 | 0.10 | 0.08 | 0.11 | 0.10 | 0.08 |
| Abha | Al-Ahsa | Al-Baha | Arar | Dammam | Hail | Jeddah | Jizan | Madinah | |
| Pi | 0.81 | 0.51 | 0.82 | 0.65 | 0.76 | 0.80 | 0.63 | 0.56 | 0.74 |
| Makkah | Najran | Qaisumah | Qassim | Riyadh | Tabuk | Taif | Yenbo | ||
| Pi | 0.78 | 0.81 | 0.78 | 0.82 | 0.69 | 0.87 | 0.83 | 0.67 |
Publisher’s Note: MDPI stays neutral with regard to jurisdictional claims in published maps and institutional affiliations. |
© 2021 by the authors. Licensee MDPI, Basel, Switzerland. This article is an open access article distributed under the terms and conditions of the Creative Commons Attribution (CC BY) license (http://creativecommons.org/licenses/by/4.0/).
Share and Cite
Al-Shammari, S.; Ko, W.; Al Ammar, E.A.; Alotaibi, M.A.; Choi, H.-J. Optimal Decision-Making in Photovoltaic System Selection in Saudi Arabia. Energies 2021, 14, 357. https://doi.org/10.3390/en14020357
Al-Shammari S, Ko W, Al Ammar EA, Alotaibi MA, Choi H-J. Optimal Decision-Making in Photovoltaic System Selection in Saudi Arabia. Energies. 2021; 14(2):357. https://doi.org/10.3390/en14020357
Chicago/Turabian StyleAl-Shammari, Sultan, Wonsuk Ko, Essam A. Al Ammar, Majed A. Alotaibi, and Hyeong-Jin Choi. 2021. "Optimal Decision-Making in Photovoltaic System Selection in Saudi Arabia" Energies 14, no. 2: 357. https://doi.org/10.3390/en14020357
APA StyleAl-Shammari, S., Ko, W., Al Ammar, E. A., Alotaibi, M. A., & Choi, H.-J. (2021). Optimal Decision-Making in Photovoltaic System Selection in Saudi Arabia. Energies, 14(2), 357. https://doi.org/10.3390/en14020357