Abstract
Due to the rapidly increasing energy demand and the more serious environmental pollution problems, lithium-ion battery is more and more widely used as high-efficiency clean energy. State of Charge (SOC) representing the physical quantity of battery remaining energy is the most critical factor to ensure the stability and safety of lithium-ion battery. The novelty SOC estimation model, which is two recurrent neural networks with gated recurrent units combined with Coulomb counting method is proposed in this paper. The estimation model not only takes voltage, current, and temperature as input feature but also takes into account the influence of battery degradation process, including charging and discharging times, as well as the last discharge charge. The SOC of the battery is estimated by the network under three different working conditions, and the results show that the average error of the proposed neural network is less than 3%. Compared with other neural network structures, the proposed network estimation results are more stable and accurate.
1. Introduction
Due to the rapidly increasing energy demand and the more serious environmental pollution problems, people are growing urgent for efficient and clean energy. Lithium-ion battery, which has characteristics of high energy density, low self discharge rate and pollution, and great repeated availability is used in a variety of electrical appliances. State of Charge (SOC), a decisive factor to ensure the stability and safety of the battery working state, represents the physical quantity of battery remaining charge. More precisely, the SOC of a battery is defined as the ratio of the remaining battery charge to the actual charge [1] in engineering perspective. However, the complex chemical structure of the battery determines that the SOC cannot be directly obtained. It is feasible solution to estimate the SOC of battery indirectly by using the physical quantity of battery, such as open circuit voltage method [2], Coulomb counting method [3], and Kalman Filter (KF) method [4]. The above three mainstream methods have their own strengths and weaknesses. Open circuit voltage method estimates the SOC by seeking the relationship between the battery open circuit voltage (OCV) and SOC. In the process of measuring OCV, many necessary factors need to be considered. For example, the resolution of the sensor for measuring voltage must be sufficient. At the same time, the reasonable standing time and temperature are required. In addition, the OCV-SOC curve will change due to the hysteresis phenomenon in the battery degradation process, which leads to the lack of stability of open circuit voltage method [5]. The released charge of the battery is obtained by integrating the battery discharge current with time, which is called the Coulomb counting method. The Coulomb counting method without no complex calculations can get battery release charge easily. However, the Coulomb counting method is almost helpless in the face of the problems of unclear initial SOC value, accumulation of sampling error of current sensor and uncertainty of battery capacity [6]. Kalman Filter (KF) is also appropriate for battery SOC estimation by building a state-space of the battery model. Nevertheless, the limitation of this method is not suitable for nonlinear battery models. Based on this problem, improved nonlinear Kalman Filtering method, such as Extended Kalman Filter (EKF), Unscented Kalman Filter (UKF), and other hybrid estimation methods, is used in References [7,8,9,10,11,12,13]. However, the modeling based on KF is often restricted by some specific environment, the diverse battery types need to establish specific models and many factors, such as the battery actual capacity, the relationship between impedance, capacitance reactance, and SOC, need to be considered in the process of modeling.
In recent years, the new SOC estimation methods based on machine learning theory are proposed. Wang and Hansen [14] adopted the method of support vector machine (SVM) instead of EKF as estimation algorithm, which greatly saves the calculation time. Except classical the machine learning algorithms like SVM, the neural network method is also used for SOC estimation. Weigert [15] uses back-propagation(BP) neural network as the SOC estimation network, and BP neural network estimation method has the advantages of simple structure and fast training speed. In addition, there are more complex neural network structures used in SOC estimation [16,17,18,19,20,21,22,23], the nonlinearity of the neural network is suitable for simulating battery model. But their results could be better convinced if they consider the sequentiality of the input features.
In the feed-forward network, the output of the network is only related to the input of the current sequence, and the input and output of the forward sequence will not affect it. Therefore, each input in the feedforward network is independent. However, the SOC estimation is a continuous process, and each SOC value is associated. Recurrent neural network (RNN) has a memory information throughout the neural network to retain the former information. Therefore, it is more reasonable to use RNN as the SOC estimation network. Capizzi [24] proposed applying RNN as the SOC estimation network, but the gradient of RNN usually vanish or explode in the process of back-propagation, especially if the input sequence is long enough. After adding the structure of Long Short-Term Memory (LSTM) or Gate Recurrent Unit (GRU) into RNN, it can improve this problem by using its unique memory management structure. In fact, this is what the Yang [25] does. Yang used the single discharge data as the training data, and the estimation accuracy decreased significantly after a certain period of time. Of course, this is also the problem of most neural network estimation methods.
For battery SOC estimation, another important factor must to be considered is battery aging. It can be said that the battery aging degree restricts the accuracy of all the above algorithms. Aging degree of battery, also named as state-of-health (SOH), can be predicted by a large number of aging experimental data [26,27,28,29,30] or online identification [31,32,33,34]. Generally, the predicted result of SOH is the ration of the actual capacity vs. initial capacity. For neural networks, if SOC network and SOH network are trained with the same data, and then combined with the network, it is obviously a waste of computing power. In order to optimize this problem, Hicham [35] proposed integrating the above two networks. However, the Hicham’s idea is to take the data of every sampling point as the input of the SOH estimation network. In fact, the SOH of the battery will not change obviously in a discharge process. In view of the above problems, an improved network architecture based on RNN, which includes two recurrent neural networks with gate recurrent unit (RNN-GRU) is proposed for the SOC estimation network of the battery degradation process. The first RNN-GRU is the State of Health (SOH) network, which generates battery aging characteristic information and transmits it to SOC estimation network. The second RNN-GRU is the SOC estimation network, which is used to estimate the SOC of the current discharge process. The last output of the SOC network is carries the information of this discharge process and will be used as the input of SOH network in the next discharge process. In this way, there is a memory information in the proposed network to record the aging information of battery to maintain the accuracy of SOC estimation results. The neural network proposed in this paper, considering the influence of battery aging factors in SOC estimation, improves the problem of SOC estimation failure of traditional neural network in the process of battery degradation process. At the same time, the proposed network makes full use of the peculiar structure of RNN. The proposed network uses the memory information vector of RNN to transfer aging factors, simplifies the network structure, and reduces the amount of calcula. In addition, the network has good robustness in the face of untrained data. The stability of the network is also very good, and there is no significant fluctuation in the estimation results.
The structure of the rest of the paper is as follows: In Section 2, the improved recurrent neural networks with gate recurrent unit (RNN-GRU) is introduced. Section 3 describes the experiment of the battery degradation process. The estimation result and conclusion are shown in Section 4 and Section 5.
2. SOC Estimation in the Battery Degradation Process
2.1. Recurrent Neural Network
Recurrent neural network has a memory information running through the neural network so that the subsequent input can refer to the previous memory. Figure 1 is the structure of RNN, is the memory unit of the previous sequence, is the input of this sequence, and W is the concat of the weight matrix of the sequence memory unit of time series and the weight matrix of t time series input, which is defined as (1), is the memory unit of t time series, and (2) is the activation function. According to these, the memory information (3) and the network output (4) at time t can be gotten.
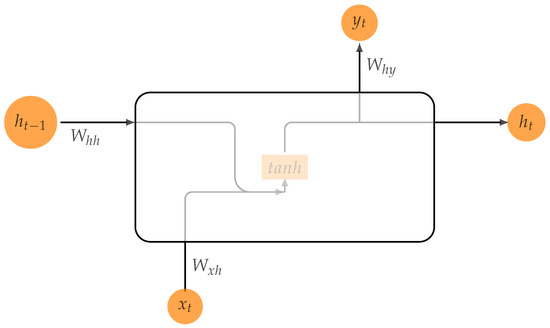
Figure 1.
Structure of recurrent neural network (RNN).
The forward propagation process of RNN (1)–(4) reflects how RNN carries the memory information. In addition, RNN has the simple structure and weight sharing mechanism, which means that RNN can save much time in training process compared with feed-forward neural network. However, as Benigo [36] proposed, the information forgetting and gradient explosion problems often occur when RNN processes long sequence input. According to Bengio’s deduction, the root cause of these problems is multiple multiplication of shared weight when RNN performs multiple sequence back-propagation (Figure 2). In fact, how long the input sequence will lead to the above problems seems to be inconclusive. Therefore, the performance of RNN in SOC estimation determines whether it is suitable for SOC estimation.
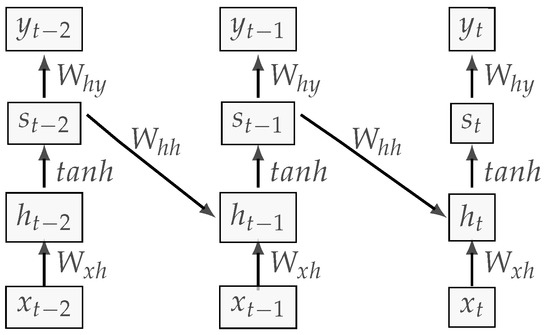
Figure 2.
RNN multiple sequence propagation structure.
In order to verify the performance of RNN in battery SOC estimation, the single discharge data of a battery with capacity of 2 Ah, the discharge rate of 0.5 C at 25 °C and the sampling period of one second is taken as the input data of the network. The network input are voltage, current, temperature, and the battery SOC as output.
The change of loss during training is shown in Figure 3. As a comparison of the other two improved RNN structures, the training process loss of GRU [37] and LSTM [38] are also shown in the same figure. Obviously, the performance of RNN is the worst. After 400 epochs, the loss value is constantly fluctuating between 80–1600. The gradient explosion occurs when RNN is used for SOC estimation, and the network cannot approach the optimal. LSTM can make the gradient drop rapidly. After 1000 epochs, the loss is about 30. Accordingly, GRU’s performance is even better, and the loss is close to 1 after 180 epochs. In addition, the training time of 1000 epochs in three kinds of networks is shown in Table 1. Among them, the RNN’s training time was 870.066 s, and RNN-LSTM and RNN-GRU took 987.211 s and 913.992 s for training, respectively. The reason why RNN spent the least time is less parameters in the network. Due to gradient explosion problem occurring in the RNN and RNN-LSTM needing longer training time, RNN-GRU is more suitable for SOC estimation.
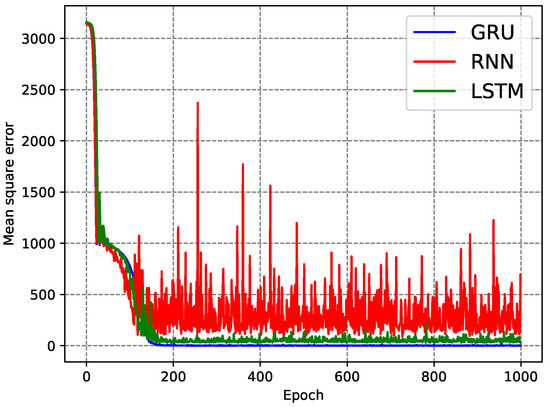
Figure 3.
Training loss of RNN, RNN-Gate Recurrent Unit (GRU), and RNN-Long Short-Term Memory (LSTM).

Table 1.
State of Charge (SOC) estimation network structures for single discharge process.
2.2. Gated Recurrent Unit
GRU has excellent performance in SOC estimation because it is rarely affected by the length of input sequence. It solved the gradient problem by their own unique gated unit. The RNN-GRU structure shown in Figure 4.
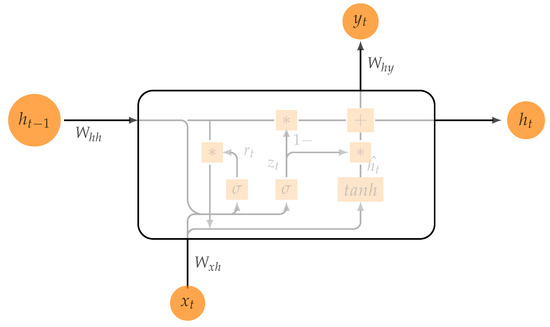
Figure 4.
Structure of RNN-GRU.
Among them, is sigmoid activation function. The two important gate units, update gate and the reset gate, are defined as and , respectively, as presented in Equations (5) and (6).
They combine the memory information of the previous time () with the input of the current time () by weight ( and ), and, finally, map to the value between 0 and 1 through sigmoid.
As for , it is represented in Equation (7) below:
is a candidate hidden layer, which can be understood as the new memory information of the current time, and reset gate determines how much previous memory the candidate layer retains. is the weight, and is the activation function to keep the value of between −1 and 1.
From Equation (8), is determined by the update gate, and . The update gate determines how much information is taken from and .
Accordingly, the weight and bias b are added, and the network output is finally obtained and shown in Equation (9). Because RNN-GRU constantly modifies the memory information, the gate unit is controlled according to the length of the input sequence, which reduces the possibility of gradient problem to the greatest extent. Considering the structure of RNN-GRU and the performance of single discharge data training result, it is very suitable for SOC estimation network. However, some structural details need to be considered because of involving SOH estimation.
2.3. SOC Estimation Network of Battery Degradation Process Based on RNN-GRU
The specific network structure is proposed for SOC estimation in battery degradation process, and it is detailed in Figure 5. The estimation network is composed of two networks, SOH network and SOC network. The function of the SOH network is to provide aging factor of battery for SOC network, while the SOC network is used to estimate the remaining power of battery. Because RNN-GRU is very suitable for SOC estimation, it is selected as the main structure of the two networks. The two networks are connected by the memory information of the RNN.
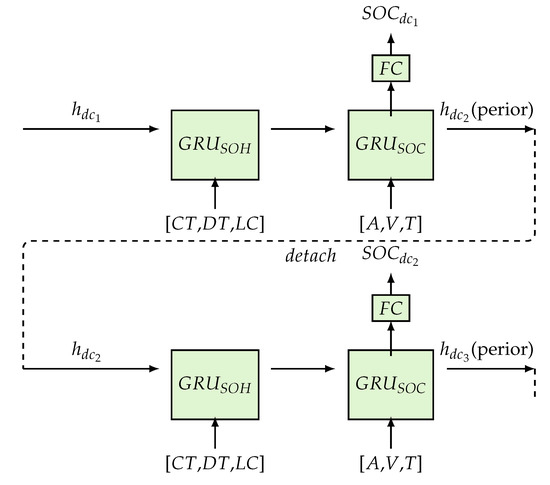
Figure 5.
Structure of proposed SOC estimation network.
SOH network’s inputs are: [battery charging times (), battery discharge times (), last time discharge capacity ()]. Among them, the is estimated by the Coulomb counting method. Besides, , as the prior knowledge of SOH network for the first discharge, is initialized by normal distribution. Then, the output of SOH network is entered into the SOC network as the prior knowledge.
The input features of SOC network are: [current (A), voltage (V), temperature (T)], and each sequence output results into the FC layers estimate the battery SOC. as the output of the last sequence fully absorbs the information of the discharge process, and it is used as the prior information of the next discharge SOH network.
Other details of the proposed network are as follows: Set mean square error function as loss function of SOC estimation network, and the activation function of the FC layer is function. To prevent over-fitting, a dropout layer with a probability of 0.5 is added in the FC layers. Because of the particularity structure of the proposed estimation network, the training data is the degradation process data of battery, and the input sequence should follow the discharge order. For better illustration, the specific process of training is shown in Figure 6.
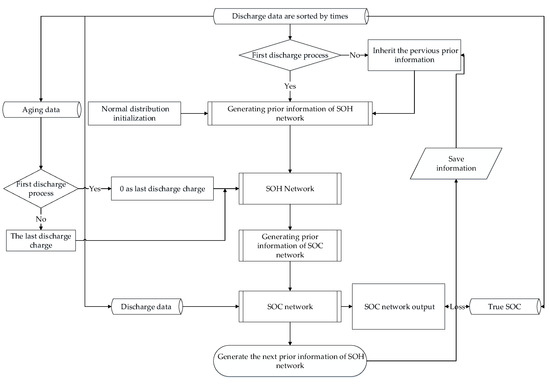
Figure 6.
Network training process.
At the beginning of the network training process, the discharge data must be sorted according to the discharge order. The data includes the current, voltage, and temperature value of each sampling period, as well as the number of times the battery has been charged and discharged before the discharge process and the amount of discharge charge in the last discharge process. The most important thing is that the SOC value corresponding to each sampling point must be known as the tag value of the network. At the beginning of the training process, because there is no aging information in the first discharge process, a normal distribution vector with the same structure as the memory information of GRU-SOC network is added to the training. Then, the GRU-SOC network will make a gradient descent according to the input vector X and the tag Y (10).
where A, V, and T represent current, voltage, and temperature, respectively. The subscript t is the meaning of the last sample point. After a gradient descent of , a vector carrying the information of the first discharge process will be generated ( in Figure 5). is used as aging information of the second discharge through network. Then, the network of the second discharge process is trained and the next discharge vector ( in Figure 5) is generated. This process will continue until the last discharge data is trained. So far, one epoch of training is over. The number of epoch depends on the performance of the network.
It should be noted that the vectors generated randomly in the first discharge will not be regenerated ( in Figure 5). No matter how many epoch iterations, the discharge charge ( in Figure 5) of the previous discharge process will not add random noise in each epoch iteration to ensure the robustness of the network.
3. Battery Experiment Process
According to the proposed network structure, the battery should be charged and discharged to obtain data to train the network and test the accuracy of SOC estimation. Therefore, the nine batteries were selected for the test, and their information is shown in Table 2.

Table 2.
Experimental battery information.
The nine batteries used in the test were divided into three groups, and each group was in different working conditions as shown in the Figure 7. Three batteries in each group carry different functions, one of which is used as training set and the other two are as verification set and test set, respectively. The specific experimental environment and the function of each battery are shown in the Table 3.
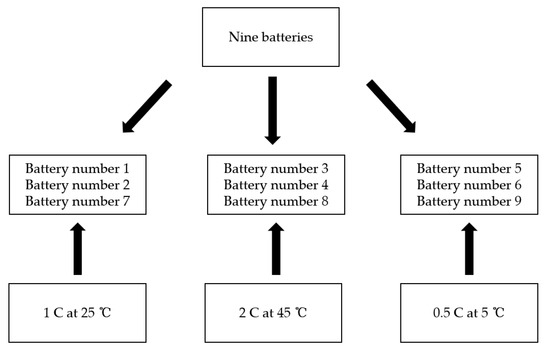
Figure 7.
Battery grouping process.

Table 3.
Battery discharge test environment.
These different battery conditions (shown in Figure 7) are designed to verify that the proposed network can effectively estimate the SOC in the battery degradation process in different environments. The experimental environment includes high temperature and high discharge rate (2 C at 45 °C), low temperature and high discharge rate (0.5 C at 5 °C), and 1 C discharge rate at 25 °C. The charging process of the nine batteries is the same, selecting 1.5 A current to charge the battery until the battery voltage reaches 4.2 V, and then charging at constant voltage until the current is less than 20 mA.
In the process of battery experiment, the sampling period is one second, and the two temperature sensors are placed on both sides of the geometric center of the battery. After a charge and discharge cycle, the next cycle is carried out after five minutes. Finally, the experiment data is stored by battery test platform (Figure 8).
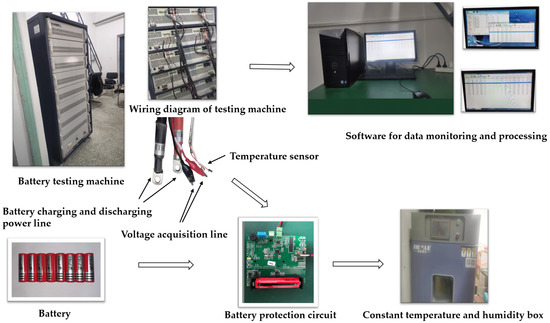
Figure 8.
Battery test platform.
Because the battery discharge charge of the battery test platform is obtained by Coulomb counting method. In addition, the battery voltage, current, and temperature should be used as input of the network. Therefore, the measurement error of the test platform must be within a reasonable range. The parameters and error values of the battery test platform are shown in the Table 4. The absolute current error and absolute voltage error of the test platform are 0.0148 A and 0.002 V, respectively, after verification by logic analyzer. The battery test platform has a small error in the calculation of discharge charge and charging charge and the collection of physical quantities.

Table 4.
Parameters and error values of the battery test platform.
After the completion of data collection, the data of Battery number 1, Battery number 3, and Battery number 5 were selected to show the change trend of physical quantity of batteries in the process of experiment. The result is shown in the Figure 9.
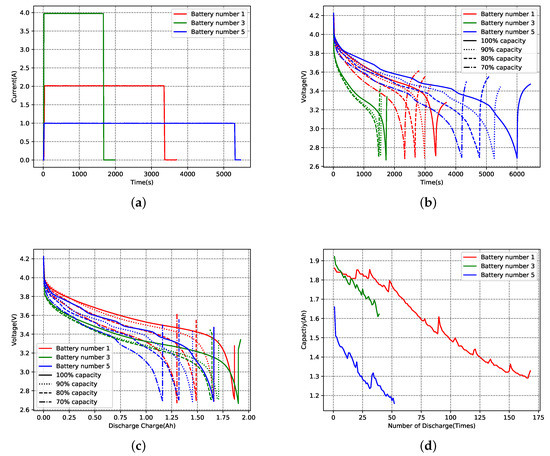
Figure 9.
Experimental data. (a) Discharge current curve. (b) Voltage curve under different aging degrees. (c) Relationship between voltage and discharge charge under different aging degrees. (d) Discharge charge curve under different discharge times.
At higher temperature, the battery can release more charge, and the voltage value drops rapidly at the end of the discharge process. The conclusion reflected from the data is consistent with the properties of the battery. In addition, there is a strong nonlinear relationship between the charging times and the discharge charge. In fact, this nonlinear relationship runs through the whole battery degradation process. Therefore, it is reasonable to use neural network to estimate SOC in battery degradation process. Before the data is put into the network for training, SOC must be defined. Only in this way can the network have the corresponding tag value for training and testing the accuracy of SOC estimation. The definition of SOC in this paper is as follows:
where represents the remaining charge in a battery under a given testing condition. Meanwhile, is the actual discharge charge under the same specific condition. In other words, is only obtained when a discharge process is finished. In this definition, the SOC value is more accurate.
4. Training Process and Estimation Result
The selection of the hyper-parameters is crucial to the convergence of neural networks. Therefore, in order to make the network converge as soon as possible and prevent over fitting, the hyper-parameters and network structure need to be adjusted. In general, the approximate range of the hyper-parameters is determined by the amount of data used for training. In order to judge whether the selection of hyper-parameters is appropriate, it is necessary to observe the convergence of the network and the performance of the network on the verification set.
The number of epoch, learning rate, network layer number, and hidden layer neuron number are included in the hyper-parameter. In order to find the best value of these parameters, a lot of training is carried out.
The number of epoch measures the speed of network convergence. As shown in Table 5, after about 500 epochs, the training MSE loss can be used to judge whether the network can converge or not. Generally, the loss value of the network structure that can converge always decreases, while the loss value that is difficult to converge will not change significantly.

Table 5.
Loss of SOC estimation in different epoch.
Then, the number of hidden neurons in RNN-GRU and FC also requires a lot of training process to determine. However, the input dimension of the first layer in FC is affected by hidden neurons in RNN-GRU, that is, the number of neurons in RNN-GRU should be selected first.
In addition, the number of hidden neurons also restricts the network’s ability to analyze data. As shown in Table 6, when the number of neurons is insufficient (such as 25 in Table 6), the network cannot effectively learn the data. After adding the number of neurons to 150, the training MSE loss is 0.77 and validation MSE loss is 2.99. Besides, the network loss value will not decrease significantly when the number of neurons is gradually increased to 200. In other words, the most suitable number of hidden neurons is between 150 and 200.

Table 6.
Loss of SOC estimation in different hidden sizes.
The number of network layers is also a hyper-parameter to be considered. Due to the large amount of data in the degradation process, the network layers of FC layer and RNN-GRU layer should be increased compared with single discharge data estimation. After testing a variety of structures, the structures in Table 7 perform relatively well.

Table 7.
Different estimation network structures.
When some main parameters have been determined, the performance of the network on the verification set is added to judge the fitting status of the network. Network 5 has the best fitting effect on the training set, with the training loss value of 0.44, but the loss on the validation set is 3.6, while the loss of the Network 8 on the training set is 0.56 and that on the validation set is 2.15. In fact, this shows that there is over-fitting phenomenon in Network 5. In order to avoid over-fitting phenomenon that exists in neural network training, the verification set is added to verify the fitting state of network. In addition, dropout layer is also added to the network structure to solve the over-fitting problem. After synthesizing the above factors, Network 8 is considered to be the most ideal network structure.
In the training process, if the number of epochs is increased appropriately at the initial learning rate of , then the loss value will be reduced faster under the lower learning rate. As shown in the Figure 10, the loss value fluctuates obviously after 200 epochs when the learning rate is less than , and it reaches the minimum value after 350 epochs. After reducing the learning rate to , the loss value decreases obviously and approaches the optimal solution faster. Because of the particularity of the network structure, only when the data of the first discharge is fully learned to reach the optimal value, the meaningful prior knowledge of the second discharge will be generated. Therefore, sometimes, when it is found that the loss of the network is no longer reduced, the gradient of the actual network is still declining. In a word, the number of iterations should be increased when the learning rate is high, and it will greatly reduce training time.
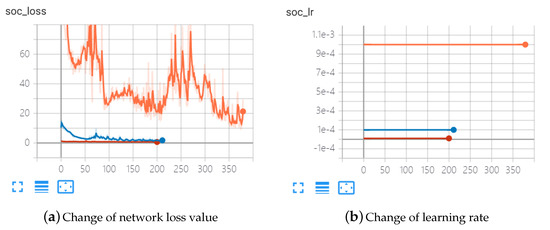
Figure 10.
Change trend of loss value during training process.
According to the above analysis, the network structure which is suitable for SOC estimation in battery degradation process is as follows:
- Initial learning rate: (Every 350 epochs become one-tenth of the original),
- GRU layer number: 2,
- GRU hidden size: [2,1,150],
- FC layer number: 6,
- FC neuron number: 150-150-150-150-80-1, and
- Dropout layer parameter: 0.5 (On the fourth layer of the FC layer).
During the training process, PyTorch-1.5.1 is chosen as the tool for network construction, training GPU is RTX-2060, and Google Colab is used for co-operation to calculate multiple network structure.
4.1. Estimate under Relatively Mild Condition
Under this condition, the experimental data of battery number 1 (25 °C and 1 C discharge rate) is used as the training set of the network to participate in the network training, and battery number 2 and battery number 7 are used as the verification set and test set, respectively. In this experimental environment, the battery discharge times is about 170 times, so the proposed SOC estimation network is required to retain memory information as much as possible.
The estimated results and errors of the battery in different decay states are shown in Figure 11 and Figure 12. At the initial stage of the degradation process (battery capacity = 95%), the maximum estimation error is 4.5%, and the curve shows that the error mainly occurs at SOC < 40. With the aging of the battery, the estimation error of the network is the lowest when the battery is at 90% to 80% of the capacity. At this stage, the average error is about 1.5%, and the maximum error is less than 2.5%. However, at the end of the degradation process (80–70%), the estimation error increases significantly, and the maximum error is more than 5%. In addition, when SOC is equal to 80%, there is a peak value with an error of about 2.5% appear. In general, there is no large SOC vaule fluctuation in SOC estimation. The network stability is good.
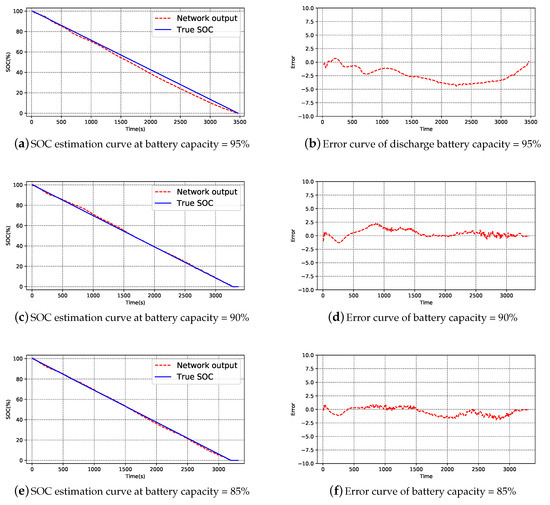
Figure 11.
Estimation results at 25 °C (1).

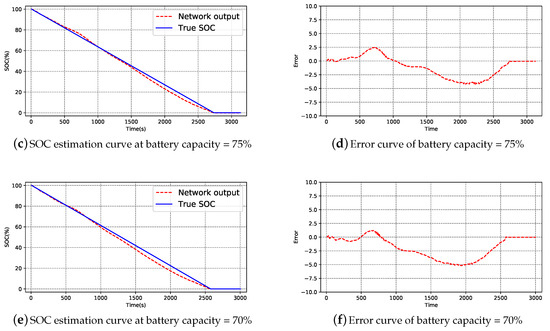
Figure 12.
Estimation results at 25 °C (2).
In order to observe the overall trend of the whole degradation process, the average error and maximum error of each estimation are shown in the Figure 13. Under this condition, the overall error of estimation is less than 3%. When the battery capacity is more than 90% (1–20 discharge times), the average error is between 2% and 4% and maximum error is between 4% and 6%. In addition, when battery capacity is 90–75% (20–80 discharge times), the average error is less than 2% and maximum error is mainly concentrated in the range of 2–6%. Until the end of the degradation process (80–105 discharge times), the estimation error increases by 3% and the maximum error of estimation is kept in the range of 4–6%. From the distribution of errors (Figure 13c), the maximum number of errors occurred in the 20–30% SOC was 70 times, and the number of 30–40% SOC was 47 times. As shown in the Figure 13d, in this paper, R square is used as the evaluation condition of goodness of fit. Theoretically, the closer the R-square of each estimation result is to 1, the more consistent the SOC estimation results are to the distribution of actual SOC values. To unify the dimensions, the result of R squared is multiplied by 100. It can be clearly seen that the value of R-square is kept above 98 in the whole discharge process except that the value of R is reduced to less than 96 in the range of 20–50 discharge times. The distribution of the estimated and actual values of the network is approximately the same. In other words, the network fitting is suitable.
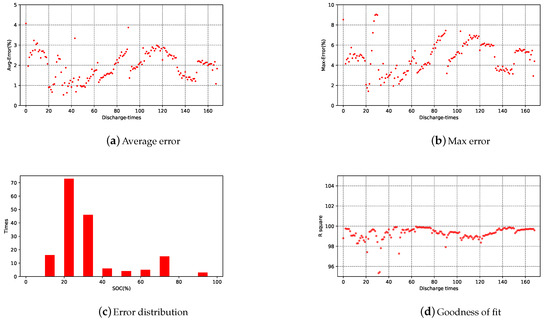
Figure 13.
Estimation error at 25 °C.
Due to individual differences in batteries, the battery selected in the test set has reached the stop condition of 70% capacity after 105 discharges. In order to keep the consistency with the battery selected in the training set, the experiment is not stopped until the battery capacity of the training set is 70%. Therefore, the test set battery discharge data less than 70% capacity can be used to verify the robustness of the network (Figure 14). Compared with the case of capacity greater than 70%, there is a increase in error. Maximum error increases to 6% and occurs at SOC < 40. The average error is between 2% and 3%. However, as shown in the Figure 13a–c, although the average error and the maximum error have increased, they are still less than 4% and 8%. In addition, the goodness of fit does not decrease significantly and is higher than 98, which means that the network can estimate the SOC of untrained battery state with high accuracy.
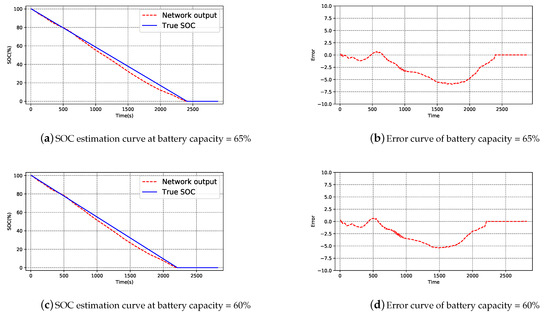
Figure 14.
Estimation result at untrained data.
In order to verify the positive significance of the proposed network structure for SOC estimation, other different network structures and estimation results are used as a comparison (Figure 15).
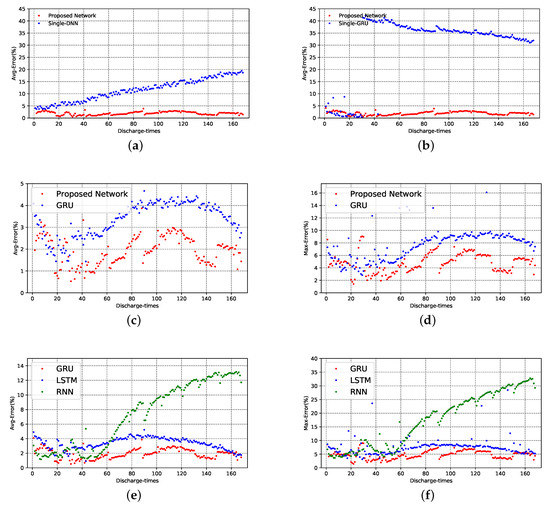
Figure 15.
Estimation results of different networks. (a) Average error of SOC estimation for DNN networks without time series. (b) SOC estimation average error for GRU without consider battery aging. (c) Average error of SOC estimation of GRU and proposed network. (d) Maximum error of SOC estimation of GRU and proposed network. (e) Average error of the proposed network under different RNN structures. (f) Maximum error of the proposed network under different RNN structures.
Single-GRU and Single-Dense neural network (DNN) use the first discharge data of battery as training data and the result is shown in Figure 15a,b). Single-GRU network in the first 30 discharges with an average error of 3%. After about 30 discharges, the estimated average error increases rapidly to 40%. On the other hand, the error of DNN network increases gradually, and finally increases to 20%. The GRU network and DNN network for single discharge data have lost its estimation ability in the face of battery degradation process. In contrast, the proposed network will not produce large errors with the process of battery degradation. After all discharge data are put into the network for training (Figure 15c,d), the proposed network has smaller error compared with the ordinary GRU, which performs well in SOC estimation. Finally, the performance of different main network structures in estimation is shown (Figure 15e,f). There is no doubt that the RNN-GRU network selected in this paper has the best performance among the three RNN structures, with the lowest overall estimation error and the strongest stability.
To conclude, under relatively mild conditions with 1C discharge rate at 25 °C, the proposed network structure can effectively predict the SOC of the battery, with an average of no more than 4%. Moreover, the robustness of the network is good, which can effectively estimate the data without training.
4.2. Estimation under More Severe Conditions
The battery number 8 is estimated under condition of 45 °C and 2C discharge rate that make the battery decays rapidly. The aging information estimated by SOH network is required to be accurate and the estimated results under different battery degradation are shown in the Figure 16. As shown in Figure 16b, the error of estimation results is less than 3%. The maximum error appears at SOC < 10. There is no obvious error fluctuation in the estimation process, and the error of the whole process is relatively stable. It can be said that the network estimation results are very ideal.

Figure 16.
Estimation results at 45 °C.
Another condition to be considered is low temperature environment. In this environment, the chemical state of the battery is complex and the battery capacity is poor. In order to ensure the validity of the battery data, the discharge rate has to be reduced to 0.5 C. In this case, the good robustness of the network is needed. Accordingly, the SOC estimation results are shown in the Figure 17. In different degrees of battery degradation, the estimated results fluctuate between 0% and 2.5%, and the error does not increase with the degradation process.

Figure 17.
Estimation results at 5 °C.
The overall trend of the two conditions is shown in Figure 18. At 45 °C, the average error is less than 2%, and tends to be stable (Figure 18a). The maximum value appears in the first discharge process, which is 1.53%. The maximum error is less than 4%, and the maximum value appears in the first discharge process, which is 4.59 (Figure 18b). The maximum error is 37.5% in 0% < SOC < 10% and 25% in 90% < SOC < 100% (Figure 18c). The value of R square is between 96 and 100 (Figure 18d). The average error of the estimation is less than 2.5% at 5 °C, and the maximum value is 2.21% in the first discharge process (Figure 18a). The maximum error is less than 5%, and the peak value is 4.51 (Figure 18b). The maximum error was 60% at 0% < SOC < 10% (Figure 18c). The estimated R square values ranged from 99.7 to 100 (Figure 18d). The results show that the SOC estimation is still stable and accurate in the accelerated degradation environment.


Figure 18.
Estimation results of two working conditions.
In conclusion, under the condition of less discharge times, the network has smaller error and more accurate estimation results. Combined with the estimation under different conditions, the proposed network can accurately estimate the battery SOC, and has good robustness, which is suitable for SOC estimation.
5. Conclusions
In this paper, a new network structure which use RNN-GRU as the battery SOC estimation network in the battery degradation process is proposed. The proposed network consists of two RNN-GRU layers; meanwhile, six FC layers connect the SOC estimation network. In order to verify the estimation ability of the network, the battery data of three different temperatures (5 °C, 25 °C, 45 °C) and different discharge rates (0.5 C, 1 C, 2 C) are used. The results show that the average error and maximum error are 1.3% and 4.8% at 5 °C, 0.5 C discharge rate, 0.94% and 4.5% at 2 C discharge rate at 45 °C, and 2.7% and 5.25% at 1 C discharge rate at 25 °C. The average error of network estimation under three conditions is less than 3%. Compared with other neural network estimation methods, the proposed network makes the estimation result more accurate by recording the aging information in the discharge process. In addition, the robustness of the proposed network is tested, and the results show that the network has good performance in untrained data. The special memory information tensor of GRU-RNN is used to carry battery aging information in this paper, which reduces the weight number of the network, reduces the amount of computation, and maximizes the use of network structure. Moreover, the proposed network can be used for real-time estimation and has application value in engineering practice. In conclusion, the network structure proposed in this paper can be used to estimate the SOC in the battery degradation process.
For the proposed estimation network, there are still some directions worthy of optimization.
- The degradation degree of battery has not been quantified and taken as the output. In the following work, it is necessary to improve the network structure so that the network can respond to the degradation degree through numerical value on the premise of ensuring the accurate SOC estimation.
- When the network deals with the degradation process of more discharge times, the error is relatively large and the long-term memory ability of the network decreases. In the next step, this aspect needs to be overcome.
- The experiment is designed to accelerate the degradation process. This leads to less working conditions and shorter discharge times. In the next step, the experiment should be carried out in combination with the operating conditions of the battery, and the actual working state of the battery should be considered.
- More network structures based on time prediction are proposed due to the rapid development of neural network, such as dual-stage attention-based recurrent neural network (DA -RNN) [39] and the dual-stage two-phase recurrent neural network (DSTP-RNN) [40]. Choosing more reasonable network structure can improve the accuracy of battery SOC estimation.
- Deep learning is an algorithm based on a large number of data. It is necessary to increase a large number of data samples as network input, which will improve the accuracy of the estimation method.
Author Contributions
The Conceptualization, J.L. and C.J.; methodology, C.J., S.L.; software, C.J.; validation, R.F., B.L., and T.Z.; formal analysis, C.J.; investigation, Z.T.; resources, Z.T.; data curation, C.J.; writing—original draft preparation, C.J.; writing—review and editing, R.F.; visualization, J.L.; supervision, J.L. All authors have read and agreed to the published version of the manuscript.
Funding
This research received no external funding.
Data Availability Statement
The raw/processed data required to reproduce these findings cannot be shared at this time as the data also forms part of an ongoing study.
Conflicts of Interest
The authors declare no conflict of interest.
References
- Ng, K.S.; Moo, C.S.; Chen, Y.P.; Hsieh, Y.C. Enhanced coulomb counting method for estimating state-of-charge and state-of-health of lithium-ion batteries. Appl. Energy 2009, 86, 1506–1511. [Google Scholar] [CrossRef]
- He, H.; Zhang, X.; Xiong, R.; Xu, Y.; Guo, H. Online model-based estimation of state-of-charge and open-circuit voltage of lithium-ion batteries in electric vehicles. Energy 2012, 39, 310–318. [Google Scholar] [CrossRef]
- Piller, S.; Perrin, M.; Jossen, A. Methods for state-of-charge determination and their applications. J. Power Sources 2001, 96, 113–120. [Google Scholar] [CrossRef]
- Xu, L.; Wang, J.; Chen, Q. Kalman Filtering state of charge estimation for battery management system based on a stochastic fuzzy neural network battery model. Energy Convers. Manag. 2012, 53, 33–39. [Google Scholar] [CrossRef]
- Li, Z.; Huang, J.; Liaw, B.Y.; Zhang, J. On state-of-charge determination for lithium-ion batteries. J. Power Sources 2017, 348, 281–301. [Google Scholar] [CrossRef]
- Ng, K.; Huang, Y.; Moo, C.; Hsieh, Y. An enhanced coulomb counting method for estimating state-of-charge and state-of-health of lead-acid batteries. In Proceedings of the INTELEC 2009—31st International Telecommunications Energy Conference, Incheon, Korea, 18–22 October 2009; pp. 1–5. [Google Scholar] [CrossRef]
- Barbarisi, O.; Vasca, F.; Glielmo, L. State of charge Kalman Filter estimator for automotive batteries. Control Eng. Pract. 2006, 14, 267–275. [Google Scholar] [CrossRef]
- Sun, F.; Hu, X.; Zou, Y.; Li, S. Adaptive unscented Kalman Filtering for state of charge estimation of a lithium-ion battery for electric vehicles. Energy 2011, 36, 3531–3540. [Google Scholar] [CrossRef]
- Wang, J.; Cao, B.; Chen, Q.; Wang, F. Combined state of charge estimator for electric vehicle battery pack. Control Eng. Pract. 2007, 15, 1569–1576. [Google Scholar] [CrossRef]
- Kim, J.; Cho, B.H. State-of-Charge Estimation and State-of-Health Prediction of a Li-Ion Degraded Battery Based on an EKF Combined With a Per-Unit System. IEEE Trans. Veh. Technol. 2011, 60, 4249–4260. [Google Scholar] [CrossRef]
- Zhiguo, A.; Maofei, T.; Lin, Z.; Xing, C.; Yakun, L.; Xin, S. SOC estimation of lithium battery based on adaptive untracked Kalman filter. Energy Storage Sci. Technol. 2019, 8, 856. [Google Scholar]
- Wang, K.; Feng, X.; Pang, J.B.; Ren, J.; Duan, C.X.; Li, L.W. State of charge (SOC) estimation of lithium-ion battery based on adaptive square root unscented Kalman Filter. Int. J. Electrochem. Sci. 2020, 15, 9499–9516. [Google Scholar]
- Chen, C.; Xiong, R.; Yang, R.; Shen, W.; Sun, F. State-of-charge estimation of lithium-ion battery using an improved neural network model and extended Kalman Filter. J. Clean. Prod. 2019, 234, 1153–1164. [Google Scholar] [CrossRef]
- Hansen, T.; Wang, C.J. Support vector based battery state of charge estimator. J. Power Sources 2005, 141, 351–358. [Google Scholar] [CrossRef]
- Weigert, T.; Tian, Q.; Lian, K. State-of-charge prediction of batteries and battery–supercapacitor hybrids using artificial neural networks. J. Power Sources 2011, 196, 4061–4066. [Google Scholar] [CrossRef]
- Huang, G.B.; Saratchandran, P.; Sundararajan, N. An efficient sequential learning algorithm for growing and pruning RBF (GAP-RBF) networks. IEEE Trans. Syst. Man Cybern. Part B Cybern. 2004, 34, 2284–2292. [Google Scholar] [CrossRef]
- Kang, L.; Zhao, X.; Ma, J. A new neural network model for the state-of-charge estimation in the battery degradation process. Appl. Energy 2014, 121, 20–27. [Google Scholar] [CrossRef]
- Lee, Y.; Wang, W.; Kuo, T. Soft Computing for Battery State-of-Charge (BSOC) Estimation in Battery String Systems. IEEE Trans. Ind. Electron. 2008, 55, 229–239. [Google Scholar] [CrossRef]
- Chen, Z.; Qiu, S.; Masrur, M.A.; Yi, L.M. Battery state of charge estimation based on a combined model of Extended Kalman Filter and neural networks. In Proceedings of the The 2011 International Joint Conference on Neural Networks, San Jose, CA, USA, 31 July–5 August 2011. [Google Scholar]
- He, W.; Williard, N.; Chen, C.; Pecht, M. State of charge estimation for Li-ion batteries using neural network modeling and unscented Kalman Filter-based error cancellation. Int. J. Electr. Power Energy Syst. 2014, 62, 783–791. [Google Scholar] [CrossRef]
- Yan, Q.; Wang, Y. Predicting for power battery SOC based on neural network. In Proceedings of the 2017 36th Chinese Control Conference (CCC), Dalian, China, 26–28 July 2017; pp. 4140–4143. [Google Scholar] [CrossRef]
- Guo, N.; Fang, Y.; Tian, Z.; Cao, S. Research on SOC fuzzy weighted algorithm based on GA-BP neural network and ampere integral method. J. Eng. 2019, 2019, 576–580. [Google Scholar] [CrossRef]
- Li, J.; Liu, M. SOC estimation for lithium batteries based on the full parallel nonlinear autoregressive neural network with external inputs. J. Renew. Sustain. Energy 2018, 10, 064101. [Google Scholar] [CrossRef]
- Capizzi, G.; Bonanno, F.; Tina, G.M. Recurrent Neural Network-Based Modeling and Simulation of Lead-Acid Batteries Charge–Discharge. IEEE Trans. Energy Convers. 2011, 26, 435–443. [Google Scholar] [CrossRef]
- Yang, F.; Li, W.; Li, C.; Miao, Q. State-of-charge estimation of lithium-ion batteries based on gated recurrent neural network. Energy 2019, 175, 66–75. [Google Scholar] [CrossRef]
- Yang, D.; Wang, Y.; Pan, R.; Chen, R.; Chen, Z. A Neural Network Based State-of-Health Estimation of Lithium-ion Battery in Electric Vehicles. Energy Procedia 2017, 105, 2059–2064. [Google Scholar] [CrossRef]
- Widodo, A.; Shim, M.C.; Caesarendra, W.; Yang, B.S. Intelligent prognostics for battery health monitoring based on sample entropy. Expert Syst. Appl. 2011, 38, 11763–11769. [Google Scholar] [CrossRef]
- Lin, H.T.; Liang, T.J.; Chen, S.M. Estimation of battery state of health using probabilistic neural network. IEEE Trans. Ind. Inform. 2012, 9, 679–685. [Google Scholar] [CrossRef]
- Tang, X.; Zou, C.; Yao, K.; Chen, G.; Liu, B.; He, Z.; Gao, F. A fast estimation algorithm for lithium-ion battery state of health. J. Power Sources 2018, 396, 453–458. [Google Scholar] [CrossRef]
- Li, J.; Adewuyi, K.; Lotfi, N.; Landers, R.G.; Park, J. A single particle model with chemical/mechanical degradation physics for lithium ion battery State of Health (SOH) estimation. Appl. Energy 2018, 212, 1178–1190. [Google Scholar] [CrossRef]
- Huang, S.C.; Tseng, K.H.; Liang, J.W.; Chang, C.L.; Pecht, M.G. An online SOC and SOH estimation model for lithium-ion batteries. Energies 2017, 10, 512. [Google Scholar] [CrossRef]
- Cacciato, M.; Nobile, G.; Scarcella, G.; Scelba, G. Real-time model-based estimation of SOC and SOH for energy storage systems. IEEE Trans. Power Electron. 2016, 32, 794–803. [Google Scholar] [CrossRef]
- Ren, H.; Zhao, Y.; Chen, S.; Wang, T. Design and implementation of a battery management system with active charge balance based on the SOC and SOH online estimation. Energy 2019, 166, 908–917. [Google Scholar] [CrossRef]
- Fang, L.; Li, J.; Peng, B. Online Estimation and Error Analysis of both SOC and SOH of Lithium-ion Battery based on DEKF Method. Energy Procedia 2019, 158, 3008–3013. [Google Scholar] [CrossRef]
- Chaoui, H.; Ibe-Ekeocha, C.C. State of Charge and State of Health Estimation for Lithium Batteries Using Recurrent Neural Networks. IEEE Trans. Veh. Technol. 2017, 66, 8773–8783. [Google Scholar] [CrossRef]
- Bengio, Y.; Simard, P.; Frasconi, P. Learning long-term dependencies with gradient descent is difficult. IEEE Trans. Neural Netw. 1994, 5, 157–166. [Google Scholar] [CrossRef] [PubMed]
- Chung, J.; Gulcehre, C.; Cho, K.; Bengio, Y. Empirical evaluation of gated recurrent neural networks on sequence modeling. arXiv 2014, arXiv:1412.3555. [Google Scholar]
- Gers, F.A.; Schmidhuber, J.; Cummins, F. Learning to Forget: Continual Prediction with LSTM. Neural Comput. 2000, 12, 2451–2471. [Google Scholar] [CrossRef]
- Yao, Q.; Song, D.; Chen, H.; Wei, C.; Cottrell, G.W. Qin, Yao and Song, Dongjin and Chen, Haifeng and Cheng, Wei and Jiang, Guofei and Cottrell, Garrison A Dual-Stage Attention-Based Recurrent Neural Network for Time Series Prediction. arXiv 2017, arXiv:1704.02971. [Google Scholar]
- Liu, Y.; Gong, C.; Yang, L.; Chen, Y. DSTP-RNN: A dual-stage two-phase attention-based recurrent neural networks for long-term and multivariate time series prediction. Expert Syst. Appl. 2020, 143, 113082. [Google Scholar] [CrossRef]
Publisher’s Note: MDPI stays neutral with regard to jurisdictional claims in published maps and institutional affiliations. |
© 2021 by the authors. Licensee MDPI, Basel, Switzerland. This article is an open access article distributed under the terms and conditions of the Creative Commons Attribution (CC BY) license (http://creativecommons.org/licenses/by/4.0/).