


Abstract
Fault detection in microgrids presents a strong technical challenge due to the dynamic operating conditions. Changing the power generation and load impacts the current magnitude and direction, which has an adverse effect on the microgrid protection scheme. To address this problem, this paper addresses a field-transform-based fault detection method immune to the microgrid conditions. The faults are simulated via a Matlab/Simulink model of the grid-connected photovoltaics-based DC microgrid with battery energy storage. Short-time Fourier transform is applied to the fault time signal to obtain a frequency spectrum. Selected spectrum features are then provided to a number of intelligent classifiers. The classifiers’ scores were evaluated using the F1-score metric. Most classifiers proved to be reliable as their performance score was above 90%.
1. Introduction
Modern power distribution networks accommodate an increasing number of active consumers who can change their operating points based on various types of incentives. A decentralized group of electricity sources, loads and energy storage connected to the distribution network at a single coupling point is called a microgrid. Since this concept is still rather new, microgrid operation faces certain issues that the existing literature has not yet addressed. Dynamic loading, bi-directional power flow, intermittency of local renewable sources, type of distributed generation (syncronous machines vs. electronically controlled sources), and variation of fault current have a big impact on the microgrid operation and protection [1]. Conventional protection was proven ineffective in the microgrid environment [2], and advanced methods have to be devised. In the last few years, fault detection based on signal processing and machine/deep learning techniques has gained popularity. Short-time Fourier transform (STFT), Wavelet transform (WT), Hilbert-Huang transform (HHT) and S-transform (ST) are common choices for signal analysis. The signal features extracted by using these techniques are then used as inputs for machine or deep learning models. Intelligent classifiers, based on machine learning models, have become a reliable tool with high accuracy.
The rise of photovoltaic renewable energy sources, DC electrical loads, and energy storage systems spurred the interest in DC microgrids, making them an alternative to AC microgrids [3]. Modern power electronics and control algorithms enabled efficient implementation and reliable operation of DC microgrids [4,5]. DC systems have many advantages over their AC counterpart, such as higher reliability, power quality, transmission capacity, and less complicated control [6]. However, the protection of DC systems is more challenging, due to the nature of the DC current. Fast transients and absence of zero-crossing demand a fast reaction of the protection [7]. The most common faults in DC microgrids are pole-to-pole (PP), pole-to-ground (PG), and two PG (2PG) faults. Pole-to-pole faults appear to a smaller extent, but can cause extremely high currents and damage to the equipment. On the contrary, high-impedance faults (HIF) are difficult to detect because they cause a low rise in the current so protection will not react. Considering the availability of intelligent classification methods and the problems that concern the DC system protection, this paper proposes a fast and selective protection method.
2. Related Work and Contribution
Presence of the distributed generation (DG) could lead to inaccurate operation of the system protection. Challenges that protection faces in DG environment are dynamics in the fault current magnitude, blinding of protection, unintentional islanding and loss of mains [1]. To address these challenges, beside conventional methods, advanced methods have been implemented. These methods are separated to event estimation-based, fuzzy-based, field transform-based and intelligent fault detection methods [8].
Conventional fault detection methods use fixed thresholds to detect faults, making them unsuitable for application in a microgrid that accommodated distributed generation (DG). Overcurrent protection, which is the basic protection method, could fail to detect a fault in a microgrid environment in both operating modes, grid-connected or islanded. Namely, false tripping or a failure to trip caused by the fault current level change are the main issues affecting the overcurrent protection [2]. Differential protection, another traditional distribution system protection method, was adopted in the microgrid environment in [9]. It was proved applicable, but the difficulty of determining a multi-terminal protection zone with several inputs makes it unsuitable. For example, a power line with a varying number of connected sources and loads requires continuous monitoring and updating the trip thresholds.
Event estimation-based protection schemes compare analytically obtained models with real-world measurements to detect faults. In [10], the fault current transient derivative equations are derived for faults at busbars and feeders and used for the threshold selection. Since the observed system is DC, the current derivative magnitude during faults is significant, making the detection more simple. Moreover, the advantage of this protection scheme, compared to the traditional differential schemes, is that it works with a multi-terminal system. However, the analytical model must be very accurate or the protection might fail.
Fuzzy logic offers another, logic-based approach for system protection. The method’s fundamentals were explained in [11] where it was also applied to the transmission line fault identification. The identification procedure based on eight rules enabled the differentiation of line-to-line, line-to-ground, and line-to-line involving ground faults. Furthermore, ten types of short-circuit faults (phase-to-phase, phase-to-ground, two-phase-to-ground, and three-phase) occurring at the transmission lines are successfully detected using fuzzy logic [12]. Line loading and different fault resistances were considered and proven not to impact the fault identification, which is case effective in over 97% cases. Type-2 fuzzy logic is a generalization of type-1 fuzzy logic and offers a significant level of imprecision modeling [13], making it a better choice for complex systems such as microgrids. It is successfully applied for microgrid protection in both islanded and grid-tied mode of operation [14]. The presented protection method successfully detects and classifies faults and determines the fault direction. This protection strategy is immune to the fault location and type and can protect a microgrid even after a single-phase trip. However, according to [15], fuzzy logic lacks real-time response, which is crucial for system protection.
Field transform-based methods transform signals from the time domain to a domain that could provide a more clear insight into the data characteristics. Commonly used methods that transform signals to frequency domain are Short-time Fourier transform (STFT), S-transform (ST) and Hilbert-Huang transform (HHT). STFT is introduced to overcome the drawbacks of the Fourier transform on the confined interval of the signal. Amplitude-frequency characteristic obtained by STFT is used for fault detection in most of STFT-based fault detection methods. HVDC (High Voltage Direct Current) protection against pole-to-pole faults based on STFT is proposed in [16]. The current of the system is monitored and decomposed into frequency components. The standard deviation of the side lobes obtained from the amplitude-frequency characteristic is used for fault detection. During the transient states, high-frequency components will gain in amplitude and increase standard deviation. In the case of a fault, the increase will be significant compared to the load change. A similar method was used in [17], but instead of the standard deviation, amplitudes at specific frequencies are used as the indicators of transients. Again, the current change will cause high-frequency amplitudes to increase and, if the threshold is reached, the trip signal will be sent to the circuit breakers. Amplitude and frequency provided by STFT enable detection of under/over-voltage and under/over-frequency in an AC microgrid [18]. The voltage signal is monitored in real-time, and its magnitude and frequency change indicate disturbances in voltage magnitude and frequency.
S-transform is an extension to the special case of STFT, called the Gabor transform and the Wavelet transform [19]. ST will, much like STFT, provide the frequency spectrum of the signal. ST-based islanding detection for distributed generation is proposed in [19]. Negative sequence voltage and current are transformed and energy spectral content is obtained. Next, the cumulative sum of consecutive samples’ energy content is calculated. Load change and other DG trips produce a less significant change in the cumulative sum, which enables the threshold determination. The protection method for both islanded and grid-connected microgrid operating mode is also proposed [20]. ST provided frequency spectrum where high frequencies have shown to be efficient and robust fault indicators independently of the fault parameters. Moreover, the computational burden of the proposed method is reduced by using a simplified version of ST, suitable for online calculation.
HHT is an adaptive method for time-frequency representation applied to non-stationary signals [21]. It was applied for the AC microgrid protection in [22] and compared to ST. The differential current was processed by HHT and its differential energy calculated and used as a fault detection parameter. The thresholds are divided into three ranges, for grid-connected, islanded, and high impedance fault (HIF). After a comparative evaluation, the authors concluded that HHT is as effective as ST. Multiterminal system protection, as stated before, has to provide protection at continuously changing system states. In [23] HHT was applied for multiterminal HVDC system distance protection. As it is used in DC system fault detection, the transform is used to detect high-frequency components during transients. Voltage is the input and the output is the distance from the circuit breaker to the fault location. The role of the HHT is to provide the instantaneous amplitude and frequency of the signal components, which is later averaged and used for distance estimation. The algorithm was also implemented for real-time testing, where it showed a 10% error. It should be taken into account that during the real-time testing, the signal noise is present and the method does not use any communication.
Wavelet transform (WT) in its discrete form (DWT) is also a popular choice by many researchers. Wavelets are analyzing functions that adjust their time width to the frequency [24]. The transform decomposes signal to produce a set of coefficients, later used for fault detection. WT-based transmission line distance protection [25] uses one decomposition level containing high frequencies for disturbance detection and two levels for phasor estimation. High frequencies are again used for fault detection, similar to the STFT, ST, and HHT-based protection methods. For detection, db1 mother wavelet is used, and for estimation db4. Once the current disturbance is detected, the impedance is calculated from the estimated current and voltage phasors. The method proved effective, with the ability to detect HIFs. WT was also applied for DC microgrid protection in [26], where the second derivative of the current is subjected to the transform. Level 2 WT coefficients’ energy is extracted for the fault indication. However, compared to DWT, wavelet packet transform (WPT) provides more precise analysis [27]. Both, DWT and WPT use high and low-pass filters to extract components. In every decomposition level of DWT, only the low-frequency component is again decomposed by a low and high-pass filter. In the case of WPT, both components are decomposed, making it more accurate. In [27] a WPT-based fault detection of a photovoltaic system is proposed. As a fault indicator, level 2 coefficient (500–750 Hz) energy of voltage and impedance are used. Recently, another WT method, called an un-decimated wavelet transform (UWT), was introduced for fault detection. It was used in [8], where the authors find UWT more suitable than DWT and WPT for real-time fault detection. It is also stated that the method is less sensitive to noise.
Considering the amount of information obtained by transforming a signal into the frequency domain, ST, WT and HHT provide a more detailed observation compared to the STFT. The frequency resolution of the STFT depends strongly on the window size. Since the window size of STFT is fixed, a long window will have a problem detecting short perturbations, while a short window will poorly depict low frequencies. This problem is overcome with ST using the time and frequency dependent window function and WT with variable frequency resolution. These features are better suited for the analysis of non-stationary signals, which is the case when detecting faults/disturbances. However, choosing a suitable “mother wavelet” and the appropriate decomposition level is a challenge when using WT. HHT uses an adaptive basis function, making it suitable not only for the analysis of non-stationary but also non-linear signals. However, mode mixing in the Empirical Mode Decomposition (EMD) part of HHT presents a problem when intermittent waves occur at a lower-frequency signal [28]. In addition, complex methods have a more complex implementation, which increases the response time. In contrast, the STFT uses a simple algorithm based on the DFT. The DFT has already been implemented in digital protection relays [29], so it can easily be adapted for this purpose.
Over the past few years, intelligent classifiers established themselves as a reliable choice for fault detection, usually combined with one of the field transform-based methods. Decision trees, artificial neural networks, naive Bayes, and support vector machine are often used as classifiers. An example of the direct application of intelligent classifiers for fault detection is presented in [30]. Artificial neural network’s (ANN) inputs are voltage and current time signals and outputs are binary variables that indicate whether the fault is detected and the direction of the fault. The method proved reliable with an accuracy of 99% and section identification accuracy of 100%. However, the time signal is usually transformed using field transform-based methods first. Features are then selected from the transformed signal and fed to the intelligent classifier. For example, when WT is a feature provider its output coefficients are used for feature selection. DWT provided features to k-Nearest Neighbours (k-NN) [31] and Bayes [32] classifiers for power system fault detection. Both the Bayes and the k-NN classifiers showed capable of detecting HIFs among other transients. For the microgrid fault detection, DWT is combined with support vector machine (SVM) in [33] and decision tree (DT)/random forest (RF) in [34]. The mentioned SVM-based protection uses a standard deviation of the coefficients obtained by DWT as classifier input. Moreover, a single SVM and SVM ensemble is tried and the ensemble method was proven to be more effective. DT and RF-based protection used the change in energy, Shannon entropy, and standard deviation of DWT coefficients as the features. Both methods proved accurate, but RF faced implementation issues. In [35], HHT provided features in the form of energy distribution and standard deviation of the signal component amplitude and phase. ANN classifier was used and achieved 92.85% accuracy. The same classifier was used with ST for fault detection in a radial distribution system. Again, various features such as maximum amplitude and frequency of the S-matrix and its standard deviation and entropy were extracted and used for model training. A simple form of ANN, feed-forward neural network (FFNN) was used as a classifier for ST-based fault detection in a distribution system in [36]. The used features included the standard deviation of the -matrices along with their means and skewness. In [37], the microgrid protection used STFT to extract features from the voltage signal and DT/RF for detection and classification. The features were extracted from the main frequency contour. Some of the features are the average, root mean square (RMS), and kurtosis. The method proved to be very accurate. Finally, clustering and classification of pulsed loads on a naval shipboard power system presented in [38] also use STFT of current signal for feature vector extraction.
The contribution of this paper is the development of a protection method based on the Short-time Fourier transform (STFT) and intelligent classification. Since the STFT is merely investigated as a feature provider, in this work it will be combined with different classifiers. The employed classifiers are logistic regression, naive Bayes, k-nearest neighbours (k-NN), DT, SVM, and AdaBoost. PV-based microgrids with battery energy storage systems are becoming increaasingly common, which is why it was selected as a case study.
Section 3 presents STFT-based fault detection method and applied Machine learning methods. In Section 4 microgrid simulation setup is described together with the STFT parameters and classifier evaluation method used. Section 5 offers a results of the proposed method, and Section 6 concludes the paper.
3. Short-Time Fourier Transform Based Fault Detection
3.1. Proposed Method Overview
The input signal that is decomposed to the frequency components is current of a DC-DC converter interfacing a BESS and its DC bus. Short-time Fourier transform (STFT) is then used to obtain the frequency feature vector. Based on these features, the intelligent classifier generates the system state at a given time window. System states are marked as neutral, fault, and load change. The schematic overview of the fault detection method is shown on the Figure 1.
Figure 1.
Schematic overview of proposed short-time Fourier transform (STFT) based fault detection.
3.2. Short-Time Fourier Transform
When Fourier transform is applied to a discrete-time signal the result is not always as theoretically expected. In case of a sinusoidal wave, the expected transform output is peak at the corresponding frequency bin. However, in reality a spectral leakage occurs, causing the frequency response of the wave to be dispersed across the frequency spectrum. The reason for this are discontinuities at the boundaries of the observation interval. A periodic extension of the signal is erroneous as it includes discontinuity [39].
Window functions are generally introduced to reduce spectral leakage [39]. The goal of such functions is to reduce the order of discontinuity at the boundary, which is accomplished by signal smoothing near the end of interval. At the boundary, the signal is brought to zero. There are many window functions with various characteristics available. Figures of merit are highest side lobe level, side lobe fall-off, 3 dB bandwidth, etc. If the amplitude of the frequency spectrum components is to be determined, the flat-top window should be used.
Every window function is decreasing to zero at boundaries (except rectangle). If the signal is windowed in consecutive intervals, part of the data will be lost, so windows overlapping is required. STFT of a discrete time domain signal is given with equation:
where n is the sample index, k the frequency index, N the interval length, the window function, m the position of the window and H the hop size between successive windows.
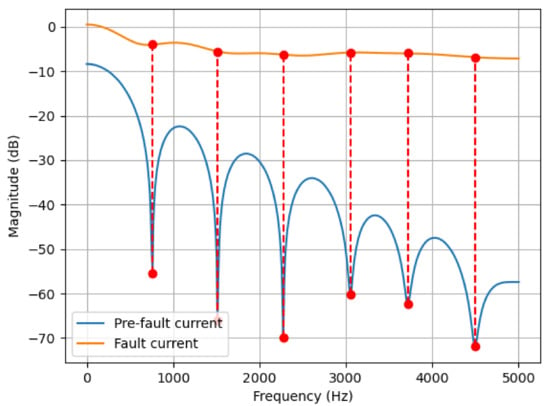
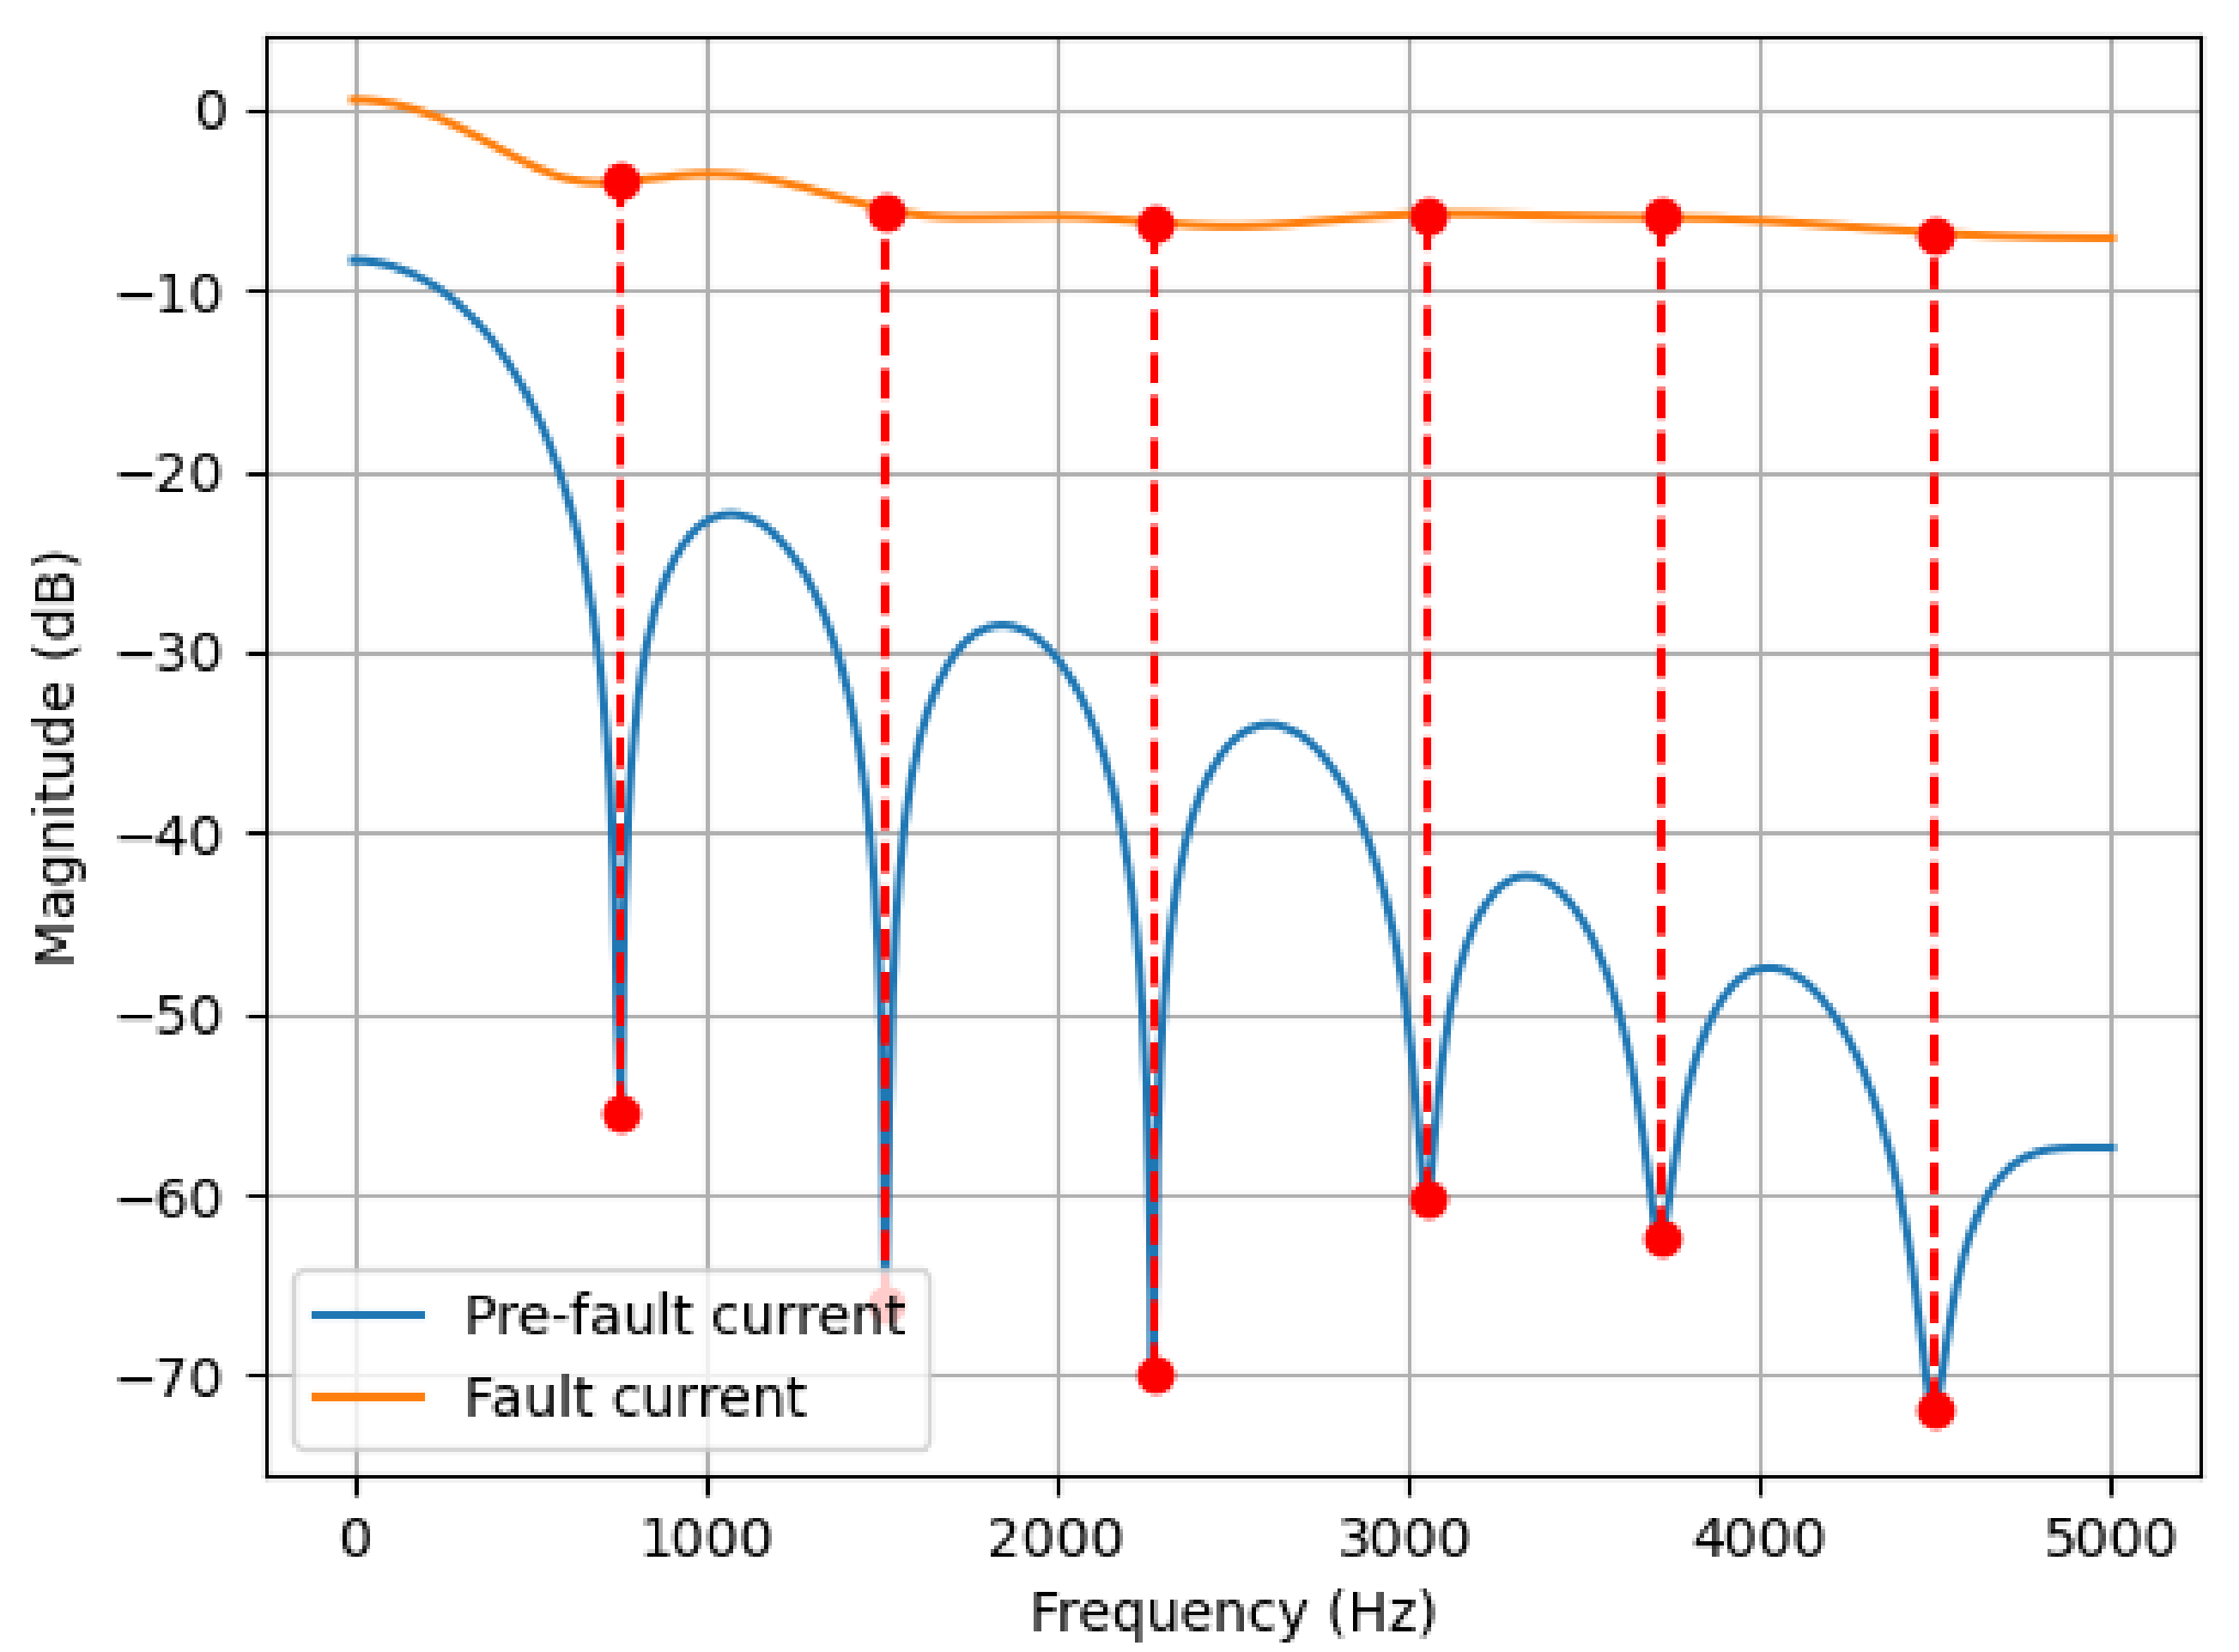
The current signal decomposed in frequency components is shown in Figure 2. During the regular operation, DC current is almost flat. As can be seen, the power is concentrated at the main lobe (DC component of the observed signal). During current transients (faults or load changes), the power concentrated in the main lobe is dissipated over the entire frequency spectrum, i.e., magnitude of the side lobes will increase. As can be seen from the figure, the change in amplitude of the frequency components is significant during faults. The largest change occurs at frequencies corresponding to the “edges” of the side lobes (marked with red dots). Therefore, this occurrence can be used in a fault detection algorithm.
Figure 2.
STFT of the pre-fault and fault current signal.
3.3. Applied Machine Learning Methods
Since the labelled dataset, i.e., each feature vector in the dataset is a member of a class, is available, machine learning (ML) methods suitable for supervised learning were used. In general, there are two main categories of the ML methods used for discriminative tasks. Parametric methods assume that the data points are subject to an unknown distribution. Consequently, they model a conditional distribution P(y|x), which assigns data points to one of the predefined classes by the principle of maximum probability. In this work, two discriminative methods were used: Linear regression and Naive Bayes classifier. These methods are chosen due to their high interpretability and appropriate capacity. Nonparametric methods do not assume the underlying dataset distribution. Hence, these methods heavily depend on available dataset. Availability of an appropriate dataset can yield with superior models compared to the parametric methods, but at the cost of interpretability loss. In this work, the following nonparametric methods are used: k-Nearest Neighbour (k-NN), Decision Trees (DT), Support Vector Machine (SVM)—dual formulation, and AdaBoost. The mentioned parametric and non-parametric methods are explained in great detail in [40].
Modern neural networks comprise a large set of nonlinear transformations. Consequently, their ability to correctly classify a given sample outperforms classical ML methods. The training of neural networks requires significantly more data compared to the classical ML methods. Furthermore, neural networks trained on an insufficient dataset lose their generalization ability. Additionally, an overexpressive neural network has a slower response time during the inference phase. With that said, this work focuses on simpler and faster classical methods that are proven to be sufficient for the given task.
4. Experiments
4.1. Simulation Setup
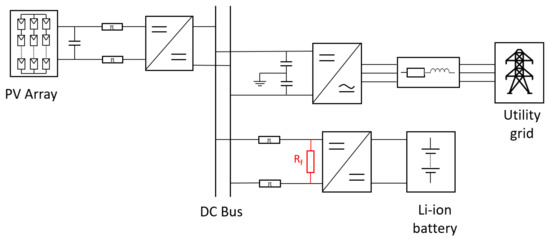
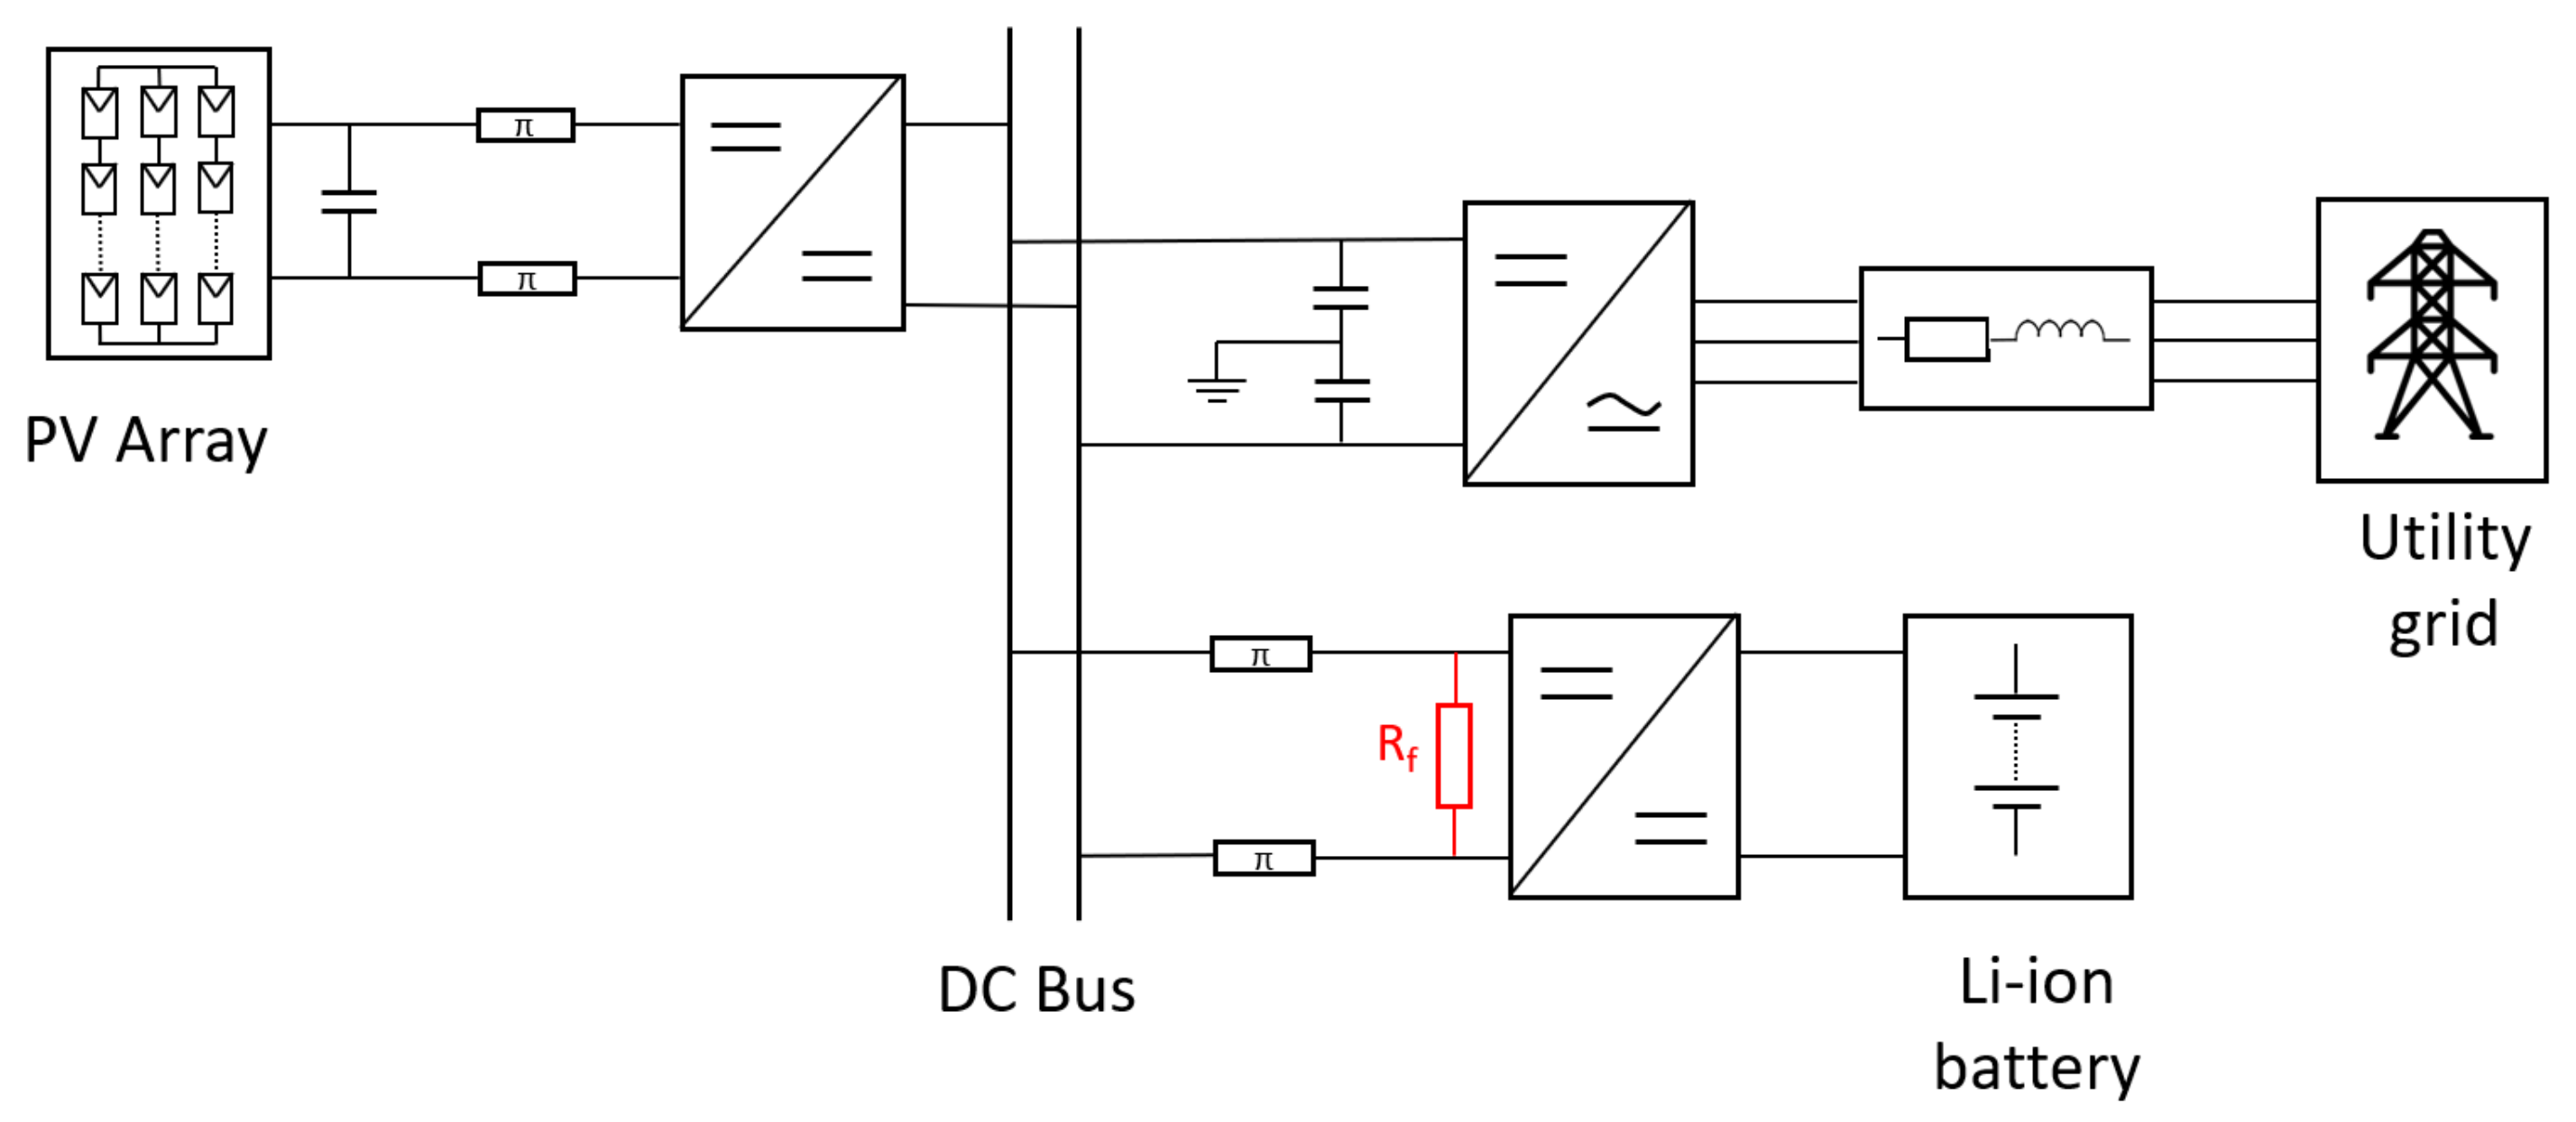
Matlab/Simulink simulation model is a PV-based microgrid with lithium-ion battery energy storage system (BESS). The PV arrays are connected via buck and the BESS via a bidirectional buck-boost DC-DC converter (Figure 3). The microgrid is not isolated, its DC bus is connected to the distribution grid via a voltage-source converter (VSC). The BESS’s converter is in the constant current control mode. PVs are in the Maximum Power Point Tracking (MPPT) mode, with their irradiance and temperature values fixed. The microgrid parameters are given in Table 1.
Figure 3.
Microgrid model with fault location used in the experiments.
Table 1.
Microgrid parameters.
PP fault is simulated by short-circuiting the terminals of the converter that connects the battery to the bus. Fault resistance ranges from 0.1 to 20 , so high impedance faults (HIF) are included. Load change is simulated by setting the step change of the current reference.
4.2. STFT Parameters
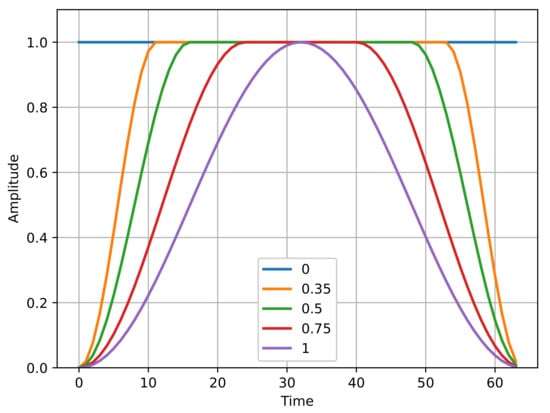
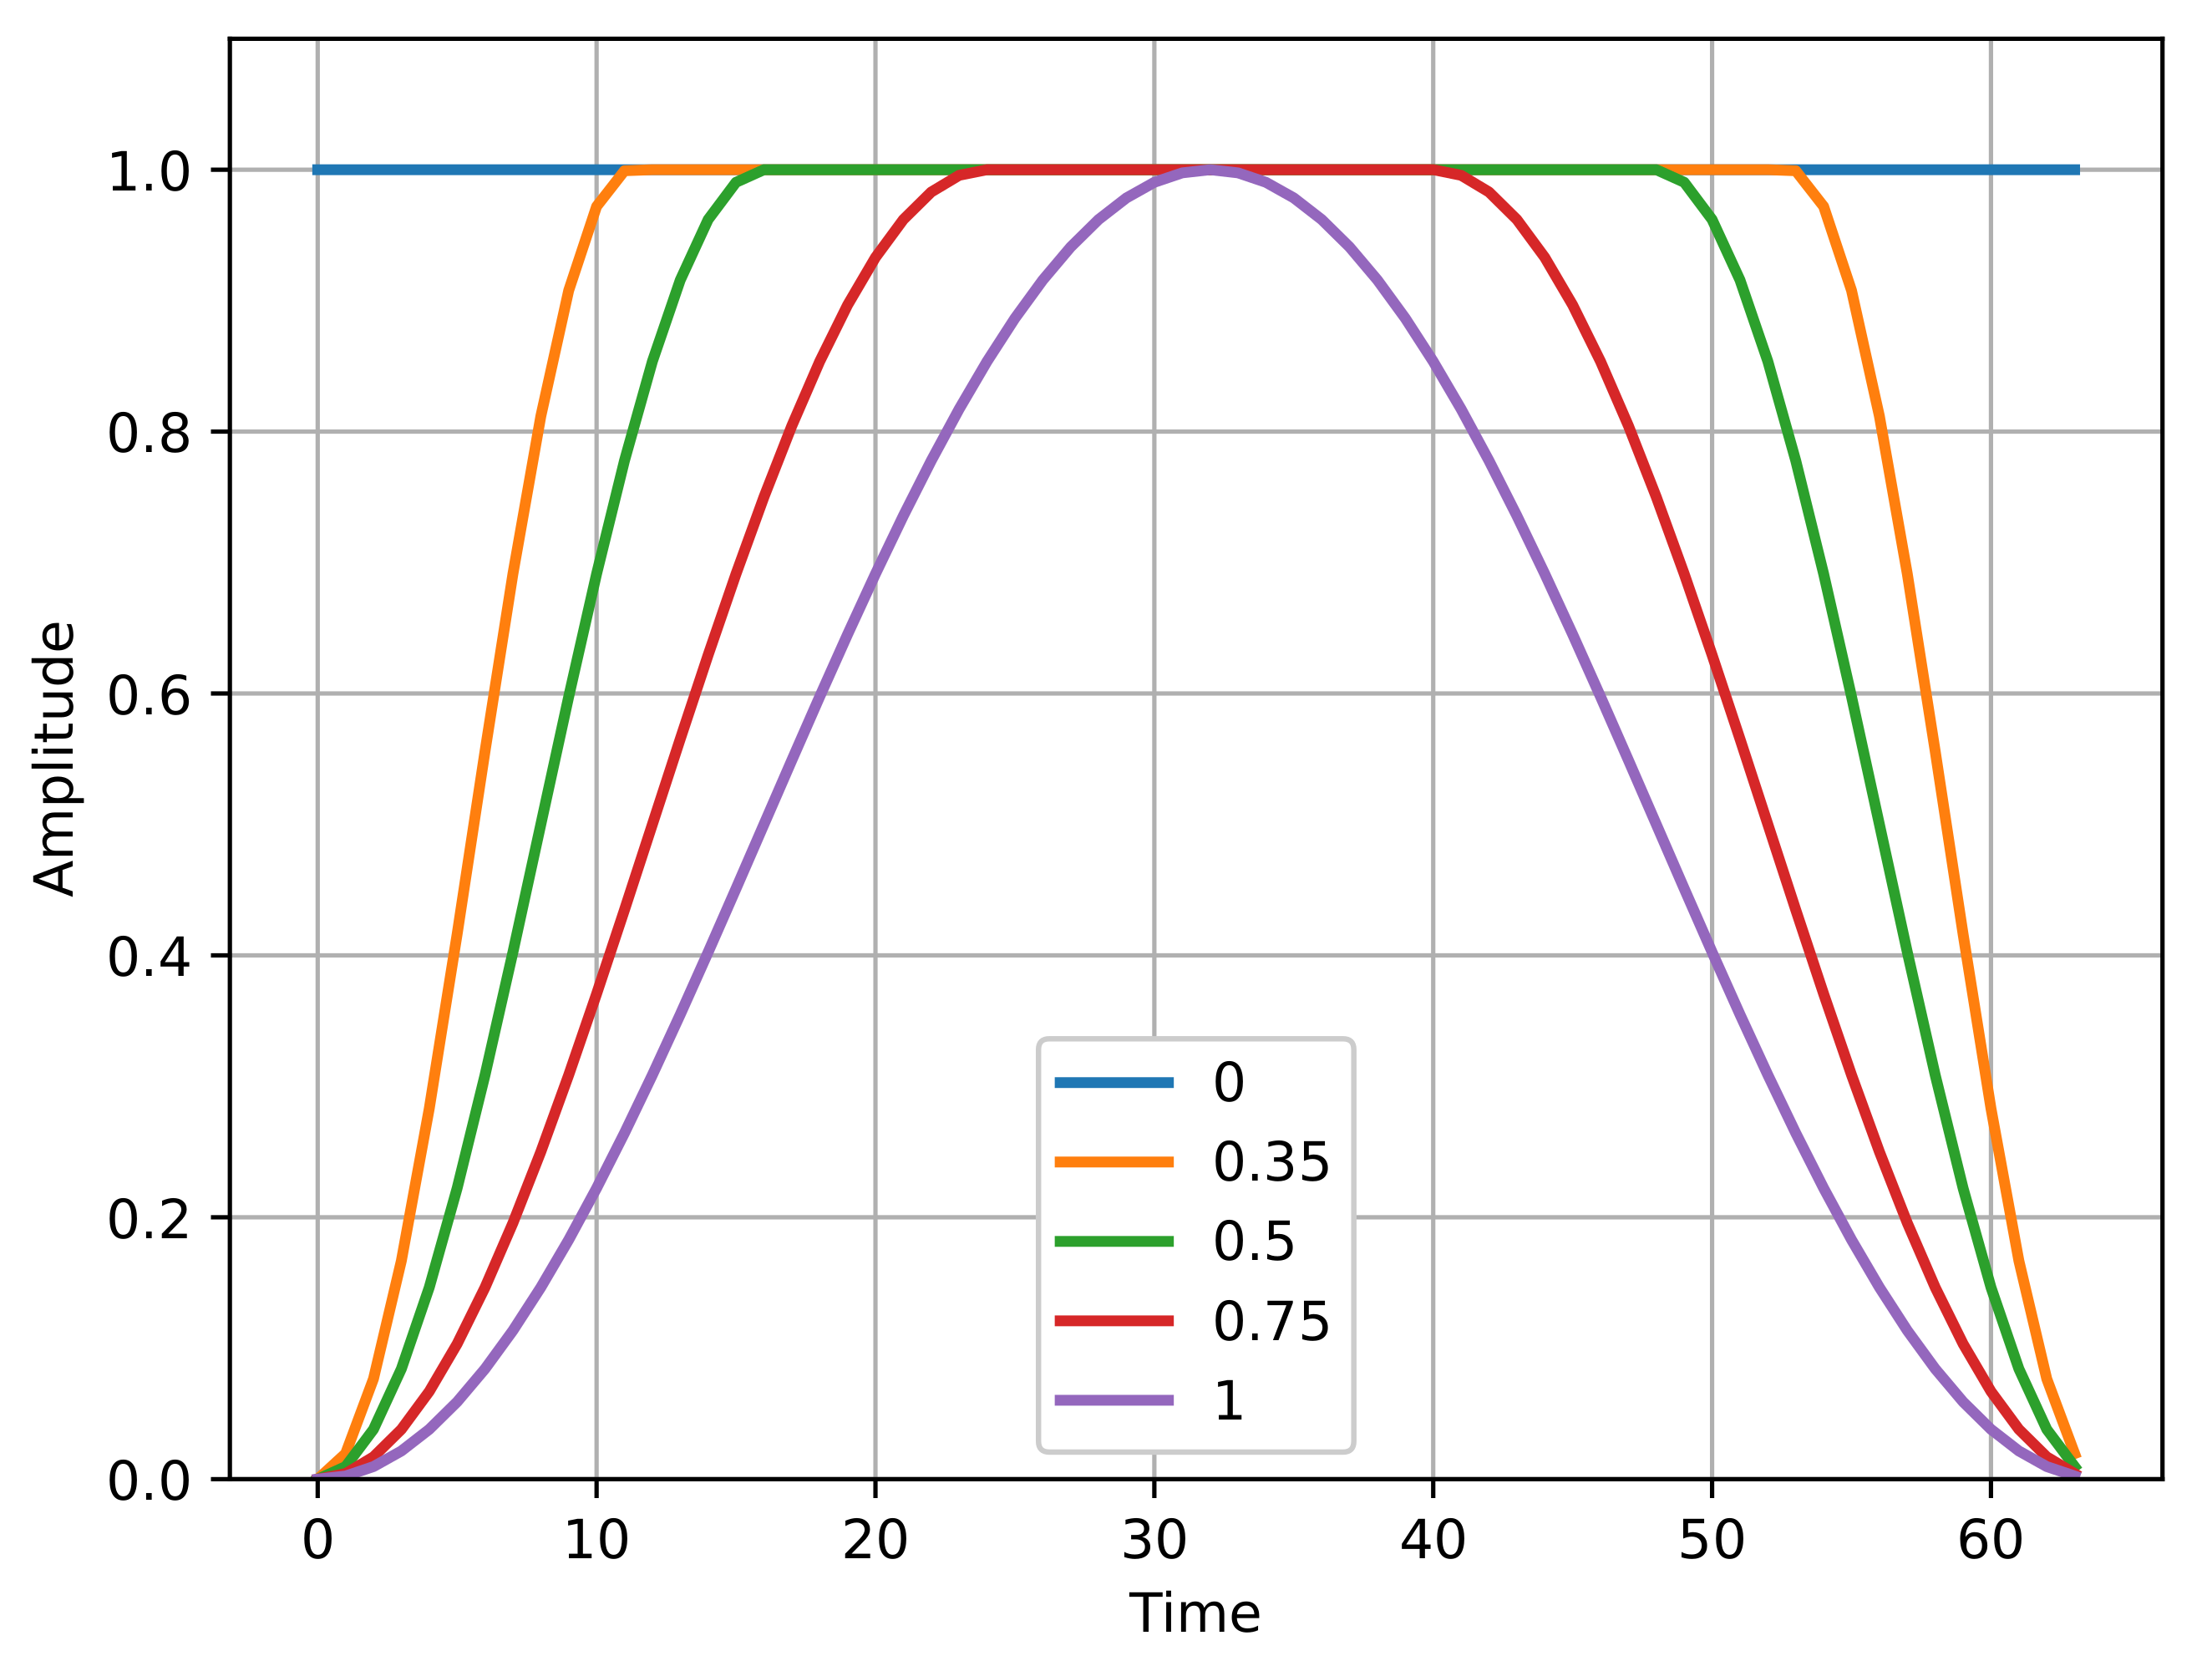
Size of the time horizon window directly affects the frequency resolution. Used window sizes are 16, 32, 64, and 128 samples [17]. Consequently, the feature vector size depends on the window size used, which is 8, 16, 32 and 64, respectively. The obtained dataset contains approximately 43,500 data points. The accumulated dataset sufficiently covers all test cases. The dataset is scaled to zero mean and unit variance for every feature. The sampling frequency of today’s digital relays is 10 kHz, so this frequency was used for data sampling. Hop size used is four samples to keep successive windows overlapping rate relatively high and detection time low. In this work, Tukey window is used because it smoothly settles data to zero while it does not reduce the processing gain significantly [39], making it suitable for transient analysis. Also, its parameter allows adjusting the taper size, which affects the window function frequency response. Figure 4 shows how window function changes with the increasing . For , Tukey window is equal to the rectangle window, and for it becomes the Hanning window. Rectangle window does not smooth the time signal, so discontinuities at interval ends are present. Hanning window, however, has a medium impact on frequency resolution and amplitude of the obtained frequency spectrum. It is commonly used with random data. Tukey window function is defined as:
where , N length of the signal and . is chosen to be 0, 0.15, 0.35, 0.5, 0.75, 0.9, and 1.
Figure 4.
Tukey window for different .
4.3. Feature Selection
The current signal is decomposed into frequency components for every successive window. Amplitudes at the specified frequency bins are taken as features for the intelligent classifier, which makes the decision whether there is a fault or not. Frequency bins (edges of the side lobes) theoretically occur at , where , is sampling frequency and N is half-length of a signal [16]. Hence, these frequencies compose a feature vector propagated to the intelligent classifier. Since different window sizes are used, the number of features will increase with the increasing window size. The DC component of the signal will not be used as a feature because the fault detection has to work independently of the current magnitude.
4.4. Intelligent Classifiers Evaluation
Various intelligent classifiers were plugged in to demonstrate the robustness of the proposed method. Due to the stochasticity of the discriminative models, valid performance estimation is needed. Hence, the classifiers were evaluated using K-fold cross-validation. This approach splits a given dataset into K equal folds. The classifier is then trained on folds and assessed on a single fold. This procedure is repeated K times with different folds used for every evaluation. Consequently, a realistic estimation of the classifier’s performance is obtained. Moreover, it can guarantee that classifier’s performance will be at least as good as the estimated performance. In all conducted experiments, the value of K is set to 10. There are different metrics for the performance evaluation of a classifier. Here we use the multiclass F1-score metric, which is defined as the harmonic mean of the precision and the recall. For a binary classifier, the precision is defined as a ratio of the correctly classified positive data points and the positively classified points. On the other hand, the recall is defined as a ratio of the correctly classified positive data points and the points belonging to the positive class. Since the dataset contains a modest difference in class sizes, a weighted-F1 score takes that into account.
5. Results
The proposed STFT-based protection method was applied to the PV-based microgrid described above. The pole-to-pole fault was investigated by short-circuiting poles with resistances from 0.1 to 20 , and load change by setting step change of the current reference of the DC-DC converter. The results presented in the Table 2, Table 3, Table 4, Table 5, Table 6, Table 7 and Table 8 show intelligent classifier weighted F1-score in percentages for different taper () and window sizes. The tables are separated by an () value, since this value determines the effects of the windowing on the original signal, and thus on the features. The window size should also have a significant impact, since the longer window provides more features. Note that a longer window with a fixed hop size limits feature variation.
Table 2.
Cross-validation results ().
Table 3.
Cross-validation results ().
Table 4.
Cross-validation results ().
Table 5.
Cross-validation results ().
Table 6.
Cross-validation results ().
Table 7.
Cross-validation results ().
Table 8.
Cross-validation results ().
Table 2 shows the results for the rectangle window (). Here the window function has no effect on the data, i.e., the data is multiplied by one. The absence of windowing does not seem to bother nonparametric methods, as they show an accuracy of over 97%, except for AdaBoost. Decision Tree achieved the best score of 98.74%. The k-NN is slightly lower at 98.63%. Both scores are achieved for window size 128. As far as the parametric methods are concerned, the score of logistic regression ranks with the nonparametric methods. Naive Bayes has a problem with longer windows, while the first two show good results.
Increasing from 0 to 0.15 affects the edges of the window function, which are now brought to zero. This change has the biggest impact on the Naive Bayes classifier, whose performance is down by 4% to 45%. Logistic regression and SVM experience performance decrease for the window size 16, while AdaBoost increases its performance for the same window size. Other classifiers experience only a slight change in performance.
The increase from to 0.35 does not seem to have much impact on the nonparametric methods, with the exception of AdaBoost, which now demonstrated better results in two out of four window sizes, and SVM, which lost high performance for window size 16. For this taper size, the k-NN shows the best result, with Decision tree closely following. Naive Bayes remains fairly inaccurate as can be seen from Table 4. Logistic regression also kept high performance for all windows except the size 16.
Increasing to 0.50 results with remarkable results, as k-NN and Decision tree score increase above 99% for the window size 128. Logistic regression and SVM again increased their score above 90%. AdaBoost also increased its score above 90% for three out of four windows with a significant reduction in the score for window size 32 compared to . Naive Bayes increased its score to 96.79% for window size 32, but the score for other windows remains unsatisfactory.
Further increase of to 0.75 results in only a slight change for nonparametric methods, again with the exception of AdaBoost. The logistic regression also shows a slight change with an decrease of 1% and 2% for the window sizes 128 and 16. Naive Bayes is still unable to achieve satisfactory results as its score is below 85%. AdaBoost has continued the trend of increasing its score, with the lowest score being 88.25% which is an acceptable result. k-NN, Decision tree and SVM remain consistent with their previous scores.
As approaches the value 1, all classifiers except Naive Bayes score above 90% (Table 7). k-NN and DT still have the best score, followed by logistic regression and SVM. AdaBoost achieves score above 90% for all windows sizes for the first time. In contrast, Naive Bayes scored worse for the three of the four window sizes.
Finally, for (Hanning window) all classifiers except one score over 93% for all window sizes. The decision tree shows the best score with 99.33% for the window size 128. k-NN with score 99.28% for the same window size is very close to the best score. The score of SVM and AdaBoost increased about five percentage points for window size 16, compared to . Naive Bayes recorded a significant increase in score, achieving over 88% for three out four window sizes.
The Decision tree classifier achieves the best overall score with 99.33% for the Hanning () window function and window size 128. The k-NN comes very close as the second best result with 99.28% for the same settings. Both classifiers proved to be consistent and reliable, independent of the window and taper size, with a score of over 97% for all the examined cases. The SVM is also reliable, with a score over 96% for window sizes 32, 64 and 128 for all taper sizes. However, for window size 16, the score varies from 89.63 to 97.35%. Logistic regression, although parametric method, performed similar to the SVM. Its score was above 95% for window sizes 32, 64, and 128, but in the range of 83.81-97.30% for the window size 16. AdaBoost behaves differently for different window sizes. Window sizes 16 and 64 have the best results for , 32 for , and 128 for . Its best overall score is 97.23%, for Hanning window and window size 64. Naive Bayes is also depend on the taper and window size. The best score is achieved for window sizes 16, 32 and 64, where it exceeds 89% for a few cases. For window size 128, however, the best overall score is only 59.30%.
The interpretability of parametric methods could reveal information about features. The high score of logistic regression implies that classes of data points are linearly separable. Furthermore, the basic assumption that makes Naive Bayes classifier is that all features are independent. Its poor performance implies that the features used in this work are not independent, which is reasonable, since the STFT is used for feature extraction.
6. Conclusions
In this work, a fault detection method based on short-time Fourier transform and intelligent classification is implemented in a DC microgrid environment. Different parametric and nonparametric classifiers were used and evaluated according to the F1-score metric. Furthermore, different window functions with different sizes were evaluated. Amplitudes at specified frequency bins turned out to be good features for fault detection, as most classifiers achieved a score of more than 90%. Decision trees and k-NN proved to be the best classifiers as they achieved a score of over 97% independent of the window function and window size used. In addition, both scored over 99%, making them very reliable for fault detection. SVM and logistic regression also offer a high degree of reliability and should be considered for implementation for fault detection. AdaBoost has been shown to be less reliable, but since its score is usually above 90%, it could be considered for fault detection. However, Naive Bayes has only a small percentage of scores above 90%, so its use for fault detection could be poor decision. From this it can be concluded that the window function and the size of the window function have a relatively small impact on the nonparametric classifiers. Modern fault detection should be based on these classifiers, with STFT as a suitable feature provider. Given the complexity of the implementation, less complex parametric methods could be used, i.e., logistic regression, which proved to be reliable.
Author Contributions
Conceptualization, I.G.; methodology, H.P.; supervision, H.P. and D.N.; writing-original draft preparation, I.G.; writing-review and editing, D.N. and H.P.; model design, I.G. and H.P.; model implementation, I.G. All authors have read and agreed to the published version of the manuscript.
Funding
This work was supported by the Croatian Science Foundation and the European Union through the European Social Fund under project Flexibility of Converter-based Microgrids—FLEXIBASE (PZS-2019-02-7747).
Institutional Review Board Statement
Not applicable.
Informed Consent Statement
Not applicable.
Data Availability Statement
The data presented in this study are available on request from the corresponding author. The data are not publicly available due to project data privacy policy.
Conflicts of Interest
The authors declare no conflict of interest.
References
- Brearley, B.J.; Prabu, R.R. A review on issues and approaches for microgrid protection. Renew. Sustain. Energy Rev. 2017, 67, 988–997. [Google Scholar] [CrossRef] [Scilit]
- Haron, A.R.; Mohamed, A.; Shareef, H.; Zayandehroodi, H. Analysis and solutions of overcurrent protection issues in a microgrid. In Proceedings of the IEEE International Conference on Power and Energy (PECon), Kota Kinabalu, Malaysia, 2–5 December 2012; pp. 644–649. [Google Scholar]
- Chowdhury, D.; Hasan, A.K.; Khan, M.Z.R. Islanded DC Microgrid Architecture with Dual Active Bridge Converter-Based Power Management Units and Time Slot-Based Control Interface. IEEJ Trans. Electr. Electron. Eng. 2020, 15, 863–871. [Google Scholar] [CrossRef] [Scilit]
- Hasan, A.S.M.K.; Chowdhury, D.; Khan, M.Z.R. Scalable DC microgrid architecture with a one-way communication based control Interface. In Proceedings of the 10th International Conference on Electrical and Computer Engineering (ICECE), Dhaka, Bangladesh, 20–22 December 2018; pp. 265–268. [Google Scholar]
- Chowdhury, D.; Hasan, A.S.M.K.; Khan, M.Z.R. Scalable DC microgrid architecture with phase shifted full bridge converter based power management unit. In Proceedings of the 10th International Conference on Electrical and Computer Engineering (ICECE), Dhaka, Bangladesh, 20–22 December 2018; pp. 22–25. [Google Scholar]
- Mirsaeidi, S.; Dong, X.; Said, D.M. Towards hybrid AC/DC microgrids: Critical analysis and classification of protection strategies. Renew. Sustain. Energy Rev. 2018, 90, 97–103. [Google Scholar] [CrossRef] [Scilit]
- Beheshtaein, S.; Cuzner, R.M.; Forouzesh, M.; Savaghebi, M.; Guerrero, J.M. DC Microgrid Protection: A Comprehensive Review. IEEE J. Emerg. Sel. Top. Power Electron. 2019. [Google Scholar] [CrossRef] [Scilit]
- Yilmaz, A.; Bayrak, G. A real-time UWT-based intelligent fault detection method for PV-based microgrids. Electr. Power Syst. Res. 2019, 177, 105–984. [Google Scholar] [CrossRef] [Scilit]
- Ustun, T.S.; Ozansoy, C.; Zayegh, A. Differential protection of microgrids with central protection unit support. In Proceedings of the IEEE 2013 Tencon—Spring, Sydney, NSW, Australia, 17–19 April 2013; pp. 15–19. [Google Scholar]
- Farhadi, M.; Mohammed, O.A. Event-Based Protection Scheme for a Multiterminal Hybrid DC Power System. IEEE Trans. Smart Grid 2015, 6, 1658–1669. [Google Scholar] [CrossRef] [Scilit]
- Ferrero, A.; Sangiovanni, S.; Zappitelli, E. A fuzzy-set approach to fault-type identification in digital relaying. IEEE Trans. Power Deliv. 1995, 10, 169–175. [Google Scholar] [CrossRef] [Scilit]
- Das, B.; Reddy, J.V. Fuzzy-logic-based fault classification scheme for digital distance protection. IEEE Trans. Power Deliv. 2005, 20, 609–616. [Google Scholar] [CrossRef] [Scilit]
- Mittal, K.; Jain, A.; Vaisla, K.S.; Castillo, O.; Kacprzyk, J. A comprehensive review on type 2 fuzzy logic applications: Past, present and future. Eng. Appl. Artif. Intell. 2020, 95, 103916. [Google Scholar] [CrossRef] [Scilit]
- Bukhari, S.B.A.; Haider, R.; Saeed Uz Zaman, M.; Oh, Y.S.; Cho, G.J.; Kim, C.H. An interval type-2 fuzzy logic based strategy for microgrid protectio. Int. J. Electr. Power Energy Syst. 2018, 98, 209–218. [Google Scholar] [CrossRef] [Scilit]
- Behrooz, F.; Mariun, N.; Marhaban, M.; Mohd Radzi, M.A.; Ramli, A. Review of Control Techniques for HVAC Systems—Nonlinearity Approaches Based on Fuzzy Cognitive Maps. Energies 2018, 11, 495. [Google Scholar] [CrossRef] [Scilit]
- Yeap, Y.M.; Ukil, A. Fault detection in HVDC system using Short Time Fourier Transform. In Proceedings of the IEEE Power and Energy Society General Meeting (PESGM), Boston, MA, USA, 17–21 July 2016; pp. 1–5. [Google Scholar]
- Satpathi, K.; Yeap, Y.M.; Ukil, A.; Geddada, N. Short-Time Fourier Transform Based Transient Analysis of VSC Interfaced Point-to-Point DC System. IEEE Trans. Ind. Electron. 2018, 65, 4080–4091. [Google Scholar] [CrossRef] [Scilit]
- Yılmaz, A.; Bayrak, G. Real-Time Disturbance Detection Using STFT Method in Microgrids. Acad. Perspect. Procedia 2019, 2, 1115–1121. [Google Scholar] [CrossRef] [Scilit]
- Samantaray, S.R.; Samui, A.; Chitti Babu, B. S-transform based cumulative sum detector (CUSUM ) for islanding detection in Distributed Generations. In Proceedings of the Joint International Conference on Power Electronics, Drives and Energy Systems 2010 Power India, New Delhi, India, 20–23 December 2010; pp. 1–6. [Google Scholar]
- Maali Amiri, E.; Vahidi, B. Integrated protection scheme for both operation modes of microgrid using S-Transform. Int. J. Electr. Power Energy Syst. 2020, 121, 106051. [Google Scholar] [CrossRef] [Scilit]
- Huang, N.E.; Attoh-Okine, N.O. (Eds.) The Hilbert-Huang Transform in Engineering; Taylor and Francis, CRC Press: Boca Raton, FL, USA, 2005. [Google Scholar]
- Gururani, A.; Mohanty, S.R.; Mohanta, J.C. Microgrid protection using Hilbert–Huang transform based-differential scheme. IET Gener. Transm. Distrib. 2016, 10, 3707–3716. [Google Scholar] [CrossRef] [Scilit]
- Lacerda, V.A. Distance protection algorithm for multiterminal HVDC systems using the Hilbert–Huang transform. IET Gener. Transm. Distrib. 2020, 14, 3022–3032. [Google Scholar] [CrossRef] [Scilit]
- De Castro Fernandez, R.M.; Rojas, H.N.D. An overview of wavelet transforms application in power systems. In Proceedings of the 14th PSCC, Sevilla, Spain, 24–28 June 2002; Volume 1, pp. 1–8. [Google Scholar]
- Osman, A.H.; Malik, O.P. Transmission line distance protection based on wavelet transform. IEEE Trans. Power Deliv. 2004, 19, 515–523. [Google Scholar] [CrossRef] [Scilit]
- Som, S. Efficient protection scheme for low-voltage DC micro-grid. IET Gener. Transm. Distrib. 2018, 12, 3322–3329. [Google Scholar] [CrossRef] [Scilit]
- Kumar, B.P.; Ilango, G.S.; Reddy, M.J.B.; Chilakapati, N. Online Fault Detection and Diagnosis in Photovoltaic Systems Using Wavelet Packets. IEEE J. Photovolt. 2018, 8, 257–265. [Google Scholar] [CrossRef] [Scilit]
- Shen, W.C.; Chen, Y.H.; Wu, A.Y. Low-complexity sinusoidal-assisted EMD (SAEMD) algorithms for solving mode-mixing problems in HHT. Digit. Signal Process. 2014, 24, 170–186. [Google Scholar] [CrossRef] [Scilit]
- Lee, D.G.; Oh, Y.J.; Kang, S.H.; Han, B. Distance relaying algorithm using a DFT-based modified phasor estimation method. In Proceedings of the IEEE Bucharest PowerTech, Bucharest, Romania, 28 June–2 July 2009; pp. 1–6. [Google Scholar] [CrossRef] [Scilit]
- Verma, A.; Yadav, A. ANN based fault detection and direction estimation scheme for series compensated transmission lines. In Proceedings of the IEEE International Conference on Electrical, Computer and Communication Technologies (ICECCT), Coimbatore, India, 5–7 March 2015; pp. 1–6. [Google Scholar]
- Recioui, A.; Benseghier, B.; Khalfallah, H. Power system fault detection, classification and location using the K-Nearest Neighbors. In Proceedings of the 4th International Conference on Electrical Engineering (ICEE), Boumerdes, Algeria, 13–15 December 2015; pp. 1–6. [Google Scholar]
- Sedighi, A.; Haghifam, M.; Malik, O.P.; Ghassemian, M. High impedance fault detection based on wavelet transform and statistical pattern recognition. IEEE Trans. Power Deliv. 2005, 20, 2414–2421. [Google Scholar] [CrossRef] [Scilit]
- Manohar, M.; Koley, E.; Ghosh, S. A reliable fault detection and classification scheme based on wavelet transform and ensemble of SVM for microgrid protection. In Proceedings of the 3rd International Conference on Applied and Theoretical Computing and Communication Technology (iCATccT), Tumkur, India, 21–23 December 2017; pp. 24–28. [Google Scholar]
- Mishra, D.P.; Samantaray, S.R.; Joos, G. A Combined Wavelet and Data-Mining Based Intelligent Protection Scheme for Microgrid. IEEE Trans. Smart Grid 2016, 7, 2295–2304. [Google Scholar] [CrossRef] [Scilit]
- Ozgonenel, O.; Karagol, S. A novel transformer protection method based on Hilbert Huang Transform and artificial neural network. In Proceedings of the 8th International Conference on Electrical and Electronics Engineering (ELECO), Bursa, Turkey, 28–30 November 2013; pp. 225–228. [Google Scholar]
- Shafiullah, M.; Abido, M.A. S-Transform Based FFNN Approach for Distribution Grids Fault Detection and Classification. IEEE Access 2018, 6, 8080–8088. [Google Scholar] [CrossRef] [Scilit]
- Ranjbar, S.; Farsa, A.R.; Jamali, S. Voltage-based protection of microgrids using decision tree algorithms. Int. Trans. Electr. Energy Syst. 2020, 30, e12274. [Google Scholar] [CrossRef] [Scilit]
- Maqsood, A.; Oslebo, D.; Corzine, K.; Parsa, L.; Ma, Y. STFT Cluster Analysis for DC Pulsed Load Monitoring and Fault Detection on Naval Shipboard Power Systems. IEEE Trans. Transp. Electrif. 2020, 6, 821–831. [Google Scholar] [CrossRef] [Scilit]
- Harris, F.J. On the use of windows for harmonic analysis with the discrete Fourier transform. Proc. IEEE 1978, 66, 51–83. [Google Scholar] [CrossRef] [Scilit]
- Bishop, C.M. Pattern Recognition and Machine Learning; Springer: Berlin/Heidelberg, Germany, 2006. [Google Scholar]



Publisher’s Note: MDPI stays neutral with regard to jurisdictional claims in published maps and institutional affiliations. |
© 2021 by the authors. Licensee MDPI, Basel, Switzerland. This article is an open access article distributed under the terms and conditions of the Creative Commons Attribution (CC BY) license (http://creativecommons.org/licenses/by/4.0/).