Article

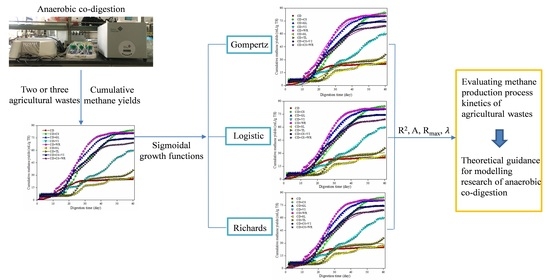
Modeling the Methane Production Kinetics of Anaerobic Co-Digestion of Agricultural Wastes Using Sigmoidal Functions

Research Center for Engineering Ecology and Nonlinear Science, North China Electric Power University, Beijing 102206, China
*
Author to whom correspondence should be addressed.
Energies 2021, 14(2), 258; https://doi.org/10.3390/en14020258
Submission received: 9 December 2020 / Revised: 29 December 2020 / Accepted: 1 January 2021 / Published: 6 January 2021
(This article belongs to the Section A4: Bio-Energy)

Abstract

:
The modified sigmoidal bacteria growth functions (the modified Gompertz, logistic, and Richards) were used to evaluate the methane production process kinetics of agricultural wastes. The mesophilic anaerobic co-digestion experiments were conducted with various agricultural wastes as feedstocks, including cow manure, corn straw, grape leaves, vines, wine residue, strawberry leaves, and tomato leaves. The results showed that anaerobic co-digestion of cow manure and other agricultural wastes increased the methane yields while it prolonged the lag phase time. Compared with the modified Gompertz and logistic models, the modified Richards model obtained higher correlation coefficients and was able to fit experimental data better. The results of this study were expected to determine a suitable model to simulate and study the kinetic process of anaerobic co-digestion with mixed agricultural wastes as feedstocks.

Graphical Abstract

1. Introduction

Anaerobic co-digestion of agricultural wastes turns waste into treasure, which not only reduces the pollution of waste to the environment, but also produces economic benefits [1]. Anaerobic co-digestion has attracted many researchers’ attention due to its advantages, such as better nutrient balance, higher biogas yield, and higher residual fertilizer value compared with traditional methods of agricultural waste treatment (incineration, landfill, composting, etc.) [2,3,4,5]. Most of the previous studies on anaerobic co-digestion of agricultural wastes focused on a direct analysis of experimental data [6,7,8], instead of modeling the methane production kinetics. In order to understand the impacts of agriculture waste types on anaerobic co-digestion, studying the methane production kinetics of anaerobic co-digestion with different feedstocks is necessary [9].
A bacterial growth curve is used to describe the change in the population of viable bacteria with time (t), and the growth curve represents a growth process with a lag phase just after t = 0 followed by an exponential phase and then by a saturation phase [10]. The cumulative methane yields curves in the early stage (slow methane production), the middle stage (fast methane production, i.e., the peak period), and the later stage (slow methane production and stabilization) of anaerobic co-digestion correspond to the lag, exponential, and saturation phases of the growth curve, respectively, showing a sigmoidal curve [11,12].
Many sigmoidal models were established, such as the Gompertz model, the logistic model, the Richards model, the Stannard model, and the Schnute model [13,14,15,16,17,18]. Among these models, the modified equation of the Stannard model is the same as that of the modified Richards equation. Replacement of a and b (mathematical parameters used in the Schnute equation without biological meanings) in the Schnute equation would result in the modified Richards model [10]. Previous studies showed that the modified Gompertz equation is a common model for methane production by simple organic substrate degradation. Basak et al. used the modified Gompertz model and logistic model to study the process kinetics of biohydrogen production via dark digestion of fruit-vegetable waste and cottage cheese whey by pretreated anaerobic sludge inocula and to define the kinetic parameters, which helped in the upscaling of H2 production processes [19]. Bakhov et al. used the Gompertz model to study the dynamics of methane production from co-digestion of liquid manure from cattle with the addition of winemaking waste, food waste, and biowaste [20]. Boni et al. used modified Gompertz equation to study the process production from organic waste [21]. However, there is still a lack of research on methane production by mixed agricultural wastes.
In this study, the modified Gompertz, logistic, and Richards models were used to study the kinetic process of anaerobic co-digestion with different agricultural wastes as feedstocks. The correlation coefficients (R2) obtained from the three models were compared. In addition, the maximum cumulative methane yields (A), maximum methane production rate (Rmax), and the lag phase time (λ) were analyzed. The main purpose was to evaluate the various parameters (R2, A, Rmax, and λ) of the three models and to determine whether the models are sufficient to evaluate the methane production kinetics of anaerobic co-digestion process.

2. Materials and Methods

2.1. Agricultural Wastes Substrates Characterization

Feedstocks used for anaerobic digestion included cow dung (CD), corn straw (CS), grape leaves (GL), vines (VI), wine residue (WR), strawberry leaves (SL), and tomato leaves (TL). All feedstocks were collected from Xuanhua District, Zhangjiakou City, Hebei Province, China in September 2018. The cow dung (CD) was stored at 4.0 °C. After drying, the corn straws (CS), grape leaves (GL), vines (VI), wine residue (WR), strawberry leaves (SL), and tomato leaves (TL) were ground into powder and passed through a 40-mesh sieve. The properties of feedstocks are shown in Table 1.
The total solid (TS), volatile solid (VS), soluble sugar, protein, starch, lipid, cellulose, hemicellulose, and lignin were measured using methods previously reported [22]. Total organic carbon (TOC) was measured using the potassium dichromate volumetric method [23]. Total nitrogen (TN) was measured using the indophenol blue colorimetric method after being digested by concentrated sulfuric acid and 30% hydrogen peroxide [24]. Total phosphorus (TP) was measured using a method previously reported [25].
There were nine groups of anaerobic digestion experiments with different agricultural wastes as feedstocks, namely, CD, CD + CS, CD + GL, CD + VI, CD + WR, CD + SL, CD + TL, CD + CS + VI, and CD + CS + WR groups. The compositions and dry weights of wastes used in the nine groups are shown in Table 2. Among the nine groups, the CD group (with cow dung only) was set as the control group. In addition to the control group, anaerobic co-digestion experiments of two feedstocks were carried out at first. The C/N ratios of CD + CS, CD + VI, CD + SL, and CD + TL groups were 20.61:1, 28.16:1, 20.76:1, and 25.25:1, respectively, which are located in the suitable range of C/N ratio (20–30:1) [26]. In order to keep the same amount of cow dung, the mixture ratio of other groups with two feedstocks (CD + GL and CD + WR) were also set as 2:1. The results for anaerobic co-digestion of both feedstocks showed that the highest A value was obtained in the CD + CS group, followed by the CD + WR group. The combination of CD + CS + WR was then chosen for anaerobic co-digestion to study whether three feedstocks were able to obtain higher biogas yields than the two-feedstock groups. On the other hand, the CD + CS + VI group was chosen to study whether the biogas production can be enhanced and the daily biogas peak can be brought forward compared to the CD + VI group. The C/N ratio of the CD + CS + VI group was 24.38:1, which was suitable for anaerobic digestion.

2.2. Experimental Conditions

Before experiments, the feedstocks were mixed according to the dry weights shown in Table 2. The experiments were performed in an Automatic Methane Potential Test System (AMPTS II, Bioprocess Control AB, Lund, Sweden). The TS value of the substrate in the reactor was adjusted to 8% by adding distilled water. Mesophilic (35.0 ± 1.0 °C) experiments were conducted for 60 days in 500 mL fermentation tanks with a working volume of 300 mL. Carbon dioxide was absorbed through carbon dioxide fixation devices, and methane was measured using gas volume measurement devices. Three parallel samples were set for each digestion group. Before analysis, the data of the three parallel samples were averaged and used as the final methane yields. All the methane yields were converted into standard conditions.

2.3. Models Description

Assuming that methane production is a function of bacterial growth, i.e., methane production is a composite function, the mathematical parameters in the original function were improved into biological parameters [10], and the modified Gompertz equation [18] can be given by
y = A × exp{−exp[Rmax × e × (λ − t)/A + 1]},
where y represents the cumulative methane yields (mL/g∙TS) with respect to time t (d), A is the maximum cumulative methane yields (mL/g∙TS), Rmax is the maximum methane production rate (mL/g∙TS/d), λ is the lag phase time (d), and e is a constant equal to 2.71.
The logistic model [12] is given by
y = A/{1 + exp[4 × Rmax × (λ − t)/A + 2]},
where A, Rmax, and λ have the same meaning as above.
The modified Richards model [10] with the fourth parameter v is given by
y = A × {1 + v × exp(1 + v) × exp[Rmax × (1 + v) × (1 + 1/v) × (λ − t)/A]}(−1/v),
where A, Rmax, and λ have the same meaning as above, v is the shape coefficient.

2.4. Data Analysis

Nonlinear regression analysis (modified Gompertz, logistic, and Richards) was performed using Origin 9.0 software. The program searched for A, Rmax, and λ values with the minimum residual sum of squares and their 95% confidence intervals. The curve of methane cumulative yields and R2 value were obtained during the fitting. R2 reflected the degree of correlation between variables, and the t-test and F-test were used to conduct statistical tests on the fitting results obtained from different models. According to the analysis of variance (ANOVA) result of the fitting statement, p < 0.05 indicated a significant fitting effect.

3. Results

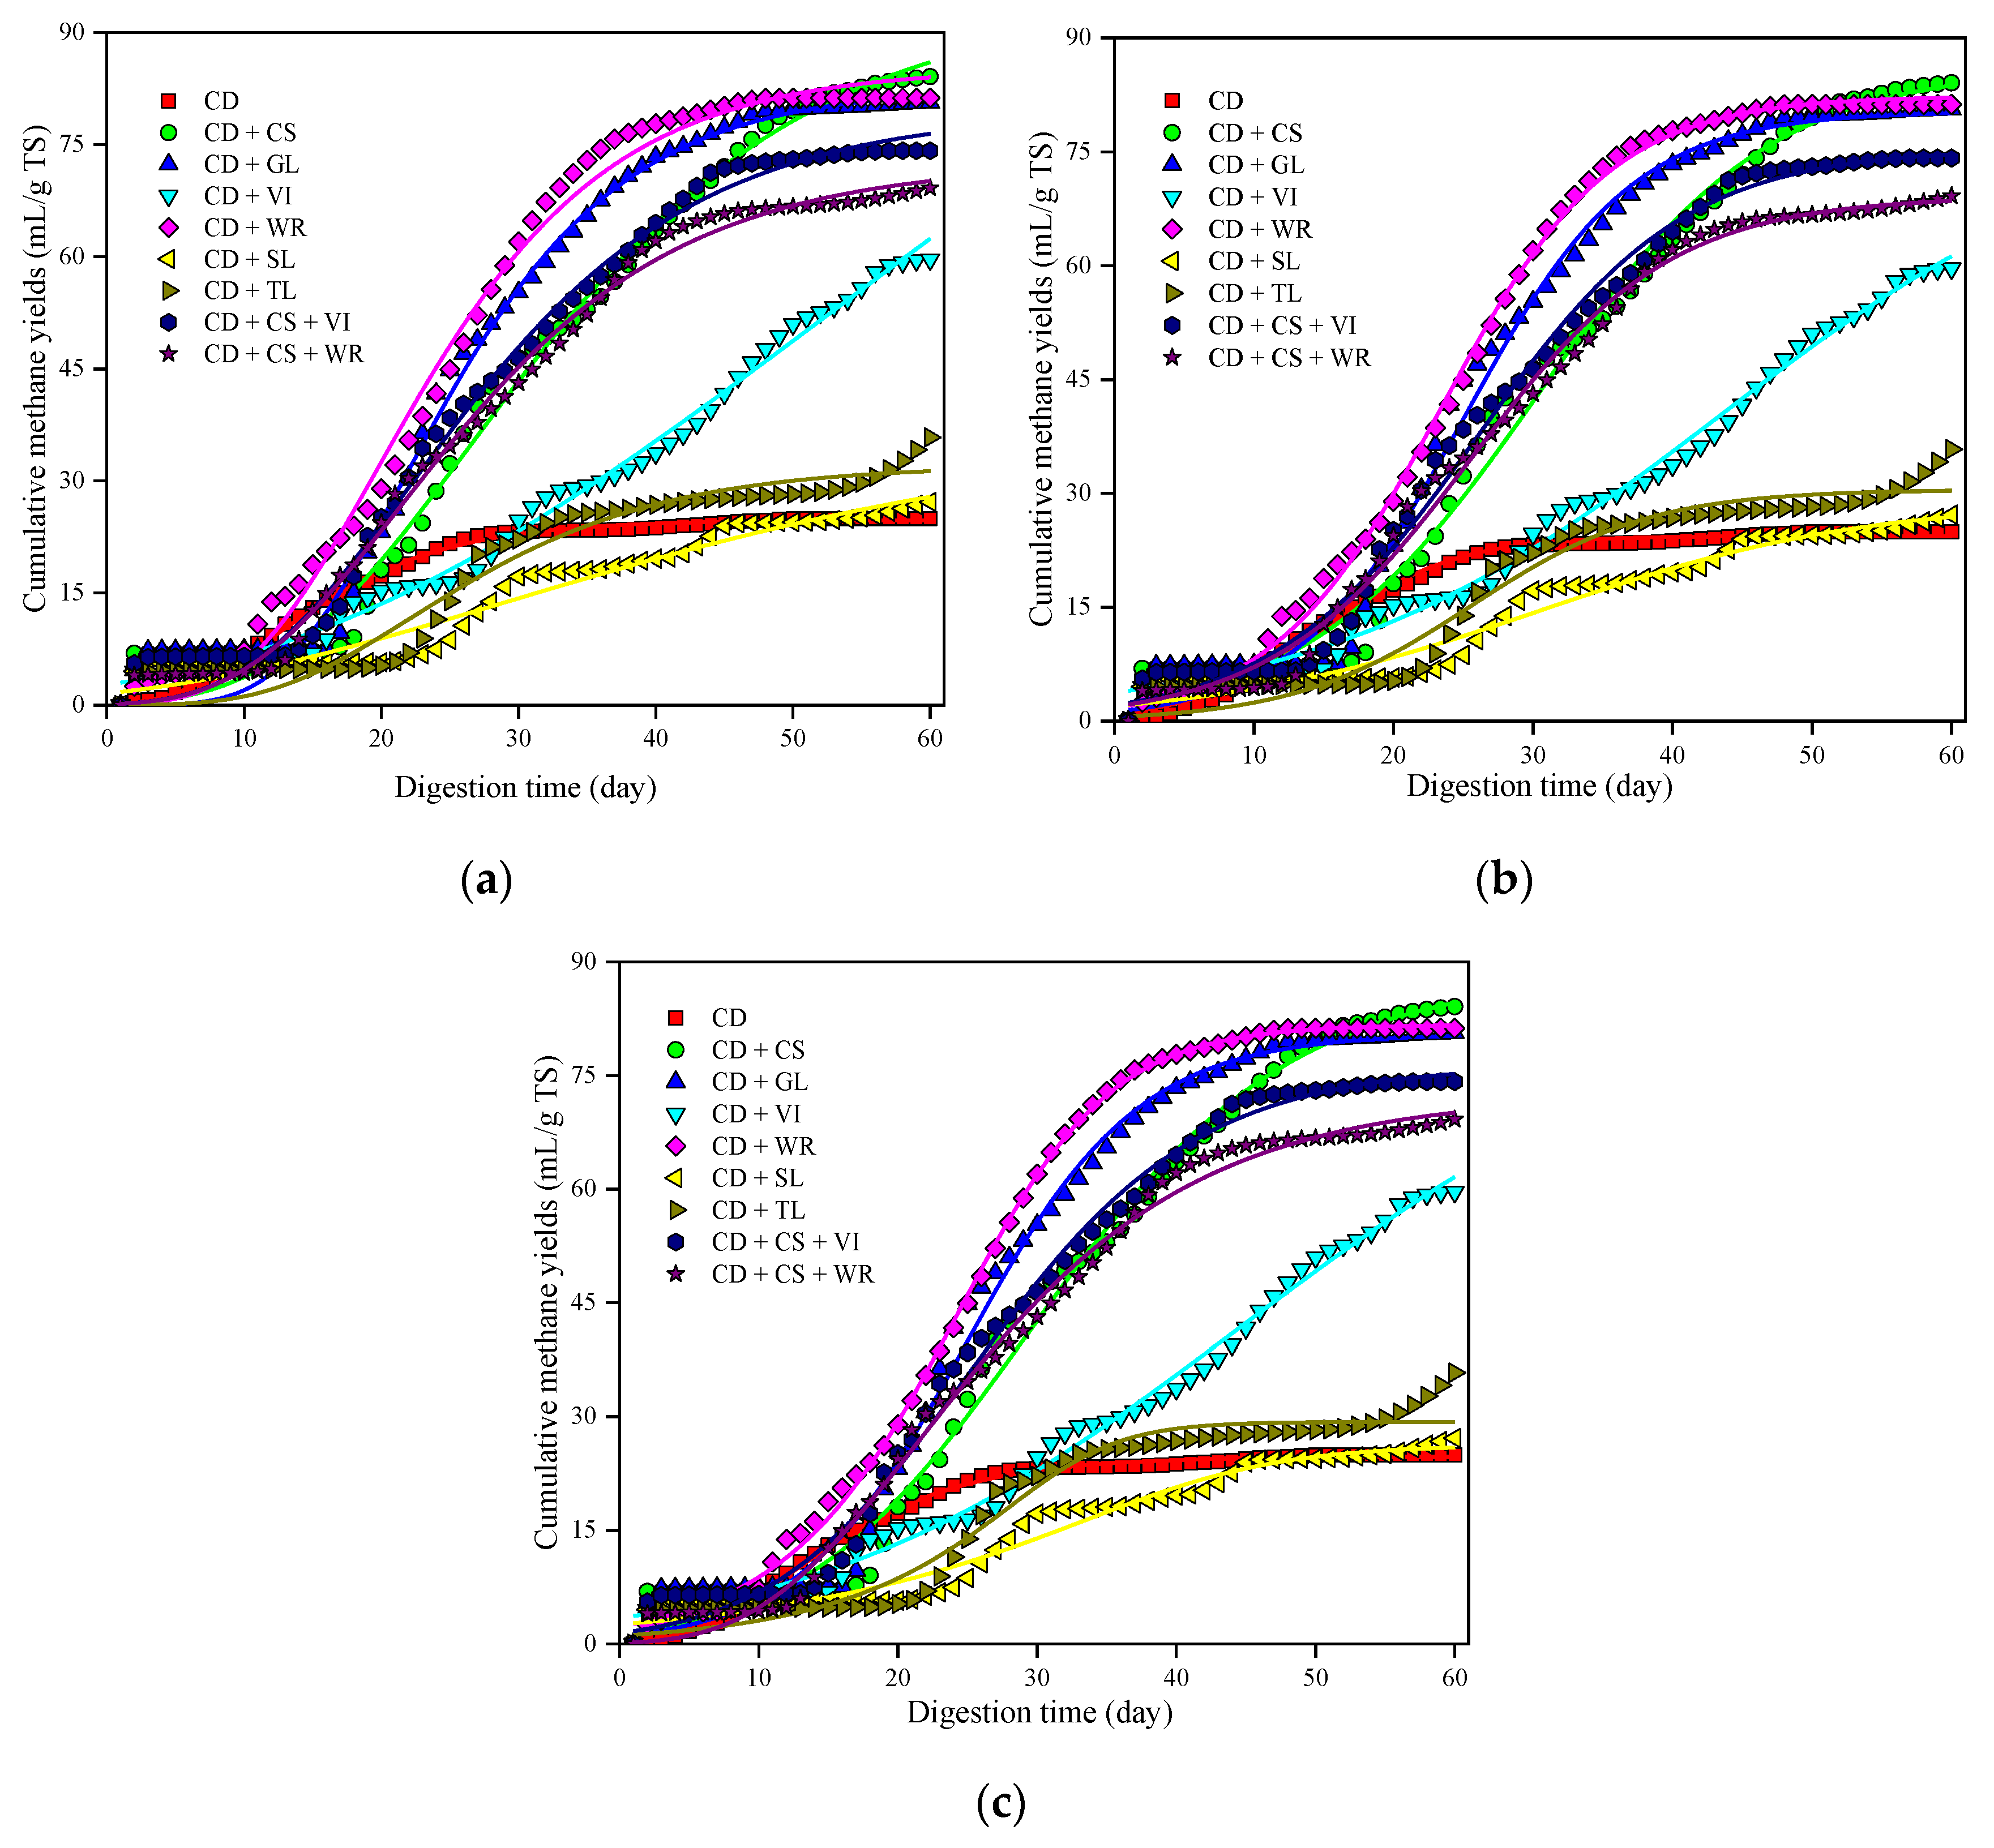
3.1. Methane Yields of Anaerobic Digestion with Different Feedstocks

Figure 1a shows the variation in daily methane yields of anaerobic co-digestion with different feedstocks over time. The daily methane yields in all experimental groups were higher than the control group on the first day of digestion. The control group reached the peak period on the fifth day, while the co-digestion groups attained their peak after the 10th day. From the 26th to 43rd day of the experiment, the daily methane yields in all the experimental groups were generally higher than that in the control group. It was found that anaerobic co-digestion was beneficial to subsequent methane production. Meanwhile, the maximum daily methane yields of experimental groups were also higher than that of the control group. The highest maximum daily methane yield was obtained in the CD + CS group, which was 2.36 times higher than that of the control group.
As can be seen from Figure 1b, the variations of cumulative methane yield over time presented a “stable–rising–stable” trend, showing sigmoidal curves, except for the CD + SL group, CD + TL group, and CD + VI group. The curves of cumulative methane yields of CD + SL and CD + TL groups included multiple “stable–rising” stages. The curve of the CD + VI group presented a phased upward trend. The cumulative methane yields of CD + CS group were highest, followed by the CD + WR and CD + GL groups, which were 2.37, 2.25, and 2.23 times higher than that of the control group, respectively. The cumulative methane yield of the control group was lowest. According to the daily and cumulative methane yields, it was found that anaerobic co-digestion increased the cumulative methane yields by increasing the maximum daily methane yields and expanding the period with high yields.

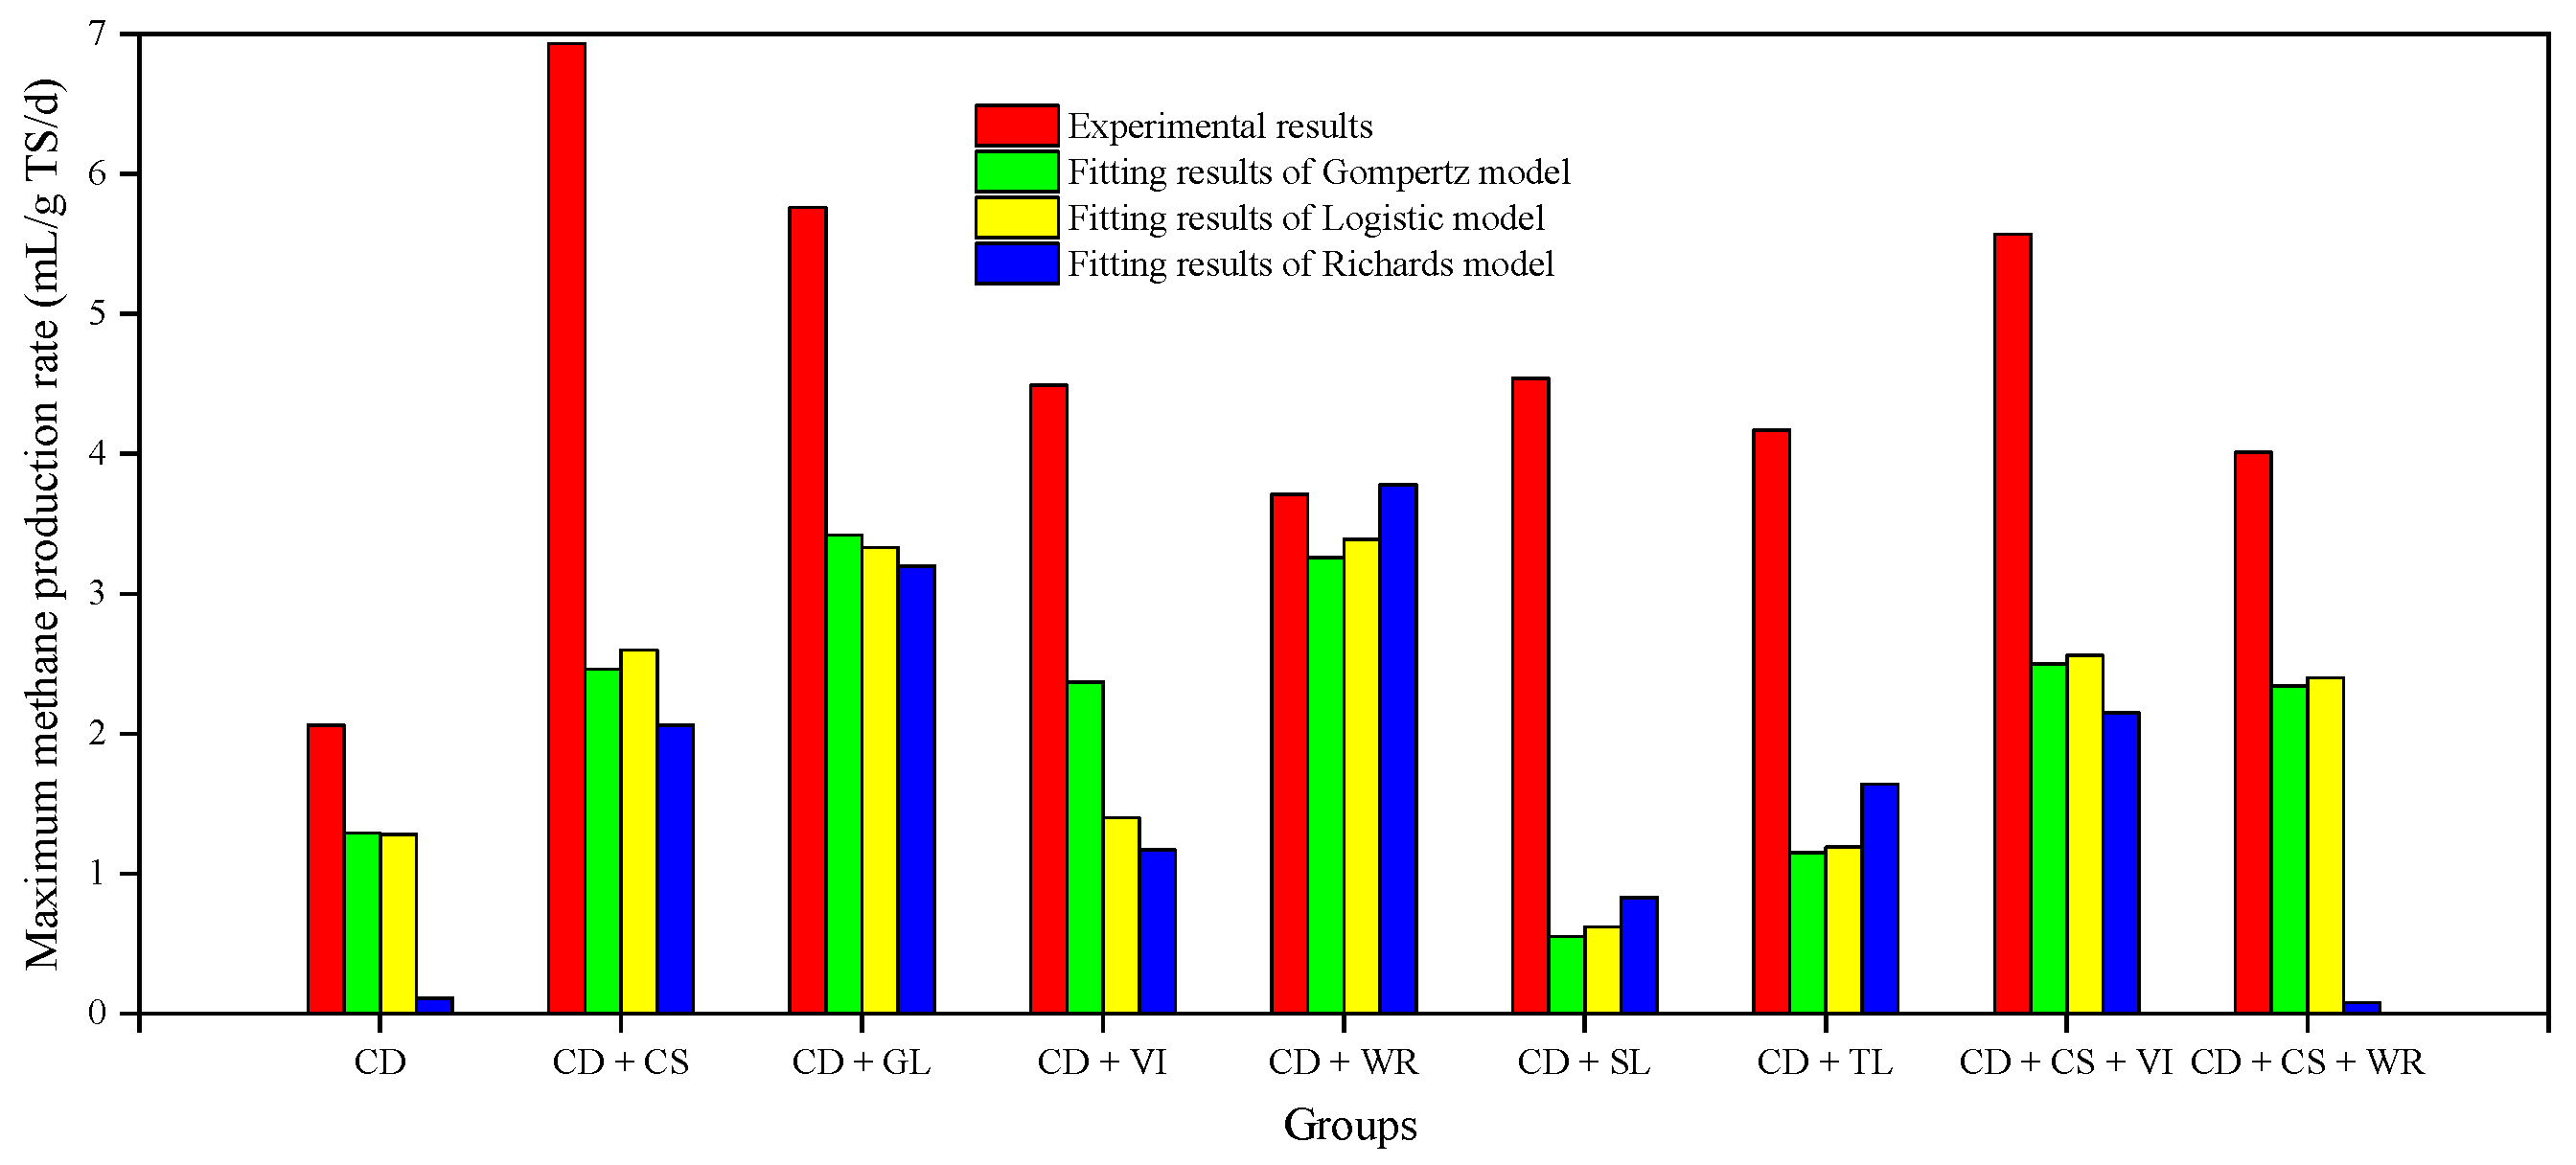
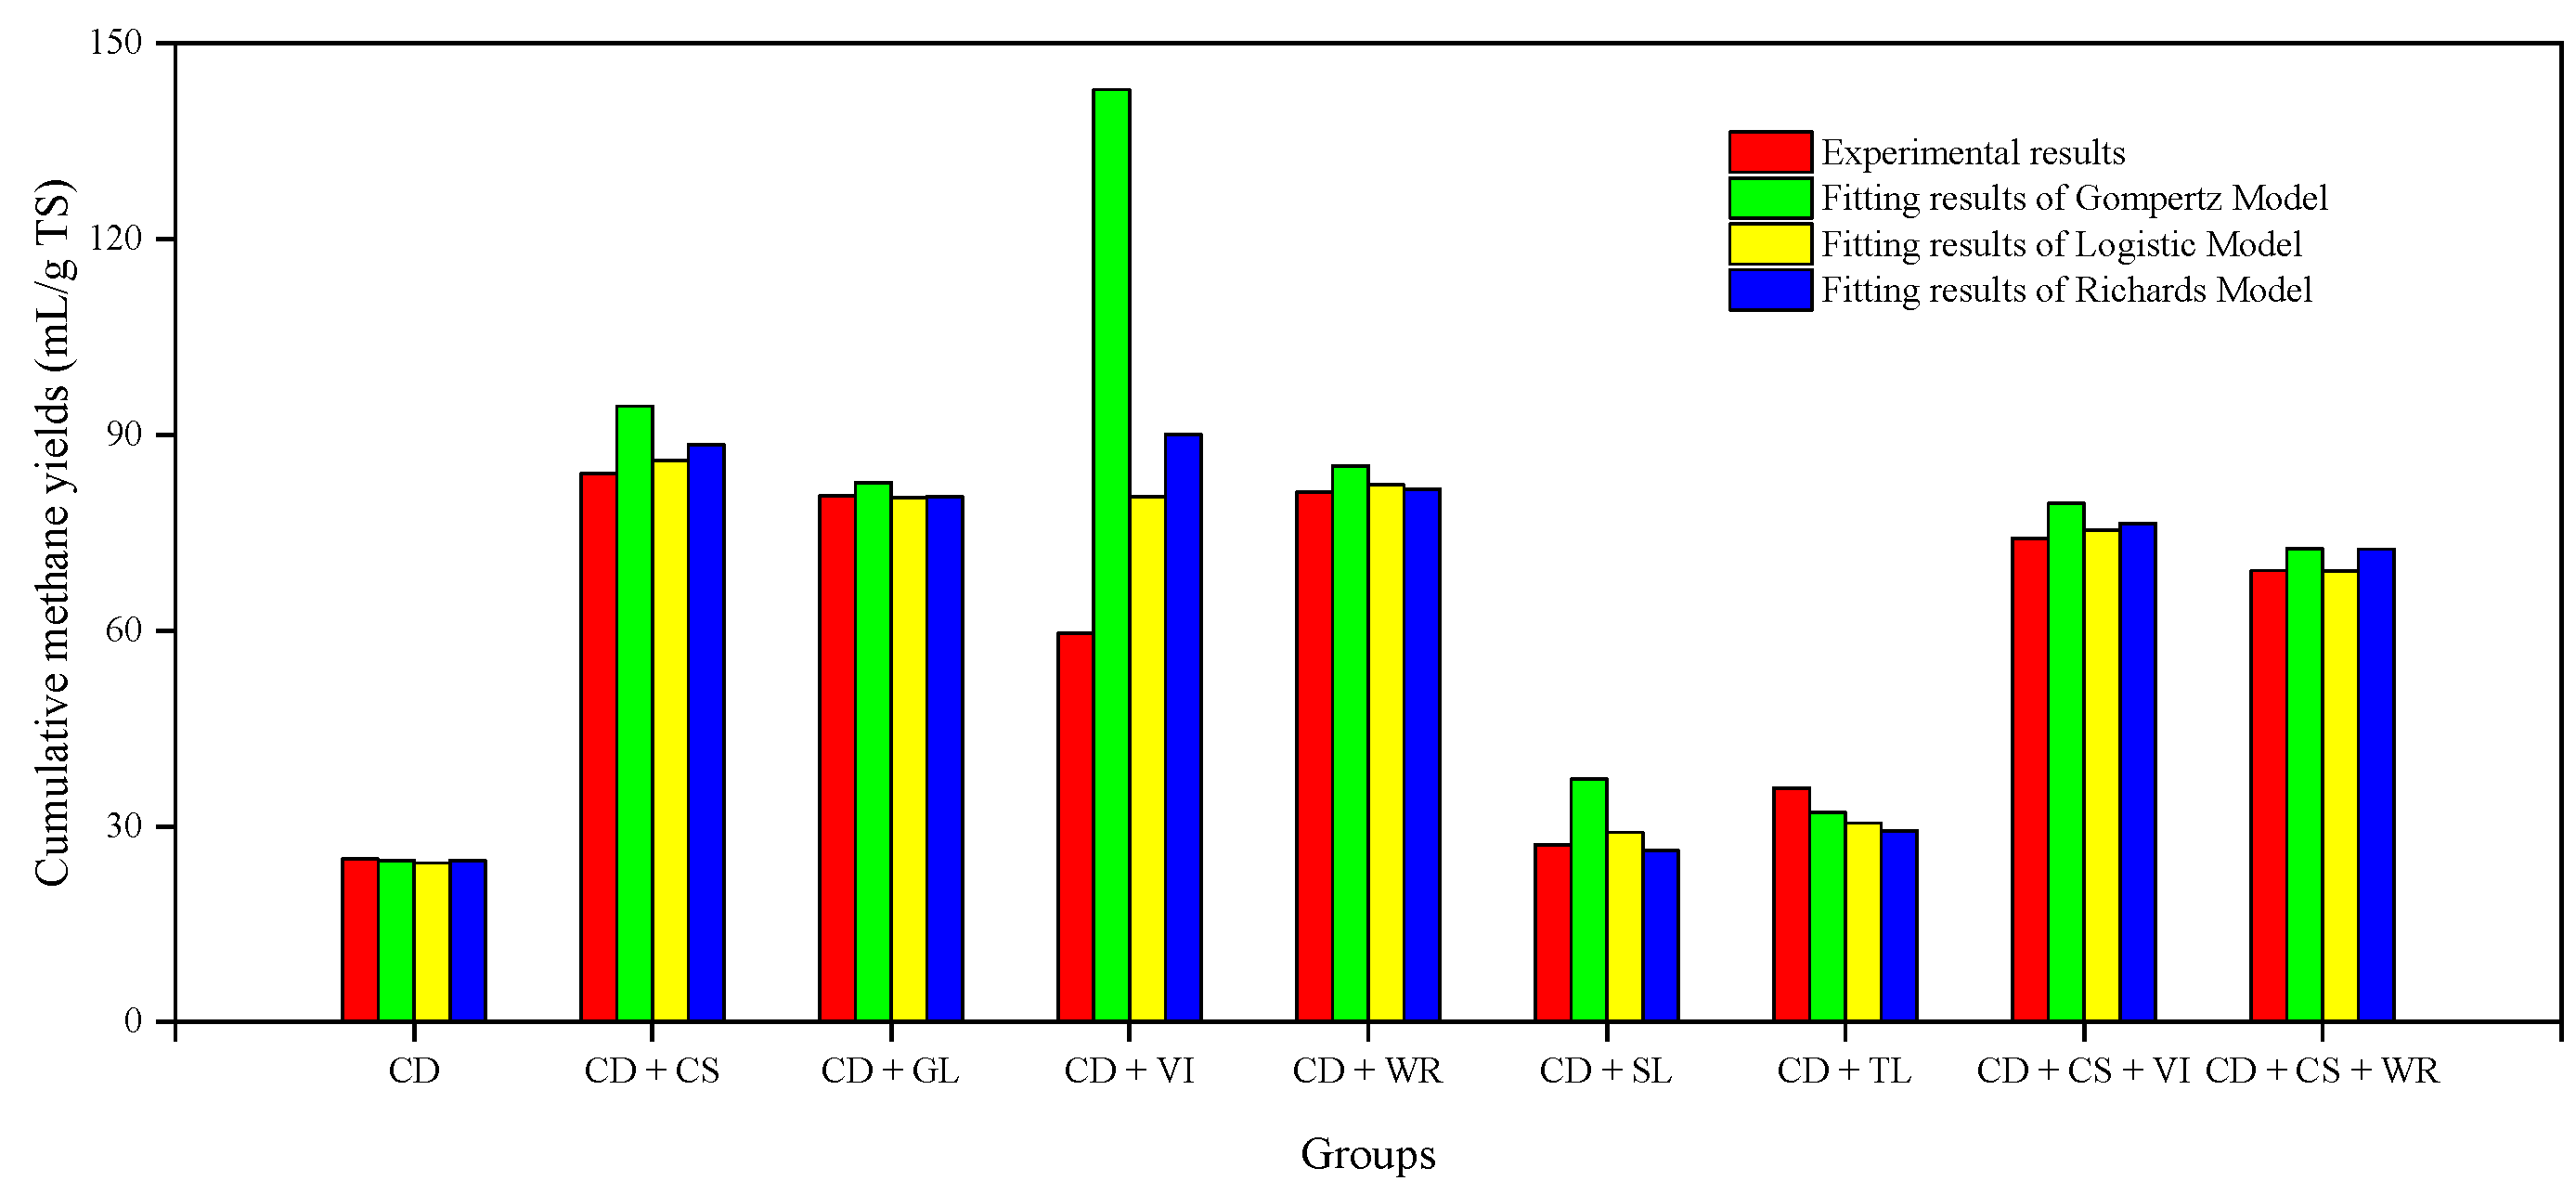
3.2. Modeling Methane Production Kinetics Using Modified Gompertz Model

The cumulative methane yields obtained from the anaerobic co-digestion experiments were fitted using the modified Gompertz, logistic, and Richards models (Figure 2). The comparison between fitting results obtained from the modified Gompertz model and experimental results is shown in Figure 2a. As can be seen from the data in Table 3, the R2 values were all greater than 0.9, which showed the good fitting results of the modified Gompertz model in expressing the accumulative process of methane yields. The highest R2 values were obtained in the CD group. The R2 value of the CD + TL group was the lowest.
As shown in Table 3, for the CD group and CD + TL group, the A values of fitting results were lower than those of experimental results. For other groups, the fitted A values were higher than those obtained from experiments. The A values with high experimental results obtained high fitting results, except for the CD + VI group. The results showed that A value obtained from the model of the CD + VI group was quite different from the experimental result. This indicated that the cumulative methane yield curve of the CD + VI group was not a sigmoidal curve, and the cumulative methane yield of this group did not conform to the three-stage hypothesis of the modified Gompertz function.
The Rmax values of the experimental results were higher than those of the fitting results in all groups (Table 3). The highest and lowest fitting Rmax values were obtained in the CD + GL group and CD + SL group, respectively. However, the highest and lowest experimental Rmax values were obtained in the CD + CS group and CD group, respectively. Therefore, the fitting results were not in line with the experimental results.
The lag phase times (λ) of experimental groups were 99.6–189% longer than those of the control group with the exception of the fitting result obtained in the CD + SL group. The λ values of fitting results in these groups were more than 10 days. In a mathematical sense, λ represents the point at which it intersects the x-axis. Biologically speaking, λ is the time of the slow methane production stage. Therefore, the fitting results were consistent with the experimental results. The modified Gompertz model did not provide a very accurate fit to the experimental data of the CD + SL group, even though the R2 value was 0.9503. The lag phase time (λ) of this group was 3.86 days (Table 3), which was 23.1% shorter than that of the control group. The daily methane yields of the CD + SL group were low from the third to the 10th day of the experiment (Figure 1a). Therefore, the reasonable λ value of the CD + SL group was more than 10 days. The inadequate fit of the modified Gompertz equation was understood for the particular features of the original growth function and the curve of this group was not sigmoidal. As the point of inflection was fixed for the modified Gompertz function, the remainder of the curve was modeled in accordance with the location point, as well as the asymmetry for the Gompertz [12].

3.3. Modeling Methane Production Kinetics Using Modified Logistic Model

The cumulative methane yields of anaerobic co-digestion fitted by the modified logistic equation and experimental results are shown in Figure 2b. As can be seen from the data in Table 4, R2 values obtained from modified logistic model were higher than 0.9, indicating the good fit of the logistic model in expressing the accumulation process of methane yields. R2 values fitted by the modified logistic model were higher than those fitted by the modified Gompertz model, except for the CD group and CD + CS + WR group.
For the CD + CS group, both the fitting result and the experimental result of the A value were highest (Table 4), which was inconsistent with the modified Gompertz model. As can be seen from the data in Table 3 and Table 4, the A values obtained from the modified logistic model were lower than those obtained from the modified Gompertz model. The A values obtained from the modified logistic model was closer to the A values of the experiment compared to the modified Gompertz model, with the exception of the CD group and CD + TL group.
The Rmax values of the experimental results were higher than those of the fitting results (Table 3). However, the highest or lowest fitting Rmax values and experimental Rmax values were not obtained in the same group. The reason was that the Rmax values of experimental results were determined by calculating the value of maximum methane production rates. The program estimated the Rmax values by searching for the steepest ascent of the curve [10], i.e., the Rmax values were determined from the slope of the line during exponential gas production incorporating multiple data points [12]. Therefore, the fitting Rmax values were not completely consistent with the experimental Rmax values.
The λ values of experimental groups obtained from the logistic model were higher than those of the control group (Table 4). The λ values of experimental groups fitted by the modified logistic model were higher than those fitted by the modified Gompertz model. The differences in results between these two models were interpreted as being due to the different Rmax values estimated by the program, leading to different λ values, as the λ values were determined by intersecting the tangent to the point of inflection with the x-axis [10,27].

3.4. Modeling Methane Production Kinetics Using Modified Richards Model

The modified Richards equation was used to simulate the cumulative methane yields, and the results are shown in Figure 2c. The average R2 values obtained from the modified Richards model were higher than those obtained from the modified Gompertz and logistic models. The results showed that, compared with the modified Gompertz and logistic models, better fitting results were obtained in the modified Richards model.
The highest A values of experimental results did not correspond to the highest A values of fitting results (Table 5). For the relationship between A values of fitting results and experimental results, the conclusion of the modified Richards model was consistent with that of the modified Gompertz model. The results suggested that, compared with the modified Gompertz and Richards models, the fitting result of the CD + VI group obtained from the modified logistic model was closer to the experimental result.
The Rmax values of experimental results were higher than those of fitting results, with the exception of the CD + WR group. The fitting Rmax value of the CD + WR group was highest. The fitting A value of the CD + VI group was highest. The Rmax values did not correspond to the A values, which were consistent with results of the modified Gompertz and logistic models. It was understood that Rmax values represent the maximum daily methane yields when the curves were the standard sigmoidal curves. Some of the curves in this study were not standard sigmoidal curves, such as the curves of the CD + VI group, CD + SL group, and CD + TL group.
The λ values of experimental groups fitted by the modified Richards model were higher than those of the control group, which was consistent with the results obtained from the modified logistic model. The results showed that anaerobic co-fermentation with different agricultural wastes prolonged the start-up period of fermentation. For the λ value of the CD + SL group, the modified Gompertz and logistic models failed to accurately represent the experimental data, and the modified Richards model provided a relatively good fit to the experimental data. The reason was that the curve of this group was not sigmoidal, and different models (the points of inflection were fixed for the modified Gompertz and logistic model, while the point of inflection was flexible for the modified Richards model) provided different results when estimated by the algorithm [12]. Therefore, compared with the modified Gompertz and logistic models, the modified Richards model obtained a more accurate result in the CD + SL group, which indicated that the Richards model was more adaptable.

4. Discussion

According to the results shown in Figure 1, it was found that anaerobic co-digestion obtained higher maximum daily and cumulative methane yields than the group with cow dung only. On one hand, the C/N ratios in most groups were suitable for anaerobic digestion compared with the control group. On the other hand, anaerobic co-digestion balanced the nutrients better and was beneficial to the methane production. The anaerobic co-digestion reached its peak period later. It was speculated that the complexity of mixed substrates affected the start-up time of anaerobic co-digestion.
As shown in Table 3, Table 4 and Table 5, the highest R2 value was obtained from the modified Gompertz model in the control group, which was consistent with previous studies [10,28,29]. The R2 values obtained from the modified Richards model were higher than 0.99, with the exception of the CD + SL group and CD + TL group. It was speculated that the CD + SL group and CD + TL group basically did not complete methane production. The basic completion of anaerobic digestion is based on the fact that the daily methane yields are less than 1% of the cumulative methane yields [29]. The average daily methane yields of the CD + SL group and CD + TL group were 0.42 mL/g∙TS and 1.67 mL/g∙TS, while the maximum daily methane yields of these two groups were 27.19 mL/g∙TS and 35.83 mL/g∙TS, which were 1.57% and 4.67% of the maximum daily methane yields, respectively. Therefore, anaerobic digestion of the CD + SL group and CD + TL group was not completed. Therefore, the curves of these two groups did not show complete sigmoidal curves, resulting in lower R2 values than other groups.
The average R2 values of the modified Richards model were higher than those of the modified Gompertz and logistic models. The correlation coefficient (R2) is a statistical index used to reflect the degree of correlation between variables. In order to verify the significance of these three models in the anaerobic co-digestion with agricultural wastes as feedstocks, a t-test and F-test were conducted. Statistical analysis of the fitting report showed that the parameters in the modified Gompertz, logistic, and Richards models were suitable for estimating the experimental results, except for the Rmax and v values of the CD group and CD + CS + WR group and the v value of the CD + VI group obtained from the modified Richards model. At the 0.05 level, the fitting function was significantly better than the function of experimental data.
Although the R2 values of the three models were relatively high and the fitting curves (Figure 2) of the three models were consistent with the experimental results on a whole, the fitting results of A values and Rmax values of the three models were different. Figure 3 shows the difference among the A values fitted by the three models and the experimental results. The results suggested that, when the A values of experimental results were high, the A values of fitting results were also high with the exception of the CD + VI group. For the CD + VI group, the A values obtained from the three models were higher than the A values of the experiment results. This is understandable because the curves of the CD + VI group fitted by the three models were not sigmoidal. The fitted curves showed an upward trend, i.e., the fitted A values appeared after the 60th day, which were higher than the experimental A values.
The fitting results of the three models showed that there was no clear relationship between the A values and the R2 values (Table 3, Table 4 and Table 5 and Figure 3), which was consistent with previous research [11]. The high R2 values indicated that the degree of correlation between variables was high. The A values were related to the type of feedstock, proportion of different feedstocks, and conditions of anaerobic fermentation. Therefore, the conclusion agreed with practice.
The results of ANOVA showed that there was no significant difference for A values between the fitting values obtained from the three models and the experimental values with the exception of the CD + VI group (Figure 3). The multiple daily methane yield peaks in the CD + VI group (Figure 1a), which might be caused by the different properties of VI, resulted in the inaccuracy of fitting. Therefore, the modified Gompertz, logistic, and Richards models were all able to represent the experimental A values in most of the groups except for the CD + VI group. The A values of the CD + VI group fitted by the logistic and Richards models were closer to the A values of the experimental results than the Gompertz model. Therefore, the A values of the CD + VI group obtained from the modified logistic and Richards models were more representative of the experimental A values than those obtained from the modified Gompertz model.
Figure 4 shows the differences between the experimental values and the fitting values of Rmax. The results showed that the fitted Rmax values of the three models were lower than the experimental Rmax values except for the CD + WR group. Lower fitted Rmax values than the experimental Rmax values were also reported in previous anaerobic co-digestion studies [12,30]. The average Rmax values fitted by the modified logistic and Richards models were closer the experimental Rmax values than those fitted by the modified Gompertz model. Therefore, for the sake of Rmax, the modified logistic and Richards models represented the experimental results better than the modified Gompertz models.
The modified Gompertz, logistic, and Richards models showed similar results for the λ values with the exception of the CD + SL group, i.e., the λ values of the experimental groups were higher than those of the control group. The study by Ware et al. suggested that low λ values demonstrated the simple nature and high biodegradability of the feedstocks [12]. Because the anaerobic co-digestion experiment of agricultural wastes contained a higher content of lignocellulose than the experiment of the control group (with cow manure only), the hydrolysis rate was limited [31,32]. Thus, the digestion times were affected. The results showed that, although the cumulative methane yields were increased by anaerobic co-digestion, the start-up period was extended. For the CD + SL group, compared with the results obtained from the modified Gompertz and logistic models, λ values fitted by the modified Richards model better represented experimental results (Table 3, Table 4 and Table 5). It was speculated that the modified Richards model is a four-parameter model, and the fourth parameter v was introduced to make the shape of the curve flexible. The fitting result of the four-parameter model was more reasonable than that of the three-parameter models (modified Gompertz and logistic models). Moreover, comparing the results of R2, A, Rmax, and λ, it was found that all the parameters should be taken into account when evaluating the accuracy of models.
In general, the fitting results of the modified Gompertz model were better in expressing the methane production process of the control group. The modified logistic model was able to replicate the data of experimental groups. The modified Richards model performed better than the other two models in fitting the experimental results of anaerobic co-digestion with different feedstocks. The results of this study were consistent with a previous study [12]. The three-parameter sigmoidal model was insufficient in accurately describing methane yields from complex feedstocks. Due to the nature of biological models, there is no one-size-fits all dynamic model to fit the cumulative methane yields with different feedstocks. In order to determine the most suitable model, three-parameter and four-parameter models should be applied simultaneously [10,33].

5. Conclusions

This study showed that, compared with the anaerobic digestion of cow dung only, the anaerobic co-digestion of agricultural wastes (two or three feedstocks) increased the cumulative methane yields, while prolonged the lag phase time. According to the R2 values and the differences between the experimental and fitting values, the better fitting results of the experimental groups were obtained from the modified Richards model compared with those obtained from the modified Gompertz and logistic models. In order to determine the most suitable model, three-parameter and four-parameter models should be applied simultaneously.

Author Contributions

Conceptualization, H.Z. and Y.T.; methodology, Y.T., D.A. and Y.C.; software, D.A.; validation, H.Z., Y.T., D.A., Y.C. and J.H.; formal analysis, Y.T. and D.A.; investigation, Y.C.; resources, H.Z.; data curation, D.A.; writing—original draft preparation, D.A.; writing—review and editing, Y.T. and D.A.; visualization, D.A.; supervision, H.Z. and Y.T.; project administration, H.Z. and Y.T.; funding acquisition, H.Z. and Y.T. All authors have read and agreed to the published version of the manuscript.

Funding

This research was funded by Major Science and Technology Program for Water Pollution Control and Treatment (grant number 2017ZX07101-003).

Institutional Review Board Statement

Not applicable.

Informed Consent Statement

Not applicable.

Data Availability Statement

All data are presented in this article. Data sharing is not applicable to this article.

Acknowledgments

We acknowledge Zhangjiakou Wofeng Agricultural Co., Ltd. for kindly supplying cow dung for the experiments.

Conflicts of Interest

The authors declare no conflict of interest.

References

  1. Bożym, M.; Florczak, I.; Zdanowska, P.; Wojdalski, J.; Klimkiewicz, M. An analysis of metal concentrations in food wastes for biogas production. Renew. Energy 2015, 77, 467–472. [Google Scholar] [CrossRef]
  2. Zhang, Z.; Gonzalez, A.M.; Davies, E.G.R.; Liu, Y. Agricultural wastes. Water Environ. Res. 2012, 84, 1386–1406. [Google Scholar] [CrossRef]
  3. Farhat, A.; Manai, I.; Gtari, M.; Bouallagui, H. Effect of enhancing nutrient balance in anaerobic digester feedstock by co-substrate addition on the microbial diversity and energy production from municipal sewage sludge. J. Biosci. Bioeng. 2018, 126, 497–506. [Google Scholar] [CrossRef] [PubMed]
  4. Herrmann, C.; Kalita, N.; Wall, D.; Xia, A.; Murphy, J.D. Optimised biogas production from microalgae through co-digestion with carbon-rich co-substrates. Bioresour. Technol. 2016, 214, 328–337. [Google Scholar] [CrossRef]
  5. Astals, S.; Musenze, R.S.; Bai, X.; Tannock, S.; Tait, S.; Pratt, S.; Jensen, P.D. Anaerobic co-digestion of pig manure and algae: Impact of intracellular algal products recovery on co-digestion performance. Bioresour. Technol. 2015, 181, 97–104. [Google Scholar] [CrossRef] [Green Version]
  6. Tian, Y.; Zhang, H.; Chai, Y.; Wang, L.; Mi, X.; Zhang, Y.; Ware, M.A. Biogas properties and enzymatic analysis during anaerobic fermentation of Phragmites australis straw and cow dung: Influence of nickel chloride supplement. Biodegradation 2017, 28, 15–25. [Google Scholar] [CrossRef]
  7. Matheri, A.N.; Ndiweni, S.N.; Belaid, M.; Muzenda, E.; Hubert, R. Optimising biogas production from anaerobic co-digestion of chicken manure and organic fraction of municipal solid waste. Renew. Sustain. Energy Rev. 2017, 80, 756–764. [Google Scholar] [CrossRef]
  8. Tian, Y.; Wang, L.; Mi, X.; Zhang, H.; Chai, Y. Effect of ferrous chloride on biogas production and enzymatic activities during anaerobic fermentation of cow dung and Phragmites straw. Biodegradation 2016, 27, 69–82. [Google Scholar]
  9. Martín, M.A.; Fernández, R.; Gutiérrez, M.C.; Siles, J.A. Thermophilic anaerobic digestion of pre-treated orange peel: Modelling of methane production. Process Saf. Environ. Prot. 2018, 117, 245–253. [Google Scholar] [CrossRef]
  10. Zwietering, M.H.; Jongenburger, I.; Rombouts, F.M.; van ’t Riet, K. Modeling of the bacterial growth curve. Appl. Environ. Microbiol. 1990, 56, 1875–1881. [Google Scholar] [CrossRef] [Green Version]
  11. Tian, Y.; Yang, K.; Zheng, L.; Han, X.; Xu, Y.; Li, Y.; Li, S.; Xu, X.; Zhang, H.; Zhao, L. Modelling biogas production kinetics of various heavy metals exposed anaerobic fermentation process using sigmoidal growth functions. Waste Biomass Valori. 2019, 11, 4837–4848. [Google Scholar] [CrossRef]
  12. Ware, A.; Power, N. Modelling methane production kinetics of complex poultry slaughterhouse wastes using sigmoidal growth functions. Renew. Energy 2017, 104, 50–59. [Google Scholar] [CrossRef]
  13. Li, X.; Huang, J.; Liu, Y.; Maurer, C.; Kranert, M. Effects of salt on anaerobic digestion of food waste with different component characteristics and fermentation concentrations. Energies 2019, 12, 3571. [Google Scholar] [CrossRef] [Green Version]
  14. Gaur, R.Z.; Suthar, S. Anaerobic digestion of activated sludge, anaerobic granular sludge and cow dung with food waste for enhanced methane production. J. Clean. Prod. 2017, 164, 557–566. [Google Scholar] [CrossRef]
  15. Zaidi, A.A.; Feng, R.; Yue, S.; Khan, S.Z.; Mushtaq, K. Nanoparticles augmentation on biogas yield from microalgal biomass anaerobic digestion. Int. J. Hydrogen Energy 2018, 43, 14202–14213. [Google Scholar] [CrossRef]
  16. Zhu, M.R. Fitting Gompertz Model and Logistic Model. Math. Pract. Theory 2002, 32, 705–709. [Google Scholar]
  17. Altaş, L. Inhibitory effect of heavy metals on methane-producing anaerobic granular sludge. J. Hazard. Mater. 2009, 162, 1551–1556. [Google Scholar] [CrossRef]
  18. Dhamodharan, K.; Kumar, V.; Kalamdhad, A.S. Effect of different livestock dungs as inoculum on food waste anaerobic digestion and its kinetics. Bioresour. Technol. 2015, 180, 237–241. [Google Scholar] [CrossRef]
  19. Basak, B.; Fatima, A.; Jeon, B.H.; Ganguly, A.; Chatterjee, P.K.; Dey, A. Process kinetic studies of biohydrogen production by co-fermentation of fruit-vegetable wastes and cottage cheese whey. Energy Sustain. Dev. 2018, 47, 39–52. [Google Scholar] [CrossRef]
  20. Bakhov, Z.K.; Korazbekova, K.U.; Lakhanova, K.M. The kinetics of methane production from co-digestion of cattle manure. Pak. J. Biol. 2014, 17, 1023–1029. [Google Scholar] [CrossRef]
  21. Boni, M.R.; Sbaffoni, S.; Tuccinardi, L. The influence of iron concentration on biohydrogen production from organic waste via anaerobic fermentation. Environ. Technol. 2014, 35, 3000–3010. [Google Scholar] [CrossRef] [PubMed]
  22. Tian, Y.; Zhang, H.; Mi, X.; Wang, L.; Zhang, L.; Ai, Y. Research on anaerobic digestion of corn stover enhanced by dilute acid pretreatment: Mechanism study and potential utilization in practical application. J. Renew. Sustain. Energy 2016, 8, 023103. [Google Scholar] [CrossRef]
  23. Sun, W.; Qu, Y.; Yu, Q. Adsorption of organic pollutants from coking and papermaking wastewaters by bottom ash. J. Hazard. Mater. 2008, 154, 595–601. [Google Scholar] [CrossRef] [PubMed]
  24. Tian, Y.; Zhang, H. Producing biogas from agricultural residues generated during phytoremediation process: Possibility, threshold, and challenges. Int. J. Green Energy 2016, 13, 1556–1563. [Google Scholar] [CrossRef]
  25. Lao, J.; Chen, X.; Qi, M.; Ji, B. Soil Agrochemical Analysis Manual; Lao, J., Ed.; Agriculture Press: Beijing, China, 1988. [Google Scholar]
  26. Zhang, P.; Zeng, G.; Zhang, G.; Li, Y.; Zhang, B.; Fan, M. Anaerobic co-digestion of biosolids and organic fraction of municipal solid waste by sequencing batch process. Fuel Process. Technol. 2008, 89, 485–489. [Google Scholar] [CrossRef]
  27. Bakraoui, M.; Karouach, F.; Ouhammou, B.; Lahboubi, N.; Gnaoui, Y.E.; Kerrou, O.; Aggour, M.; Bari, H.E. Kinetics study of methane production from anaerobic digestion of sludge and wastewater recycled pulp and paper. Conf. Ser. Mater. Sci. Eng. 2020, 946, 27–29. [Google Scholar] [CrossRef]
  28. Veluchamy, C.; Kalamdhad, A.S. Enhanced methane production and its kinetics model of thermally pretreated lignocellulose waste material. Bioresour. Technol. 2017, 241, 1–9. [Google Scholar] [CrossRef] [PubMed]
  29. Li, L.; He, Q.; Zhao, X.; Wu, D.; Wang, X.; Peng, X. Anaerobic digestion of food waste: Correlation of kinetic parameters with operational conditions and process performance. Biochem. Eng. J. 2017, 130, 1–9. [Google Scholar] [CrossRef]
  30. Blasius, J.P.; Contrera, R.C.; Maintinguer, S.I.; de Castro, M.C.A.A. Effects of temperature, proportion and organic loading rate on the performance of anaerobic digestion of food waste. Biotechnol. Rep. 2020, 27, e00503. [Google Scholar] [CrossRef]
  31. Mulyaningtyas, A.; Sediawan, W.B. Effect of combined pretreatment of lignocellulose and the kinetics of its subsequent bioconversion by Aspergillus niger. Biocatal. Agric. Biotechnol. 2019, 21, 101292. [Google Scholar] [CrossRef]
  32. Fang, W.; Zhang, P.; Zhang, T.; Requeson, D.C.; Poster, M. Upgrading volatile fatty acids production through anaerobic co-fermentation of mushroom residue and sewage sludge: Performance evaluation and kinetics analysis. J. Environ. Manag. 2019, 241, 612–618. [Google Scholar] [CrossRef] [PubMed]
  33. Fan, Y.; Wang, Y.; Qian, P.; Gu, J. Optimization of phthalic acid batch biodegradation and the use of modified Richards model for modelling degradation. Int. Biodeter. Biodegr. 2004, 53, 57–63. [Google Scholar] [CrossRef]
Figure 1. The daily methane yields (a) and the cumulative methane yields (b) of anaerobic digestion with different feedstocks. CD, cow dung; CS, corn straw; GL, grape leaves; VI, vines; WR, wine residue; SL, strawberry leaves; TL, tomato leaves.
Energies 14 00258 g001
Figure 2. The modified Gompertz model fitting results (a), the modified logistic model fitting results (b), and the modified Richards model fitting results (c) of cumulative methane yields with different feedstocks. CD, cow dung; CS, corn straw; GL, grape leaves; VI, vines; WR, wine residue; SL, strawberry leaves; TL, tomato leaves.
Energies 14 00258 g002
Figure 3. Experimental and fitting A (cumulative methane yields) values (mL/g∙TS) obtained in different anaerobic co-digestion experiments with various feedstocks. CD, cow dung; CS, corn straw; GL, grape leaves; VI, vines; WR, wine residue; SL, strawberry leaves; TL, tomato leaves.
Energies 14 00258 g003
Figure 4. Experimental and fitting Rmax (maximum methane production rate) values (mL/g∙TS/day) obtained in different anaerobic co-digestion experiments with various feedstocks. CD, cow dung; CS, corn straw; GL, grape leaves; VI, vines; WR, wine residue; SL, strawberry leaves; TL, tomato leaves.
Energies 14 00258 g004
Table 1. The basic properties of feedstocks.
FeedstocksCD 1CS 2GL 3VI 4WR 5SL 6TL 7
TS 9 (%Dry weight)17.4292.8686.9591.5988.0691.0490.51
VS 10 (%TS)85.0690.56\ 890.1884.3186.34\
TOC 11 (%TS)0.1716.5328.2837.7838.7330.4340.03
TN 12 (%TS)0.150.340.230.530.160.620.64
TP 13 (%TS)0.0030.010.0040.0050.010.0010.02
Soluble sugar (%TS)0.0040.150.440.463.586.004.74
Starch (%TS)0.00020.24\0.560.310.300.37
Protein (%TS)0.450.270.600.650.120.310.27
Lipid (%TS)0.785.867.483.886.925.349.86
Cellulose (%TS)34.6335.9426.4132.5743.1328.4234.58
Hemicellulose (%TS)19.4623.1123.3633.6711.4513.5715.10
Lignin (%TS)28.6421.2528.8117.3717.1922.7924.28
1 CD, cow dung; 2 CS, corn straw; 3 GL, grape leaves; 4 VI, vines; 5 WR, wine residue; 6 SL, strawberry leaves; 7 TL, tomato leaves; 8 \, no data; 9 TS, total solid; 10 VS, volatile solid; 11 TOC, total organic carbon; 12 TN, total nitrogen; 13 TP, total phosphorus.
Table 2. The feedstocks and dry weights of the anaerobic co-digestion.
GroupsThe Feedstocks and Dry Weights
1CD 1 16 g
2CD 16 g + CS 2 8 g
3CD 16 g + GL 3 8 g
4CD 16 g + VI 4 8 g
5CD 16 g + WR 5 8 g
6CD 16 g + SL 6 8 g
7CD 16 g + TL 7 8 g
8CD 16 g + CS 4 g + VI 4 g
9CD 16 g + CS 4 g + WR 4 g
1 CD, cow dung; 2 CS, corn straw; 3 GL, grape leaves; 4 VI, vines; 5 WR, wine residue; 6 SL, strawberry leaves; 7 TL, tomato leaves.
Table 3. The modified Gompertz model fitting results of anaerobic co-digestion with different feedstocks.
GroupsA 8 (mL/g∙TS)Rmax 9 (mL/g∙TS/day)λ 10 (days)R2 11
Fitting ResultsExperimental ResultsFitting ResultsExperimental Results
CD 124.7624.981.292.065.030.9978
CD + CS 294.3884.092.466.9312.380.9899
CD + GL 382.6880.643.425.7612.790.9896
CD + VI 4142.9359.631.374.4914.510.9927
CD + WR 585.2781.233.263.7110.030.9938
CD + SL 637.2427.190.554.543.860.9503
CD + TL 732.1235.831.154.1712.010.9445
CD + CS + VI79.5174.172.505.5710.330.9918
CD + CS + WR72.5669.182.344.0110.020.9947
1 CD, cow dung; 2 CS, corn straw; 3 GL, grape leaves; 4 VI, vines; 5 WR, wine residue; 6 SL, strawberry leaves; 7 TL, tomato leaves; 8 A, maximum cumulative methane yields; 9 Rmax, maximum methane production rate; 10 λ, lag phase time; 11 R2, correlation coefficients.
Table 4. The modified logistic model fitting results of anaerobic co-digestion with different feedstocks.
GroupsA 8 (mL/g∙TS)Rmax 9 (mL/g∙TS/day)λ 10 (days)R2 11
Fitting ResultsExperimental ResultsFitting ResultsExperimental Results
CD 124.3924.981.282.065.560.9936
CD + CS 286.0784.092.606.9313.820.9909
CD + GL 380.3380.643.335.7613.050.9924
CD + VI 480.5559.631.404.4914.680.9930
CD + WR 582.3281.233.393.7111.240.9988
CD + SL 629.0727.190.624.547.110.9604
CD + TL 730.4835.831.194.1712.850.9573
CD + CS + VI75.4274.172.565.5711.370.9933
CD + CS + WR69.1069.182.404.0111.170.9946
1 CD, cow dung; 2 CS, corn straw; 3 GL, grape leaves; 4 VI, vines; 5 WR, wine residue; 6 SL, strawberry leaves; 7 TL, tomato leaves; 8 A, maximum cumulative methane yields; 9 Rmax, maximum methane production rate; 10 λ, lag phase time; 11 R2, correlation coefficients.
Table 5. The modified Richards model fitting results of anaerobic co-digestion with different feedstocks.
GroupsA 8 (mL/g∙TS)Rmax 9 (mL/g∙TS/day)λ 10 (days)v 11R2 12
Fitting ResultsExperimental ResultsFitting ResultsExperimental Results
CD 124.7424.980.112.065.040.030.9977
CD + CS 288.4784.092.066.9313.200.590.9913
CD + GL 380.5380.643.205.7612.970.890.9923
CD + VI 490.0659.631.174.4914.210.650.9930
CD + WR 581.7181.233.783.7111.731.390.9990
CD + SL 626.2827.190.834.5410.182.810.9644
CD + TL 729.3235.831.644.1714.952.750.9607
CD + CS + VI76.4374.172.155.5710.950.650.9936
CD + CS + WR72.4969.180.084.0110.030.010.9947
1 CD, cow dung; 2 CS, corn straw; 3 GL, grape leaves; 4 VI, vines; 5 WR, wine residue; 6 SL, strawberry leaves; 7 TL, tomato leaves; 8 A, maximum cumulative methane yields; 9 Rmax, maximum methane production rate; 10 λ, lag phase time; 11 v, shape factor; 12 R2, correlation coefficients.
Publisher’s Note: MDPI stays neutral with regard to jurisdictional claims in published maps and institutional affiliations.

