Article

Operation Strategy of Electricity Retailers Based on Energy Storage System to Improve Comprehensive Profitability in China’s Electricity Spot Market

1
School of Electrical Engineering, Beijing Jiaotong University, Beijing 100044, China
2
National Institute of Clean-and-Low Carbon Energy, Beijing 102211, China
3
National Engineering Laboratory for Electric Vehicles, Beijing Institute of Technology, Beijing 100081, China
4
Beijing Huashang Sanyou New Energy Technology Co., Ltd., Beijing 271000, China
*
Author to whom correspondence should be addressed.
Energies 2021, 14(19), 6424; https://doi.org/10.3390/en14196424
Submission received: 3 August 2021 / Revised: 30 September 2021 / Accepted: 4 October 2021 / Published: 8 October 2021

Abstract

:
Due to the development of China’s electricity spot market, the peak-shifting operation modes of energy storage devices (ESD) are not able to adapt to real-time fluctuating electricity prices. The settlement mode of the spot market aggravates the negative impact of deviation assessments on the cost of electricity retailers. This article introduces the settlement rules of China’s power spot market. According to the electricity cost settlement process and the assessment methods, this paper proposes a comprehensive electricity cost optimization algorithm that optimizes day-ahead market (DA) electricity cost, real-time market (RT) electricity cost and deviation assessment through ESD control. According to the trial electricity price data of the power trading center in Guangdong province (China), many typical load curves and different deviation assessment policies, the algorithm calculates DA electricity cost, RT electricity cost and deviation assessment cost by utilizing a comprehensive electricity cost optimization algorithm. Compared with the original electricity cost and optimization cost, this method is proven to effectively save overall electricity costs under the spot market settlement system. Based on three different initial investment prices of ESD, this paper analyzes the economics of the ESD system and proves that ESD investment can be recovered within 5 years. Considering the small amounts of operating data in China’s power spot market, the algorithm generates random data according to characteristics of these data. Then, this paper verifies that the comprehensive electricity cost optimization algorithm remains reliable under random circumstances.

Graphical Abstract

1. Preface

With China’s electricity trading market reformed deeply, the Electric Power Trading Center begun spot trading preparation work in the Guangdong province, the western part of Inner Mongolia and Shandong province in accordance with local conditions. In the province of Guangdong, electric power trading centers had started power spot trading trial operations, which combines day-head (DA) market, real-time (RT) market and deviation assessment in several indefinite days during each month with the settlement method [1].
Before spot market policy application, the trade method includes medium-term transactions, long-term transactions and contract transfer transactions in China. According to electricity retailers’ settlement fee data, the deviation assessment brings greater losses under medium-term and long-term trading. If the trading rules of the electricity spot market are applied, a large number of electricity retailers face deficit due to deviation assessment. Due to energy storage technology developments, the developments are widely used on the customer side of the power system and adopts an arbitrage mode of peak-shaving. However, electricity costs are settled according to real time retail prices, and the energy storage equipment on the customer’s side will lose arbitrage space through peak shifting after electricity spot trading applications.
On the power generation side, many researchers work on the optimization operations of power generation in order to adapt to the electric power spot market. In the power market, electricity retailers appear as new entities that face many new problems. In literature [2], the authors of this paper analyzed the centralized market, decentralized market and other different electricity market rules and combed different pricing methods of the generation side and the consumption side of the spot market in different regions of China. In literature [3], aiming at the operators of power selling companies in the spot market, the risk assessment algorithm, CVaR, was used to analyze power purchase strategies in medium-term and long-term markets and spot markets by taking into account renewable energy, distributed energy, rental ESD and other factors. In paper [4], the authors focused on a virtual power plant (VPP) in the power spot market. They conducted research on the quotation and operation optimization in the DA market and RT market and studied the impacts of market uncertainty on VPP operation by using the CVAR method. In paper [5], the authors focused on the Turkish electricity spot market, and they established a multi-stage risk model combined with the price prediction model, which can dynamically manage portfolios in order to reduce risks. In literature [6,7], in the two-stage dispatching control of the DA market and RT market, power was dispatched through VPP and micro-grid, and a risk preference model utilizing the CVaR method was established. In paper [8], for the DA market and regulatory market, the energy hub operator uses the stochastic mixed integer linear programming (MILP) method and takes into account the CVaR method in order to optimize scheduling of electric energy and natural gas procurement. In literature [9,10,11], from the composition of power purchase and sales, this paper studies power purchases and sales decisions of power retailers in medium-term and long-term contracts, DA markets and RT markets and considers the uncertainty of power generation, user demand response and other influencing factors. In papers [12,13], according to the RT electricity pricing situation, the authors carried out short-term load data forecast and obtained accurate fluctuation ranges. In literature [14], with respect to the spot market, the authors predicted RT electricity prices by utilizing the random forest regression method. In literature [15], the authors established electricity purchase models with robust optimization in order to reduce the impact of electricity price forecast errors by considering long-term transactions, spot trading and self-operated power plants. In literature [16], based on avoiding the risks of the balance market, the authors studied optimized trading strategies of the balanced market by establishing consumer demand-side response models and the electricity retailer’s planning model. In papers [12,17], the authors studied the negative impact of deviation assessment on the revenue of electricity retailers, and they provided an idea to reduce deviation assessment by utilizing ESD. In paper [18], the CCHP mode was adopted in order to adjust system load. The authors established a rolling optimization model of deviation electricity in order to reduce deviation assessment in the RT market. In paper [19], in the assessment of deviation electricity in the RT market, the authors studied different contract transactions with ESD stations in order to improve the economy of electricity retailers. In paper [20], the research objective was aimed at total electricity purchase cost optimization of electricity retailers, which provides power to electric vehicles. In paper [21], electricity retailers analyzed pricing strategies for five different types users and introduced demand-side incentive policies. In literature [22], electricity retailers and energy storage operators were independent of each other. Energy storage operators served the grid by stabilizing load demand. Electricity retailers need to purchase and sell electricity from energy storage operators and the grid, respectively. Paper [23] focused on a micro-grid system with EV charging stations, which optimizes the operating costs of the ESD in the charging stations by utilizing mixed integer linear programming (MILP), and the optimization configuration of capacity and power of the ESD was obtained. In document [12], the electricity retailer leases the user’s energy storage equipment, which is used to adjust electricity deviation. In paper [24], the electricity retailer has distributed power generation assets. In this paper, the decision goal is to obtain the ratio of power in the DA market relative to load forecast, which can combine DA markets and RT markets according to the constant price in the DA market.
The current body of research on the operation strategy of electricity retailers mainly refers to the settlement mechanism of electricity markets in Europe and the United States [13,25,26] and focuses on the strategy of medium-term market, long-term market, DA market and RT market. Research on settlement rules, electricity price and load fluctuation characteristics in China’s electricity market has been lacking. Several research studies conducted on power purchase cost optimization mainly focused on the deviation of electricity [12], which does not comprehensively consider power purchase costs in DA markets and RT markets.
In this paper, based on the trading rules, electricity price data on trial operation days and load deviation data from the annual report of the Guangdong Electric Power Trading Center, a two-stage comprehensive optimization including both DA market and RT market is proposed in order to achieve a comprehensive reduction in the purchase costs of electricity retailers. In this article, the first chapter introduces China’s current power trading policies and the rules of trial power spot market trading. The second chapter introduces the economic dilemma of ESD under peak-shifting operations and the negative impact of load deviation on the revenue of electricity retailers. The third chapter introduces a two-stage comprehensive optimization method including DA and RT markets. In the first stage, which is the DA market, according DA electricity prices, the declared load curve of the DA market is adjusted in order to reduce electricity purchase costs. In the second phase, which is the RT market, based on the optimization result of first stage and deviation assessment coefficient, the deviation between declared load and RT electricity load is adjusted in order to achieve electricity purchase cost optimization by controlling ESD outputs. In the fourth chapter, based on the trial operation data of Guangdong Electric Power Trading Center, a verification is demonstrated, and the comprehensive optimization algorithm is shown to effectively reduce electricity costs. On this basis, according to the investment cost analysis of ESD, the investment return rate of the strategy for electricity retailers with ESD is pointed out. By utilizing random data, the feasibility of the strategy under random load forecast errors and random electricity price changes is verified. Finally, we demonstrate that this control strategy can effectively improve the operating efficiency of electricity retailers in real-time random spot markets.

2. Electricity Market Trading Policies and Development in Various Countries

2.1. International Electricity Market Transaction Policy

The United States, Britain and other European countries formulated power market policies according to their own conditions; the countries constantly adjust and optimize their electricity market systems during the process of market operation over the duration of many years.
The PJM power market in the United States adopts a centralized power market, including power market, capacity market, auxiliary service market, etc. The power market covers medium and long-term bilateral transactions, including DA market and RT market. Both the power generation side and the power consumption side participate in the declaration of electricity quantity and electricity price. The settlement cost of PJM includes the following: blocking surplus expenses and compensation expenses. In the DA market and RT market, the deviation caused by users is assessed, which compensates operating power generation [27]. The UK electricity market utilizes a decentralized electricity market. The trading mechanism includes medium and long-term transactions and unbalanced settlements are used afterwards, which compensate start-up, stop and no-load cost of generation units. In the Australian electricity market, the spot market is the core transaction, which centers around unilateral bidding and 24 h rolling clearing from the power generation side, without distinguishing DA markets and RT markets [28].

2.2. Development of China’s Electricity Market Trading Policy

2.2.1. Constant Electricity Price Transaction Mode in the Electricity Market

Power trading policies vary in different provinces of China. The basic trading methods include bilateral negotiation, centralized bidding, listing transaction and so on [2]. There are two kinds of price models: fixed price and peak-valley price. The peak-valley price model is widely used due to requirement of side regulation. Deviation of power consumption should be assessed, such as deviation of power consumption in each month and deviation between trading volume and actual consumption which would be punished. Therefore, user-side electricity costs include the following: electricity cost and deviation assessment.

2.2.2. Spot Trading Model in the Electricity Market

With the opening of China’s power market, some provinces and cities have gradually carried out power spot market reforms. In August 2017, Guangdong, Mengxi, Zhejiang, Shanxi, Shandong, Fujian, Sichuan and Gansu were established as pilot areas of the power spot market. In 2020, Xinjiang, Anhui, Jiangsu, Jiangxi, Heilongjiang, Qinghai and Shaanxi released the construction scheme of the power spot market. In March 2021, Liaoning province, Jiangsu province, Anhui province, Henan province and Shanghai were established as pilot areas of the power spot market. Among the first batch of pilot areas, Guangdong province constructed the power market quickly. It adopts a centralized power market system similar to PJM, including medium and long-term markets and a spot market. In 2019, the province carried out trial operation settlement based on a daily time scale. The power markets in other pilot areas carried out trial operations based on a monthly time scale.
Due to the different construction progress of the power market in each pilot area, the time scale of deviation assessment, the range of deviation assessment λ 0 and the deviation assessment price are all different. Table 1 shows the range of deviation assessment in different regions. In the regions with monthly settlements, the deviation assessment price adopts coal power on-grid prices, multiples of annual transaction average prices and so on. In Guangdong regions with daily settlements, the regions adopted the price difference between DA markets and RT markets.
Take the power spot market trading policy issued by Guangdong power trading market in June 2018 as an example [29,30,31,32], its settlement rules include three parts: DA market, RT market and deviation assessment. The daily electricity cost settlement is shown in Equation (1), in which the DA market settlement, RT market settlement and deviation assessment parts are shown in Equations (2)–(4).
E cos t = E D A + E R T + E a l l o c a t i o n
E D A = t [ P D A ( t ) C D A ( t ) ]
E R T = t { [ P R T ( t ) P D A ( t ) ] C R T ( t ) }
E a l l o c a t i o n = E p a r t 1 + E p a r t 2
E p a r t 1 = [ P D A ( t ) P R T ( t ) × ( 1 + λ 0 ) ] × K f e e × ( C R T ( t ) C D A ( t ) ) ] , P D A ( t ) > P R T ( t ) × ( 1 + λ 0 ) C R T ( t ) > C D A ( t ) E p a r t 2 = [ P R T ( t ) × ( 1 λ 0 ) P D A ( t ) ] × K f e e × ( C D A ( t ) C R T ( t ) ) ] , P D A ( t ) < P R T ( t ) × ( 1 λ 0 ) C R T ( t ) < C D A ( t )
In these Equations, t is the settlement time step. λ 0 is the deviation assessment range, and K f e e is deviation assessment price coefficient. C D A is the electricity price of the DA market, which is announced by the trading center 24 h in advance. P D A is the declaration load of the DA market, which is declared by the electricity retailer 24 h in advance. C R T denotes the electricity price of the RT market, which is announced by the trading center one hour in advance. P R T is the RT load demand of electricity retailer. The deviation assessment cost consists of two parts, which are calculated according to the deviation relationship between P D A and P R T and the deviation relationship between C D A and C R T , as shown in Equation (5). In accordance with the above settlement rules, Guangdong province started trial operations on some trading days in May 2019.

3. Analysis of Various Factors Affecting the Revenue of Electricity Retailers under Different Electricity Price Policy

3.1. Impact of Peak-Valley Price Difference on Electricity Retailer

In the peak-valley electricity price mode, the consumer can operate in the peak-shifting mode in which ESD is configured. The load curve of the electricity metering point can be adjusted to reduce electricity costs [33]. This model is currently widely used, as shown in Figure 1. The optimization goal of its control is shown in Equation (6), in which C c o n _ R T ( t ) is peak-valley price, and P l o a d ( t ) is the load curve of consumer side.
min f = P cos t ( t ) C c o n _ R T ( t ) Δ t
Due to the adjustment of peak-valley price policies in recent years [7], the difference in peak-valley prices has decreased in most regions, which results in the economic decline of peak shifting modes. According to the current construction cost of ESD, it is economical when the peak-valley price difference is more than 0.7 CNY/kWh. As shown in Table 2, only a few areas can meet its conditions.

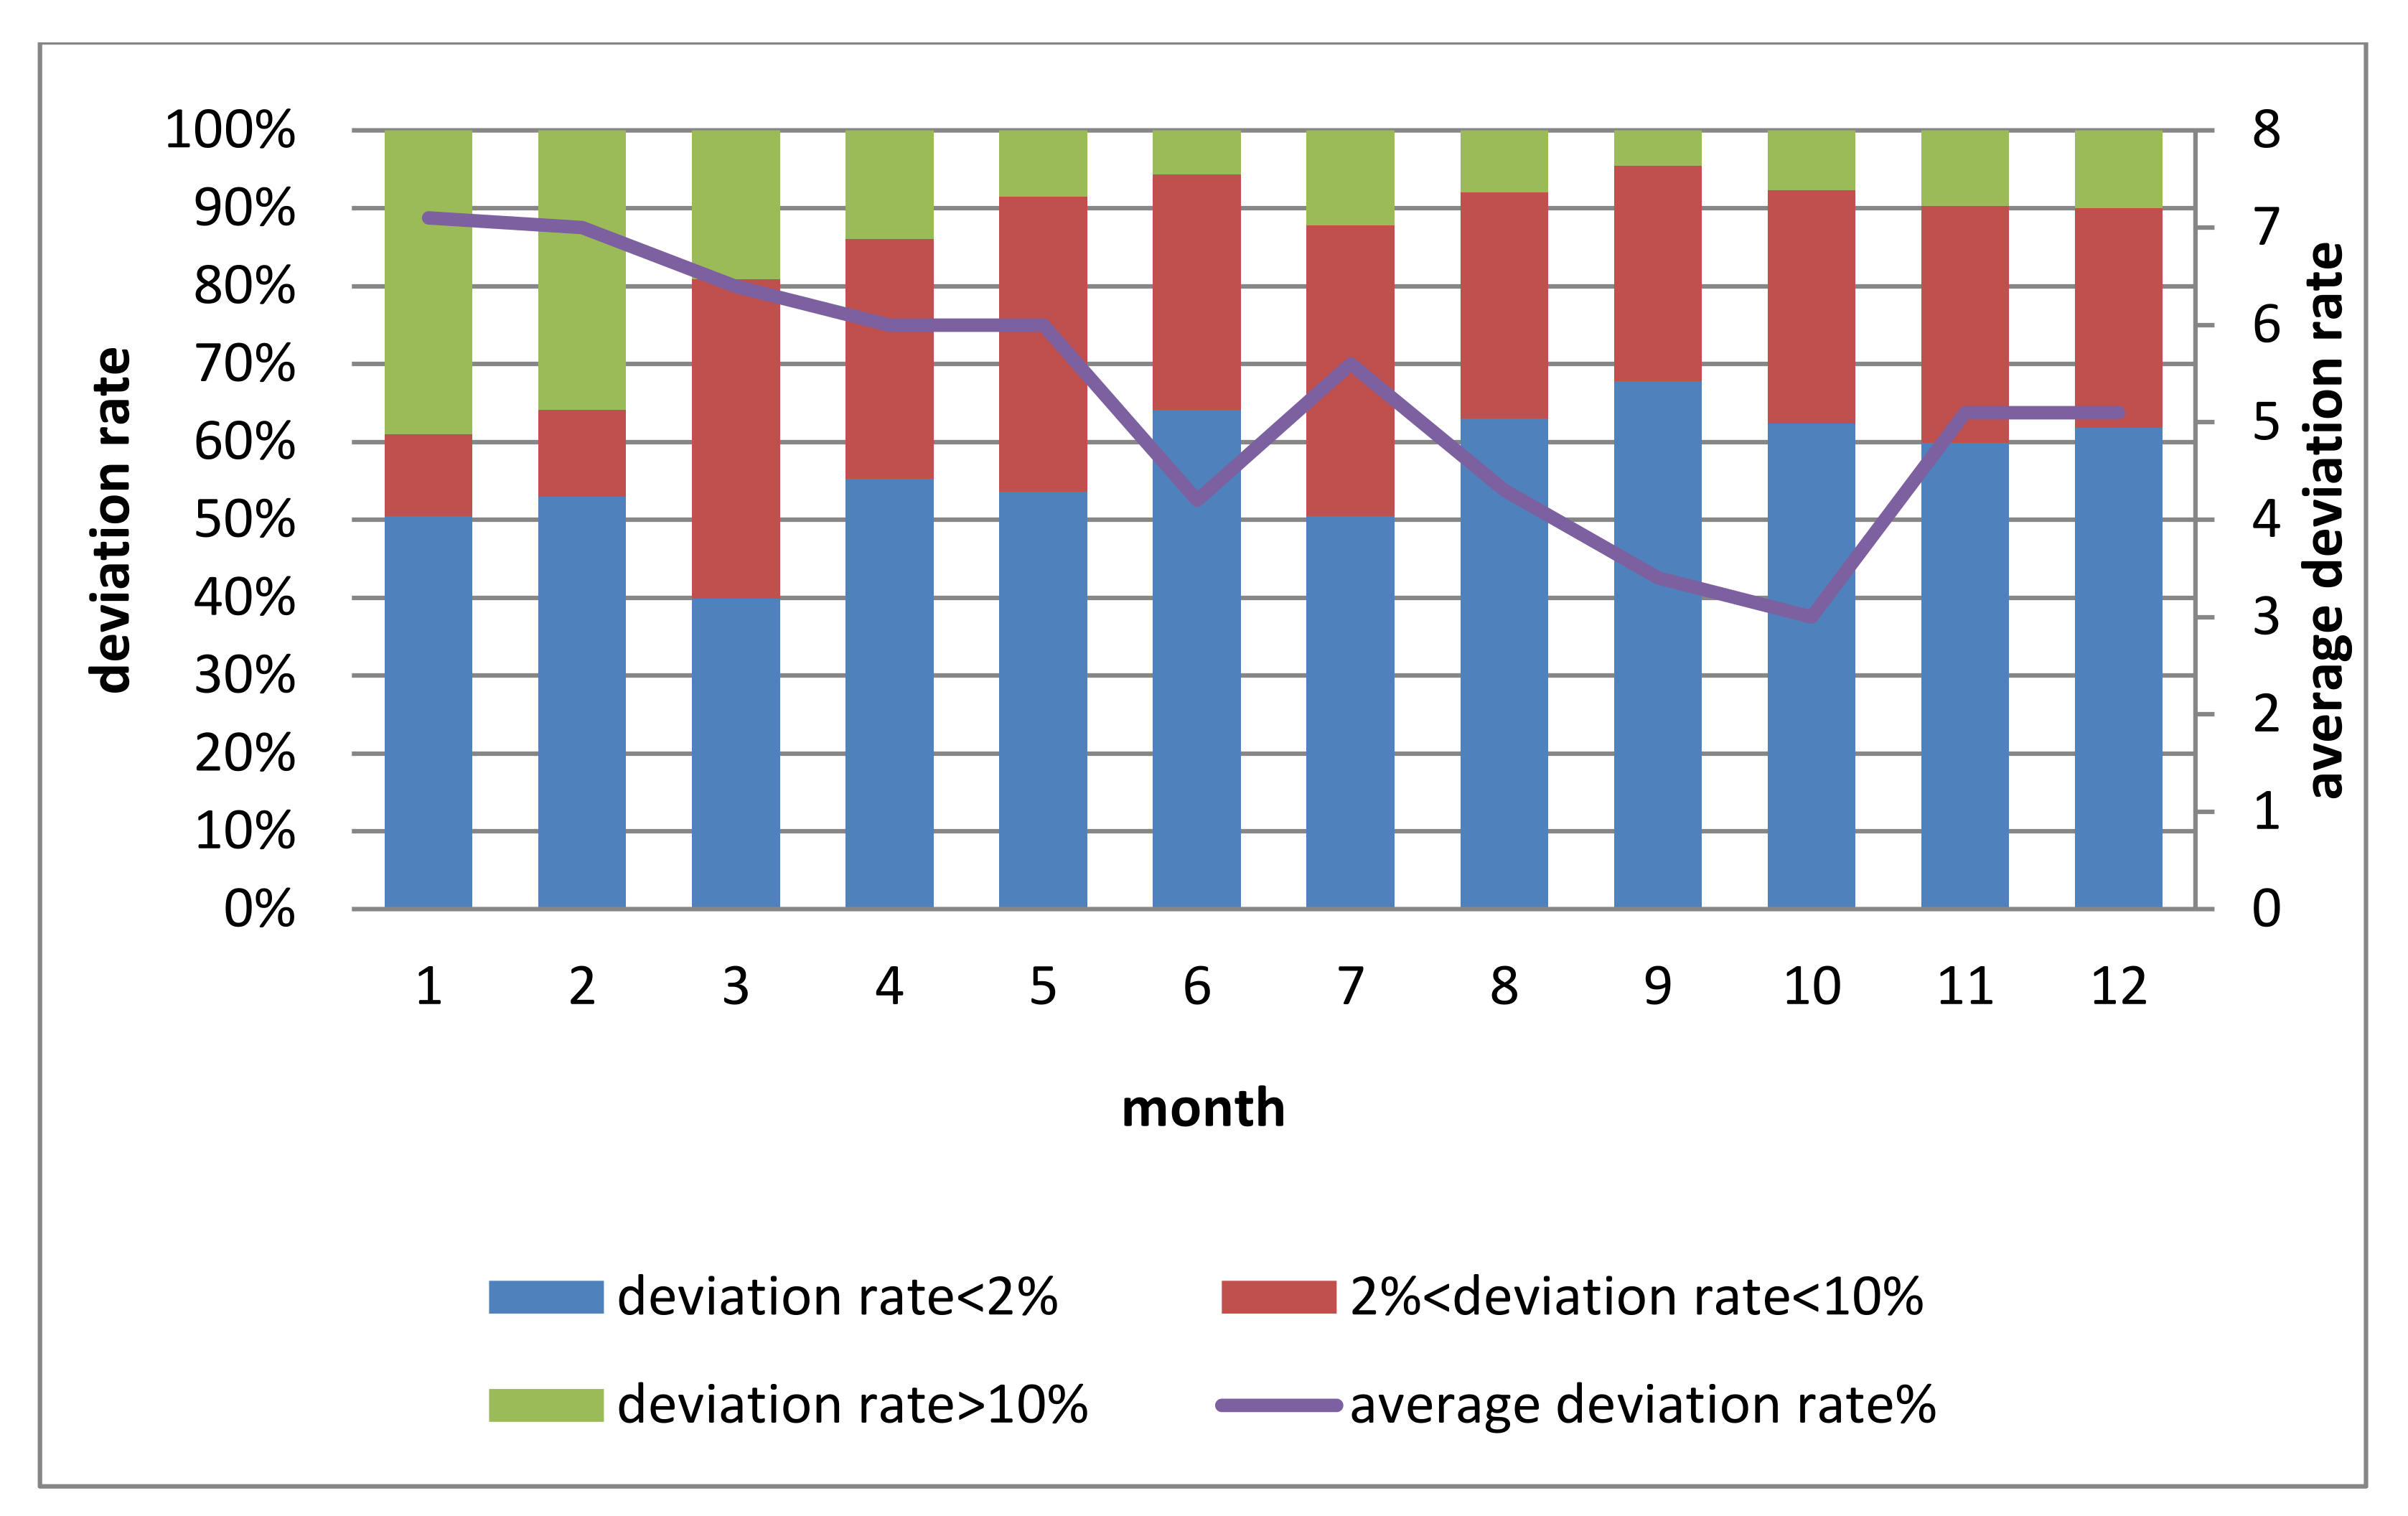
3.2. The Impact of Deviation Assessment on the Cost of Electricity Retailer

Take the policy of Guangdong electric power market as an example, the deviation assessment coefficient of it is 2%, and the amount of electricity that exceeds the assessment range is assessed at twice the price. According to the annual report data of the Guangdong Electric Power Company in 2018 [34], relevant data are shown in Figure 2. The average deviation rate of the demand side is 8.7% and deviation rate achieved 18% in February. The annual sales revenue of the electricity retailer is CNY 770 million, and the deviation assessment is CNY 170 million. The above deviation assessment fee is based on the results of monthly assessments. With the development of the power spot market, many regions gradually adopted daily deviation assessment in China. Since the deviation fluctuation of daily loads is much higher than that of monthly loads, the deviation cost will be very high. It can be obesrved that the deviation assessment seriously affects the benefits of electricity retailers.
According to the Guangdong Electric Power Company annual report in 2019, relevant data are as shown in Figure 3. The average deviation rate of the demand side is 6.3%, and the maximum deviation rate is 7.1%. The annual sales revenue of the electricity retailer is CNY 1.17 billion, and the deviation assessment is CNY 40 million. This shows that the deviation assessment fines seriously affect the profitability of electricity retailers.

3.3. Impact of Emergencies on the Operation of Electricity Retailers

With the advancement of the power market, due to the random fluctuations of the spot market electricity price and the deviation assessment policy, electricity retailers are required to improve the accuracy of load forecasting and to respond to the fluctuation of electricity price in time, which can reduce electricity costs and deviation assessment costs.
However, the sudden situation imposes negative impacts on the fluctuation of electricity prices and power loads in the spot market. For example, in Australia, the change of renewable energy power results in sharp fluctuations of RT electricity prices [35], which results in incorrect decision making on the part of the electricity retailer in the DA market. For example, COVID-19 has led to a sharp decline in power load growth in 2020. Table 3 shows China’s electricity growth data in the first three quarters, showing an obvious downward trend [36]. Due to the fact that electricity retailers cannot respond to the fluctuation of load forecasting in time, a large number of deviations in assessment costs resulted. Jiangxi, Jiangsu, Fujian, Guangdong, Xinjiang and other provincial and municipal governments temporarily exempted some deviation assessments. Hunan province temporarily adjusted the deviation assessment range from ±3% to ±8%. Therefore, it is an urgent requirement for electricity retailers to optimize operation and management in order to effectively confront price changes and load deviations.

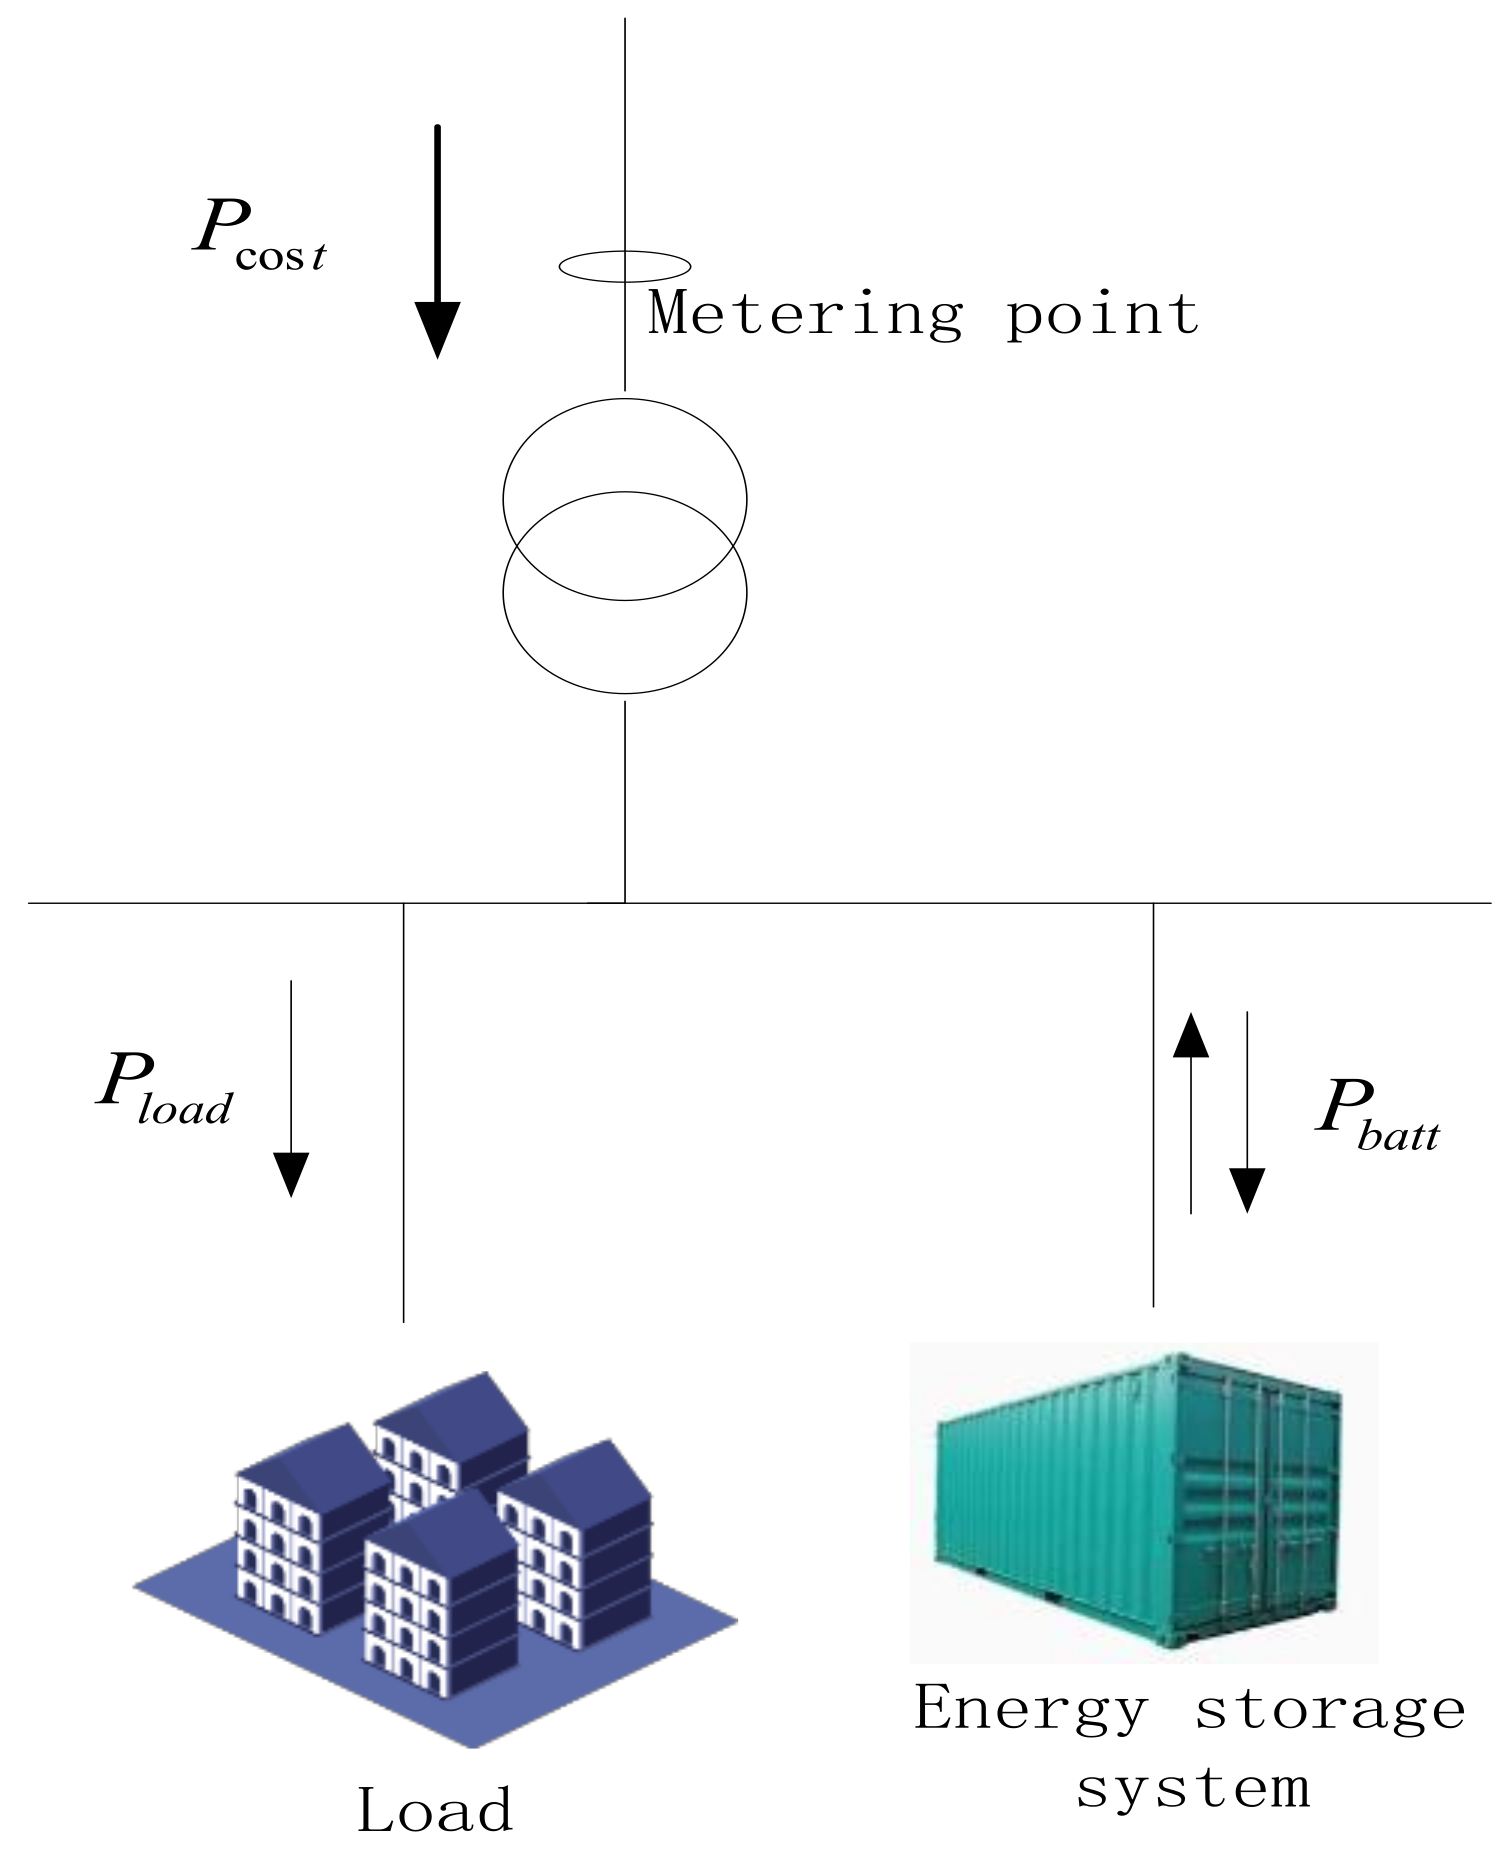
4. Cost-Optimized Operation of Electricity Retailer in the Electricity Spot Market

4.1. Impact Analysis of Electricity Retailer Operation Based on the Electricity Spot Market Policy

According to the electricity spot market settlement rules introduced in Section 2.2 the electricity bill settlement process is shown in Figure 4. The electricity retailers provide the declared load P D A ( t ) in DA market based on load forecast data. The trading center announces DA market electricity price C D A ( t ) 24 h in advance. The trading center can calculate the electricity expenses in DA market E D A . Due to the deviation between the actual load and the declared load, the deviation between C D A ( t ) and C R T ( t ) and different settlement times of E D A , E R T and E a l l o c a t i o n , this method cannot effectively reduce the total electricity cost.

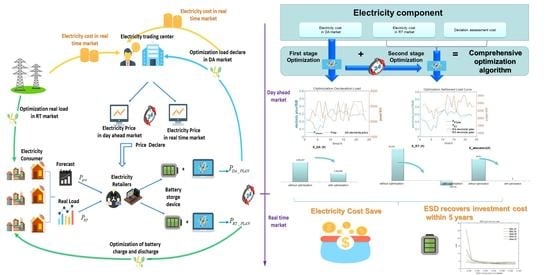
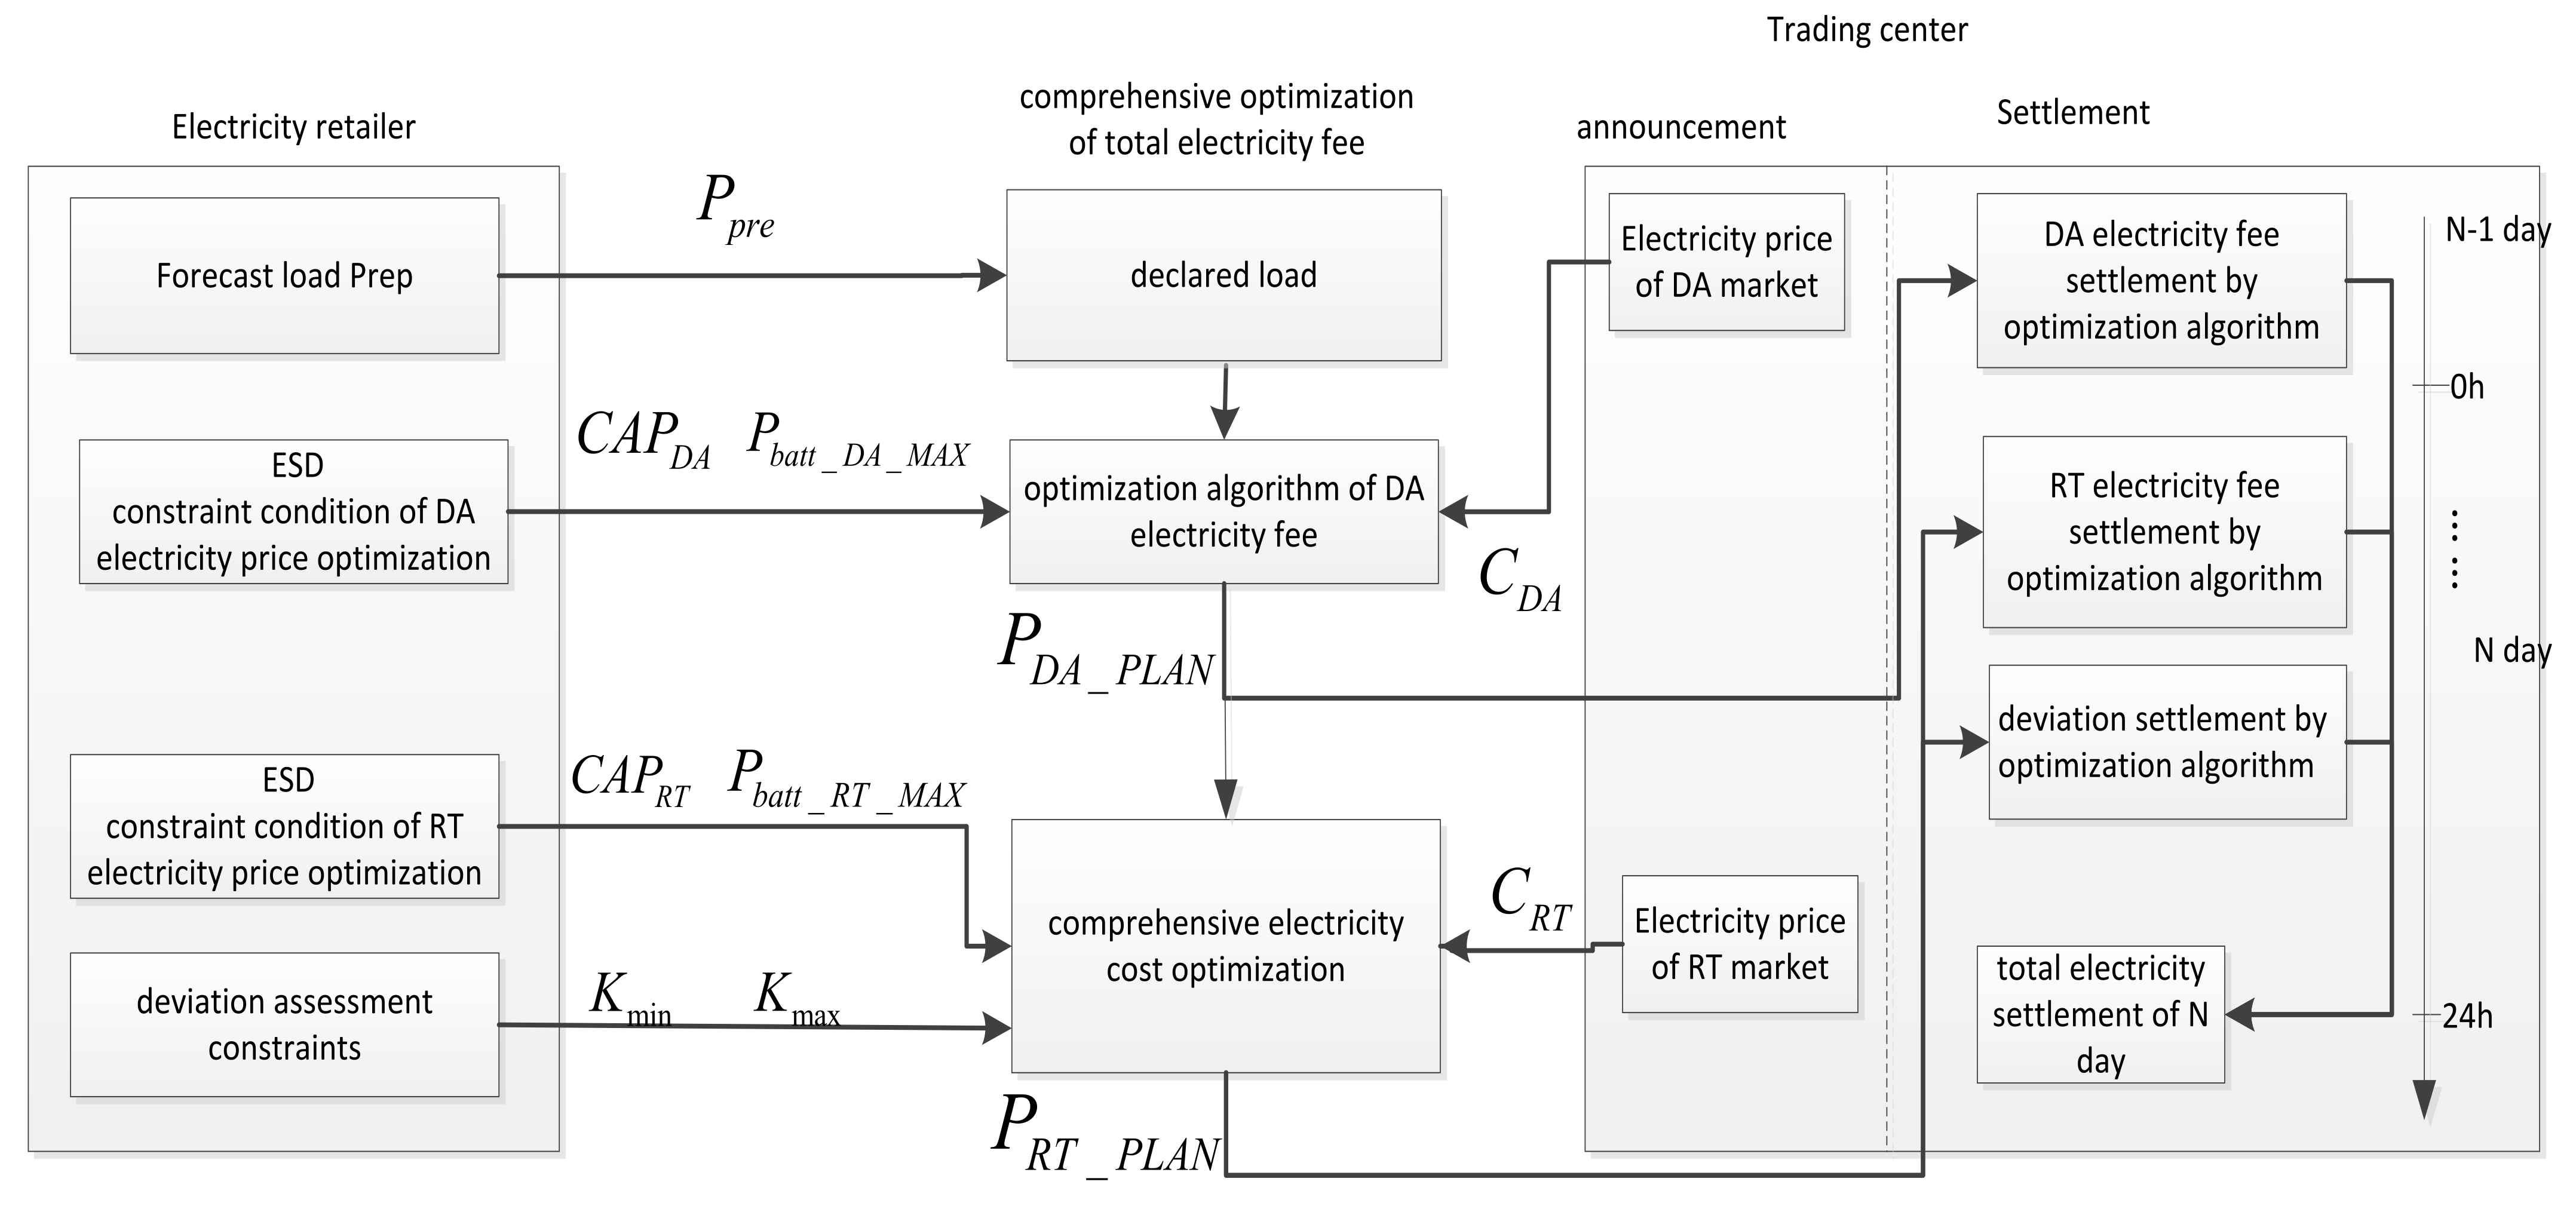
4.2. Electricity Cost Comprehensive Optimization Algorithm of Electricity Retailer in Spot Market

According to the analysis in Section 3.1, synthetic optimization considers three parts of electricity purchase costs, which includes electricity cost of the DA market, electricity cost of the RT market and deviation assessment penalty for reducing electricity retailer costs. The optimization goal is shown in Equation (7).
min E cos t = E D A + E R T + E a l l o c a t i o n
According to the declaration rules of the electricity retailer and the settlement procedures of the trading center, the state flow of comprehensive optimization electricity costs of the electricity retailer is shown in Figure 5. The original declared load curve of the electricity retailer is P D A according to forecast load P r e p . Before the Nth day, the optimized value of the load declared is P D A _ p l a n , which is obtained by the optimization algorithm of DA electricity cost and can complete the DA electricity cost settlement on the Nth day. According to P D A _ p l a n , deviation assessment constraints, ESD constraints, actual load demand and RT electricity prices at the next step, optimization of the RT load curve P R T _ p l a n , real-time operation power control of ESD and comprehensive electricity cost optimizations are obtained by carrying out comprehensive optimizations of RT electricity costs and deviation assessments.
In PJM of the United States, Guangdong, Shandong, Zhejiang and other province in China, the spot market includes DA market and RT market, including the compensation settlement mechanism for power deviation. The settlement method is similar to the process shown in Figure 4. The optimization algorithm in Figure 5 is suitable for these markets. In Australia, the spot electricity market does not distinguish between the DA market and RT market. The British electricity market adopts a post unbalanced settlement mode. The optimization method is not applicable to this kind of electricity market mechanism.

4.2.1. Optimization Strategy of Electricity Cost in DA Market

In the past, the electricity retailer declared DA load P D A ( t ) based on the predicted load P r e p . The DA electricity cost optimization algorithm module uses the optimization algorithm described in Section 2.2, which is shown in Figure 5. By utilizing ESD output adjustments, the DA declaration load is P D A _ p l a n ( t ) . The optimization objective function is shown in Equation (8), which achieves optimization of the electricity cost in DA market E D A .
min E D A = t = 1 24 P D A _ p l a n ( t ) C D A ( t ) Δ t
The constraints are shown in Equation (9). P b a t t _ D A _ p l a n ( t ) is the ESD power demand obtained by the DA optimization algorithm. P b a t t _ D A _ max and C A P b a t t _ D A are the constraints of ESD power and capacity in the DA optimization algorithm.
P b a t t _ D A _ p l a n ( t ) = P D A _ p l a n ( t ) P D A ( t ) P b a t t _ D A _ max < P b a t t _ D A _ p l a n ( t ) < P b a t t _ D A _ max S O C ( t ) = t = 1 t ( P b a t t _ D A _ p l a n ( t ) Δ t ) / C A P b a t t _ D A

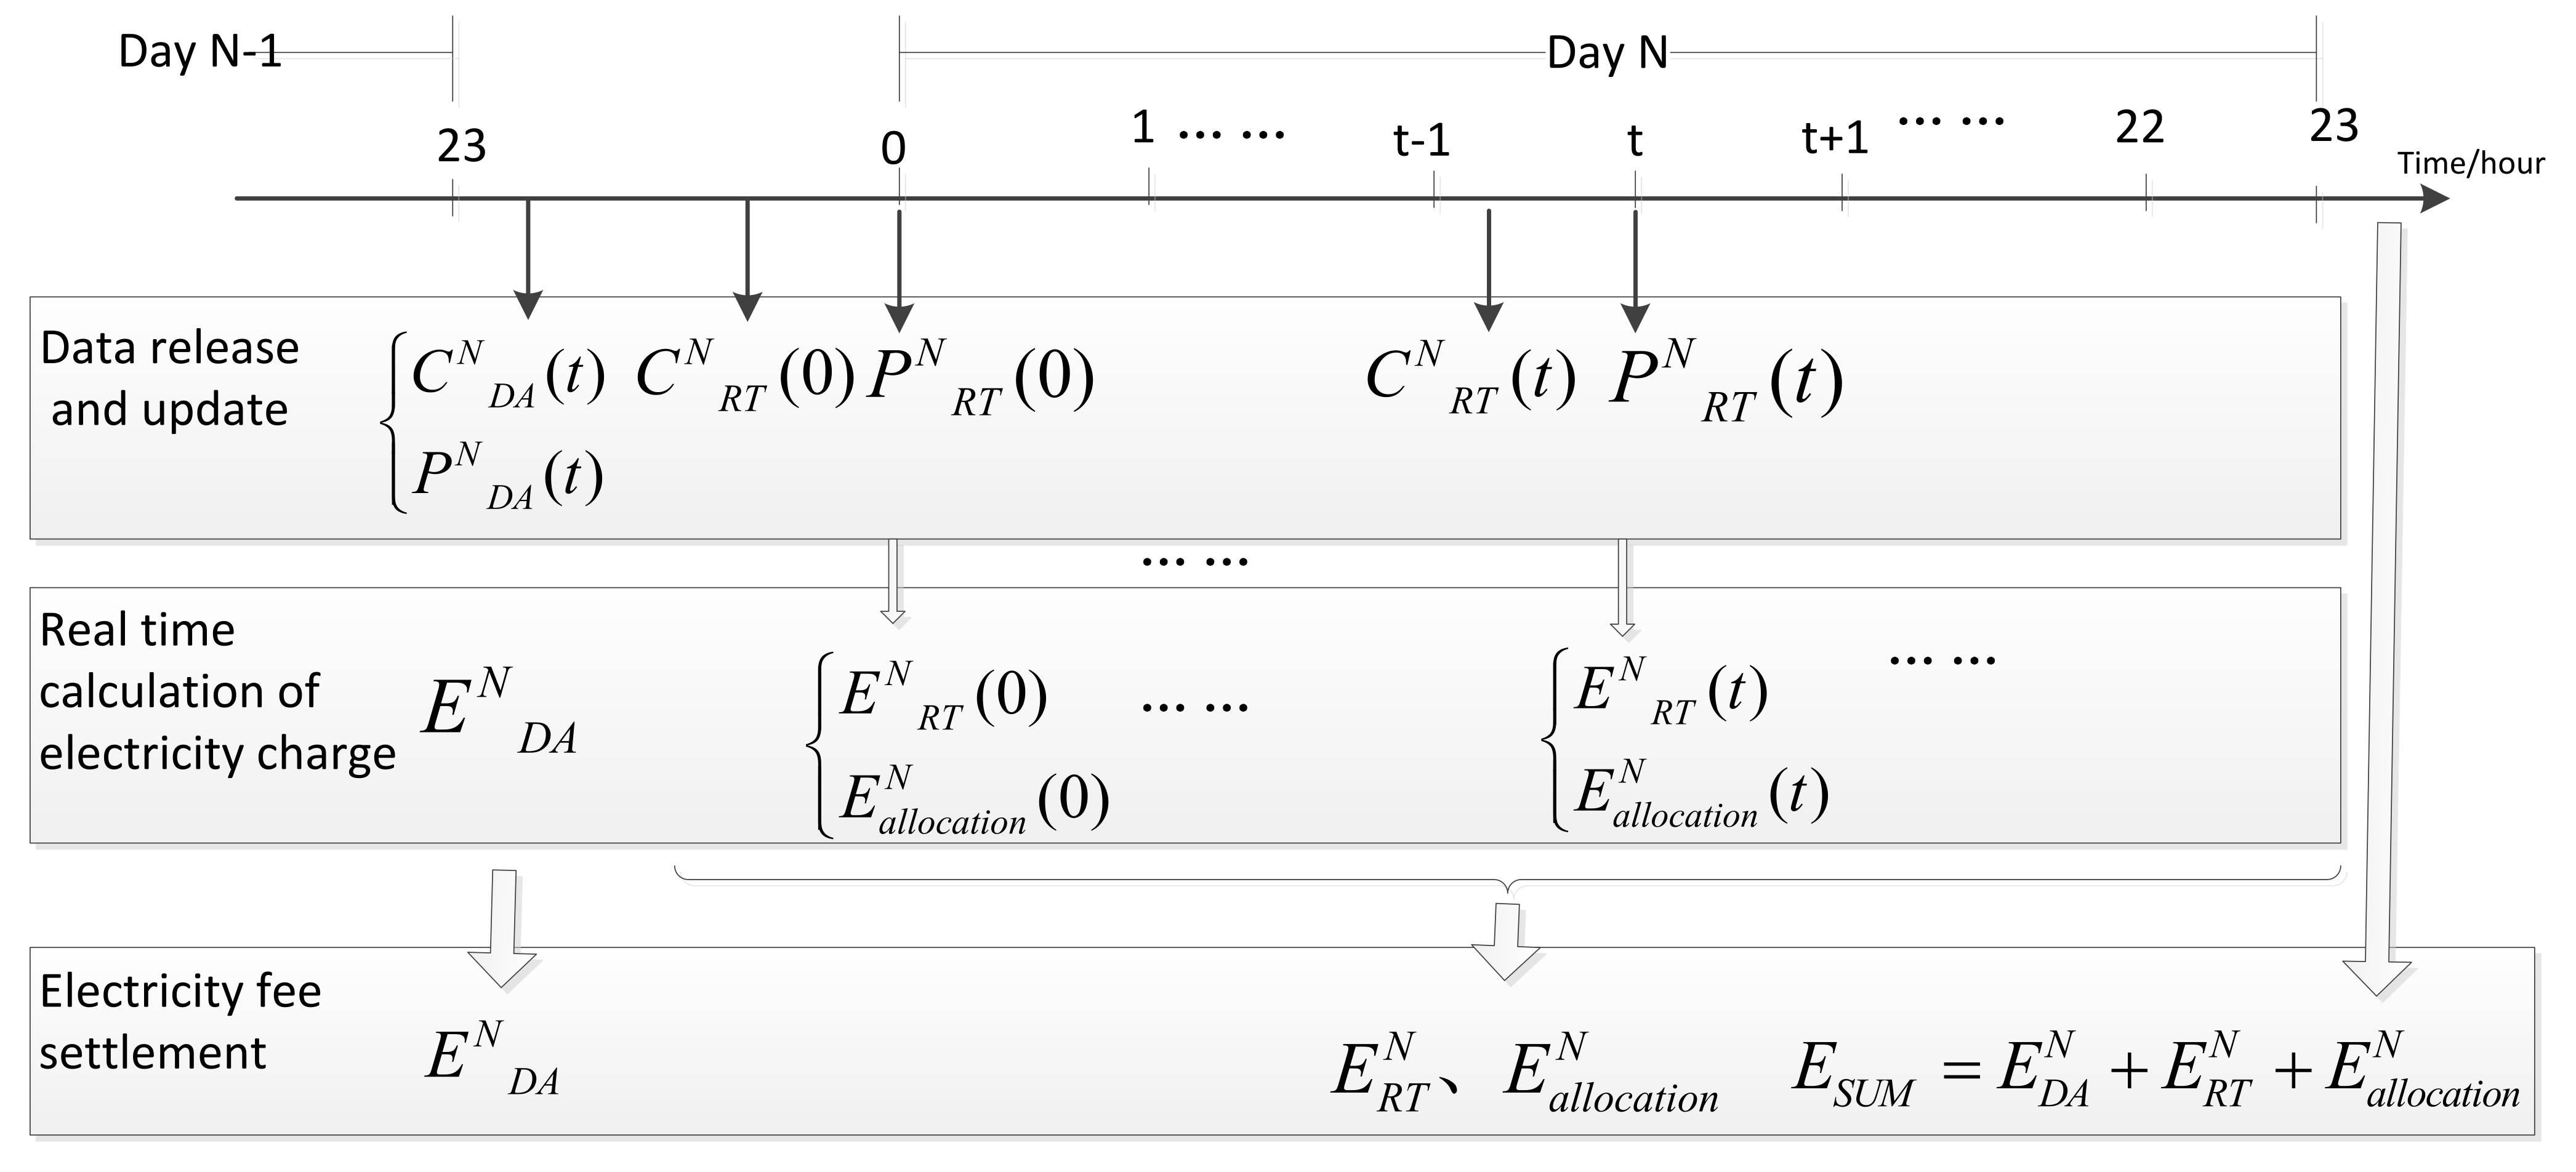
4.2.2. Comprehensive Electricity Cost Optimization Algorithm

Due to environmental factors, demand changes and other reasons, various load forecasting algorithms have inevitable errors [37]. Since it lacks the auxiliary management of the price convergence mechanism of virtual transactions in the Guangdong power market, RT electricity prices and DA electricity prices will inevitably have large-scale deviation [17,38]. The deviation from P D A _ p l a n ( t ) obtained in Section 4.2.1 and the actual load demand P R T inevitably result in RT electricity costs and deviation assessment costs, as shown in Equations (3) and (4). In comprehensive optimization module shown in Figure 5, the correlation variables x ( t ) between the DA declared load P D A _ p l a n ( t ) and the RT load P R T _ p l a n ( t ) are established, as shown in Equation (10).
x ( t ) = P D A _ p l a n ( t ) / P R T _ p l a n ( t )
By combining the settlement process of DA markets and the RT markets, optimization calculations can provide the minimization goal E cos t based on DA optimization load P D A _ p l a n ( t ) . The optimization objective function is shown in Equation (11), and the deviation assessment expression relationship is shown in Equation (12).
min E cos t = E D A + E R T + E a l l c o a t i o n E D A = t x ( t ) C D A ( t ) P D A _ p l a n ( t ) Δ t E R T = t C R T ( t ) ( 1 x ( t ) ) P R T _ p l a n ( t ) Δ t E a l l c o a t i o n = E p a r t 1 + E p a r t 2
E p a r t 1 = t [ x ( t ) ( 1 + λ 0 ) ] P R T _ p l a n ( t ) K f e e ( C R T ( t ) C D A ( t ) ) ] Δ t , x ( t ) > ( 1 + λ 0 ) C R T ( t ) > C D A ( t ) E p a r t 2 = t [ ( 1 λ 0 ) x ( t ) ] P R T _ p l a n ( t ) K f e e ( C D A ( t ) C R T ( t ) ) ] Δ t , x ( t ) < ( 1 λ 0 ) C R T ( t ) < C D A ( t )
The constraints are shown in Equation (13). P b a t t _ R T _ p l a n ( t ) is the ESD power demand obtained by utilizing the RT optimization algorithm. P b a t t _ R T _ max and C A P b a t t _ R T are the constraints of ESD power and capacity in the comprehensive electricity cost optimization algorithm. K min and K max are set according to the deviation assessment index.
K min < x ( t ) < K max P b a t t _ R T _ p l a n ( t ) = P R T _ p l a n ( t ) P D A ( t ) P b a t t _ R T _ max < P b a t t _ R T _ p l a n ( t ) < P b a t t _ R T _ max S O C ( t ) = t = 1 t P b a t t _ R T _ p l a n ( t ) Δ t / C A P b a t t _ R T
As shown in Equation (14), based on the optimization declared load P D A _ p l a n ( t ) and the optimization strategy output x ( t ) , the optimal RT load P R T _ p l a n ( t ) is solved as a control variable of the electricity retailer operation. P R T ( t ) is the actual power demand. P b a t t _ r e a l ( t ) is the actual power demand of ESD. C A P b a t t and P b a t t are the demand capacity and power of ESD, respectively.
P R T _ p l a n ( t ) = P D A _ p l a n ( t ) / x ( t ) P b a t t _ r e a l ( t ) = P R T ( t ) P R T _ p l a n ( t ) P b a t t max ( P b a t t _ r e a l ( t ) ) C A P b a t t = t = 1 24 P b a t t _ r e a l ( t ) Δ t

5. Simulation and Analysis

Previous studies on the electricity market mostly used foreign data such as PJM, which lacked relevance to China’s electricity market. In Guangdong province, trial operation of the power spot market between May and June 2019 begun. The electricity price data of five trial operation days were published by the power trading center, as shown in Figure 6a–e. According to the deviation analysis of the Guangdong power market in Section 2.2, the average deviation rate on the demand side is 10% [37]. In Figure 6f, a typical load curve of electricity retailers is shown, and the deviation is about 10 % between the forecast load P r e p and the real load P r e a l .
According to the settlement method in the Guangdong power spot market, the electricity costs of electricity retailers without any control strategies are shown in Table 4.

5.1. Case Analysis of Comprehensive Optimization Electricity Cost of Electricity Retailer

In order to improve the efficiency of the electricity retailer, the comprehensive optimization algorithm designed in Section 4.2.1 is used to realize declaration load optimization of the electricity retailer and the power control of ESD in real-time operation, which can achieve the goal of comprehensively reducing the cost of electricity purchase.

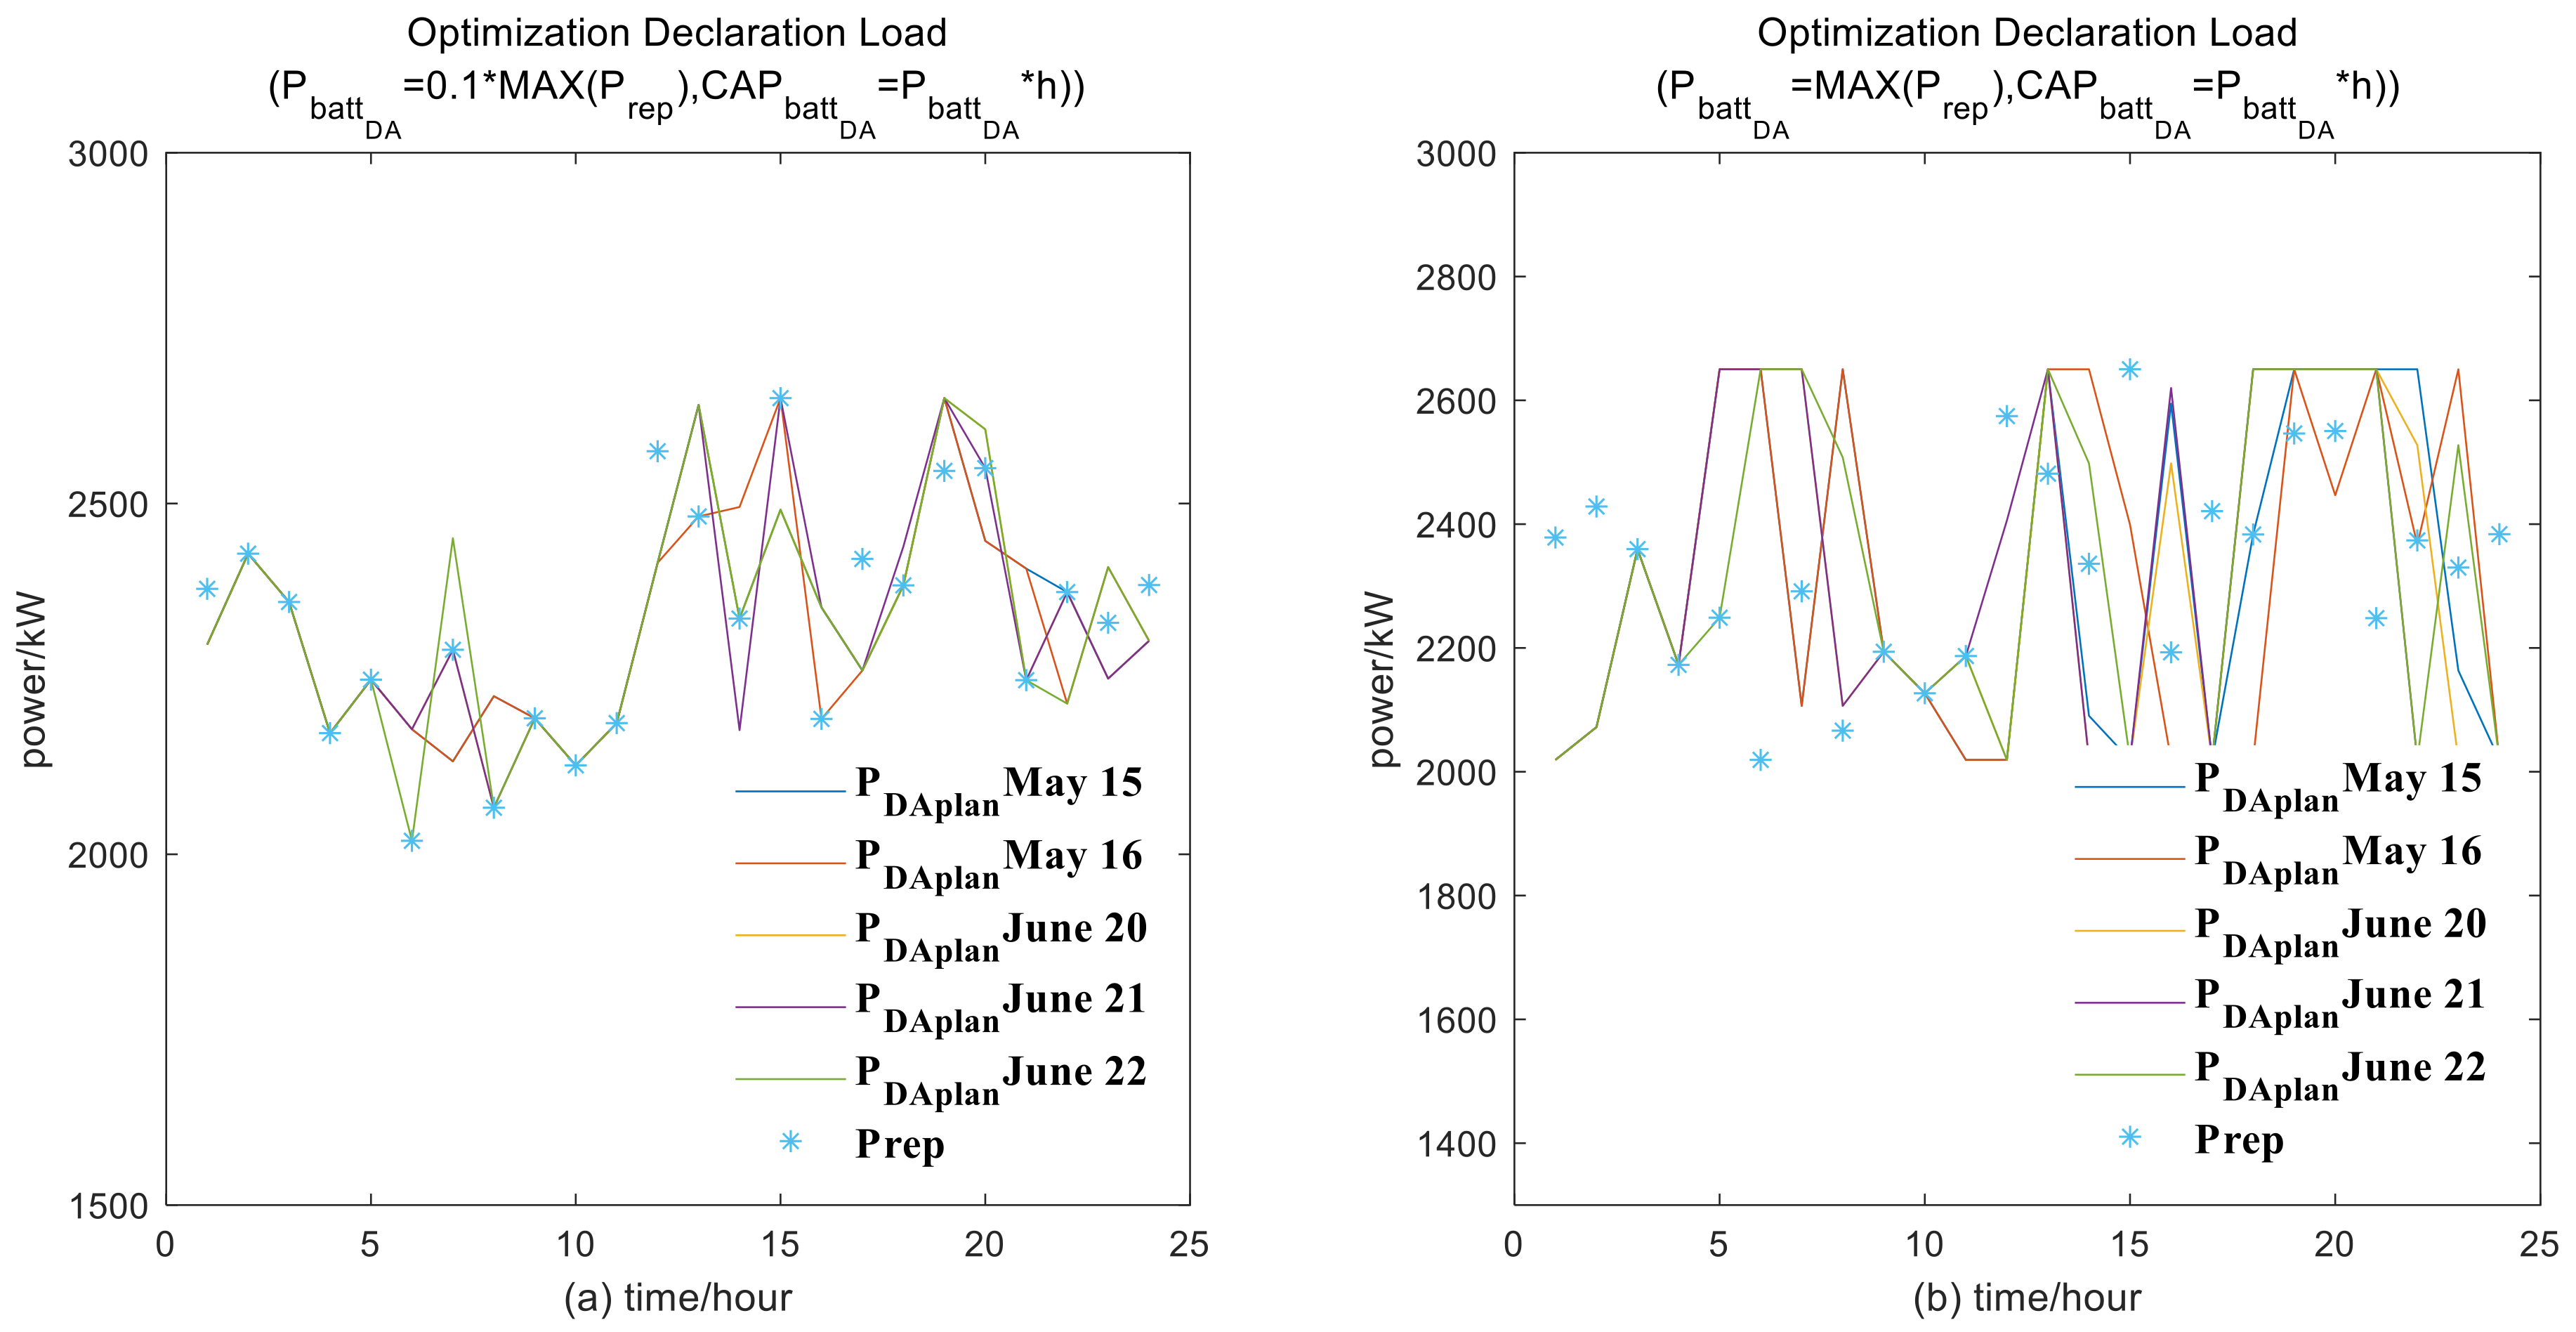
5.1.1. Analysis of the Electricity Purchase Cost with DA Electricity Cost Optimization Algorithm

1. Electricity purchase costs in DA market only by using the DA electricity cost optimization algorithm.
In Figure 6f, P D A is the DA forecast load of the electricity retailer. The constraint of ESD power configuration P b a t t _ D A is arrayed as follows: P b a t t _ D A ( n ) = 0 . 1 n max ( P r e p ) . The constraint of ESD capacity configuration C A P b a t t _ D A is arrayed as follows: C A P b a t t _ D A ( n ) = 0.1 n max ( P r e p ) 1 h . The value of n is between 1 and 10.
According to the DA electricity cost optimization algorithm strategy shown in Section 4.2.1, the optimization curve of the 24 h declared ahead load P D A _ p l a n under the trial operation price data is shown in Figure 7. Figure 7a,b show P D A _ p l a n with the storage capacity constraint and the power constraint when the value of n is 1 or 10, respectively. With the increase in ESD constraint settings, the corresponding optimization results of the DA electricity cost are shown in Figure 8. With the DA electricity cost optimization algorithm, the DA electricity tariff presents a downward trend with increases in energy storage configuration parameters.
2. Total cost of electricity purchase using only DA tariff optimization strategy.
Based on the recently declared load optimization results, the RT electricity price and deviation assessment, the RT electricity cost E R T is calculated. Due to load deviation increases as the energy storage configuration increases, which is shown in Figure 7, the deviation from P D A _ p l a n and P r e a l also increases, which result in RT electricity cost increases, as shown in Figure 9a. Since the deviation assessment is not only related to load deviation but also to the changing trend of RT and DA electricity prices, the effect of the DA electricity tariff optimization strategy on deviation assessment is uncertain, as shown in Figure 9b.
In Figure 9c, the deviation of the new electricity cost relative to the original electricity cost (shown in Table 2) is demonstrated. Due to the influence of E R T and E a l l o c a t i o n , the new electricity cost on some trial days is higher than its original electricity cost, which means that DA electricity cost optimization cannot be used on the electricity spot market settlement method.

5.1.2. Analysis of Comprehensive Electricity Cost Optimization Result

Following the process of real-time comprehensive electricity tariff optimization, based on the DA electricity cost optimization E D A and the load declaration curve P D A _ p l a n ( t ) obtained in Section 5.1.1, electricity retailers obtain RT load control curve P R T _ p l a n ( t ) by utilizing the optimization algorithm shown in Section 4.2.2 with a deviation assessment range of K ( 0.98 , 1.02 ) and deviation assessment coefficient of K e f f = 1. As shown in Figure 10a,b, the corresponding required load curves are provided with the minimum and maximum energy storage configurations, respectively. According to the load command control, the goal of minimizing the comprehensive electricity cost can be achieved.
The difference between the actual trading load and the DA declared load is shown in Figure 11a,b. The figure demonstrates that the fluctuation amplitude is effectively limited within 2% with the minimum and maximum energy storage configurations. As the deviation fluctuation is limited within the range K, the deviation assessment electricity cost E a l l o c a t i o n is always zero.
According to different energy storage configurations, the RT electricity cost E R T obtained by the comprehensive optimization method is shown in Figure 12, which is greatly reduced compared with the RT electricity cost under different operation methods shown in Table 2 and Figure 9. Compared with the original total power cost in Table 2, the power cost with comprehensive optimization strategy is significantly reduced. The reduction value increases with an increase in energy storage configurations, as shown in Figure 13.

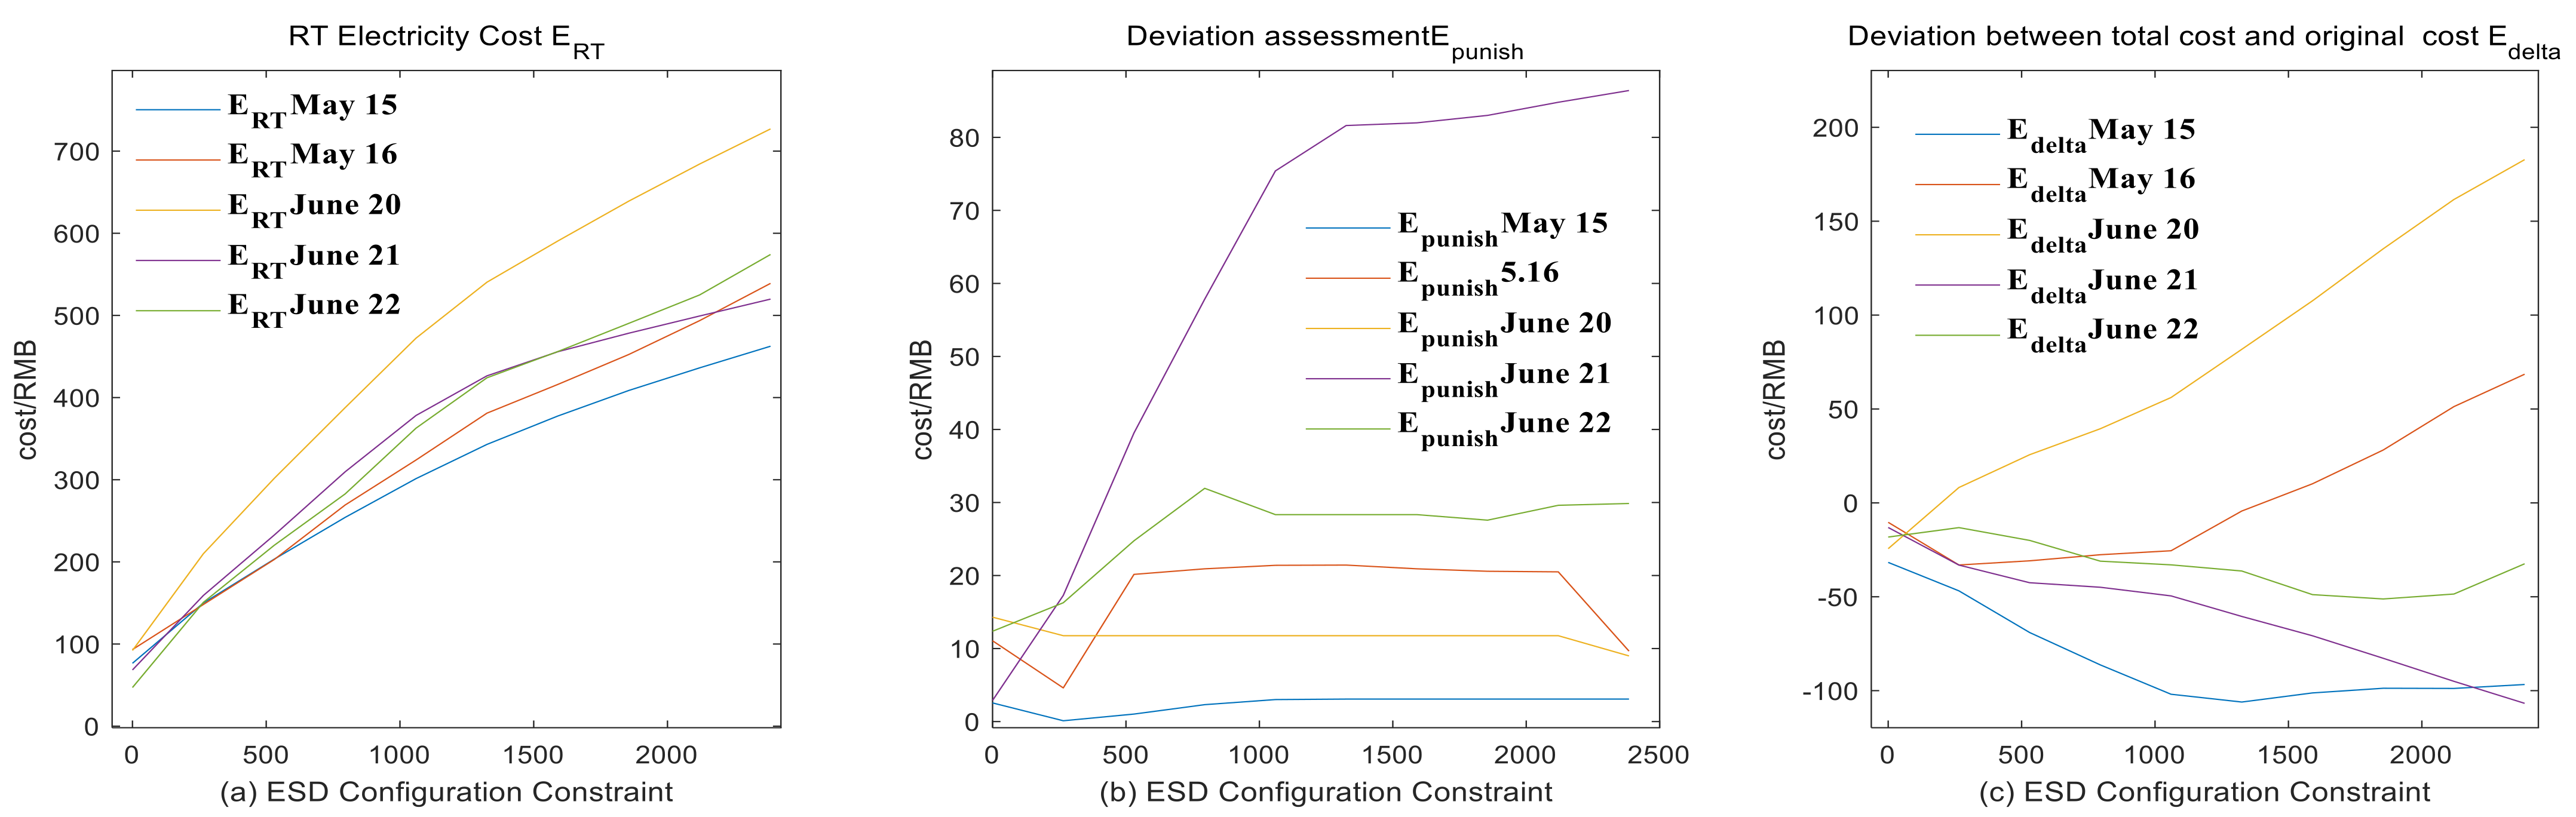
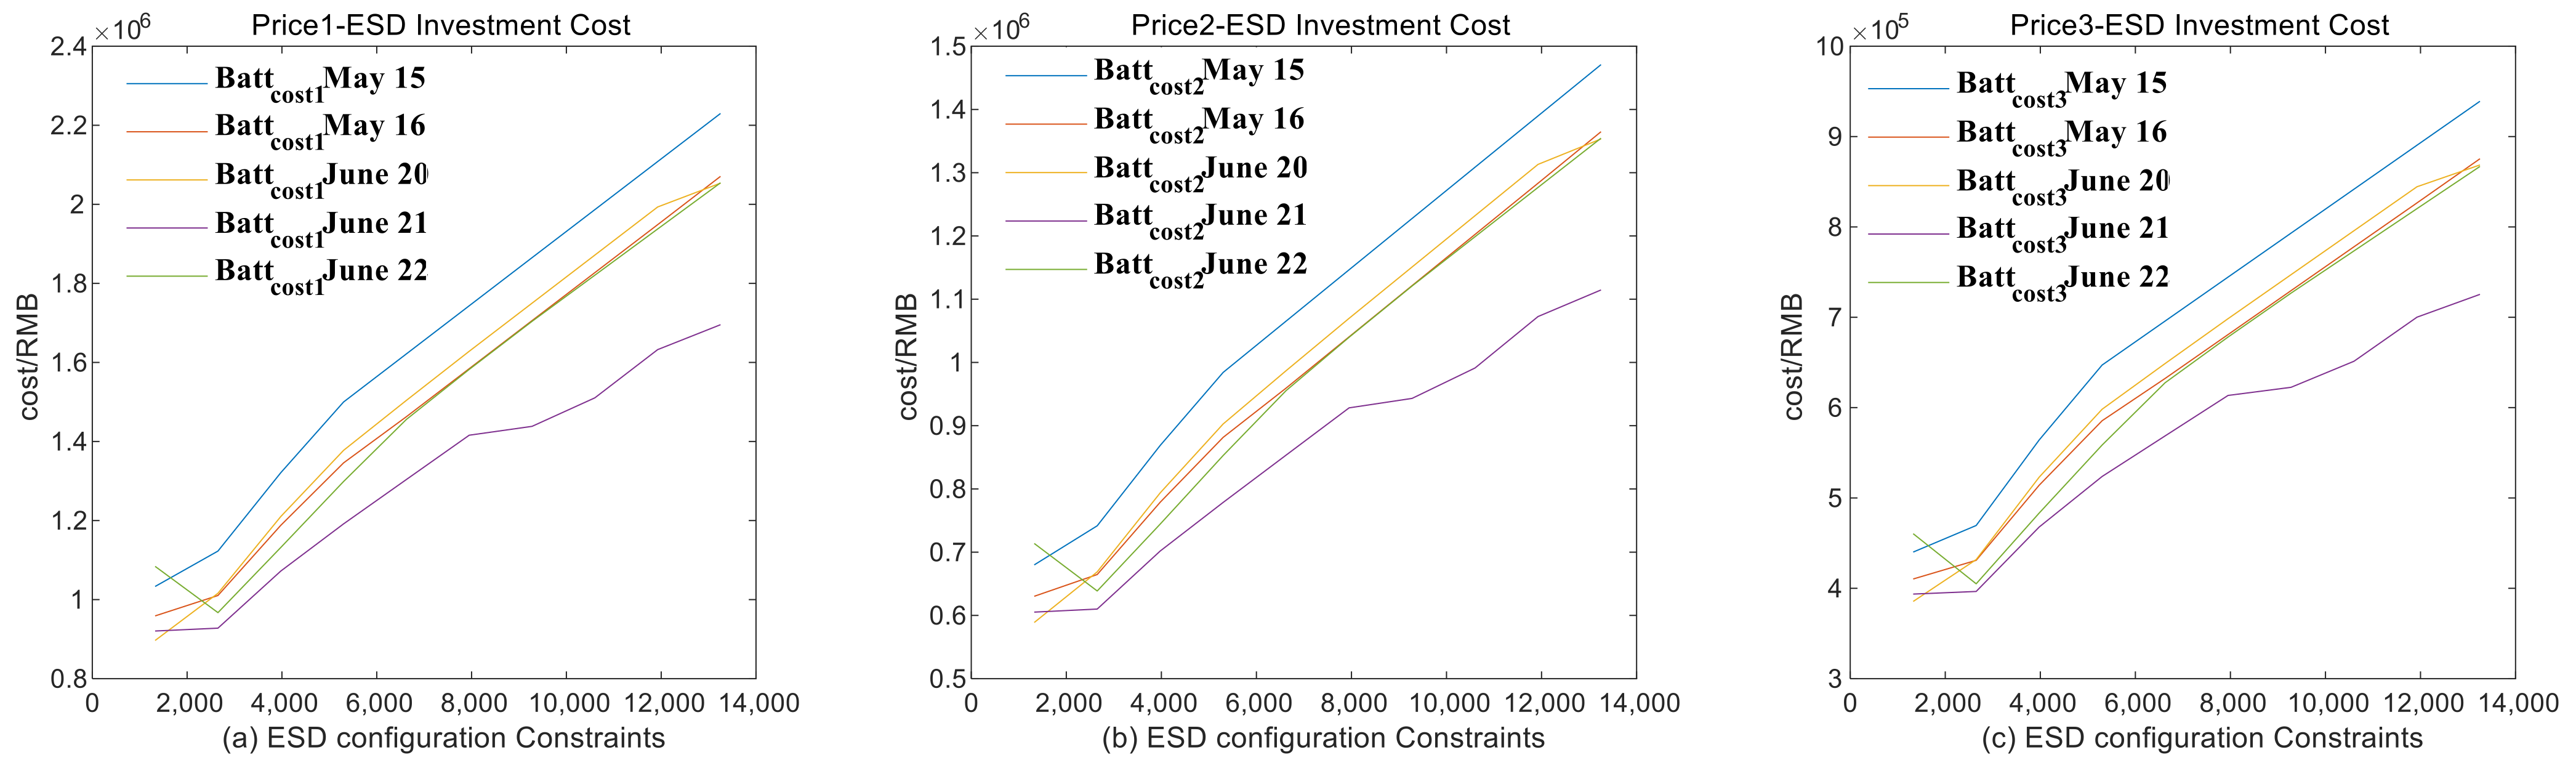
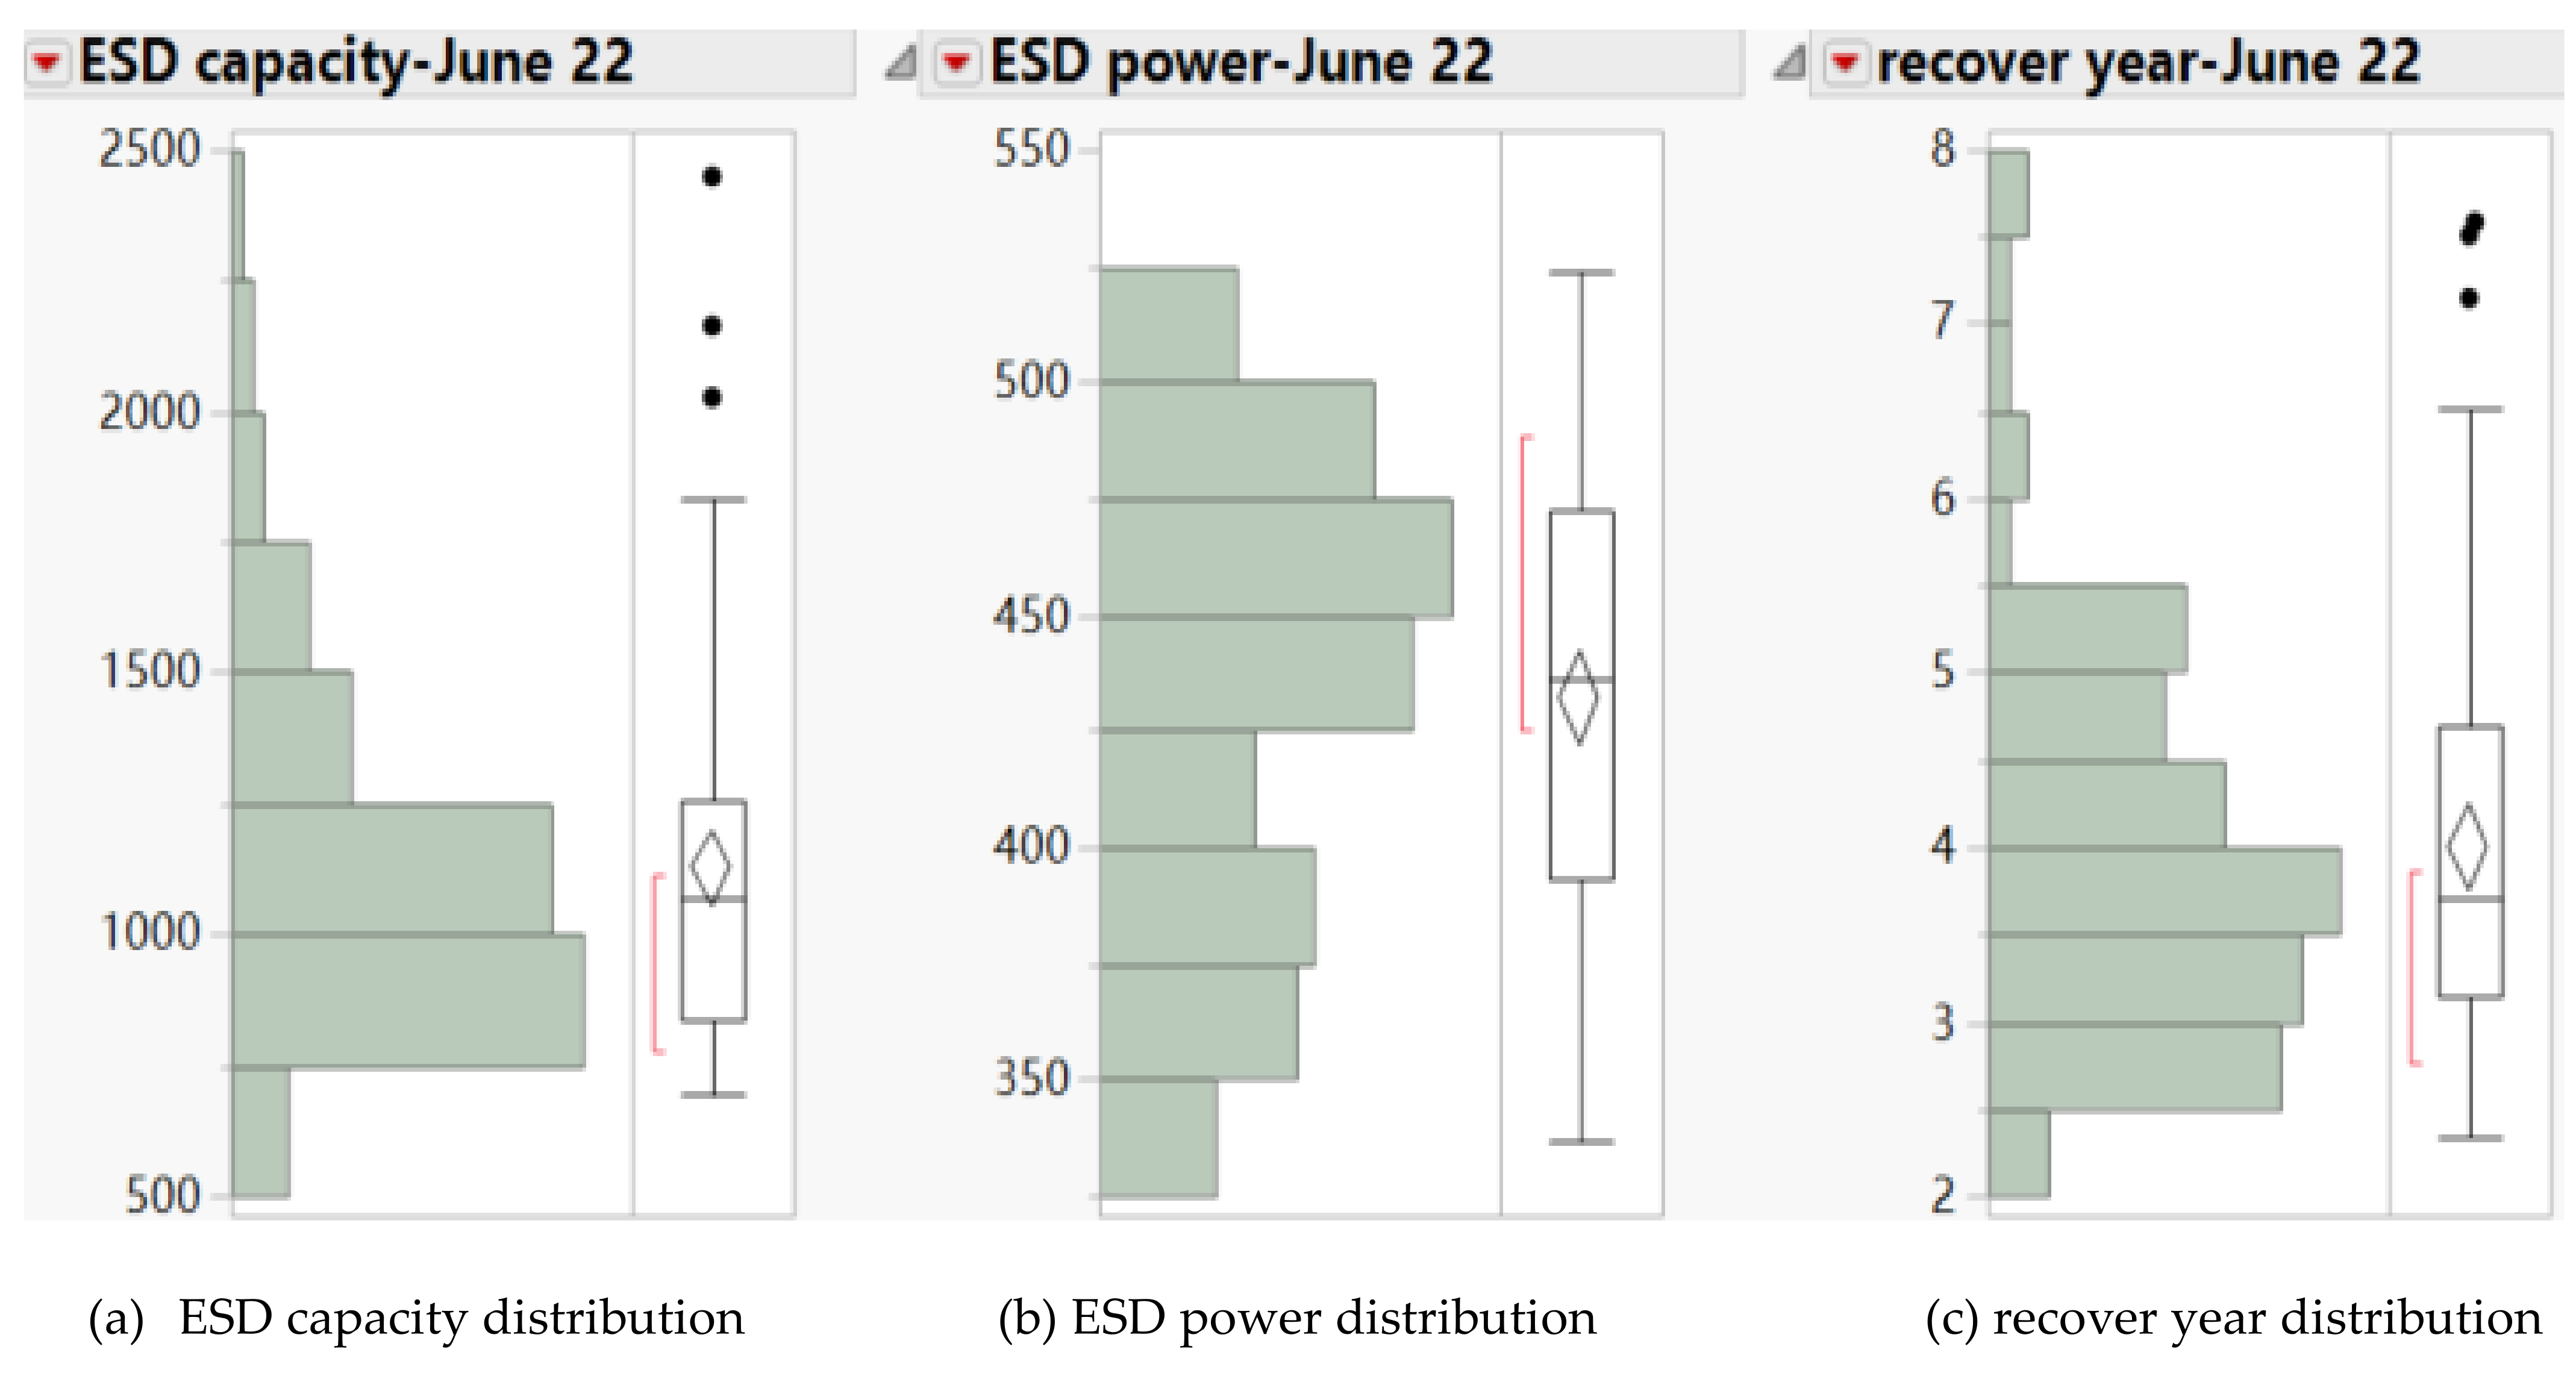
5.1.3. Economic Analysis of ESD under Comprehensive Optimization Algorithm

According to the analysis results in Section 5.1.2, it is verified that the comprehensive optimization method can effectively reduce the cost of electricity purchase. Since the goal of this optimization method is to minimize electricity costs, its calculation is based on the DA load forecast P r e p for which its error is inevitable [37]. In the comprehensive optimization algorithm, P b a t t _ R T and C A P b a t t _ R T are configuration constraints of ESD in Equation (13). By utilizing the comprehensive optimization algorithm, P b a t t and C A P b a t t are the actual power and capacity demand of ESD shown in Equation (14), which increases with the increase in configuration constraint ranges, as shown in Figure 14a. Due to the restriction of deviation constraint condition K, the maximum value of P b a t t is max ( P b a t t ) < K max ( P D A _ p l a n ( t ) ) , as shown in Figure 14b.
The unit prices of ESD capacity and power are shown in Table 5. According to configuration of required ESD and different price in Table 5, the initial ESD investment cost is shown in Figure 15a–c. The recovery period of ESD investment is calculated by the electricity cost saved, which is shown in Figure 13, by utilizing the comprehensive optimization algorithm.
In order to obtain the economics of the energy storage device, the relative relationship between the investment cost of the energy storage device and the electricity cost savings is analyzed [33]. When the capacity configuration constraint is 8000 kWh, the cost recovery years tend to be stable under three different price in Table 5, as shown in Figure 16a–c. In Table 6, the cost recovery period, which is the optimization result with a typical load curve, trial operation electricity prices and three ESD prices are shown. The system can recover investment costs in 3 to 5 years with the third ESD price.

5.2. Effectiveness Verification of Comprehensive Optimization Algorithm with Different Deviation Assessment

Section 2.2 introduced power market policies in different regions of China in which the ranges of deviation assessment and the assessment price are different, and they are adjusted according to the actual situation. For example, in Guangdong province, the range of deviation assessment was relaxed from ±2% to ±4%.
Take the price data in 15 May 2019 as an example, in the comprehensive optimization algorithm, K min and K max are set to ±2% or ±4%, respectively. K f e e is set to one or two, respectively. Table 7 shows the changes of electricity cost under different deviation assessment policies. It can be observed that the optimization algorithm effectively controls the deviation range between the RT load and the DA declared load. Thus, the deviation assessment cost is always zero. The deviation assessment coefficient has no impact. With the reduction in deviation assessment range, the increase in electricity cost in the RT market results in the increase in total electricity cost.

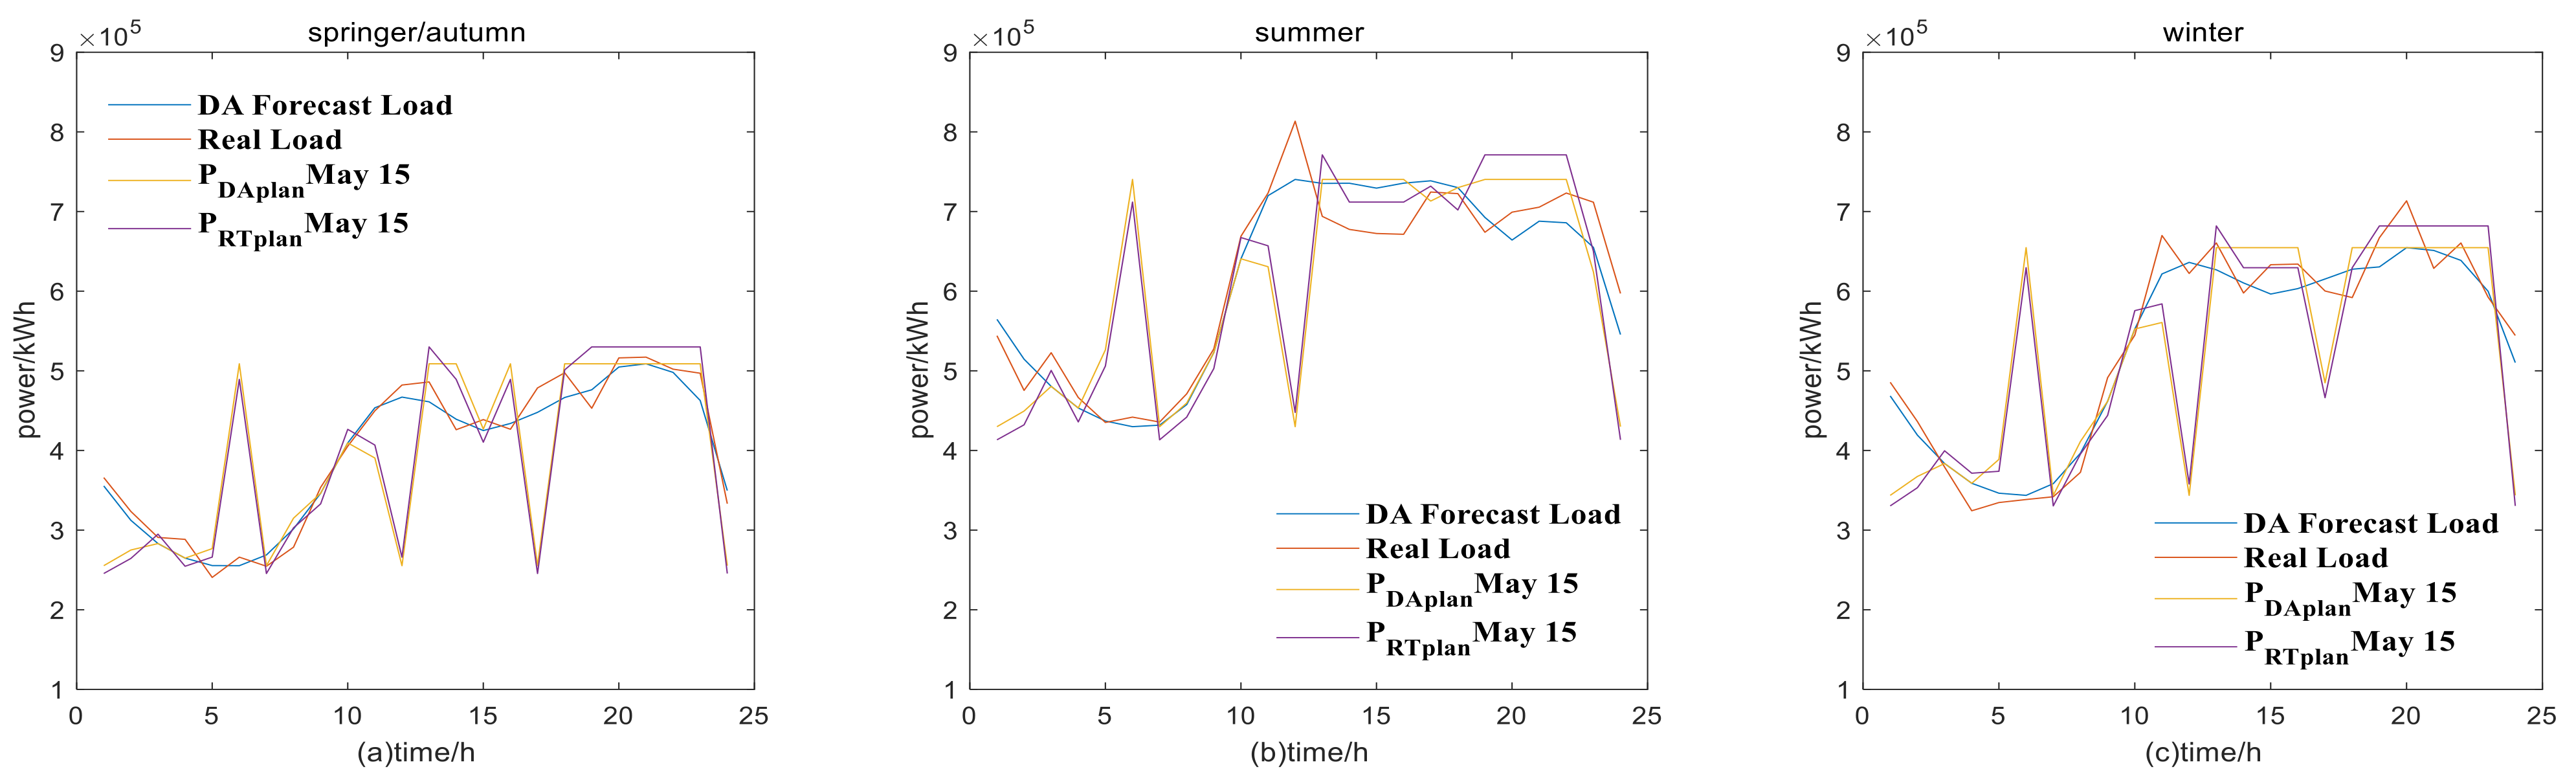
5.3. Effectiveness Verification of Comprehensive Optimization Algorithm with Typical Load in Four Seasons

In order to verify the effectiveness of the comprehensive optimization algorithm for different seasonal loads, the electricity cost based on the typical load of four seasons of the tertiary industry in a Chinese province is calculated. As shown in Table 8, taking the price data in 15 May 2019, there are various electricity costs of the typical loads during the four seasons without utilizing the optimization algorithm.
Figure 17a–c shows the typical load and RT load of four seasons in turn. And the appropriate DA declaration loads and real-time settlement loads obtained by utilizing the comprehensive optimization are shown.
According to the DA electricity price, the daily declared load curve is optimized to effectively reduce the daily electricity cost. The real-time settlement load is optimized according to RT electricity price. Electricity cost in the RT market is effectively reduced, and load fluctuation is smaller than the deviation assessment range by utilizing optimization control, which resulted in a deviation assessment cost that is always zero. The corresponding electricity cost in Table 9 is significantly lower than that in Table 8.

5.4. Effectiveness Verification of Comprehensive Optimization Algorithm with Random Load

In Section 4.1, the energy storage system can recover costs based on the typical load curve calculation of 10% forecast deviation. In order to verify the feasibility of the comprehensive optimization algorithm with random conditions of load forecast errors, 10% random error between DA forecast load curve and RT load demand curve is used to optimize the power purchase cost. As a result, electricity costs, capacity and power configuration of ESD and cost recovery period are saved.
By utilizing the comprehensive optimization algorithm, 100 sets of random load curve data are generated to obtain the calculation results, such as ESD capacity demand, ESD power demand and recovery year, with electricity prices in 22 June which is shown in turn in Figure 18a–c with an outlier box plot. The average recovery period is 5 years. By using the comprehensive optimization algorithm, the average values of ESD configuration capacity, power and cost recovery period obtained with five trial electricity price data and the same random load curves are obtained, as shown in Table 10.

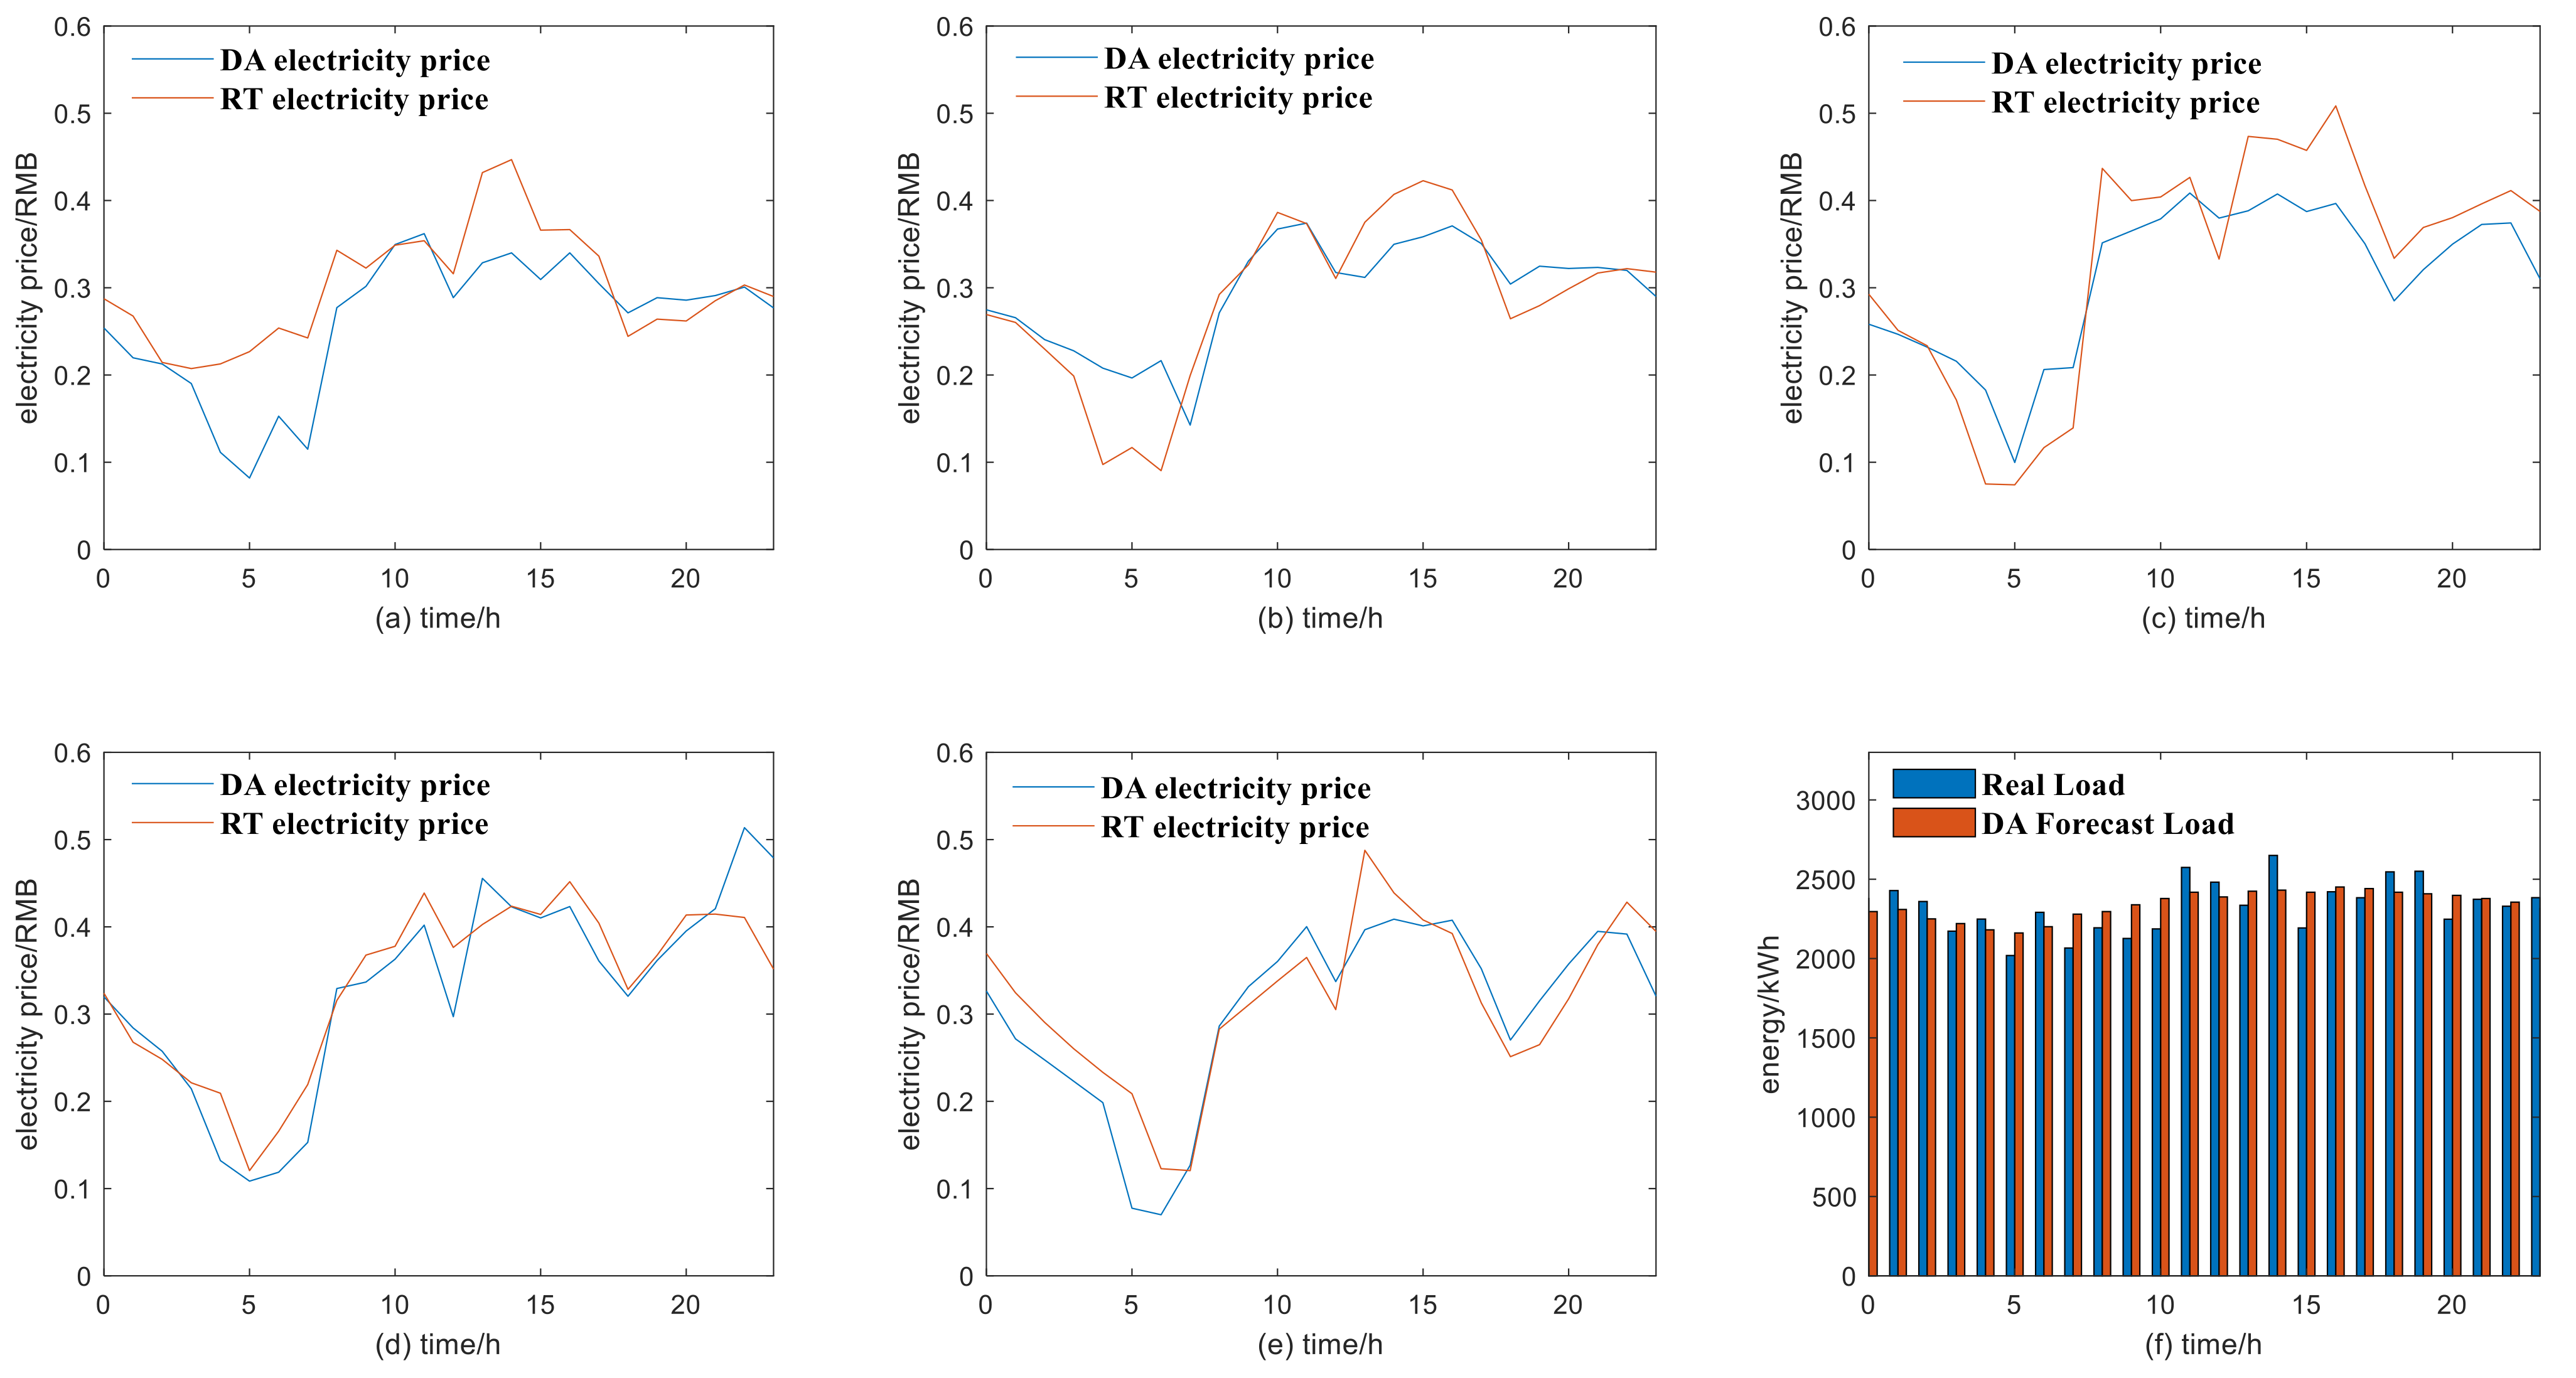
5.5. Effectiveness Verification of Comprehensive Optimization Algorithm with Random Electricity Price

In Figure 19a–e, the deviations of the DA electricity price and RT electricity price of five trial electricity price data used in this paper are shown. In Table 11, the average, maximum and minimum values of electricity price deviation are shown.
Electricity price fluctuations are random data for an electricity retailer. Considering that there are few trial operation electricity price data shown above, according to the deviation characteristics of electricity price data in Figure 19, five types of random data are shown, which include 100 sets of randomly distributed electricity price data based on the same mean and limit range of five trial electricity price data. Based on the typical load data, the average recovery years by utilizing the comprehensive optimization algorithm are shown in Table 12. This proves that the comprehensive optimization algorithms can save electricity purchase costs with different electricity price data.

6. Conclusions

This paper studies the negative impact of ESD operation strategy and the cost of electricity retailers after the operation of the spot market in China. This paper introduces the settlement rules of the Guangdong Electric Power Trading Center in detail and proposes a comprehensive power cost optimization algorithm. This method is suitable for the settlement process of the spot market of electric power. It realizes DA electricity cost optimization in the DA market. Then, through the constraint of deviation between DA declaration load and RT settlement load, the algorithm obtains an RT settlement load, which realizes the comprehensive optimization of RT electricity cost and deviation assessment. This method can effectively reduce the cost of electricity retailers. This method can be applied to a centralized power market with two-stage transactions. According to different policies, the ESD cost and load forecasting accuracy, the algorithm can adjust the relevant parameters in the optimization algorithm. Then, the algorithm can obtain the amount of electricity saved, the ESD configuration parameters and its cost recovery period. The algorithm can effectively reduce the power cost of the electricity retailer and avoid additional expenditures caused by load forecast errors. According to the unit capacity price of 600 CNY/kWh, the unit power price of 300 CNY/kW and random load fluctuation within 10%, the cost of ESD can be recovered within 5 years.
According to the review of power market policies and development in many countries and regions, due to unexpected situations such as fluctuations of renewable energy and COVID-19 in recent years, abnormal fluctuations of RT electricity prices and the decline of load forecasting accuracy have caused great difficulties for electricity retailers. The difference and uncertainty of deviation assessment policy also put forward higher requirements for electricity retailers. In the process of market operation, third-party electricity retailers without monopoly resources need to continuously improve their advancement and adaptability in market changes through technological progress. The effectiveness of the comprehensive optimization algorithm is verified under the scenarios of different load periods, different deviation assessment policies, random load fluctuations and random RT electricity price fluctuations. In this paper, an effective solution for electricity retailers to confront the uncertainty of the electricity spot market is presented.

Author Contributions

Conceptualization, T.L.; methodology, T.L.; software, T.L.; validation, T.L., and W.Z.; formal analysis, T.L.; investigation, X.D.; resources, W.Z.; data curation, T.L.; writing—original draft preparation, T.L.; writing—review and editing, T.L.; visualization, T.L.; supervision, W.Z.; project administration, W.Z.; funding acquisition, X.D. All authors have read and agreed to the published version of the manuscript.

Funding

This research received no external funding.

Institutional Review Board Statement

Not applicable.

Informed Consent Statement

Not applicable.

Data Availability Statement

Exclude this statement.

Acknowledgments

This work was financially supported by the National Key Research and Development Project of China (research and development of seed breeding technology and equipment, 2017YFD0701200). We thank Guoying Li for its fund and investigation assistance during the preparation of this manuscript. All supports and assistance are sincerely appreciated.

Conflicts of Interest

The authors declare no conflict of interest.

Abbreviations and Variables

Abbreviations
ESDEnergy storage devices
DADay-ahead
RTReal-time
VPPVirtual power plant
MILPMixed integer linear programming
Variables and parameters
C D A Electricity price in day-ahead market
C R T Electricity price in real-time market
C c o n _ R T Peak-valley price
C A P b a t t _ D A ESD capacity demand in DA market optimization
C A P b a t t _ R T ESD capacity demand in RT market optimization
C A P b a t t Total ESD capacity demand
E cos t The daily electricity fee settlement
E a l l o c a t i o n Deviation assessment cost
E D A Electricity fee in DA market
E R T Electricity fee in RT market
E p a r t 1 The first component of E a l l o c a t i o n
E p a r t 2 The second component of E a l l o c a t i o n
P b a t t _ D A _ p l a n The ESD power demand in DA market optimization
P b a t t _ D A _ max Upper limit of P b a t t _ D A _ p l a n ( t )
P b a t t _ R T _ p l a n The ESD power demand in RT market optimization
P b a t t _ R T _ max Upper limit of P b a t t _ R T _ p l a n ( t )
P b a t t _ r e a l The actual power command of ESD
P cos t Power supplied by state grid
P D A The declared load in DA market based on the load forecast data
P D A _ p l a n The optimized value of the declared load in DA market
P R T The actual load in RT market
P R T _ p l a n The optimized value of the RT load
P r e p Forecast load
P l o a d Consumer side load curve
P b a t t ESD power
S O C ( t ) Charged state of an energy storage battery
x ( t ) The ratio of P D A _ p l a n to P R T _ p l a n ( t )
K The deviation assessment range in optimization algorithm
K min The lower limit of x ( t )
K max The upper limit of x ( t )
Q D A Declaration load of DA market
Q R T RT load demand of electricity retailer
λ 0 Deviation assessment range of policy
K f e e Deviation assessment price coefficient
Index
t Settlement time step
N Number of Planned days

Appendix A

Table A1. DA electricity price.
HourMay 15
(CNY/kWh)
May 16
(CNY/kWh)
June 20
(CNY/kWh)
June 21
(CNY/kWh)
June 22
(CNY/kWh)
00.2540.2750.2580.3240.326
10.2200.2650.2470.2680.272
20.2130.2400.2320.2480.247
30.1900.2270.2160.2210.223
40.1110.2080.1830.2090.199
50.0820.1960.1000.1210.078
60.1530.2190.2060.1660.070
70.1150.1390.2080.2190.127
80.2770.2860.3510.3160.286
90.3020.3350.3650.3680.331
100.3500.3720.3790.3780.360
110.3620.3740.4090.4390.400
120.2890.3110.3800.3760.337
130.3290.3130.3880.4030.397
140.3400.3550.4070.4240.409
150.3090.3600.3870.4140.401
160.3400.3740.3970.4520.408
170.3050.3450.3500.4040.352
180.2710.2980.2850.3280.270
190.2890.3320.3210.3670.315
200.2860.3210.3500.4140.357
210.2910.3240.3730.4150.395
220.3010.3200.3740.4110.392
230.2770.2840.3100.3520.321
Table A2. RT electricity price.
HourMay 15
(CNY/kWh)
May 16
(CNY/kWh)
June 20
(CNY/kWh)
June 21
(CNY/kWh)
June 22
(CNY/kWh)
00.2870.2690.2930.3200.370
10.2680.2600.2510.2840.324
20.2140.2300.2330.2570.291
30.2070.1990.1710.2140.260
40.2130.0970.0750.1320.233
50.2270.1170.0740.1090.209
60.2540.0900.1170.1190.123
70.2420.1990.1390.1530.121
80.3430.2920.4370.3290.283
90.3230.3260.4000.3370.310
100.3490.3860.4040.3630.338
110.3540.3730.4260.4020.365
120.3160.3110.3330.2970.305
130.4320.3750.4730.4560.488
140.4470.4070.4700.4230.439
150.3660.4230.4570.4100.408
160.3670.4120.5080.4230.392
170.3360.3550.4170.3610.313
180.2440.2640.3340.3200.251
190.2640.2800.3690.3610.265
200.2620.2990.3800.3950.318
210.2850.3170.3960.4210.380
220.3030.3220.4110.5140.428
230.2900.3180.3870.4790.395
Table A3. Consumer typical load in Guangdong province.
HourReal Load/kWhForecast Load/kWh
02526.752296.3
12539.922309.47
22474.072250.21
32437.862220.58
42395.062181.07
52375.312161.32
62418.112200.82
725072279.84
82530.042296.3
92569.552339.09
102615.642378.6
112658.442418.11
122628.812388.48
132665.022424.69
142678.192431.28
152661.732418.11
162691.362451.03
172681.482441.15
182658.442418.11
192645.272408.23
202638.682398.35
212615.642378.6
222592.592355.56
232549.792316.05
Table A4. Typical load of a province in four seasons.
HourSpring/Autumn LoadSummer LoadWinter Load
1355451564621468466
2312280514612419273
3283109480451383623
4264807453275358761
5255471436940346327
6255341429871343613
7268795431788358339
8301551457646396627
9346249523007461771
10409459640632552525
11453593719997621665
12467014740300636119
13461097735308626799
14439215735509610328
15424986729357596403
16433901735630603235
17447888738553615303
18466494730022627561
19476206692555630476
20504771664214654616
21508813687881651127
22498017685875638631
23462737655001599842
24349613545541510307

References

  1. Energy Bureau of Guangdong Province, South China Supervision Bureau of National Energy Administration. Notice on the Daily Trial Settlement of the Southern Power Spot Market (Starting from Guangdong Province); Guangdong Electric Power Trading Center Co., Ltd.: Guangdong, China, 2019. [Google Scholar]
  2. Song, Y.; Bao, M.; Ding, Y.; Shao, C.; Shang, N. Review of Chinese Electricity Spot Market. Key Issues and Its Suggestions under the New Round of Chinese Power System Reform. Proc. CSEE 2020, 40, 3172–3187. [Google Scholar]
  3. Luo, S.; Wang, X.; Yang, M.; Wang, J.; Yin, S. Power Trading Strategy and Risk Assessment of Electricity Retailing Company Under Power System Reform. Power Syst. Technol. 2019, 43, 944–953. [Google Scholar]
  4. Emarati, M.; Keynia, F.; Rashidinejad, M. A two-stage stochastic programming framework forrisk-based day-ahead operation of a virtual power plant. Int. Trans. Electr. Energy Syst. 2020, 30, e12255. [Google Scholar] [CrossRef]
  5. Çanakoğlu, E.; Adıyeke, E. Comparison of Electricity Spot Price Modelling and Risk Management Applications. Energies 2020, 13, 4698. [Google Scholar] [CrossRef]
  6. Guo, H.; Gao, R.; Yang, P.J. Two-stage Dispatch of Microgrid Based on CVaR Theory Under Electricity Spot Market. Power System Technology 2019, 43, 2665. [Google Scholar]
  7. Gao, R.; Guo, H.; Zhang, R.; Mao, T. A Two-Stage Dispatch Mechanism for Virtual Power Plant. Utilizing the CVaR Theory in the Electricity Spot Market. Energies 2019, 12, 3402. [Google Scholar] [CrossRef] [Green Version]
  8. Najafi, A.; Tavakoli, A.; Pourakbari-Kasmaei, M.; Lehtonen, M. A risk-based optimal self-scheduling of smart energy hub in the day-ahead and regulation markets. J. Clean. Prod. 2021, 279, 123631. [Google Scholar] [CrossRef]
  9. Wang, L.; Zhang, L.; Zhang, F.; Jin, D. Decision-making and Risk Assessment of Purchasing and Selling Business for Electricity Retailers. Autom. Electr. Power Syst. 2018, 42, 143. [Google Scholar]
  10. Ren, Y.; Zhou, M.; Li, G. Bi-level Model of Electricity Procurement and Sale Strategies for Electricity Retailers Considering User’ Demand Response. Autom. Electr. Power Syst. 2017, 41, 30–36. [Google Scholar]
  11. Kettunen, J.; Salo, A.; Bunn, D.W. Optimization of Electricity Retailer’s Contract Portfolio Subject to Risk Preferences. IEEE Trans. Power Syst. 2010, 25, 117–128. [Google Scholar] [CrossRef]
  12. GAO, R. Research on Control. Strategy of Spot Market. Deviation of Electricity Sales Company Based on User-Side Adjustable Resources. Electr. Power Constr. 2019, 40, 114–122. [Google Scholar]
  13. Li, P.; Han, P.; Zheng, M.; Huang, M.; Sun, J. Short-Term Load Forecasting of Smart Grid Based on Long-Short-Term Memory Recurrent Neural Networks in Condition of Real-Time Electricity Price. Power Syst. Technol. 2018, 42, 4045–4052. [Google Scholar]
  14. Wei, Q.; Chen, S.; Huang, W.; Ma, G.; Tao, C. Forecasting Method of Clearing Price in Spot Market by Random Forest Regression. Proc. CSEE 2021, 41, 1360–1367. [Google Scholar]
  15. Bo, L. Model and Application of Electricity Procurement and Sale Strategies for Electricity Retailers Considering Demand Response and Price Uncertainties; Chongqing University: Chongqing, China, 2018. [Google Scholar]
  16. Yang, M.; Tang, L.; Guo, S.; Luo, G. Optimal Trading Strategy in Balancing Market for Electricity Retailer Considering Risk Aversion. Power Syst. Technol. 2016, 40, 29–38. [Google Scholar]
  17. Liangyuan, F.S. Trading Model in Balanced Market. for Power Retailers Considering Risk Aversion. Proc. CSU-EPSA 2020, 32, 22–27. [Google Scholar]
  18. Yicheng, Y.L. Optimal Model for CCHP of Power Retailer Considering the Daily Deviation Penalty. Electr. Power Constr. 2020, 41, 98–105. [Google Scholar]
  19. Rui, M.J. Optimal Model for Daily Deviation Penalty of Electricity Retailer Considering Real-time Electricity Trading. Electr. Power Constr. 2019, 40, 11–19. [Google Scholar]
  20. Mingzheng, T.W. Combine the day-ahead market and real-time market optimization of electric vehicles. Heilongjiang Electr. Power 2018, 40, 461–466. [Google Scholar]
  21. Xiaofeng, G.K. Optimization Strategy of Incentive-based Demand Response for Electricity Retailer in Spot Market Environment. Autom. Electr. Power Syst. 2020, 44, 28–37. [Google Scholar]
  22. Song, H.; Liu, Y.; Liu, J.; Wang, L.; Li, C.; Liu, J. Intelligent Dynamic Pricing of Electricity Retailers Considering Distributed Energy Storage Interaction on User Side. Proc. CSEE 2020, 40, 7959–7972. [Google Scholar]
  23. Mirhoseini, P.; Ghaffarzadeh, N. Economic battery sizing and power dispatch in a grid-connected charging station using convex method. J. Energy Storage 2020, 31, 101651. [Google Scholar] [CrossRef]
  24. Zhang, T.; Wang, L.; Wang, Y.; Lei, S. Multi-Objective Optimal Dsipatching Model of Electricity Retailers with Distributed Generator under Energy Deviation Penalty. Trans. China Electrotech. Soc. 2019, 34, 3265–3274. [Google Scholar]
  25. Rassaei, F.; Soh, W.S.; Chua, K.-C. Distributed Scalable Autonomous Market-Based Demand Response via Residential Plug-In Electric Vehicles in Smart Grids. IEEE Trans. Smart Grid 2016, 9, 3281–3290. [Google Scholar] [CrossRef]
  26. He, Y.; Han, A. Short-Term Power Load Probability Density Forecasting Method Based on Real Time Price and Support Vector Quantile Regression. Proc. CSEE 2017, 37, 768–776. [Google Scholar]
  27. Long, S.; Xu, J.; Yang, Z.; Feng, S. Research on Unbalanced Cost Composition and Allocation Mechanism in Spot Electricity Market. Power Syst. Technol. 2019, 43, 2649–2657. [Google Scholar]
  28. Li, J.X. Electricity Regulatory Mechanisms in Australia and Its Enlightenment to China. Autom. Electr. Power Syst. 2021, 45, 1–12. [Google Scholar]
  29. Guangdong Electric Power Trading Center Co., Ltd. Basic Rules of Guangdong Electricity Market Trading; Southern Energy Regulatory Bureau: Guangdong, China; Guangdong Provincial Economic and Information Technology Commission: Guangdong, China; Guangdong Provincial Development and Reform Commission: Guangdong, China, 2018. [Google Scholar]
  30. Guangdong Electric Power Trading Center Co., Ltd. System Operation Management Implementation Rules; Guangzhou Power Exchange Center: Guangdong, China; Southern Energy Regulatory Bureau: Guangdong, China; Guangdong Provincial Economic and Information Technology Commission: Guangdong, China; Guangdong Provincial Development and Reform Commission: Guangdong, China, 2018. [Google Scholar]
  31. Guangdong Electric Power Trading Center Co., Ltd. Transaction Settlement Rules; Guangzhou Power Exchange Center, Ed.; Southern Energy Regulatory Bureau: Guangdong, China; Guangdong Provincial Economic and Information Technology Commission: Guangdong, China; Guangdong Provincial Development and Reform Commission: Guangdong, China, 2018. [Google Scholar]
  32. Energy Bureau of Guangdong Province, South China Supervision Bureau of National Energy Administration. Guangdong Spot Electricity Market Trading Implementation Rules; Guangdong Electric Power Trading Center Co., Ltd.: Guangdong, China, 2018. [Google Scholar]
  33. Xue, J.; Tao, Q.; Wang, D.; Sang, B.; Yang, B. Economic Feasibility of User-Side Battery Energy Storage Based on Whole-Life-Cycle Cost Model. Power Syst. Technol. 2016, 40, 2471–2476. [Google Scholar]
  34. Guangdong Electric Power Market. 2018 Annual Report; Guangzhou Power Exchange Center: Guangdong, China, 2018. [Google Scholar]
  35. Weixin, H.S. Negative Price in National Electricity Market of Australia and its Enlightenment. Sino-Glob. Energy 2021, 26, 1–8. [Google Scholar]
  36. Guoqiang, L.Q. Impact of COVID-19 on China’s Total Electricity Consumption in 2020 and Its Trend. Electr. Power Constr. 2020, 53, 248–257. [Google Scholar]
  37. Zhang, J. Research on Hybrid Forecasting Model of Short Term Eleetricity Price in Electricity Market Environment; North China Electric Power University: Beijing, China, 2011. [Google Scholar]
  38. Kazempour, J.; Hobbs, B.F. Value of Flexible Resources, Virtual Bidding, and Self-Scheduling in Two-Settlement Electricity Markets with Wind Generation—Part I: Principles and Competitive Model. IEEE Trans. Power Syst. 2018, 33, 749–759. [Google Scholar] [CrossRef] [Green Version]
Figure 1. Schematic diagram of demand-side operations with ESD under peak-valley electricity prices.
Energies 14 06424 g001
Figure 2. Electricity demand-side deviation rate of Guangdong province in 2018. Figure reference: Guangdong Electric Power Trading Center: 2018 annual report of Guangdong electric power market.
Energies 14 06424 g002
Figure 3. Electricity demand-side deviation rate of Guangdong province in 2019. Figure reference: Guangdong Electric Power Trading Center: 2019 annual report of Guangdong electric power market.
Energies 14 06424 g003
Figure 4. Time flow of electricity cost settlement in spot market. Figure reference: Guangdong Electric Power Trading Center: detailed rules for the implementation of spot electric energy market transactions in Guangdong and detailed rules for the implementation of transaction settlement in Guangdong electric power market, November 2018.
Energies 14 06424 g004
Figure 5. State flow of total electricity cost optimization algorithm of electricity retailers.
Energies 14 06424 g005
Figure 6. Electricity price curve and typical load curve in Guangdong electricity spot market. Figure reference: Figure (ae): Network public data of electricity price; refer to Appendix A Table A1 and Table A2. Figure (f): Network public data of typical load curve of load consumer in Guangdong; refer to Appendix A Table A3.
Energies 14 06424 g006
Figure 7. Optimization of DA declared load curve.
Energies 14 06424 g007
Figure 8. DA electricity cost optimization results.
Energies 14 06424 g008
Figure 9. Trends of RT electricity cost, deviation assessment and total cost with DA optimization algorithm.
Energies 14 06424 g009
Figure 10. Load control command on real-time operation day.
Energies 14 06424 g010
Figure 11. Deviation between real-time load and DA declared load.
Energies 14 06424 g011
Figure 12. RT electricity cost optimization results.
Energies 14 06424 g012
Figure 13. Decreased amplitude of total electricity cost with comprehensive optimization.
Energies 14 06424 g013
Figure 14. Actual configuration requirements of energy storage device.
Energies 14 06424 g014
Figure 15. Initial investment cost of ESD with different unit price.
Energies 14 06424 g015
Figure 16. ESD investment recovery period by using the comprehensive optimization algorithm.
Energies 14 06424 g016
Figure 17. Typical load, RT load, DA load and RT settlement load during the four seasons. Figure reference: P r e p refers to Appendix A Table A4.
Energies 14 06424 g017
Figure 18. Box plot of ESD capacity demand, ESD power demand and recovery year based on random load.
Energies 14 06424 g018
Figure 19. Distribution of deviation between DA electricity price and RT electricity price.
Energies 14 06424 g019
Table 1. Deviation assessment range in different regions.
Deviation Assessment Range:  λ 0 <−5%<−5% or >5%<−4% or >4%<−3% or >3%
RegionsGuizhou, Shaanxi, Zhejiang, Inner Mongolia, Beijing, Tianjin, Tangshan, northern Hebei, JilinHenan, Beijing, Xinjiang, Liaoning, Jiangxi, Guangxi, Heilongjiang, Qinghai, NingxiaGuangdong, Hainan, Shanghai (July to September)Sichuan, Fujian, Hubei, Chongqing, Hunan, Yunnan, Jiangsu
Deviation Assessment Range:  λ 0 <−2% or >3%<−3%<−2%<−2% or >6%
RegionsAnhuiGansuShanxiShandong
Tab-reference: medium and long-term electricity trading rules of various regions; government public data. Note: the deviation assessment of Guangdong Province is adjusted from ±2% to ±4%.
Table 2. Difference of peak-and-valley electricity prices in China.
Difference of Peak and Valley Price/RMB (Below 1 kV)Provinces and Cities
0.4~0.5Shanghai (unitary system), Ningxia (unitary system), Shanxi, Yunnan (abundant water period)
0.5~0.6Shaanxi Yulin, Hebei, Yunnan (dry season), Xinjiang, Qinghai (below 100 KVA), Anhui (some months)
0.6~0.7Tianjin, Beijing (development zone), Shaanxi, Henan, Gansu, Guangdong (5 cities), Hainan (power grid retailer), Qinghai (above 100 KVA), Anhui (July–September)
0.7~0.8Shanghai (non-summer and two-part tariff), Shandong (unitary system), Guangdong (9 cities), Hainan (electric vehicle charging and replacing)
0.8~0.9Shanghai (summer and two-part tariff), Jiangsu, Zhejiang, Guangdong (5 cities)
1.1~1.2Beijing (urban, suburban)
Tab-reference. Online public resources: general industrial and commercial sales electricity prices published by 31 provinces, cities and autonomous regions in China, as of March 2019.
Table 3. Electricity growth changes in the first three quarters of 2020 in China.
Electricity Growth (%)First QuarterSecond QuarterThird Quarter
Total−10.40%−2.30%0.50%
Primary industry000
The secondary industry−12.10%−1.10%1.20%
The tertiary industry−16.50%−10.20%−1.60%
Tab-reference: Data published in reference [36].
Table 4. Electricity costs of original load curve.
Electricity Cost (¥)May 15May 16June 20June 21June 22
DA electricity cost14,735.516,574.017,573.518,565.117,142.2
RT electricity cost76.693.392.268.447.0
Deviation assessment cost34.321.438.716.030.6
Total electricity cost14,846.416,688.717,704.418,649.517,219.8
Table 5. Cost data of energy storage device.
Unit PricePrice 1Price 2Price 1
Capacity of ESD1500 CNY/kWh1000 CNY/kWh600 CNY/kWh
Power of ESD500 CNY/kWh300 CNY/kWh300 CNY/kWh
Table 6. Recover year of ESD.
Recover Year/PriceMay 15May 16June 20June 21June 22
Recover year with ESD cost111 y11 y9 y7 y9 y
Recover year with ESD cost27 y7 y6 y5 y6 y
Recover year with ESD cost35 y5 y4 y3 y4 y
Table 7. Electricity costs with different deviation assessment policies.
λ 0 K f e e E cos t ( ¥ ) E D A ( ¥ ) E R T ( ¥ ) E a l l o c a t i o n ( ¥ ) Cost Save
±4%114,490.314,516.34−26.03750−272.13
±4%214,490.314,516.34−26.03750−272.13
±2%114,496.9614,516.34−19.38190−265.48
±2%214,496.9614,516.34−19.38190−265.48
Table 8. Electricity charges without comprehensive optimization algorithm.
E cos t (¥) E D A (¥) E R T   ( ¥ ) E a l l o c a t i o n   ( ¥ )
Spring/autumn2,639,7862,593,35841,5944834
Summer4,044,7744,031,940−297215,807
winter3,557,0413,495,03755,2306774
Table 9. Electricity costs with comprehensive optimization algorithm.
E cos t (¥) E D A (¥) E R T   ( ¥ ) E a l l o c a t i o n   ( ¥ ) Cost Save
Spring/autumn2,489,0392,492,502−3463.740−150,747
Summer3,895,7403,899,111−3370.920−149,034.3
winter3,351,2333,359,089−7855.330−205,807.6
Table 10. ESD configuration and cost recovery years through comprehensive optimization.
Capacity and Power ConfigurationMay 15May 16June 20June 21June 22
Average energy storage capacity/kWh11851249126010481127
Average energy storage power/kW443452452452432
Average recovery years/year5.26.75.24.04.1
Table 11. Deviation range of trial operation electricity price and corresponding recovery years.
Electricity Price DeviationMay 15May 16June 20June 21June 22
Mean/¥0.0391439−0.0056730.0200903−0.006479−0.0139309
Maximum/¥0.14485120.0642570.1118420.1274310.13121
Minimum/¥−0.0269366−0.1261046−0.107666−0.0793696−0.050216
Table 12. Average recover year based on random electricity prices.
Recover Year\Random PriceType 1Type 2Type 3Type 4Type 5
Average recover year/year4.95.14.44.24.7
Publisher’s Note: MDPI stays neutral with regard to jurisdictional claims in published maps and institutional affiliations.

