Article

Flexibility from Combined Heat and Power: A Techno-Economic Study for Fully Renewable Åland Islands

1
VTT Technical Research Centre of Finland Ltd., 40101 Jyväskylä, Finland
2
Reteres Ltd., 41390 Salo, Finland
*
Author to whom correspondence should be addressed.
Energies 2021, 14(19), 6423; https://doi.org/10.3390/en14196423
Submission received: 23 August 2021 / Revised: 14 September 2021 / Accepted: 24 September 2021 / Published: 8 October 2021

Abstract

:
As energy systems globally are transitioning into renewable energy, simultaneous targets of high self-sufficiency have led to complex system design proposals. While conventional technology solutions would reduce the complexity in theory, limitations in the potential outcome may exist. To address this dilemma, the work quantified the systemic value provided by a conventional solution; biomass combined heat and power (CHP) production, in terms of economic feasibility, provided flexibility and energy self-sufficiency. The analysis focused on the renewable energy integration of the Åland Islands, where the synergetic island energy system is heavily increasing the wind power capacity. While considering local fuel resource availability, multiple alternative energy system scenarios were constructed. To evaluate the scenarios, the work developed and validated a combined dispatch and investment optimization model. The results showed that the studied conventional approaches limited the achievable self-sufficiency in the power sector (80.6%), however, considerably increasing the value from the present state (18.5%). Second, compared to previous studies, the results indicated a low value from biomass CHP in the wind-based energy system. Instead, the combination of high wind capacity and power-to-heat enabled the best economic feasibility and high self-sufficiency, which could be further improved by lower electricity taxation.

1. Introduction

Energy systems throughout the world are undergoing a transition from fossil fuels to renewable energy. The transition is driven by global targets of climate change mitigation, along with cost reductions in variable renewable energy [1]. Globally, the installed solar photovoltaic (PV) and wind power capacities were estimated to increase by 107 GW and 65 GW in 2020, respectively [2]. This large-scale deployment of non-dispatchable variable renewable energy (VRE) increases the need for energy system flexibility. Lack of flexibility leads to increased system cost due to multiple reasons, such as reducing the profitability of dispatchable baseload units, increasing the utilization of peaking units, and power curtailment in VRE production [3,4,5]. To address the lack of flexibility, solutions including energy storages, strong transmission and distribution networks, flexible demand, and the production of synthetic fuels from renewable energy have been presented [6,7,8].
Alternatively, dispatchable bioenergy and conversion of power to heat enable technologically mature options for providing energy system flexibility while simultaneously turning the energy production renewable. The most prominent solution of the former can be considered combined heat and power (CHP) production using biomass fuels, which allows for a higher total efficiency compared to the separate production of heat and power. Globally, CHP production represented roughly 30% of the bioelectricity generation in 2017 [9]. In Europe, CHP production provided 72% of the generated bioelectricity in 2019 [10], and is expected to remain an integral option in long-term system development despite new sustainability criteria for biomass [11]. The techno-economic feasibility and potential for wind integration of CHP production have been studied in literature in different settings, and have been shown to be related to the type of the used CHP technology [12], unit sizing [13] and other flexibility elements in the system. Rinne and Syri [14] found CHP production an economical option for balancing a wind-based system when combined with a thermal energy storage. Similarly, Lepiksaar et al. [15] concluded a combination of power-to-heat and thermal energy storage to increase the flexibility of CHP production in a district heating system, and Luo et al. [16] revealed power-to-heat conversion to increase both the system economic performance and the flexibility of CHP production in a wind-based island microgrid. Pilpola and Lund [17] evaluated flexibility options for wind power in the Finnish national energy system, showing CHP production to lead to lower wind penetration and a higher system annual cost than separate heat production, thus limiting wind integration. Power-to-heat technologies have been considered to allow cost-efficient heat production at times of high availability of wind or solar power [18]. Some examples of the technologies are large-scale heat pumps, which require a low-grade heat source along with electricity, and electric boilers, which are able to operate solely on the available electricity. In district heating applications, the electrification of the production has been seen as attractive in terms of its economic feasibility [19] and provided flexibility [20], but can be constrained by taxes associated with the production [21].
Island energy systems enable an attractive platform for variable renewable energy integration studies. In comparison to continental energy systems, the structure of island energy systems is often less complex [22], which enables a technology to be demonstrated as a key part of the system—yet at a relatively small scale. Furthermore, although small islands are often abundant in VRE resources, such as solar and wind, the power supply mainly relies on imported fossil fuels [23]. Therefore, effective VRE integration would not only bring environmental benefits, but would also increase the energy self-sufficiency of the islands. This paper focuses on the Åland Islands, an autonomous Finnish province located in the Gulf of Bothnia in the Baltic Sea. While Åland consists of over 6700 islands, the population of 29500 mainly live on 60 of the islands [24]. The energy and climate strategy set by the government of Åland [25] aims to reduce carbon dioxide emissions by 60% in comparison to its 2005 levels at 260,000 tons, to increase the share of renewable energy of the total consumption to 60%, and to supply 60% of the electricity demand by local and renewable sources by 2030.
On the global scale, the Åland Islands are one among many island energy systems transitioning into renewable energy that have recently attracted research interest. For example, energy system studies involving high VRE integration have been conducted on the Canary Islands [26], La Gomera (Canary Islands) [27], Faroe Islands [28] and Ometepe [29]. Islands with ongoing transitions towards 100% renewable energy supply include El Hierro [30], Tilos [31], and Samsø [32]. Samsø can be considered to provide the closest comparison to the Åland Islands, sharing similarities in terms of high wind power installations, high share of biomass in district heating, and power transmission capability to the mainland. The island with roughly 3700 inhabitants provides 6% of its electricity demand with imports, with the rest originating from wind and solar PV.

1.1. Previous Work Related to the System

In literature, the renewable energy transition options for the Åland Islands have been evaluated by several studies with different approaches. Leichthammer [33] presented an outlook of the Åland energy market without focusing on the system configuration. Child et al. [34] using system optimization concluded that Åland could be fully sustainable by 2030 when considering the power, heating and transportation sectors. With a combination of high amount of electric vehicles capable to bidirectional charging, and production and storage of synthetic fuels, the determined share of imported electricity was only marginal. In the different scenarios presented by the authors, the amount of electric vehicles varied mainly from 16,000 to 32,000, with the latter representing 100% of the vehicle fleet in 2030. The increased power demand of the electric vehicles was covered by solar PV, majority of which (50 MW to 55 MW) was assumed to be implemented as a centralized installation and the rest (15 MW to 28 MW) as residential installations. In addition, 110 MW to 170 MW of installed wind power was assumed. The conceptual design proposed by Jacobson et al. [35] combined different energy storage methods together: power-to-gas on a seasonal level, and battery energy storage as well as virtual battery aggregated from roughly 4000 electric vehicles on an hourly level. In addition, a solid biomass CHP plant (20 MWe) was included. Most recently, Pääkkönen and Joronen [36] evaluated the plant level feasibility of biomass CHP providing energy system flexibility in Åland. The study concluded that a biomass CHP unit could operate profitably in the energy system with high VRE integration when the availability of low-cost fuel and sufficient income from generated heat could be secured.

1.2. This Work and Contribution

The previous work suggests that a nearly self-sufficient energy system would be possible in the Åland Islands. However, two research questions with implications on a more general level can be identified. First, as a system, Åland may select its targeted independence from imported electricity due to existing power transmission capacity. The previous system designs have aimed to high self-sufficiency by utilizing solutions such as vehicle-to-grid power discharging or local synthetic energy carrier production. While the system designs have been shown to be theoretically functional, the outcome relies on the utilization of advanced technology solutions and technology adoption of private consumers. Consequently, the related uncertainties may form a barrier for implementation of other parts in the system design, ultimately preventing local energy and climate targets from being achieved in time. On the contrary, while lower technological ambition could concretize as faster system implementation, tradeoffs such as a limited level of independency from imported electricity, or limitations in local fuel resource availability, may exist. As the dilemma applies to other energy systems aiming for energy transition, the study aims to quantify the potential tradeoffs.
Second, on technology level, biomass CHP has been shown to be a feasible option generally and for the studied island energy system. With the local biomass availability, the inertia of the district heating grid and a connected thermal energy storage, the system would benefit from the flexibility provided by the biomass CHP. However, it is unclear how the option compares to other cost-optimal designs from the system viewpoint. Therefore, by evaluating different system configurations varying in wind capacity and flexibility measures, for example electrifying a part of the district heating production or utilizing a centralized electrical energy storage, the value of biomass CHP can be comparatively assessed.

2. Materials and Methods

2.1. Current Power and District Heating Sector

In recent years, imported electricity from Sweden has accounted for over 75% of electricity supply mix of Åland [37]. The electricity is transferred from Sweden to Åland through an 80 MW connection, which has a contractual limitation of 58 MW. In addition to Sweden, Finland has two transmission connections to Åland. The first connection is rated 10 MW and is primarily utilized to provide electricity for the islands, while the second connection rated 100 MW can also be utilized. In total, the transmission capacity without contractual limitations is 190 MW [38].
The most significant local source of electricity in Åland is wind power, which has represented roughly 20% of the annual supply during the recent years [37]. The current plant fleet consists of nineteen wind turbines, both onshore and offshore, with a total rated power output of 21.3 MW [39]. The installed wind capacity is expected to increase by roughly 163 MW if three planned wind projects are realized [38]. For solar PV, the local energy and climate strategy considers the technology as a complementary energy source, since solar radiation is low during the months with the highest demand. Consequently, approximately 5% of the annual electricity consumption in 2030 is expected to be supplied with solar PV [25]. Solar thermal production is not considered as a system level solution in the strategy, and therefore, not included in the study.
The majority of the district heating in Åland is produced in the Mariehamn network (119.4 GWh) [40]. In 2017, 86% of the heat was produced from renewable fuels, which are mainly residues obtained from the local wood industry [41], consisting of industrial residues (bark and sawdust) and forest residues (branches and tops). Heavy fuel oil CHP units in the network have been primarily used for heat generation, and are therefore considered as heating boilers in the study. In addition to the Mariehamn area, two small heating networks with both biomass and oil boilers exist in the region, but are excluded from the study due to low relevance for the entire system.

2.2. Evaluation of Fuel Resources

In order to decrease the reliance on imported electricity and to replace the remaining fossil fuels used in district heating production, the alternative fuel resources available in the system are explored: solid biomass, biogas, and municipal solid waste. For solid biomass, the woody biomass potential for energy use based on sustainable forestry values has been assessed [42]. In order to estimate the energy content, the biomass potential values are first converted into loose cubic meters based on estimated energy density [43]. Consequently, the estimated energy content is roughly 395,000 MWh/a, or 45 MWh/h. The potential of biogas production in Åland in terms of locally available feedstock has been estimated to be approximately 35,000 tons per year [44]. Annually, roughly 3.2 million m3 of biogas with a methane concentration of 63% could be created from these sources. Using a specific energy content of 4–6 kWh/m3 for biogas [43], an average value of 16.5 GWh can be estimated as the energy content. Finally, the annual municipal solid waste potential in the Åland Islands has been estimated as 32,500 tons [45].
The solid biomass can utilized by biomass heating boilers and biomass CHP units, for which new investments can be considered realistic based on the local fuel availability. At present, the energy from biogas is mainly used in internal processes of several companies, such as a local chip factory [46] and a milk processing plant [47]. Therefore, the possibility of new biogas heating investments is excluded from the study. While direct combustion and anaerobic digestion to biogas could be used to convert the municipal solid waste into energy, the waste is currently shipped from Åland to Sweden for incineration due to the poor economic feasibility of local utilization [46]. Therefore, the work excludes the possibility for investments related to waste-to-energy.

2.3. Studied Scenarios

Based on the presented system information, seven different scenarios are formulated to evaluate the energy system feasibility and operation, consisting of capacity assumptions summarized by Table 1. Two scenarios are created to act as a reference and to validate the optimization model. The scenario “Base” estimates the current state, simulating the energy system using reference data from 2017. In scenario “BAU”, the current energy system is simulated for the year 2025, assuming the power and heating demand to increase based on the current trends. Alternative scenarios are then created for the year 2025. “Dispatch” expects moderate increase in the installed wind capacity (85 MW) and allows an investment to be made for biomass CHP with a maximum capacity of 15 MWe, combined with a thermal energy storage. “Low Variable” assumes an equal amount of wind power (85 MW), but excludes the possibility for the biomass CHP investment. The scenario “Variable” assumes that all the planned wind projects are realized, leading to a total capacity of 185 MW. Due to the high installed wind capacity, the scenario is expanded in “Variable Heat” by adding an electric boiler with a maximum capacity of 15 MWth and in “Variable Battery” by adding a battery energy storage of 15 MWh. In all the scenarios for 2025, solar PV capacity of 15 MW is assumed to exist corresponding to the expected residential capacity [25], and investments on additional biomass heating boiler capacity (maximum 30 MWth) are allowed, with BAU being an exception. The capacity assumptions for both the optimized production unit investments and fixed storage technology investments reflect the previous concept studies for the island [35,36] that include considerations of the practical unit sizing.

2.4. Techno-Economic Parameters

Datasets for the electricity and district heating demand are retrieved from local companies, Kraftnät Åland and Mariehamns Energi, respectively, representing the hourly values for 2017. In order to estimate the hourly values for 2025, the demand is assumed to increase based on the past trends. For both electricity and district heat, an annual growth rate of 1.5% is used [37,48]. Therefore, the electricity demand in 2025 is estimated to be 350 GWh, and the district heating demand to be 132 GWh, which also accounts for a heat loss of 10.9% in the district heating network [48]. For the price of district heat, 80 €/MWh without seasonal variance is used in accordance to the average value in Finland in 2017 [40]. Hourly market prices for electricity are estimated based on price information of the Nord Pool SE3 bidding area in 2017 [49]. The fuel costs are estimated based on typical Finnish values and may slightly deviate from those realized in the Åland Islands. For local forest-based biomass and oil, the prices are set as 25 €/MWh and 50 €/MWh, respectively, with the latter including the fuel tax. The emission factors for the fuels are retrieved from the national fuel classification [50]. The cost of fossil CO2 emissions is selected as 5.8 €/ton for 2017 based on the historical data of EU Emissions Trading System [51] and increased to 40 €/ton in 2025. For heat converted from power in the Variable Heat scenario, an electricity tax of 22.53 €/MWh is applied [52].
Hourly wind and solar production values are obtained by converting local weather data into production data using unit models. For wind power, the hourly wind speed data available [53] closest to each site is converted into power output using power curves for existing and planned offshore and onshore wind turbines [54] based on the wind turbine type. The data is corrected to the estimated hub height of the turbines by applying the wind power law. For solar PV, polycrystalline panels are assumed, and with a locally estimated production ratio, a total production efficiency of 14.1% is achieved. The hourly production values are calculated based on the available solar radiation data from Mariehamn [53] and the estimated production efficiency after determining the total panel area from the nominal capacity (15 MWe) and standard test conditions (1000 W/m2). The irradiance conditions of the island are considered to be sufficiently represented by the single dataset. For both wind and solar power, the optimization model prohibits the curtailment of the generation. All the production that cannot be utilized within the system is exported, unless the maximum transmission capacity is exceeded; in such cases, the optimization problem is considered infeasible.
The introduced system techno-economic parameters are summarized in Table 2. For the existing units and new unit investments, the techno-economic parameters are presented in Table 3, with the cost parameters mainly derived from the Danish Energy Agency [55]. Exceptions are offshore wind power, for which a cost estimate based on local conditions in Åland has been presented [34], and thermal energy storage [34]. For all the investments, the annual investment payment is calculated using weighted average cost of capital (WACC) of 7%. Linear conversion functions based on constant efficiency are used to calculate the heat or power output from fuel input for the dispatchable units. For CHP, considered as a grate steam boiler with a backpressure turbine, both heat (50% efficiency) and power (30% efficiency) are generated with a constant share based on fuel input without a possibility to vary the ratio. Minimum load of 30% is selected for CHP and not included for the other production units, for example the biomass boilers considered as decentralized hot water boilers. Finally, the storage technologies are simplified to operate ideally without losses. The thermal energy storage, a large partially existing cavern hot water storage, is assumed to be available with the capacity of 350 MWh/17.5 MW, and may only be charged with the biomass CHP. The battery energy storage is assumed to represent a centralized lithium ion-unit with a capacity of 15 MWh/15 MW, and may only be charged with wind power; not using imported electricity or solar PV.

2.5. System Optimization Model

In order to evaluate the scenarios, an hourly combined investment and dispatch optimization model based on mixed integer linear programming is created with Pyomo [57] and solved with IBM CPLEX [58]. Appendix A presents the model formulation in detail. The model optimizes the hourly dispatch of the production units as well as the storage systems, and resolves the optimal rated power of the dispatchable units to which an investment is allowed. The objective function of the optimization model is to maximize the system net profit that consists of income terms (sold electricity, sold district heat and exported electricity) and cost terms (consumed fuel, other variable OPEX, CO2 emission allowances, and imported electricity). In the scenarios with capacity optimization, the annual investment payment of the unit is included in the objective function as a cost term. The optimization model is bounded with a number of hard constraints on both the unit and system level. On the unit level, minimum and maximum load limits are applied. On the system level, the hourly power demand must be covered by a combination of imported electricity and local power supply sources including storage. Similarly, the supplied district heat from production units and thermal energy storage must be equal to the district heat demand every hour, meaning that the model does not account for flexibility of the district heating network itself.
In each scenario, the installed capacities of wind power and solar PV are introduced to the optimization problem as constant parameters, and the hourly production values are calculated as presented previously. For electricity transmission, both the power imports and exports are equally constrained by the transmission line hourly maximum capacity. To simplify the optimization model, the power transmission lines from Åland are aggregated as one line responsible for all the power exchange with the neighboring power areas. The electricity imports are cost-penalized in the objective function by a factor of ten, which sets the option last in the merit order; if still used, the local power demand could not be met with any other combination of available options.
To validate the optimization model, the optimized system operation in the Base scenario is compared with the realized system operation of 2017. The calculated values, shown first in the brackets closely match with the reference data by, for example, considering the wind production (57.3/57.5 GWh), oil heating boiler utilization (16.7/16.7 GWh), and imported electricity (253.3/258.2 GWh). Acknowledged simplifications affecting the model validity include the modelling of the district heating network as a single grid, exclusion of power transmission losses, as well as the use of constant unit efficiencies.

3. Results

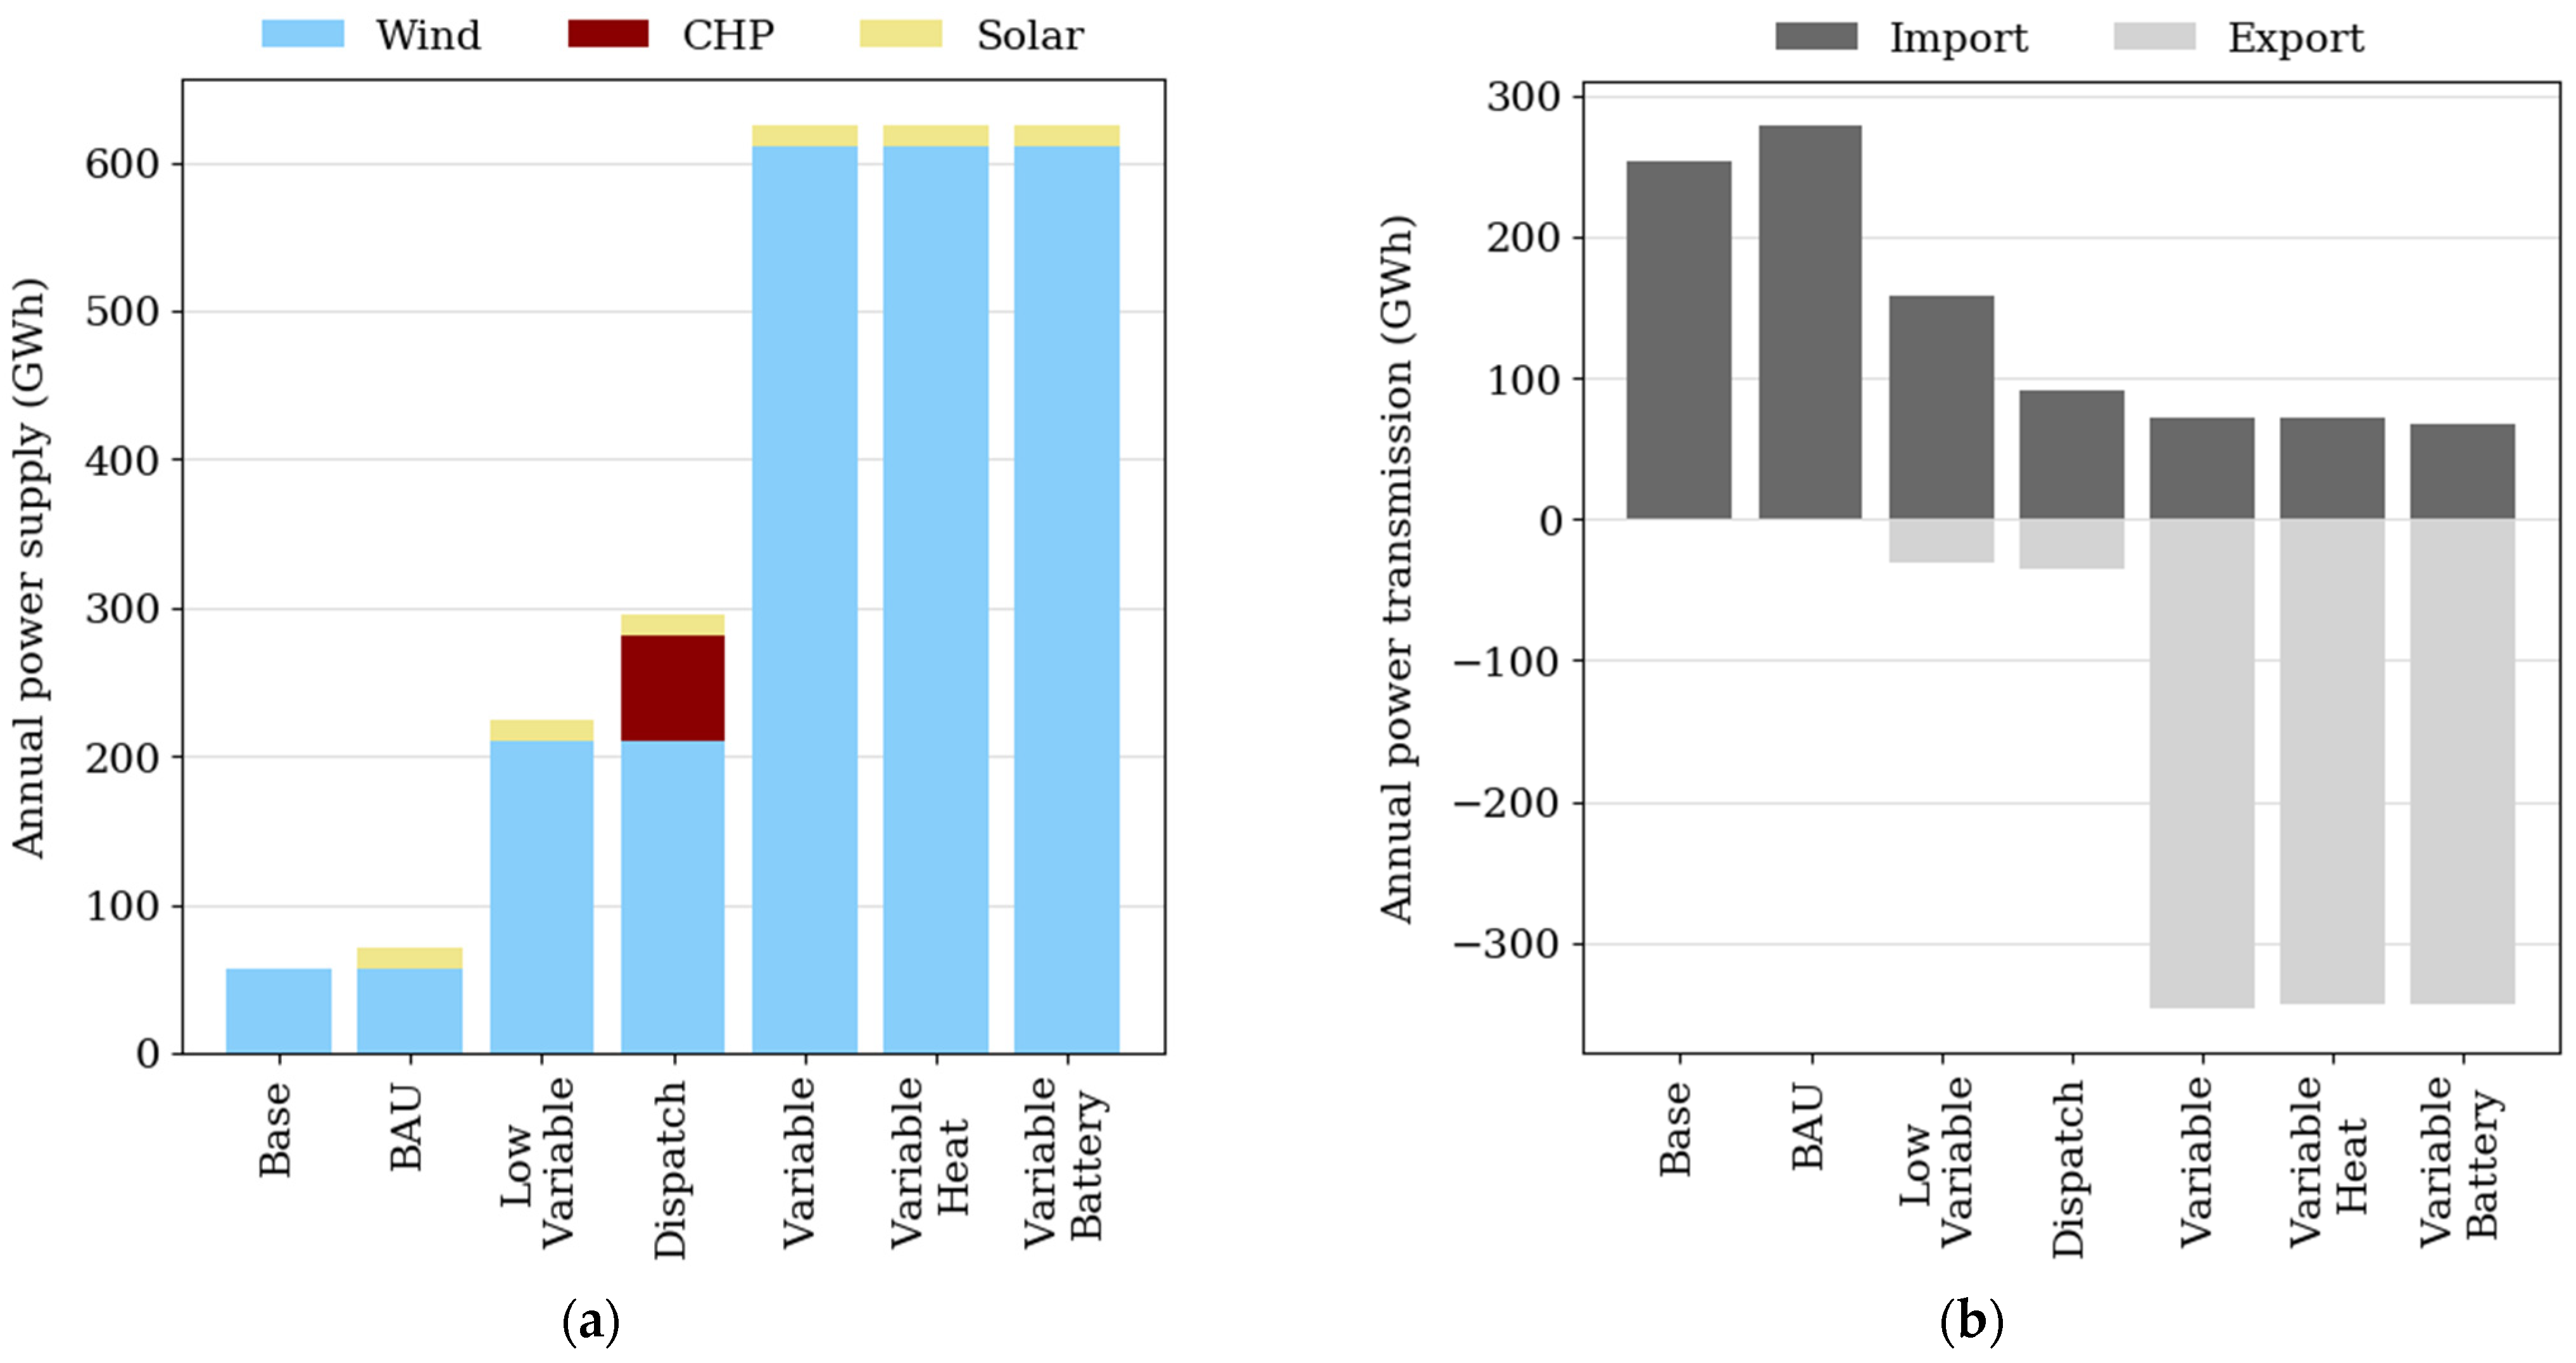
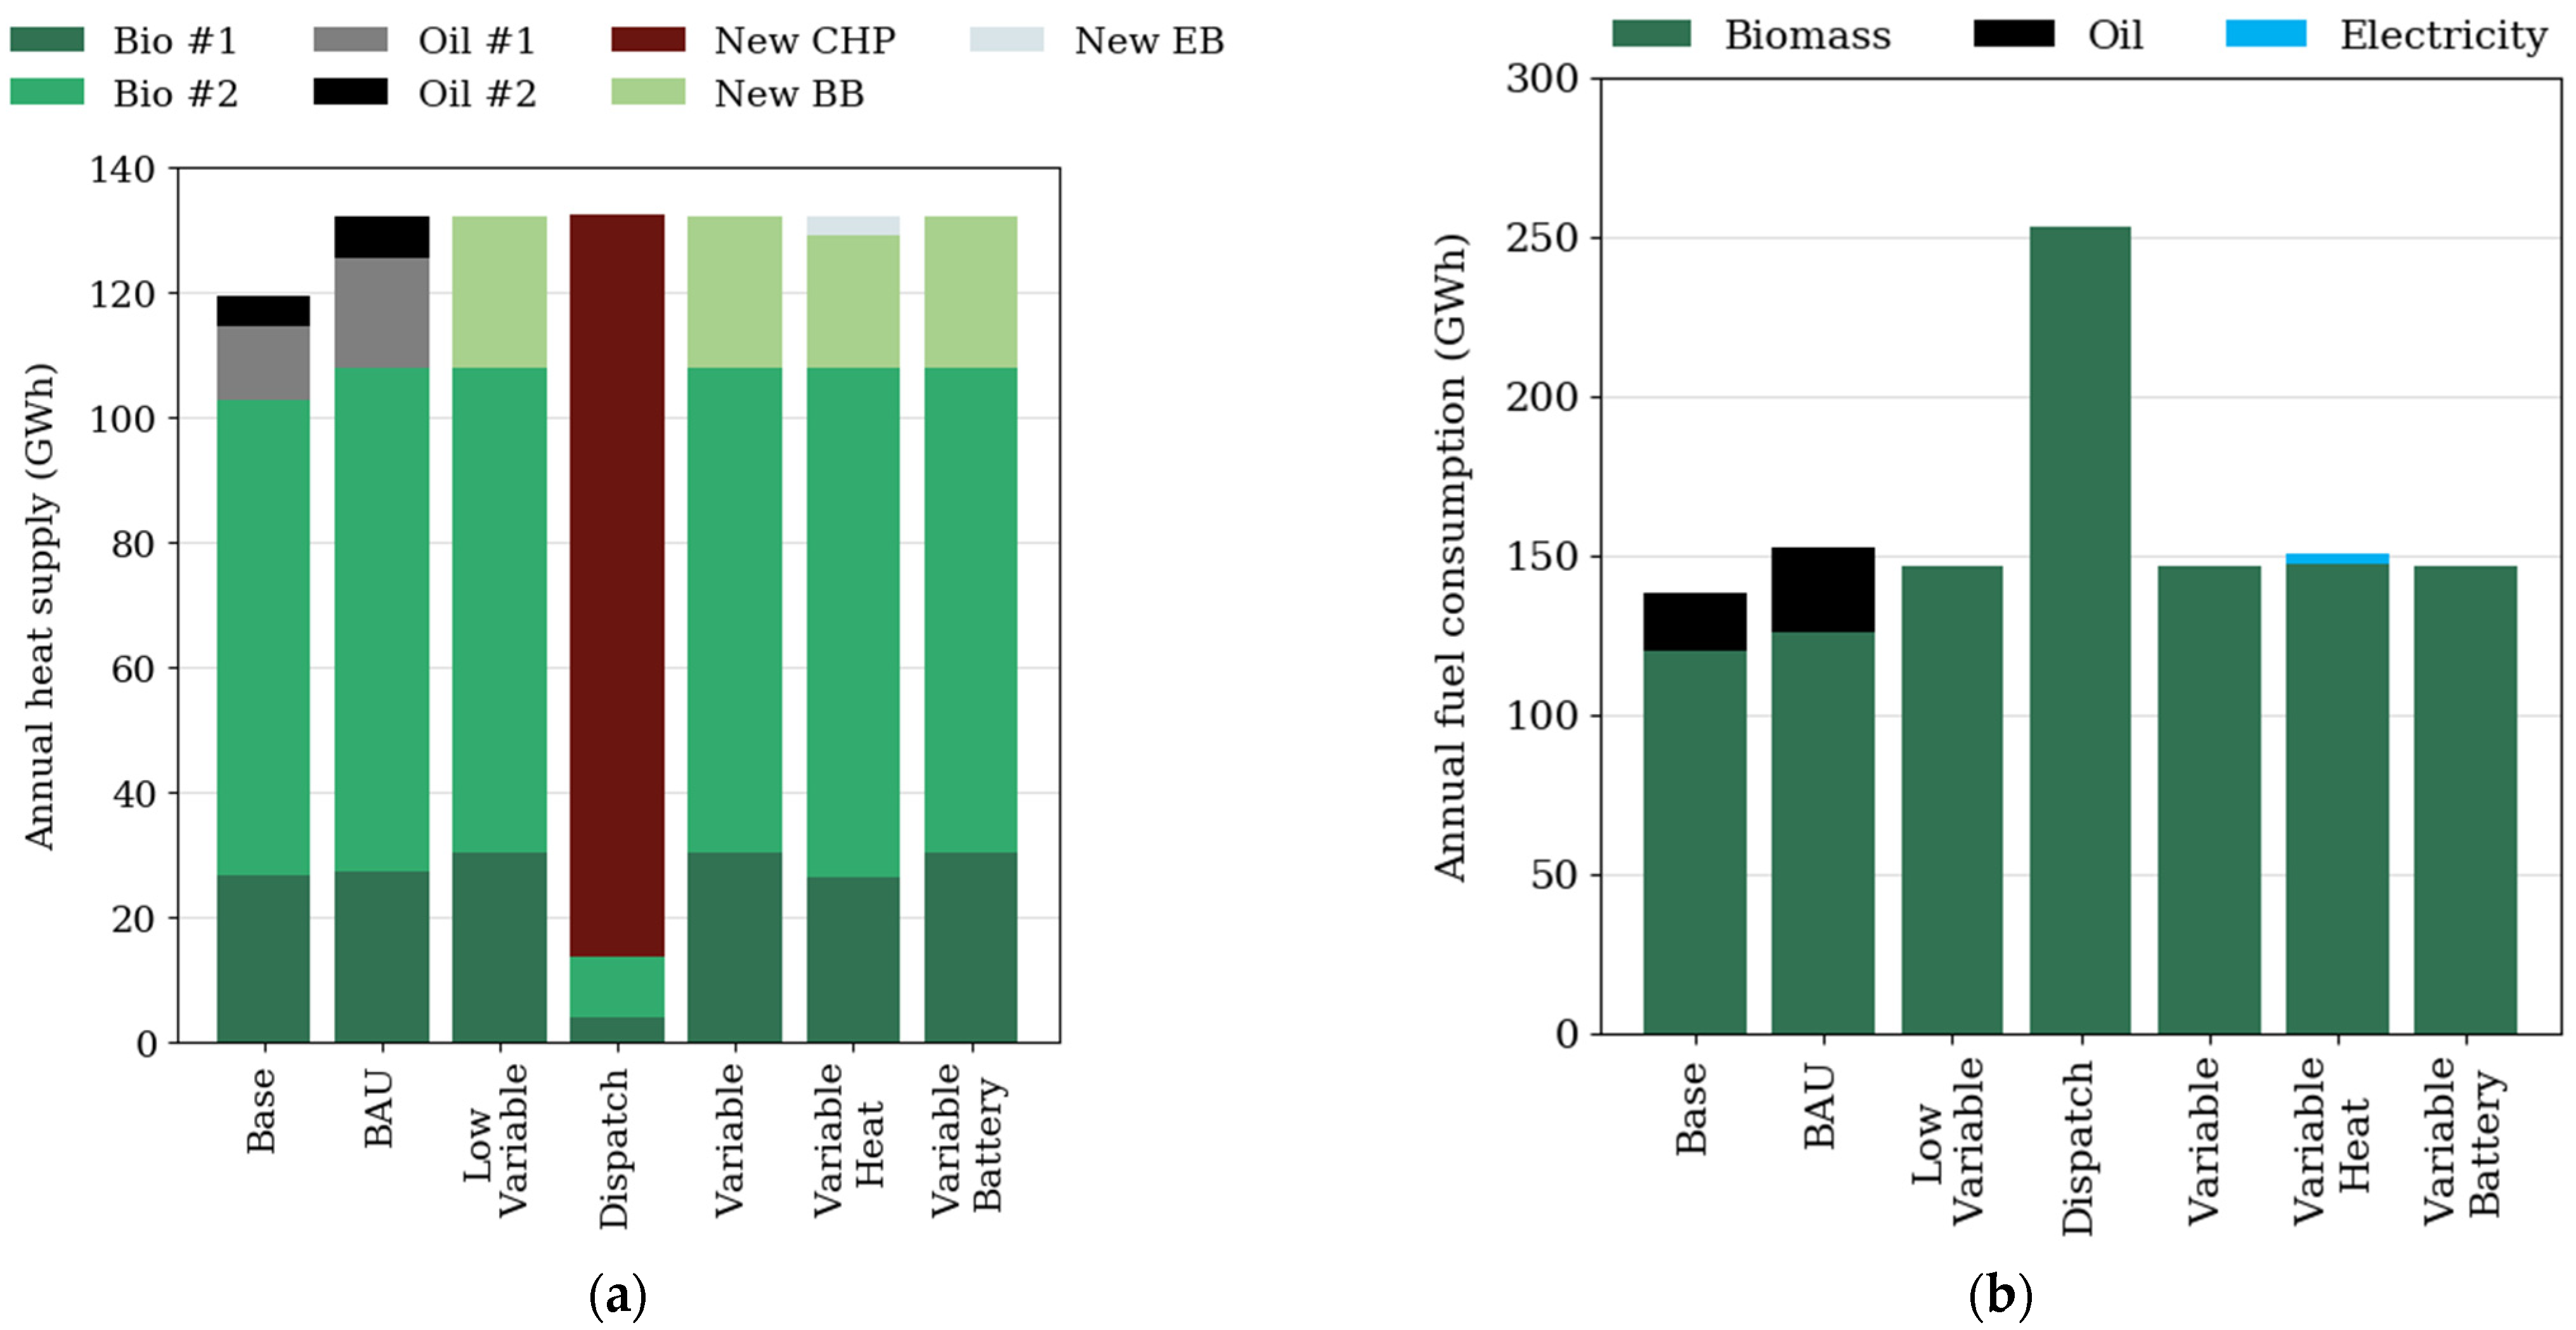
3.1. System Operation

In the power sector, summarized by Figure 1, the system operation greatly depends on the installed wind capacity. With the current (21 MW) and moderate (85 MW) capacity assumptions, the annual wind production is 57.3 GWh and 209.8 GWh, respectively. Increasing the installed wind capacity to 185 MW raises the annual wind production to 611 GWh, being almost twice the local power demand. The scenarios with a low amount of installed wind, Base, and BAU, show a high reliance on imported electricity, representing 81.5% and 79.7% of the power supply mix, respectively. The share of imported electricity is decreased when the installed wind capacity is increased to 85 MW in Low Variable (45%) and Dispatch (26%). In Dispatch, the CHP unit notably reduces the need for imported electricity, being able to produce electricity during the periods without wind production. Due to the assumption of the constant share of heat and power production, the CHP unit is however not able to fully benefit from its dispatchability; at times, the heating demand would be exceeded if the CHP unit maximized its power production. Finally, the lowest shares of imported electricity are achieved in the Variable scenario (20.4%) and its alternatives Variable Heat (20.4%) and Variable Battery (19.4%). The battery energy storage therefore decreases the electricity imports slightly; by 3.7 GWh, but is not fully utilized due to the available possibility for power transmission.
In the district heating sector, summarized by Figure 2a, the heat in the Base and BAU scenarios is mainly supplied with the biomass heating boilers, whereas the oil boilers provide the peak demand, representing 14.0% and 18.4% of the total fuel consumption in the scenarios, respectively. Although the price of CO2 is in BAU increased, the utilization of oil boilers increases due to increased district heat demand and the limited capacity of the biomass boilers. In the alternative scenarios, the existing oil boilers have to be replaced. Generally, the heat is supplied mainly with new biomass boilers excluding the Dispatch and Variable Heat scenarios. In Dispatch, the CHP unit generates the base load, covering most of the district heat production (90.0%) while biomass boilers are used to provide peak demand. Simultaneously, the biomass consumption (253.5 GWh) shown in Figure 2b is also greater compared to the other scenarios, for example, Variable (146.9 GWh), due to lower thermal efficiency compared to biomass boilers. In Variable Heat, electric boilers provide only a minor part of the district heating demand (2.3%) while the rest is generated by biomass boilers. If the electricity tax were removed, the production of the electric boiler would increase from 3.0 GWh to 23.1 GWh, simultaneously decreasing new biomass boiler capacity investments to zero. For clarity, Appendix B presents the production unit level values for both the power and district heating sector.
On a monthly level, the scenarios show differences particularly in imported and exported electricity, which is mainly explained by the variability in wind production. The current amount of installed wind capacity in Base and BAU results in import surplus during every month. In BAU, the increased electricity demand leads to increased imports, with the highest increase during the colder months (November to March, +4 GWh/month). When considering the scenarios with moderate wind capacity, Low Variable and Dispatch, in the latter the level of imports is clearly less seasonally dependent due to the biomass CHP. Although import surplus takes place in both the scenarios every month, in Dispatch the imports are comparatively lower during the winter (November to December, −8 GWh/month) when the wind production also reaches its highest values. In the scenarios with high wind capacity, export surplus is achieved every month with values ranging from 3 GWh/month (May) and 44 GWh/month (December). The decreased imports in Variable Battery compared to Variable are evenly distributed over the year, being roughly 0.3 GWh/month.

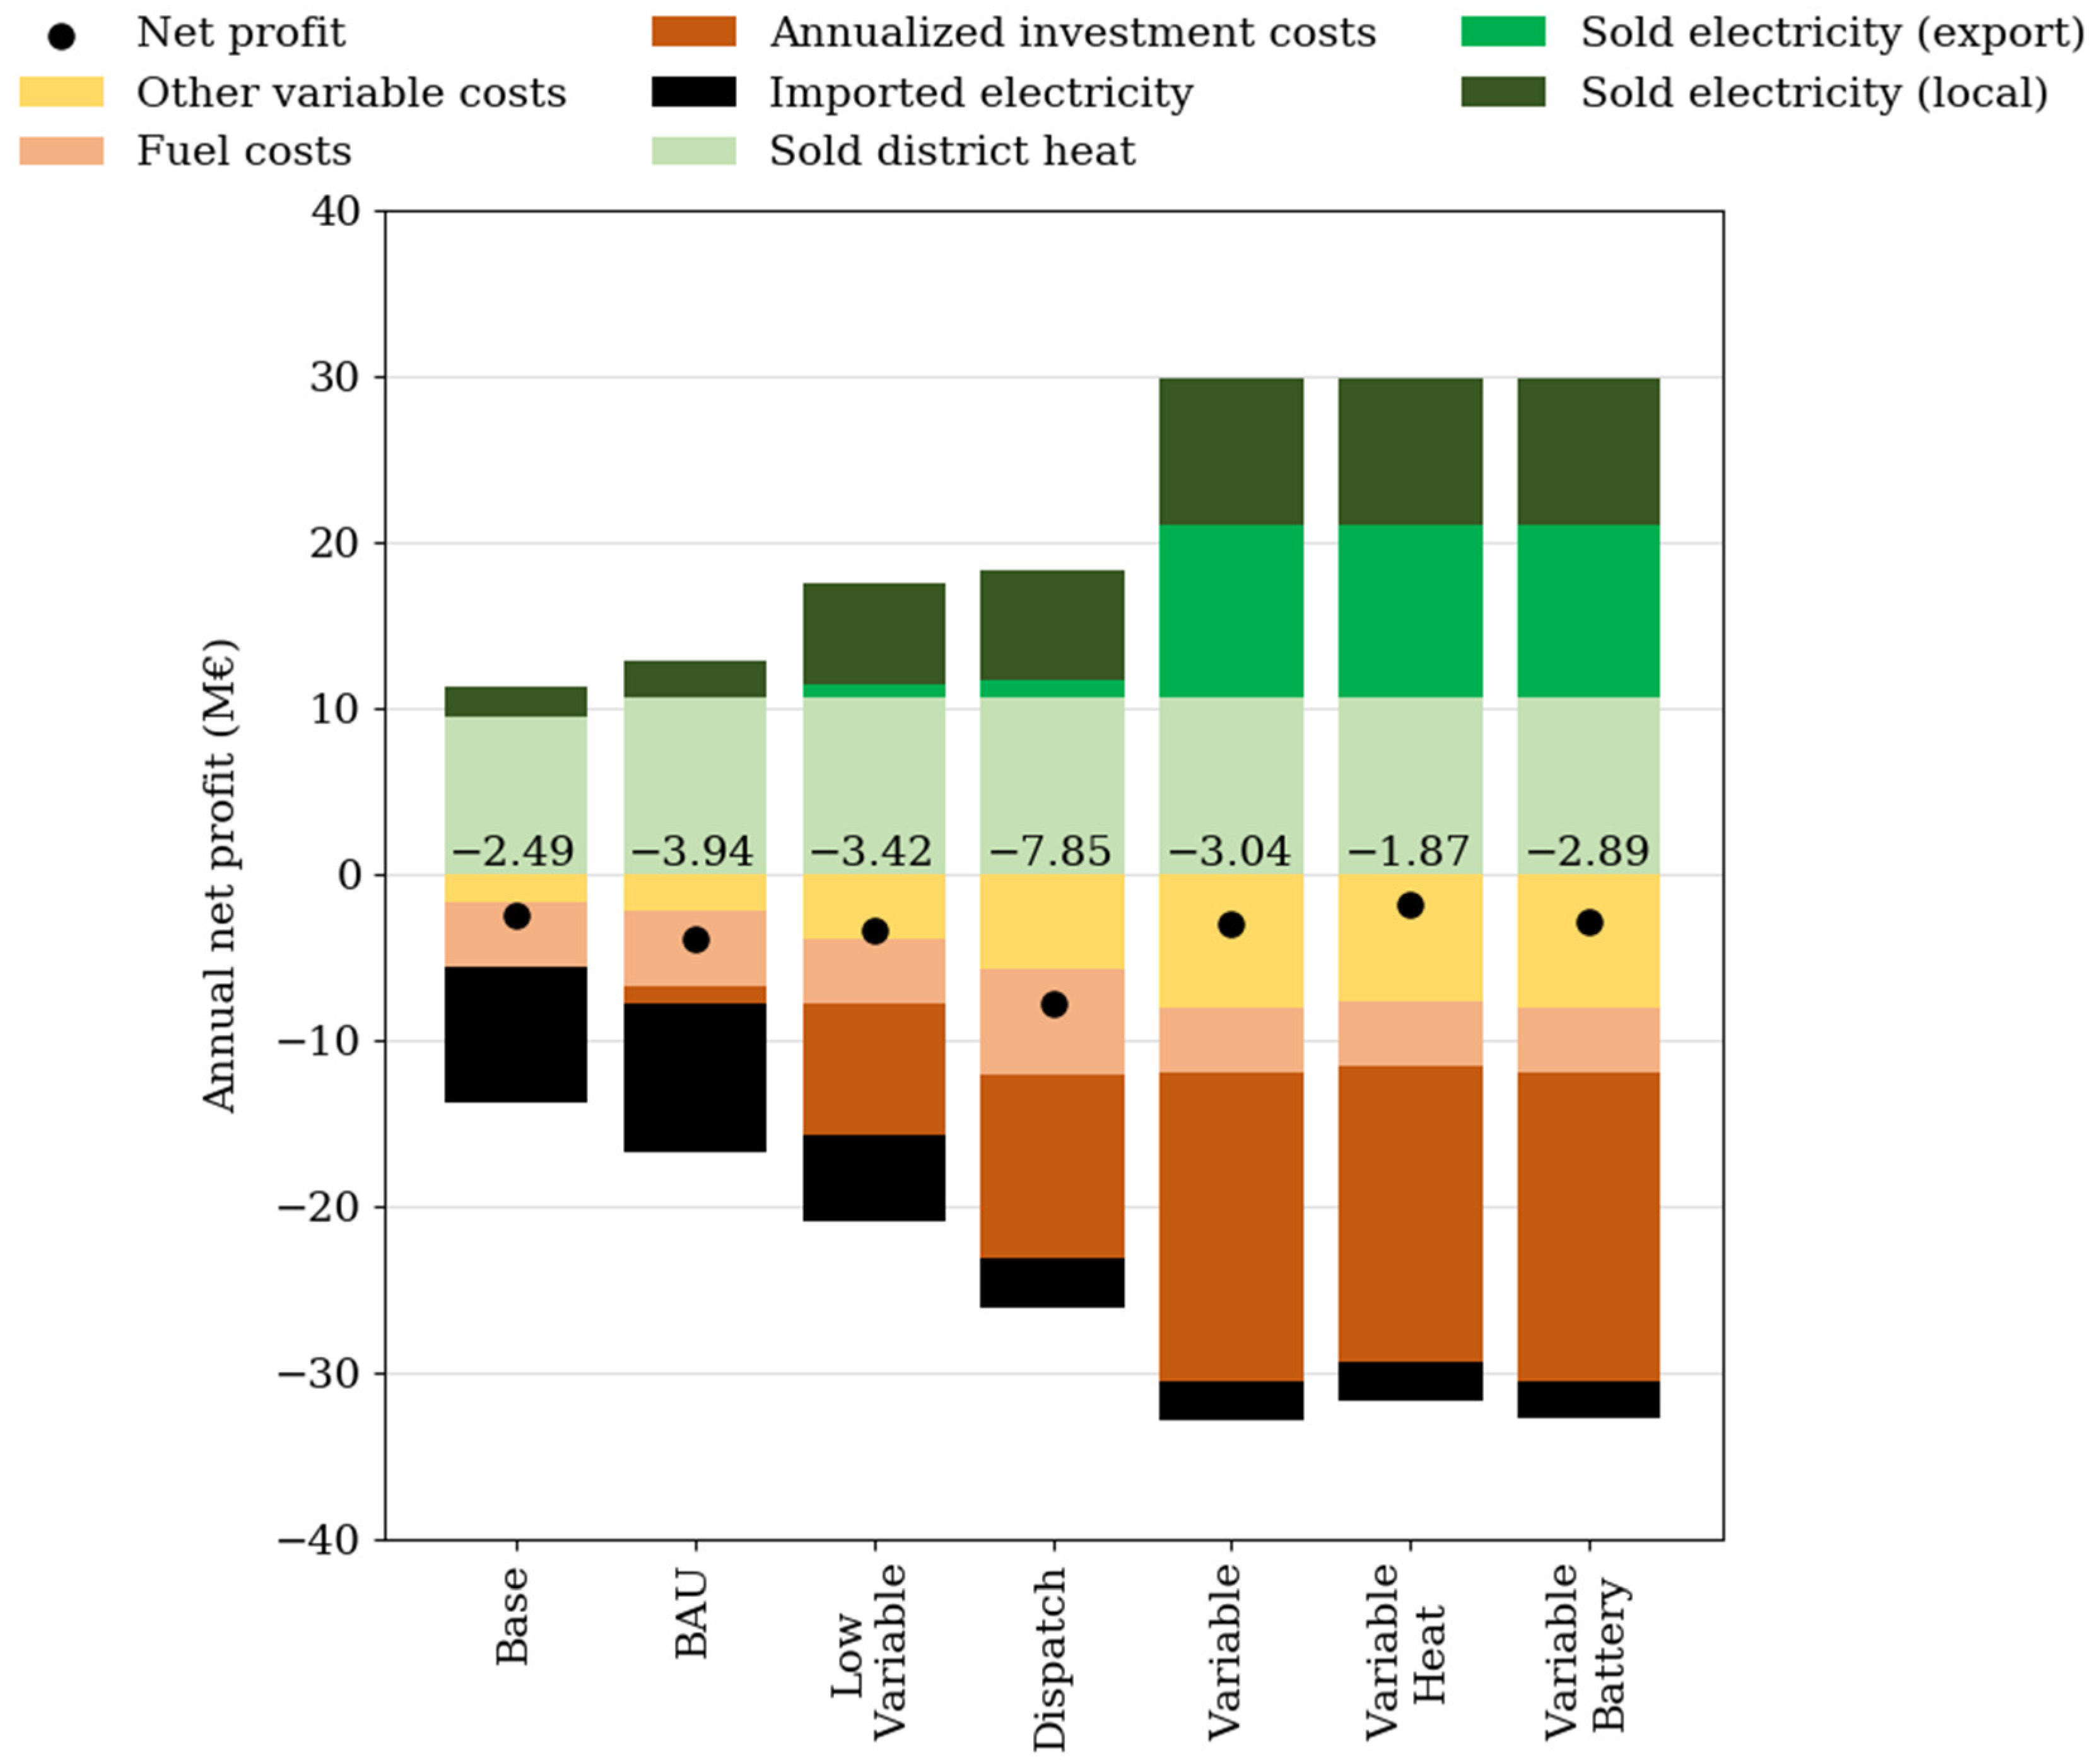
3.2. Economic Feasibility

Figure 3 presents the economic feasibility of the system in different scenarios, displaying the annual net profit formed from different cost and income terms. In the Base scenario, most of the income is generated from sold district heat, whereas imported electricity is the largest cost factor. In the BAU scenario, the profitability of the energy system compared to Base decreases. As both the electricity and district heating demand increase, the continued reliance on imported electricity and increased oil usage in heat production lead to a lower annual net profit (−3.9 M€/a) than in Base (−2.5 M€/a). The other scenarios for the year 2025, excluding Dispatch, are economically more feasible than BAU. With the added wind capacity, the lower share of imported electricity decreases the associated cost, but the annual investment payments increase notably. Simultaneously, the income from local electricity sales increases and in the scenarios with high wind power capacity, exported electricity becomes the jointly highest source of income. In Dispatch, cost savings are achieved through decreased power imports enabled by the production of the CHP unit, but the additional investments costs decrease the annual net profit (−7.9 M€/a). Furthermore, the increased biomass consumption leads to the highest fuel cost of all the scenarios. Consequently, in Low Variable, with the same amount of installed wind power as in Dispatch, more electricity is imported to the system but the annual net profit (−3.4 M€/a) is higher. The Variable scenario (−3.0 M€/a) and its alternatives perform economically the best while enabling the highest self-sufficiency in the power sector. The battery energy storage in Variable Battery slightly improves the annual net profit (−2.9 M€), as more wind power can be used locally and less imported electricity is required. The economically best scenario is Variable Heat (−1.9 M€), which benefits from the lower specific investment cost and fixed operating costs of electric boilers compared to biomass boilers. If the electricity tax is excluded from the electric boilers, the Variable Heat scenario reaches an annual net profit of −1.6 M€.

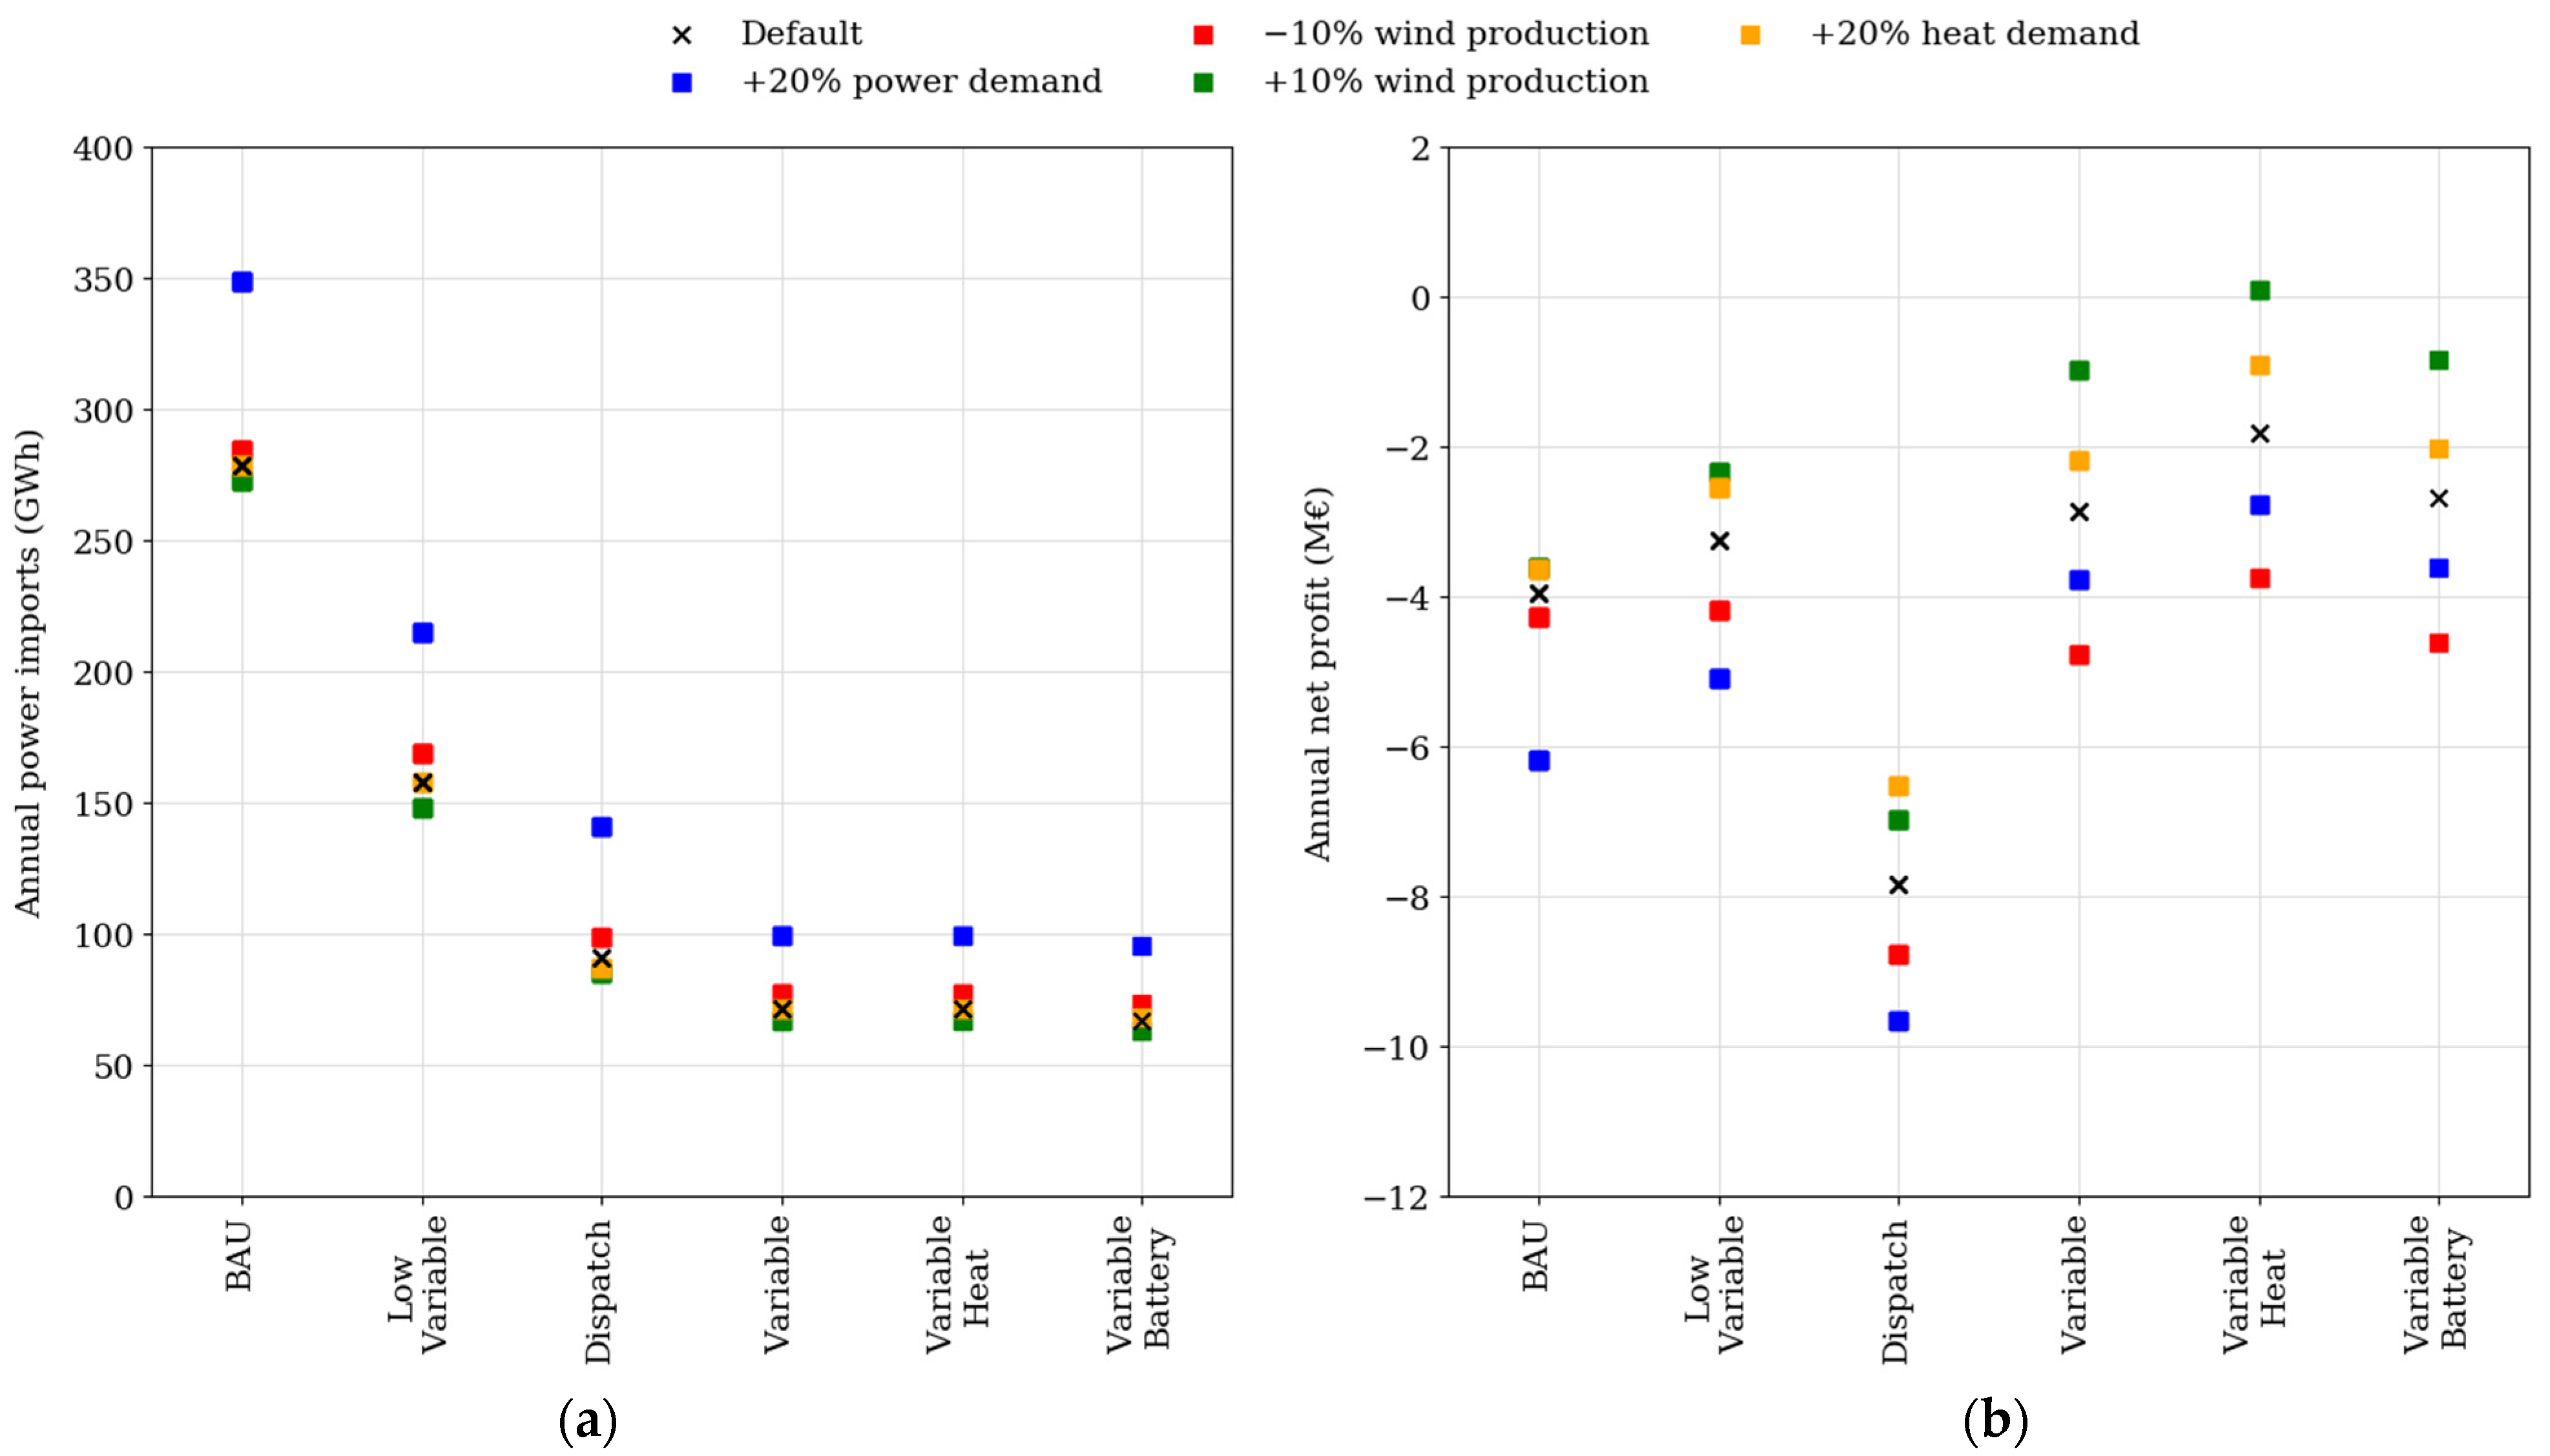
3.3. Sensitivity Analysis

Sensitivity analysis is carried out for all the future scenarios to understand the impact of the possible situations that the system may face. First, the wind production is varied 10% in both directions, representing different weather years. Second, it is considered that the power demand could increase due to a combination of increased number of electric vehicles and electrification of local industrial processes. The third varied parameter is the district heating demand, for which an increase would be possible with additional consumption points in the current district heating grid, or an expansion of the grid to new parts of the island. Figure 4a,b respectively show the effect of varying the sensitivity parameter value on system annual power imports and system annual net profit. For the other techno-economic parameters, the default values are used.
In all the scenarios, increased power demand has a strong impact on the economic feasibility of the system, as either decreasing electricity exports or increasing electricity imports are generally the only options to compensate for it. Consequently, the imports increase in the Variable scenario and its alternatives (+28 GWh/a), Low Variable (+57 GWh/a) and Dispatch (+50 GWh/a). While the CHP unit benefits the Dispatch scenario, the unit was already utilized highly with the default power demand and cannot be upscaled due to capacity limitations. Consequently, the scenario shows the highest relative increase (55%) in the electricity imports.
The impact of varied wind production depends on the installed wind capacity. Similar to the increased power demand, decreasing the wind production by 10% increases the electricity imports. The increase is 2.0% in BAU and, on average, 8.0% in the other scenarios. On the contrary, increasing the wind production by 10% does not translate directly into decreased electricity imports, as the production and demand do not fully coincide. The electricity imports are decreased by 2.0% in BAU and on average by 6.5% in the other scenarios. With varied wind production, Variable and its alternatives show higher variance in the annual net profit (±1.9 M€/a). Particularly the feasibility of Variable Heat is affected, as the availability of wind power influences the operation of the electric boilers. Therefore, the scenario exhibits the highest relative change in the annual net profit (±105%). In contrast, the scenarios with a lower amount of installed wind power show a higher resilience to changes in the wind production. However, only a marginal difference between Dispatch (±0.89 M€/a) and Low Variable (±0.94 M€/a) can be observed economically, indicating a small benefit from the CHP unit in the system balancing due to lower variance. Similarly, only marginal benefits from the battery energy storage can be observed when comparing the variance in the Variable and Variable Battery scenarios.
Due to the availability of low-cost fuels and the relatively high price of district heat, increased district heating demand improves the economic feasibility of the scenarios when the possible grid expansion costs are not considered. The improved feasibility can be particularly observed in Variable Heat, in which the full load operating hours of the electric boilers are increased compared to the scenario with default district heating demand. In Dispatch, the increased district heating demand also decreases the power imports by 4.7%, as the utilization of the CHP unit can be increased.

4. Discussion

When comparing the simulation results to the most relevant reference system, the island of Samsø, lower self-sufficiency was achieved in the power sector, with the best scenario yielding 80.6% compared to 94%. The results suggest that full self-sufficiency in the power sector of the island is challenging to achieve, and maintaining a certain reliance on imported electricity can be considered reasonable. As the system relies on local wind production, the solution alternative to imported electricity would have to be capable of continuous discharge due to varying wind conditions. When observing the load duration curves of the optimized scenarios, the production method alternative to power imports would have to be capable of filling continuous energy deficits of 3.7 GWh with 40 MW peak demand. To further decrease the reliance on imported electricity, increasing the local electricity production using biogas turbines would be possible due to the fuel availability (165 GWh/a). However, the option would imply changes to the existing biogas usage in the island, and the unit investment would likely be economically unfeasible due to low peak utilization time. Alternatively, synthetic fuel production could contribute to decreasing the amount of imported electricity, but the implementation potential is limited based on the low availability of pure CO2 sources on the island [35].
Due to local fuel availability, biomass CHP was considered an attractive technology option that could also improve the power system self-sufficiency. However, based on the simulation results, basing the energy system around the technology was not found to be economically feasible. While the CHP unit acted as a baseload and provided balancing during periods of low wind generation, the economic feasibility was the lowest out of the studied scenarios, despite the availability of low-cost solid biomass. As an advantage, analysis of monthly balances showed decreased seasonal dependence from imported electricity when compared to a similar system without the biomass CHP. However, in sensitivity analysis, the operation of the system was not shown to be significantly less sensitive to decreased wind production. To increase the self-sufficiency in the power sector, the capacity of the CHP unit could be scaled up from the selected maximum value with two implications. First, although the estimated biomass availability was not exceeded in the scenario, the fuel price could increase with a greater fuel consumption due to potential challenges in acquiring and transporting the biomass. Second, the CHP unit provided most of the district heating demand in the scenario, meaning that at a larger capacity, the unit would displace existing biomass heating boiler production or would have to be operated increasingly following the power demand. The latter option was also explored by Pääkkönen and Joronen [36] and noted to benefit economically from high operating flexibility, particularly in terms of lower minimum load.
Electrifying part of the district heating production was found to be the most feasible option economically. The option benefitted from the high wind capacity, which at times was sufficient to meet the local power demand and convert the maximum possible amount of wind power into heat, yet still being able to export the rest. Although the utilization of the electric boilers was limited due to the applied electricity tax and income lost from exported electricity, the lower investment costs compared to biomass boilers and high valuation of district heat compared to exported electricity made the scenario economically favorable. Removing the electricity tax was shown to imply changes to the optimal system design, increasing the power-to-heat conversion from 3.0 GWh to 23.1 GWh. While industrial-scale heat pumps were excluded from the study due to lack of identified local waste heat availability, the technology could offer a superior solution due to higher power-to-heat efficiency compared to the electric boilers. Considering the other scenarios with different technology solutions, additional value was gained from a centralized electrical energy storage, which increased power sector self-sufficiency by one percentage point when compared to a situation without the storage. Factors limiting the value of the storage included high available transmission capacity, and the modelling approach, which allowed the storage to be only charged with wind power.
On system level, the studied scenarios generally improved the economic feasibility compared to the present situation while simultaneously increasing the share of locally produced renewable energy. It should be noted that the studied scenarios show negative annual net profit, which is mainly explained due to the wind power. The results exclude the national feed-in tariff for the wind production [59], as Åland is not eligible for the tariff. In reality, both the existing and upcoming wind projects may receive additional financing through a regional support mechanism, which the results do not account for due to a lack of data from the tariff levels. In practice, the economic feasibility of the scenarios would rely on the completion of large wind projects, but all the scenarios could be implemented with the existing power transmission capacity, as the theoretical maximum power transmission capacity (190 MW) was not reached in any of the scenarios. The maximum hourly import took place in BAU (69.6 MW) and the maximum hourly export in Variable and its alternatives (160.2 MW). The values imply that all the available transmission lines would have to be heavily utilized at times because of power export, opposed to the current primary utilization of one of the transmission connections. Consequently, if the power transmission capacity was temporarily limited due to technical reasons, the forced production curtailment could make the scenarios with higher wind capacity less feasible.

5. Conclusions

The starting point for renewable energy transition in the Åland Islands is advanced, as the district heating sector is readily mainly renewable and large power transmission capacity is available. However, as over 75% of the electricity is currently imported and large increase in wind power capacity is planned, the problem focused on finding the cost-optimal method for supporting the wind integration. The work outlined the approach to technologically mature solutions, including conversion of power to heat and combined heat and power (CHP) production using solid biomass, which simultaneously could be implemented without large infrastructure changes, provide system balancing, and convert the energy production renewable. As a benefit of the approach, the achievable results or their timeline do not rely primarily on private consumers.
Due to the available power transmission capacity, the island energy system has the ease to select the targeted level of self-sufficiency in the power sector. Therefore, the formulated scenarios did not set full self-sufficiency as the strict target; instead, 80.6% was reached with the best scenario consisting of high wind capacity (185 MW) and an electrical energy storage. With the studied approaches, increasing the value would require changes reducing benefits in the existing system design, such as altering material circulation loops to reallocate fuel resources from their current use, replacing existing biomass-based heat production capacity, or underutilizing the power transmission infrastructure. Alternative approaches such as the production of synthetic fuels or hydrogen, or as shown by a previous study, supporting the power sector with vehicle-to-grid discharging, should be consequently focused also in other similar systems, if the primary target is full self-sufficiency.
While the role of biomass CHP has been seen important and considered a cost-effective option to provide system flexibility, the study did not find the technology a favorable investment option in the wind-based energy system. Although the CHP unit would make use of local biomass resources such as forest residues with no other significant use, the investment would not be justified due to low economic feasibility based on the modelling. The annual net profit was shown to be −7.9 M€/a, which was lower than in the business-as-usual scenario (−3.9 M€/a). However, biomass CHP was shown to decrease seasonal dependence on imported electricity, and therefore, to increase the resilience of the system. The results showed power-to-heat as economically the best option for the system (−1.9 M€/a) due to effective utilization of wind power peaks coinciding with district heating demand, allowing powerful sector coupling. With more stringent sustainability criteria for biomass, and lower electricity taxation for the power-to-heat conversion, the solution could become an even more preferable option for the island and other similar systems.
When interpreting the results of this study for other areas, conclusions can be drawn from the relative benefits of the different approaches. However, the local characteristics such as weather conditions and variable renewable energy potential, demand patterns, and the available technology options all influence the results. For further research, several points can be identified. Regarding the simulated system operation, the study included a limited amount of scenarios and sector coupling. A wider range of technology options to provide the heating in an island energy system, at least in a complementary role, could be considered. Examples of such technologies include geothermal energy and solar thermal production. Second, although the developed optimization model was successfully validated against reference data, not all the relevant phenomena were captured by the model. For example, the results of the work could be enhanced by accounting for grid thermal inertia, which could be achieved with dynamic system simulation. Finally, the simulations assumed that imported electricity is available for the island at all times. A strict requirement of temporary capability to island mode operation would be favorable for local dispatchable production such as biomass CHP, but also important from the system resilience perspective, and therefore could be considered in similar future studies.

Author Contributions

Conceptualization, T.T. and M.T.; methodology, T.T. and K.K.; software, T.T. and A.T.; validation, K.K. and A.T.; formal analysis, T.T. and A.T.; investigation, K.K. and A.T.; data curation, K.K.; writing—original draft preparation, T.T.; writing—review and editing, K.K.; visualization, T.T. and K.K.; supervision, M.T.; project administration, T.T. All authors have read and agreed to the published version of the manuscript.

Funding

This research was funded by Business Finland.

Institutional Review Board Statement

Not applicable.

Informed Consent Statement

Not applicable.

Data Availability Statement

Restrictions apply to the availability of these data. Reference system data was obtained from CLIC Innovation and are available from the authors with the permission of CLIC Innovation.

Acknowledgments

The authors would like to thank the support from the partners involved in the research project “CEMBioFlex” leading to this publication.

Conflicts of Interest

The authors declare no conflict of interest. The funders had no role in the design of the study; in the collection, analyses, or interpretation of data; in the writing of the manuscript, or in the decision to publish the results.

Nomenclature

BAUBusiness-as-usual
BBBiomass boiler
CAPEXCapital expenditures
CHPCombined heat and power
EBElectric boiler
OPEXOperating expenditures
PVPhotovoltaic
VREVariable renewable energy
WACCWeighted average cost of capital

Appendix A

The model consists of two different optimization tasks: scheduling the unit and storage operation on hourly resolution with a full foresight within the year, and optimizing the capacity of potential new investments. For the capacity optimization, yearly time resolution is used, leading to a single time window. The symbols used in the model equations are introduced in Table A1.
Table A1. Notation used in the optimization model description.
NotationDescription
pparameter
vvariable
thour index
Tset of hours (1…8760)
uunit
Uset of units
The objective function (Equation (A1)) of the model includes the cost and income terms relevant for the studied system. The income terms comprise income from sold electricity (Equation (A2)), income from sold district heat (Equation (A3)), and income from exported electricity (Equation (A4)). The included cost terms are fuel costs (Equation (A5)), other variable operating costs such as electricity tax (Equation (A6)), emission allowance costs depending on the fossil fuel share in the fuel mix of the unit (Equation (A7)), costs from imported electricity (Equation (A8)), and annualized investment costs of units included in the capacity optimization (Equation (A9)).
v obj = t T ( v t in , el + v t in , th + v t in , export v t cost , fuel v t cost , OPEX , var v t cost , emission v t cost , import ) v cost , inv
v t in , el = u v u , t el p t price , el
v t in , th = u v u , t th p t price , th
v t in , export = v t el , export p t price , el
v t cost , fuel = u p u fuel , nom v u , t load p u price , fuel
v t cost , OPEX , var = u p u fuel , nom v u , t load p u cost , OPEX , var
v t cost , emission = u p u fuel , nom v u , t load p price , CO 2 p share , fossil
v t cost , import = v t el , import p t price , el p penalty , import
v cost , inv = u v u inv
In addition to the variable terms, fixed costs are calculated for determining the system annual net profit. Equation (A10) presents the calculation of fixed operating costs for the heat and power generation units based on the unit nominal capacity. For the units included in the capacity optimization, the fixed operating costs are taken into account in the specific investment cost. The annualized investment cost for the fixed unit investments, for example variable renewable energy and storage technologies, is calculated in Equation (A12) using the weighted average cost of capital, investment lifetime, and the investment present value (Equation (A11)).
p cost , OPEX , fix = u p u nom p u cost , OPEX , fix
p cost , investment = u p u nom p u cost , inv , spec
p u payment = p cost , investment p u WACC ( 1 + p u WACC ) p u lifetime / [ ( 1 + p u WACC ) p u lifetime 1 ]
For all dispatchable units generating heat or power, the fuel input is converted into heat and power outputs using Equations (A13) and (A14). For the CHP unit, the minimum and maximum load constraints are formulated using binary variables as shown in Equations (A15) and (A16). For other boiler units, minimum load is not applied to save computational time.
v u , t th = p u fuel , nom v u , t load p u eff , th
v u , t el = p u fuel , nom v u , t load p u eff , el
v u , t load v u , t status p u load , max
v u , t load v u , t status p u load , min
Energy balance equations constrain the hourly operation of power system (Equation (A17)) and district heating system (Equation (A18)) so that the demand is equal to the supply, accounting for unit production, storage discharge, power transmission, as well as calculated wind and solar production. Possibility to overproduce the demand or curtail the variable renewable power generation is not included. For the power transmission (Equations (A19) and (A20)), the hourly transmission is constrained below the maximum transmission capacity.
p t el , dem = u U v u , t el + d v t storage , cap , el + v t import v t export + p t wind + p t solar
p t th , dem = u U v u , t th + d v t storage , cap , th
v t el , import p t el , trans , max
v t el , export p t el , trans , max
Both the electrical and thermal energy storages are modelled similarly without accounting for storage losses. The hourly capacity (Equation (A21)) and the hourly discharge (Equations (A22) and (A23)) are constrained between selected minimum and maximum values. Energy storages are initialized with half of the maximum capacity (Equation (A24)), and are expected to return to the initial state at the end of the time horizon (Equation (A25)).
0 v t storage , cap p storage , cap , max
d v t storage , cap = v t + 1 storage , cap v t storage , cap
p storage , delta , min d v t storage , cap p storage , delta , max
v 1 storage , cap = 0.5 p storage , cap , max
v 1 storage , cap = v n t storage , cap
For the units included in the capacity optimization, the specific annualized investment cost is calculated using specific investment cost, weighted average cost of capital (WACC) and investment lifetime (Equation (A26)). The resulting value is multiplied by the unit maximum potential capacity (Equation (A27)) to create the upper bound for the annualized investment cost value (Equation (A28)), which is determined by optimizing the unit nominal capacity (Equation (A29)). Further constraints are applied to ensure that the investment is correctly calculated: lower bound for the annualized investment cost value (Equation (A30)), as well as binary constraints for activating the investment (Equation (A31)) and allowing generation for an activated unit (Equation (A32)), where M is a large positive number.
p u inv , spec = p u cost , spec p u WACC ( 1 + p u WACC ) p u lifetime / [ ( 1 + p u WACC ) p u lifetime 1 ]
p u inv , max = p u fuel , max p u inv , spec
v u inv p u inv , max
v u inv = v u fuel , nom p u inv , spec
v u inv p u inv , max + M ( 1 v u active ) 0
v u inv M v u active
p u fuel , nom v u , t load M v u active

Appendix B

Table A2 provides the summary of the system operation in the simulated scenarios, expanding the information provided in Chapter 3.
Table A2. Summary of the system operation in the simulated scenarios. For the units, the rated capacity and total annual production are shown. For power transmission, the maximum power, total annual transmission and percentage of total power consumption are shown.
UnitBaseBAUDispatchLow VariableVariableVariable HeatVariable Battery
Wind powerMWe21218585185185185
GWh57.357.3209.8209.8611.0611.0611.0
Solar PVMWe-151515151515
GWh-14.014.014.014.014.014.0
Biomass boiler #1MWth11111111111111
GWh26.527.49.878.178.126.330.3
Biomass boiler #2MWth5555555
GWh76.180.33.829.729.781.477.4
Oil boiler #1MWth2424-----
GWh12.117.8-----
Oil boiler #2MWth4545-----
GWh4.66.5-----
Biomass CHPMWe--15----
GWhth--118.9----
GWhe--71.2----
New biomass boilerMWth--02727527
GWh--0.024.324.321.324.3
New electric boilerMWth-----15-
GWh-----3.0-
Power importMWe61.369.650.765.758.358.370.6
GWh253.3278.891.0157.771.671.667.9
% of total81.579.726.045.020.420.419.4
Power exportMWe0.00.859.059.0160.2160.2160.2
GWh0.00.036.031.4346.5343.4342.8

References

  1. IRENA. Power System Flexibility for the Energy Transition, Part 1: Overview for Policy Makers; International Renewable Energy Agency: Abu Dhabi, United Arab Emirates, 2018. [Google Scholar]
  2. IEA. Global Energy Review 2020; International Energy Agency: Paris, France, 2020. [Google Scholar]
  3. Kiviluoma, J. Managing Wind Power Variability and Uncertainty through Increased Power System Flexibility. Ph.D. Thesis, Aalto University, Espoo, Finland, 2013. [Google Scholar]
  4. Auer, H.; Haas, R. On integrating large shares of variable renewables into the electricity system. Energy 2016, 115, 1592–1601. [Google Scholar] [CrossRef]
  5. Joos, M.; Staffell, I. Short-term integration costs of variable renewable energy: Wind curtailment and balancing in Britain and Germany. Renew. Sustain. Energy Rev. 2018, 86, 45–65. [Google Scholar] [CrossRef]
  6. Paiho, S.; Saastamoinen, H.; Hakkarainen, E.; Similä, L.; Pasonen, R.; Ikäheimo, J.; Rämä, M.; Tuovinen, M.; Horsmanheimo, S. Increasing flexibility of Finnish energy systems—A review of potential technologies and means. Sustain. Cities Soc. 2018, 43, 509–523. [Google Scholar] [CrossRef]
  7. Cochran, J.; Miller, M.; Zinaman, O.; Milligan, M.; Arent, D.; Palmintier, B.; O’Malley, M.; Mueller, S.; Lannoye, E.; Tuohy, A.; et al. Flexibility in 21st Century Power Systems; NREL: Golden, CO, USA, 2014.
  8. Lund, P.D.; Lindgren, J.; Mikkola, J.; Salpakari, J. Review of energy system flexibility measures to enable high levels of variable renewable electricity. Renew. Sustain. Energy Rev. 2015, 45, 785–807. [Google Scholar] [CrossRef] [Green Version]
  9. Arasto, A.; Chiaramonti, D.; Kiviluoma, J.; van den Heuvel, E.; Waldheim, L.; Maniatis, K.; Sipilä, K. Bioenergy’s Role in Balancing the Electricity Grid and Providing Storage Options—An EU Perspective; IEA Bioenergy: Paris, France, 2017. [Google Scholar]
  10. Statistical Report 2020; Bioenergy Europe: Brussels, Belgium, 2020.
  11. European Commission. ‘Fit for 55’: Delivering the EU’s 2030 Climate Target on the Way to Climate Neutrality; COM/2021/550; European Commission: Brussels, Belgium, 2021. [Google Scholar]
  12. Bloess, A. Modeling of combined heat and power generation in the context of increasing renewable energy penetration. Appl. Energy 2020, 267, 114727. [Google Scholar] [CrossRef]
  13. Purkus, A.; Gawel, E.; Szarka, N.; Lauer, M.; Lenz, V.; Ortwein, A.; Tafarte, P.; Eichhorn, M.; Thrän, D. Contributions of flexible power generation from biomass to a secure and cost-effective electricity supply—A review of potentials, incentives and obstacles in Germany. Energy Sustain. Soc. 2018, 8, 18. [Google Scholar] [CrossRef]
  14. Rinne, S.; Syri, S. The possibilities of combined heat and power production balancing large amounts of wind power in Finland. Energy 2015, 82, 1034–1046. [Google Scholar] [CrossRef]
  15. Lepiksaar, K.; Mašatin, V.; Latõšov, E.; Siirde, A.; Volkova, A. Improving CHP flexibility by integrating thermal energy storage and power-to-heat technologies into the energy system. Smart Energy 2021, 2, 100022. [Google Scholar] [CrossRef]
  16. Luo, H.; Ge, W.; Sun, J.; Jiang, Q.; Gong, Y. Using Thermal Energy Storage to Relieve Wind Generation Curtailment in an Island Microgrid. Energies 2021, 14, 2851. [Google Scholar] [CrossRef]
  17. Pilpola, S.; Lund, P.D. Different flexibility options for better system integration of wind power. Energy Strategy Rev. 2019, 26, 100368. [Google Scholar] [CrossRef]
  18. Bloess, A.; Schill, W.P.; Zerrahn, A. Power-to-heat for renewable energy integration: A review of technologies, modeling approaches, and flexibility potentials. Appl. Energy 2018, 212, 1611–1626. [Google Scholar] [CrossRef]
  19. Averfalk, H.; Ingvarsson, P.; Persson, U.; Gong, M.; Werner, M. Large heat pumps in Swedish district heating systems. Renew. Sustain. Energy Rev. 2017, 79, 1275–1284. [Google Scholar] [CrossRef]
  20. Kirkerud, J.G.; Bolkesjø, T.F.; Trømborg, E. Power-to-heat as a flexibility measure for integration of renewable energy. Energy 2017, 128, 776–784. [Google Scholar] [CrossRef]
  21. Skytte, K.; Bergaentzlé, E.R.; Soysal, E.R.; Olsen, O.J. Design of grid tariffs in electricity systems with variable renewable energy and power to heat. In Proceedings of the 2017 14th International Conference on the European Energy Market (EEM), Dresden, Germany, 6–9 June 2017; pp. 1–7. [Google Scholar]
  22. Cross, S.; Padfield, D.; Ant-Wuorinen, R.; King, P.; Syri, S. Benchmarking island power systems: Results, challenges, and solutions for long term sustainability. Renew. Sustain. Energy Rev. 2017, 80, 1269–1291. [Google Scholar] [CrossRef]
  23. Blechinger, P.; Cader, C.; Bertheau, P.; Huyskens, H.; Seguin, R.; Breyer, C. Global analysis of the techno-economic potential of renewable energy hybrid systems on small islands. Energy Policy 2016, 98, 674–687. [Google Scholar] [CrossRef]
  24. ÅSUB. Statistisk Årsbok för Åland 2018 [Statistical Yearbook of Åland 2018]. Available online: https://www.asub.ax/sites/www.asub.ax/files/attachments/page/statistisk_arsbok_for_aland_2018_1.pdf (accessed on 17 September 2020).
  25. Government of Åland. Energi-Och Klimatstrategi för Åland till år 2030 [Energy and Climate Strategy of Åland for 2030]. Available online: https://www.regeringen.ax/sites/www.regeringen.ax/files/attachments/page/lr_energi_klimatstrat_2030.pdf (accessed on 18 September 2020).
  26. Gils, H.G.; Simon, S. Carbon neutral archipelago—100% renewable energy supply for the Canary Islands. Appl. Energy 2017, 188, 342–355. [Google Scholar] [CrossRef] [Green Version]
  27. Meschede, H.; Child, M.; Breyer, C. Assessment of sustainable energy system configuration for a small Canary island in 2030. Energy Convers. Manag. 2017, 165, 363–372. [Google Scholar] [CrossRef]
  28. Katsaprakakis, D.A.; Thomsen, B.; Dakanali, I.; Tzirakis, K. Faroe Islands: Towards 100% R.E.S. penetration. Renew. Energy 2019, 135, 473–484. [Google Scholar] [CrossRef]
  29. Meza, C.G.; Rodríguez, C.Z.; D’Aquino, C.A.; Amado, N.B.; Rodrigues, A.; Sauer, I.L. Toward a 100% renewable island: A case study of Ometepe’s energy mix. Renew. Energy 2019, 132, 628–648. [Google Scholar] [CrossRef]
  30. Garcia Latorre, F.J.; Quintana, J.J.; de la Nuez, I. Technical and economic evaluation of the integration of a wind-hydro system in El Hierro island. Renew. Energy 2019, 134, 186–193. [Google Scholar] [CrossRef]
  31. Notton, G.; Nivet, M.L.; Zafirakis, D.; Motte, F.; Voyant, C.; Fouilloy, A. Tilos, the first autonomous renewable green island in Mediterranean: A Horizon 2020 project. In Proceedings of the 15th International Conference on Electrical Machines, Drives and Power Systems ELMA, Sofia, Bulgaria, 1–3 June 2017; pp. 102–105. [Google Scholar]
  32. Marczinkowski, H.M.; Østergaard, P.A.; Djørup, S.R. Transitioning Island Energy Systems—Local Conditions, Development Phases, and Renewable Energy Integration. Energies 2019, 12, 3484. [Google Scholar] [CrossRef] [Green Version]
  33. Leichthammer, J.M. Different Optimisation Perspectives in the Åland Energy Market due to the Increase of Renewable Energies. Master’s Thesis, Technische Universität Darmstadt, Darmstadt, Germany, 2016. [Google Scholar]
  34. Child, M.; Nordling, A.; Breyer, C. Scenarios for a sustainable energy system in the Åland Islands in 2030. Energy Convers. Manag. 2017, 137, 49–60. [Google Scholar] [CrossRef]
  35. Jacobson, T.; Saari, P.; Laitinen, T. Concept Formulation for the Demonstration of the Flexible Energy System and the Relevance of the Demonstration to Export and Investments in Finland; CLIC Innovation Oy: Helsinki, Finland, 2017. [Google Scholar]
  36. Pääkkönen, A.; Joronen, T. Revisiting the feasibility of biomass-fueled CHP in future energy systems—Case study of the Åland Islands. Energy Convers. Manag. 2019, 188, 66–75. [Google Scholar] [CrossRef]
  37. Kraftnät Åland Ab. Årsberättelser [Annual Reports]. Available online: http://www.kraftnat.aland.fi/text.con?iPage=11&m=21 (accessed on 29 October 2020).
  38. CLIC Innovation. Final Joint Report of the Projects FLEXe DEMO and CEMBioFlex; CLIC Innovation: Helsinki, Finland, 2019. [Google Scholar]
  39. Allwinds Ab. De Åländska Vindkraftverken [The Wind Power Plants of Åland]. Available online: https://www.allwinds.ax/de-alandska-vindkraftverken/ (accessed on 29 October 2020).
  40. Finnish Energy. District Heating Statistics. Available online: https://energia.fi/en/newsroom/publications/district_heating_statistics.html#material-view (accessed on 29 October 2020).
  41. Ålands Skogsindustrier Ab. Verksamhetsberättelse 2017 [Annual Report 2017]. Available online: http://www.skogsindustrier.ax/sites/www.skogsindustrier.ax/files/attachments/verksamhetsberattelse_2017.pdf (accessed on 26 October 2020).
  42. Government of Åland Skogs Åland 2027. Available online: https://www.regeringen.ax/sites/www.regeringen.ax/files/attachments/page/skogsaland_2027.pdf (accessed on 27 October 2020).
  43. Alakangas, E.; Hurskainen, M.; Laatikainen-Luntama, J.; Korhonen, J. Suomessa Käytettävien Polttoaineiden Ominaisuuksia [Properties of Fuels Used in Finland]; VTT Technical Research Centre of Finland: Espoo, Finland, 2016. [Google Scholar]
  44. Allerborg, M.; Bergström, J.; Englöf, J.; Holroyd, J.; Hultin, C.; Reuter, O. Rötning av Bioavfall på Åland [Digestion of Biowaste in Åland]; KTH: Stockholm, Sweden, 2015. [Google Scholar]
  45. Child, M.; Nordling, A.; Breyer, C. Scenarios for a Sustainable Energy System in the Åland Islands in 2030—Results from EnergyPlan Modelling. Available online: https://flexens.com/wp-content/uploads/2021/04/Aland_Scenarios.pdf (accessed on 11 December 2020).
  46. Ålands Miljöservice. Avsättning av Slutprodukterna Från en Åländsk Biogasanläggning [Disposal of the End Products from a Biogas Plant in Åland]. Available online: https://www.mise.ax/component/docman/doc_download/378-avsattning-av-slutprodukter-fran-en-alandsk-biogasanlaggning (accessed on 21 October 2020).
  47. Ålandsmejeritet. Energisamarbete [Energy Cooperation]. Available online: https://www.aca.ax/sites/www.aca.ax/files/upload/gastronomen_webb.pdf (accessed on 21 October 2020).
  48. Mariehamns Energi Ab. Årsberättelse 2017 [Annual Report of 2017]. Available online: https://issuu.com/straxkommunikation/docs/arsberattelse_2017 (accessed on 22 October 2020).
  49. Nord Pool. Historical Market Data. Available online: https://www.nordpoolgroup.com/historical-market-data/ (accessed on 22 October 2020).
  50. Statistics Finland. Fuel Classification. Available online: https://tilastokeskus.fi/tup/khkinv/khkaasut_polttoaineluokitus.html (accessed on 23 October 2020).
  51. Sandbag. Tracking the European Union Emissions Trading System Carbon Market Price Day-by-Day. Available online: https://sandbag.be/index.php/carbon-price-viewer/ (accessed on 23 November 2020).
  52. Finnish Tax Administration. Tax Rates on Electricity and Certain Fuels. Available online: https://www.vero.fi/en/businesses-and-corporations/taxes-and-charges/excise-taxation/sahko-ja-eraat-polttoaineet/Tax-rates-on-electricity-and-certain-fuels/ (accessed on 23 October 2020).
  53. Finnish Meteorological Institute. Havaintojen Lataus [Download the Observations]. Available online: https://www.ilmatieteenlaitos.fi/havaintojen-lataus (accessed on 24 November 2020).
  54. ENERCON. ENERCON Product Overview. Available online: https://www.enercon.de/fileadmin/Redakteur/Medien-Portal/broschueren/pdf/en/ENERCON_Produkt_en_06_2015.pdf (accessed on 24 November 2020).
  55. Technology Data for Energy Plants for Electricity and District Heating Generation; Danish Energy Agency: København, Denmark, 2019.
  56. Statistics Finland. Energy Prices 2020, 2nd Quarter. Available online: https://www.stat.fi/til/ehi/2020/02/index_en.html (accessed on 24 November 2020).
  57. Hart, W.E.; Watson, J.P.; Woodruff, D.L. Pyomo: Modeling and solving mathematical programs in Python. Math. Program. Comput. 2011, 3, 219–260. [Google Scholar] [CrossRef]
  58. IBM. IBM CPLEX Optimizer. Available online: https://www.ibm.com/analytics/cplex-optimizer (accessed on 24 November 2020).
  59. Ministry of Economic Affairs and Employment. Feed-In Tariff for Renewable Energy. Available online: https://tem.fi/en/feed-in-tariff-for-renewable-energy (accessed on 23 October 2020).
Figure 1. Simulated power sector operation of the different scenarios: (a) unit power production and (b) system electricity transmission.
Energies 14 06423 g001
Figure 2. Simulated (a) district heat production and (b) fuel consumption of the different scenarios. In the former subfigure, New EB and New BB refer to new electric and biomass boiler capacity, respectively.
Energies 14 06423 g002
Figure 3. System annual income and cost structure for the simulated scenarios. Values for net profit shown.
Energies 14 06423 g003
Figure 4. Sensitivity analysis consisting of four separate assumption changes in comparison to default scenarios: (a) system power imports and (b) system net profit.
Energies 14 06423 g004
Table 1. Summary of the production and storage unit capacities in the simulated scenarios. The existing dispatchable units are marked with an asterisk (*). For the technologies marked with two asterisks (**), the capacity is optimized using the shown value as the maximum value.
Production UnitUnitBaseBAUDispatchLow VariableVariableVariable HeatVariable Battery
Oil boiler #1 *MWth2424-----
Oil boiler #2 *MWth4545-----
Biomass boiler #1 *MWth11111111111111
Biomass boiler #2 *MWth5555555
Wind powerMWe21.321.38585185185185
of which onshoreMWe13.813.843.843.843.843.843.8
of which offshoreMWe7.57.541.241.2141.2141.2141.2
Solar PVMWe-151515151515
Biomass CHP **MWe--15----
Biomass boiler **MWth--3030303030
Power-to-heat **MWth-----15-
Thermal energy storageMWh--350----
Battery energy storageMWh------15
Table 2. Techno-economic parameters assumed for the scenarios. Values used in the Base scenario are shown in brackets.
ParameterUnitValueSource
Electricity demandGWh/a350 (311)Kraftnät Åland
District heat demandGWh/a132 (119)Mariehamns Energi
Maximum transmission capacityMW/h190[38]
Average electricity price€/MWh31.2[49]
Average district heat price€/MWh80[40]
Price of biomass€/MWh25Assumption
Biomass emission factort/TJ112[50]
Price of oil€/MWh45[56]
Oil emission factort/TJ73.1[50]
Price of CO2 emission allowances€/t40 (5.8)[51]
Table 3. Techno-economic parameters applied for the different power, heat and storage technologies (1 €/kWth, 2 €/MWhth, 3 €/kWhth, 4 €/kWhe).
TechnologyEfficiency (%)CAPEX (€/kWe)Fixed OPEX (% of CAPEX)Variable OPEX (€/MWhe)Investment Lifetime (a)
Wind, onshore-9002.62.430
Wind, offshore-13002.32.730
Solar PV-9501.2030
Biomass CHP50/3035504.23.825
Biomass heating boiler90665 14.81.0 225
Electric boiler98651.60.9620
Thermal energy storage-3 30.3040
Battery energy storage-200 41.51.925
Publisher’s Note: MDPI stays neutral with regard to jurisdictional claims in published maps and institutional affiliations.

