Article

OC6 Phase Ib: Floating Wind Component Experiment for Difference-Frequency Hydrodynamic Load Validation

National Renewable Energy Laboratory, Golden, CO 80401, USA
*
Author to whom correspondence should be addressed.
Energies 2021, 14(19), 6417; https://doi.org/10.3390/en14196417
Submission received: 13 August 2021 / Revised: 7 September 2021 / Accepted: 9 September 2021 / Published: 8 October 2021

Abstract

:
A new validation campaign was conducted at the W2 Harold Alfond Ocean Engineering Laboratory at the University of Maine to investigate the hydrodynamic loading on floating offshore wind substructures, with a focus on the low-frequency contributions that tend to drive extreme and fatigue loading in semisubmersible designs. A component-level approach was taken to examine the hydrodynamic loads on individual parts of the semisubmersible in isolation and then in the presence of other members to assess the change in hydrodynamic loading. A variety of wave conditions were investigated, including bichromatic waves, to provide a direct assessment of difference-frequency wave loading. An assessment of the impact of wave uncertainty on the loading was performed, with the goal of enabling validation with this dataset of numerical models with different levels of fidelity. The dataset is openly available for public use and can be downloaded from the U.S. Department of Energy Data Archive and Portal.

Graphical Abstract

1. Introduction

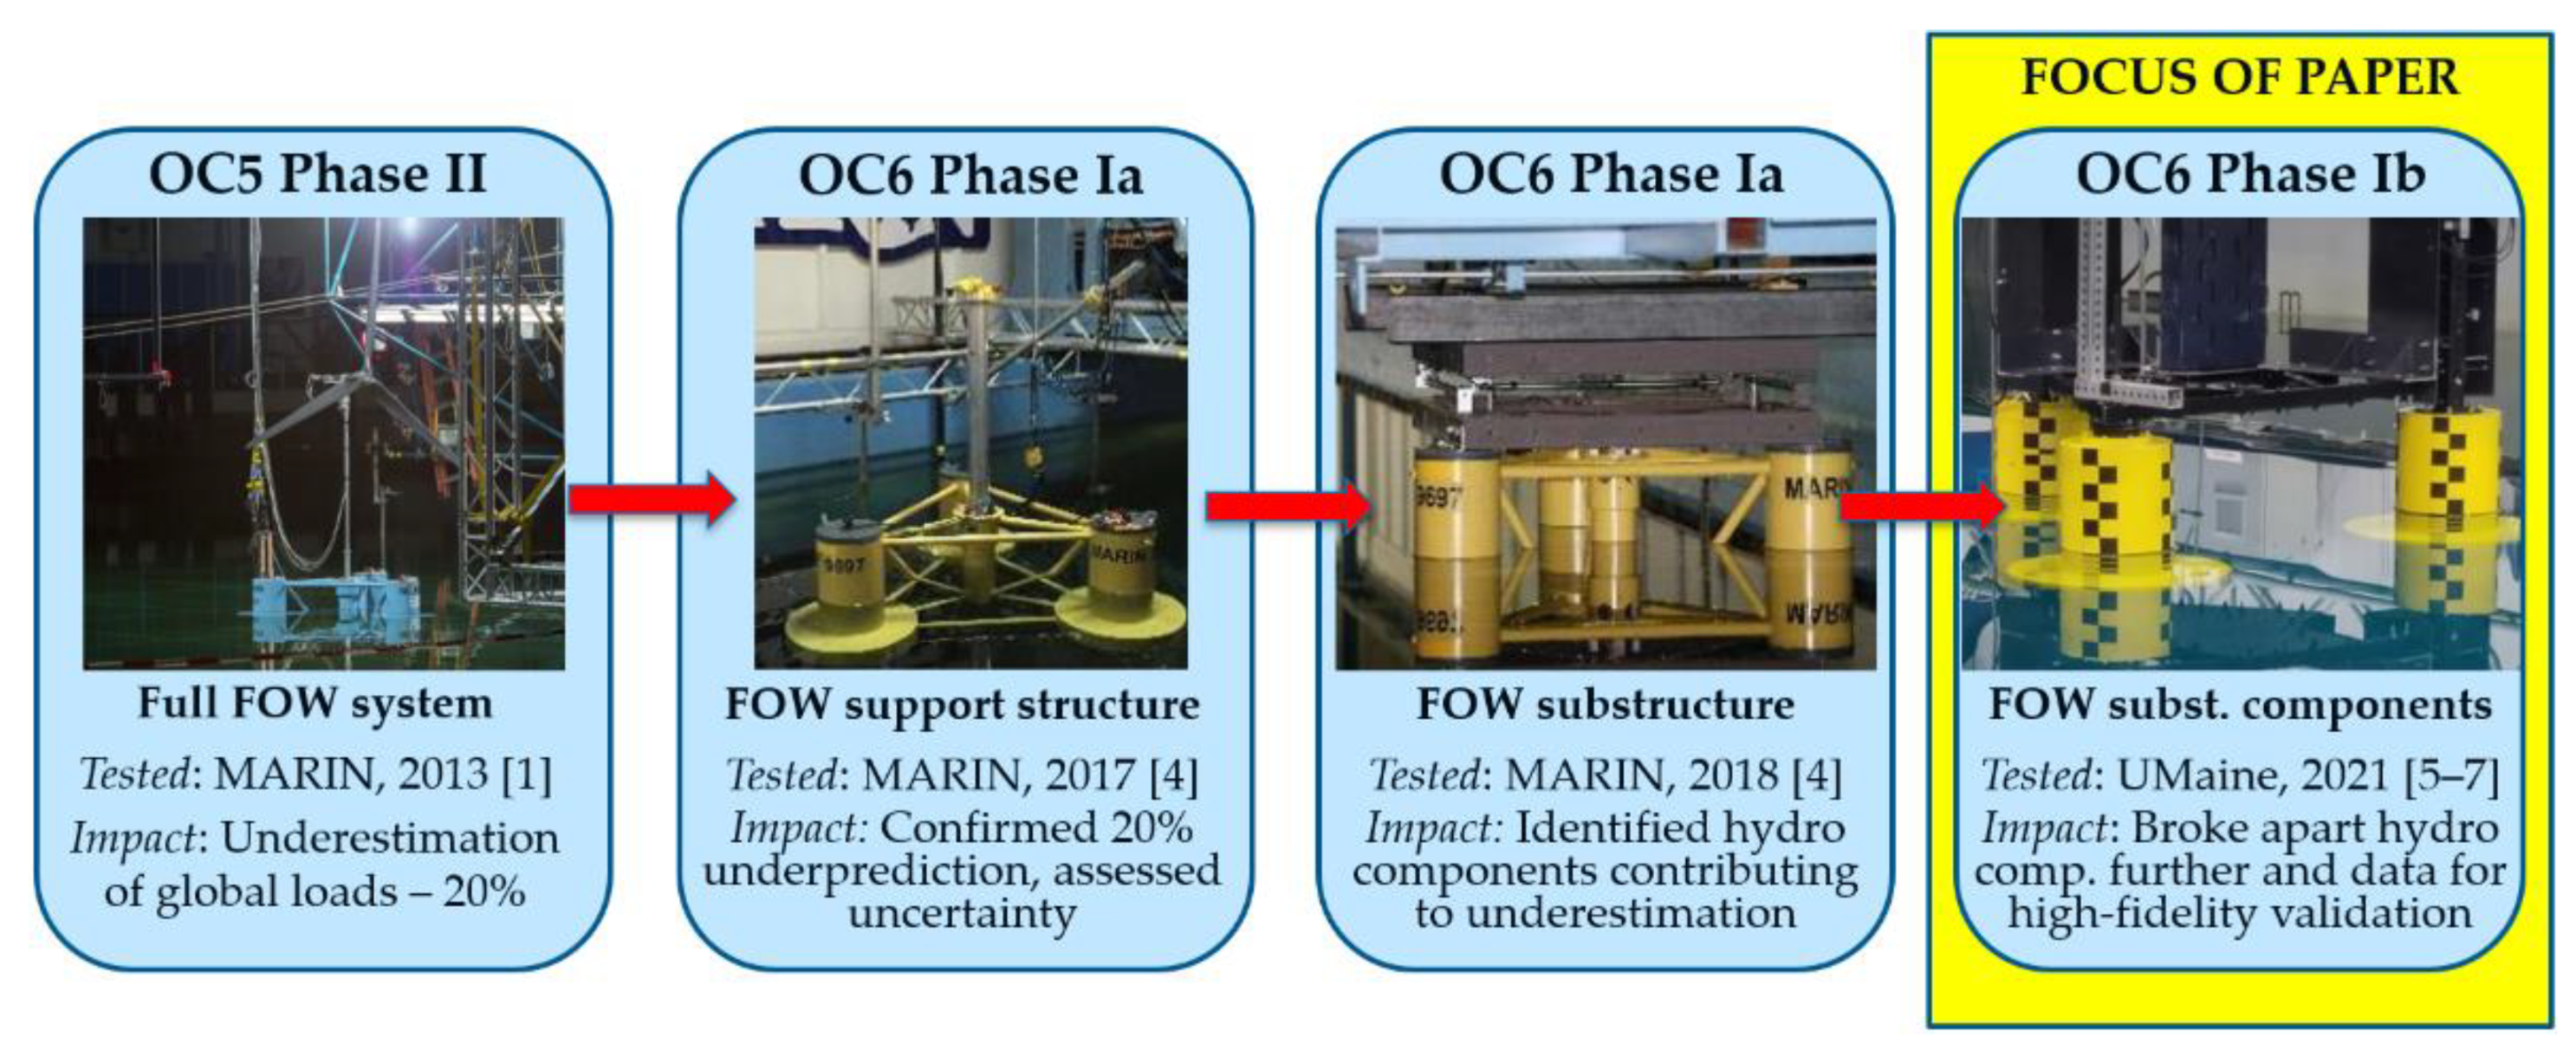
A new offshore wind validation campaign was recently conducted within the International Energy Agency (IEA) Wind Task 30, called the Offshore Code Comparison Collaboration, Continued, with Correlation and unCertainty (OC6) project. The aim of the OC6 project (initiated in 2019) is to perform more focused validation projects to investigate critical physical phenomena that drive the inaccuracy in load predictions by engineering-level modeling tools for offshore wind turbines based on potential-flow theory and/or Morison equation. There are four phases in the OC6 project, and Phase I is focused on the underprediction of the loads and resulting motion of floating wind semisubmersibles at their surge and pitch natural frequencies. This issue was identified within the OC5 Phase II project [1] when validating modeling tools against a scaled-model experiment of the OC5-DeepCwind semisubmersible in a wave tank under combined wind and wave loading. A persistent underprediction of the global loads and motion was identified, which came primarily from the underestimation of the loads/motion of the structure in the low-frequency region where the pitch and surge natural frequencies were located. With semisubmersibles, these frequencies typically lie outside the frequency range of linear wave excitation and are instead excited by nonlinear, low-frequency hydrodynamic loading [2,3]. This issue is more pronounced in severe sea states where the second-order difference-frequency wave load surpasses the contribution from wind at low frequencies [3].
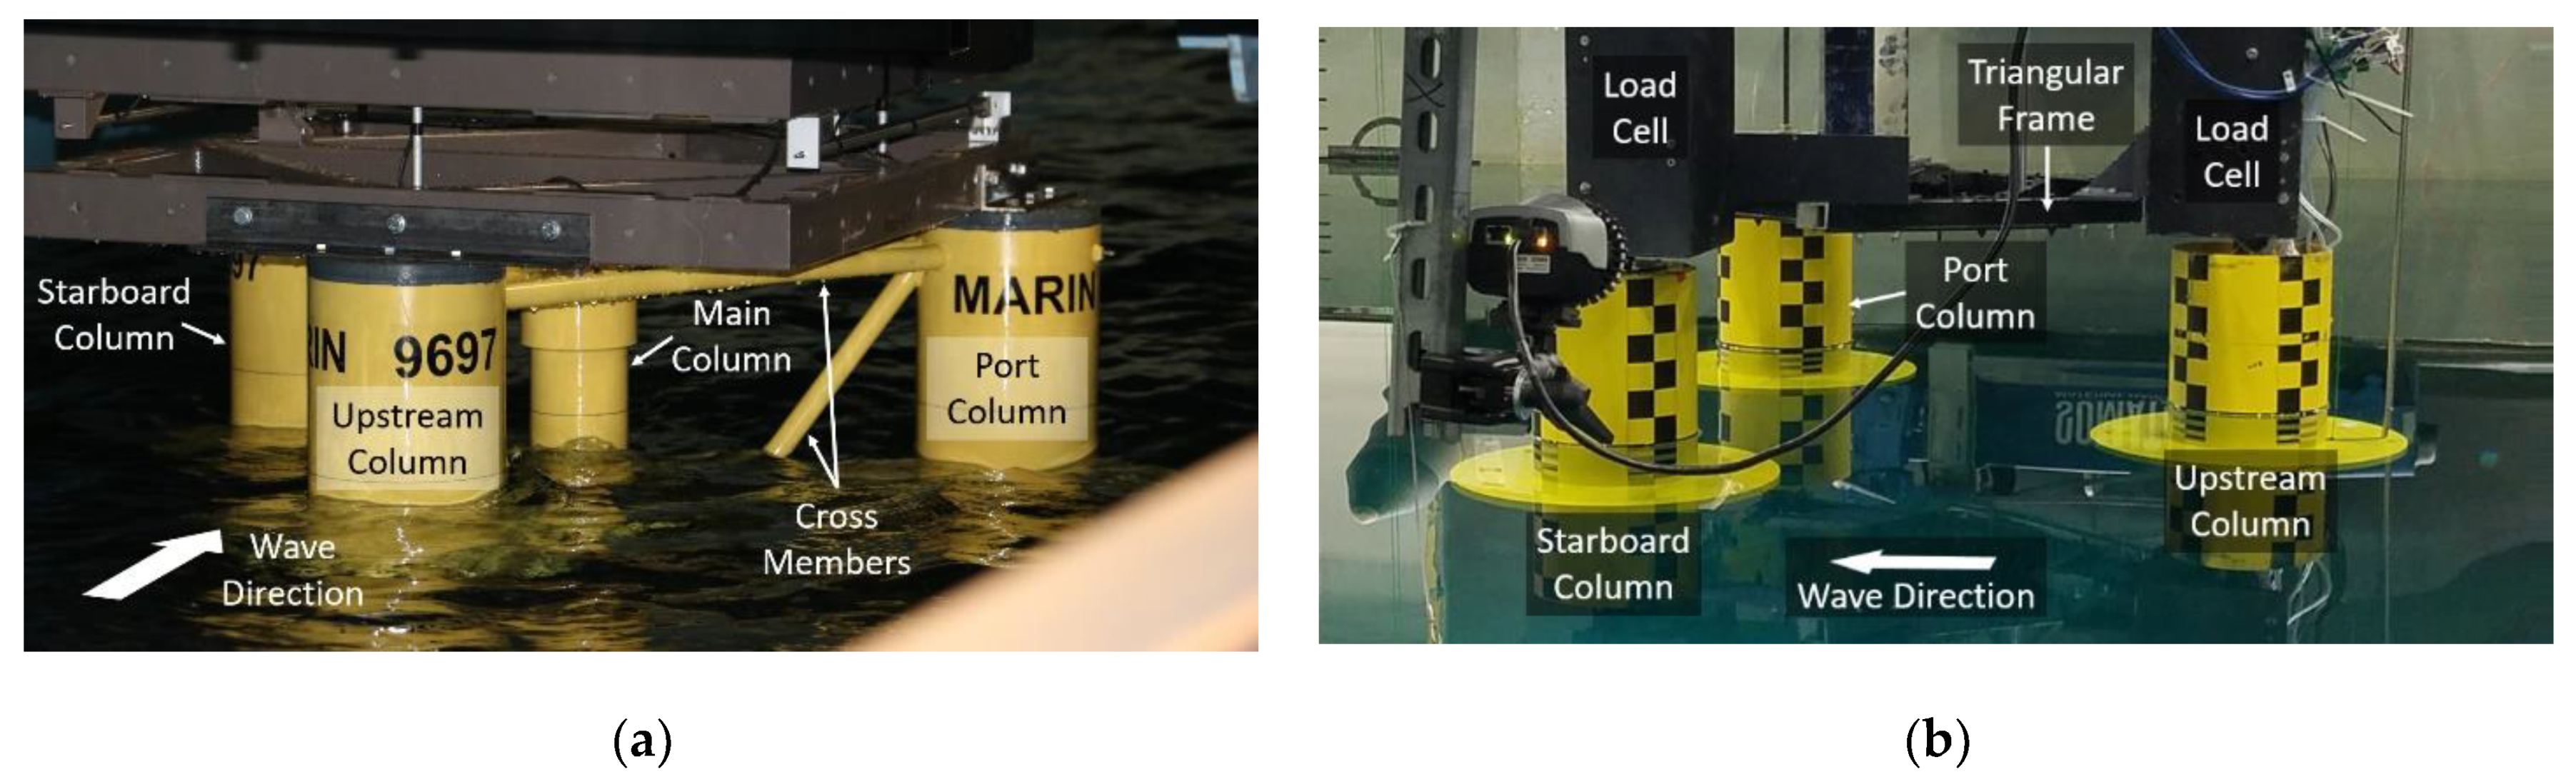
To further investigate the nonlinear hydrodynamic loading, two new wave-tank validation campaigns were performed at the concept basin of the Maritime Research Institute Netherlands (MARIN) in 2017 and 2018 (see Figure 1) using the OC5-DeepCwind semisubmersible design [1]. Experiments were performed with a fixed model and a model under forced oscillation to examine the wave diffraction and radiation loadings, respectively. Of course, viscous effects were also present with both configurations, which cannot be removed in wave-basin experiments. Experiments with a floating model were also performed, but with a simplified setup with no aerodynamic loads to focus specifically on the hydrodynamics of the substructure. Phase Ia of the OC6 project aimed to validate engineering-level simulation models against the measurements from these experiments to identify the cause for the underprediction of the nonlinear hydrodynamic response [4]. The conclusions from this work were that engineering modeling tools underpredict the low-frequency loads in all configurations, including when held fixed, forced to oscillate in surge, and freely floating. Load and motion estimates could be improved for one configuration through model tuning, but the same tuning would worsen the results for another configuration, pointing to the need for improvements to the modeling approach itself.
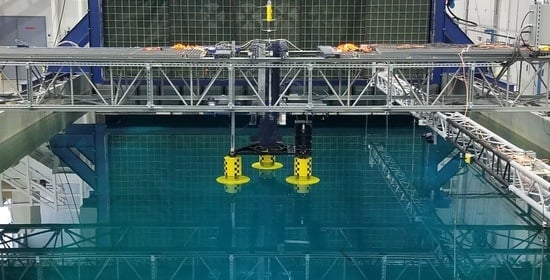
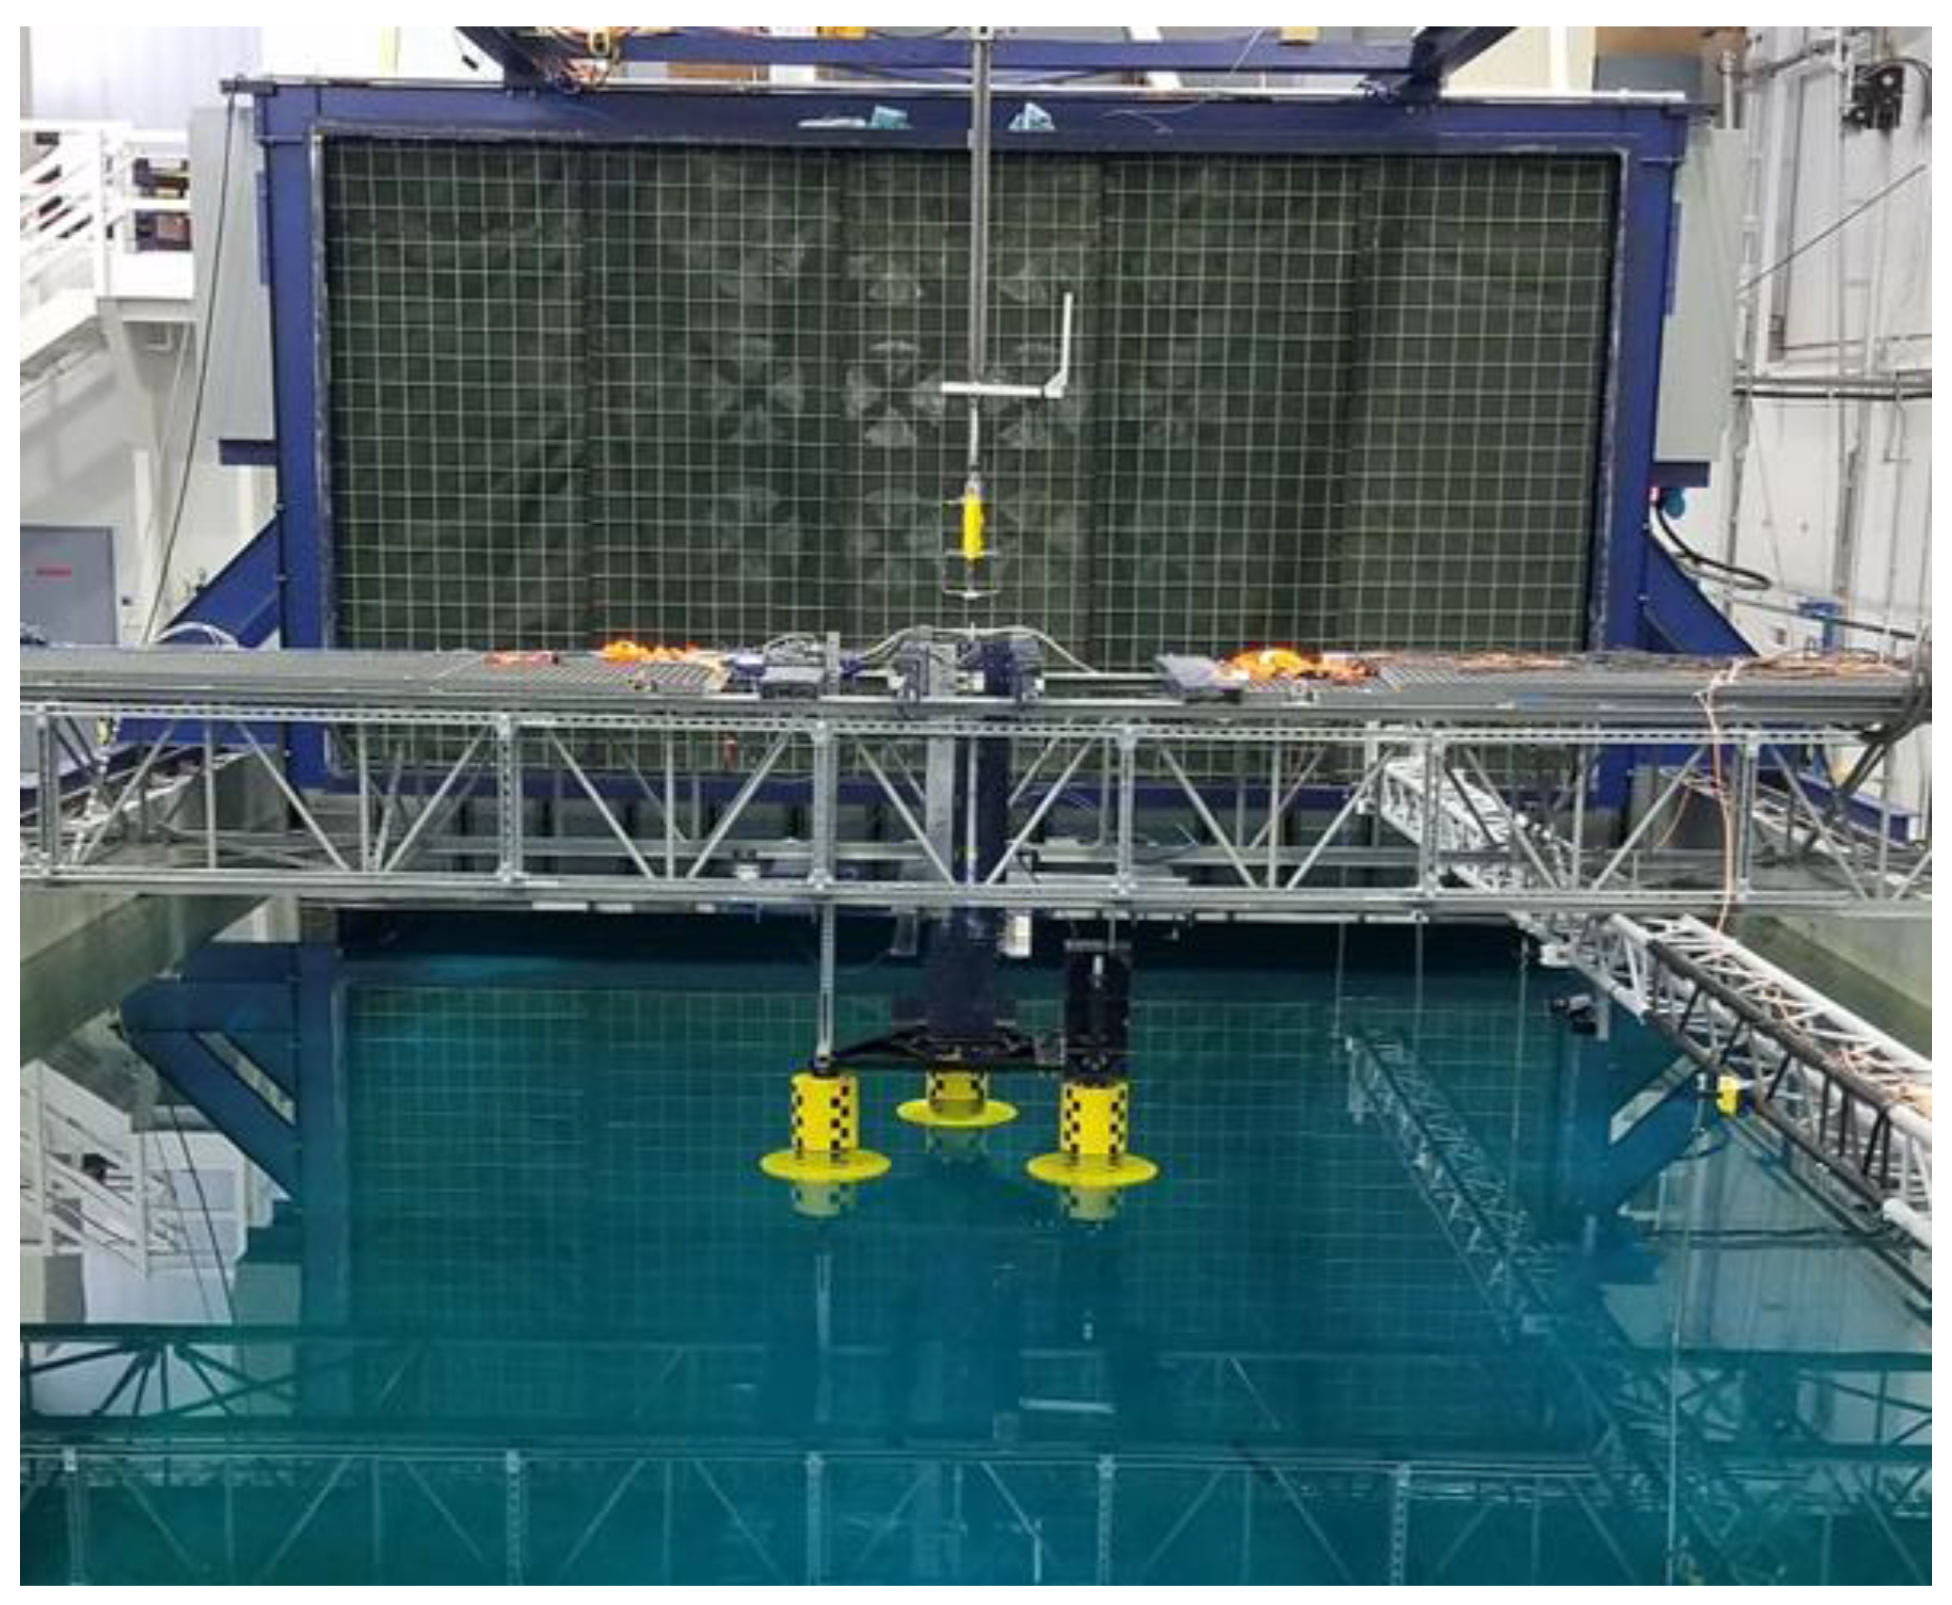
To examine the limitations of the existing engineering models, the OC6 project is incorporating higher-fidelity tools, such as computational fluid dynamics (CFD), in addition to the experiment and mid-fidelity models to enable a three-way validation that will provide more insight into the physics of the nonlinear hydrodynamic loading for offshore wind systems. However, the validation of the CFD tools themselves is difficult to achieve with the previous datasets examined in OC5 Phase II and OC6 Phase Ia, due to the limited measurements and the reliance on long, 3 h irregular-wave load cases, which are computationally prohibitive for CFD tools to simulate. To address these limitations, a new experimental campaign called OC6 Phase Ib (see Figure 1 and Figure 2) was conducted in 2021 at the W2 Harold Alfond Ocean Engineering Laboratory of the University of Maine. This paper provides an overview of this campaign, which had three overarching goals:
  • test individual components (columns and heave plates) of a semisubmersible (alone and in combination) to better understand how the hydrodynamic loading changes for structures in proximity,
  • obtain detailed, distributed load information on the structure, and
  • perform bichromatic-wave cases to facilitate low-frequency load validation.
Component-level tests are not a new concept and are recommended as a step towards the validation of complex systems. In this case, the work has progressed in reverse, starting with a complex full system (for OC5 and OC6 Phase Ia) and moving to component-level experiments once validation issues were identified. Many campaigns have been conducted over the past 50 years to better understand the hydrodynamic loading on components of offshore structures. A large focus has been on heave-plate loading, in particular the effects of the geometry and wave conditions on the resulting loads (see, e.g., [8,9,10,11]). Further work has been carried out to investigate the loading when heave plates are attached to vertical cylinders, a typical component of offshore semisubmersibles (see, e.g., [12,13,14,15,16]).
The primary difference in this campaign is that the geometry of the structural components investigated matches those of the DeepCwind semisubmersible design [17], which deviates in sizing from oil and gas platforms. The DeepCwind semisubmersible has been widely investigated, serving as a reference for offshore wind research. Secondly, the design complexity was built up across this campaign by examining a cylinder in isolation, then a heave plate attached to that cylinder, and finally the layout of three cylinders with heave plates representative of the DeepCwind design, allowing for examination of how the component loading is directly affected by other members. Thirdly, the components were examined in a neutral position and then in a pitched condition that is representative of the mean orientation of an offshore wind system under operational wind conditions—a configuration that is not typical outside the floating wind area.
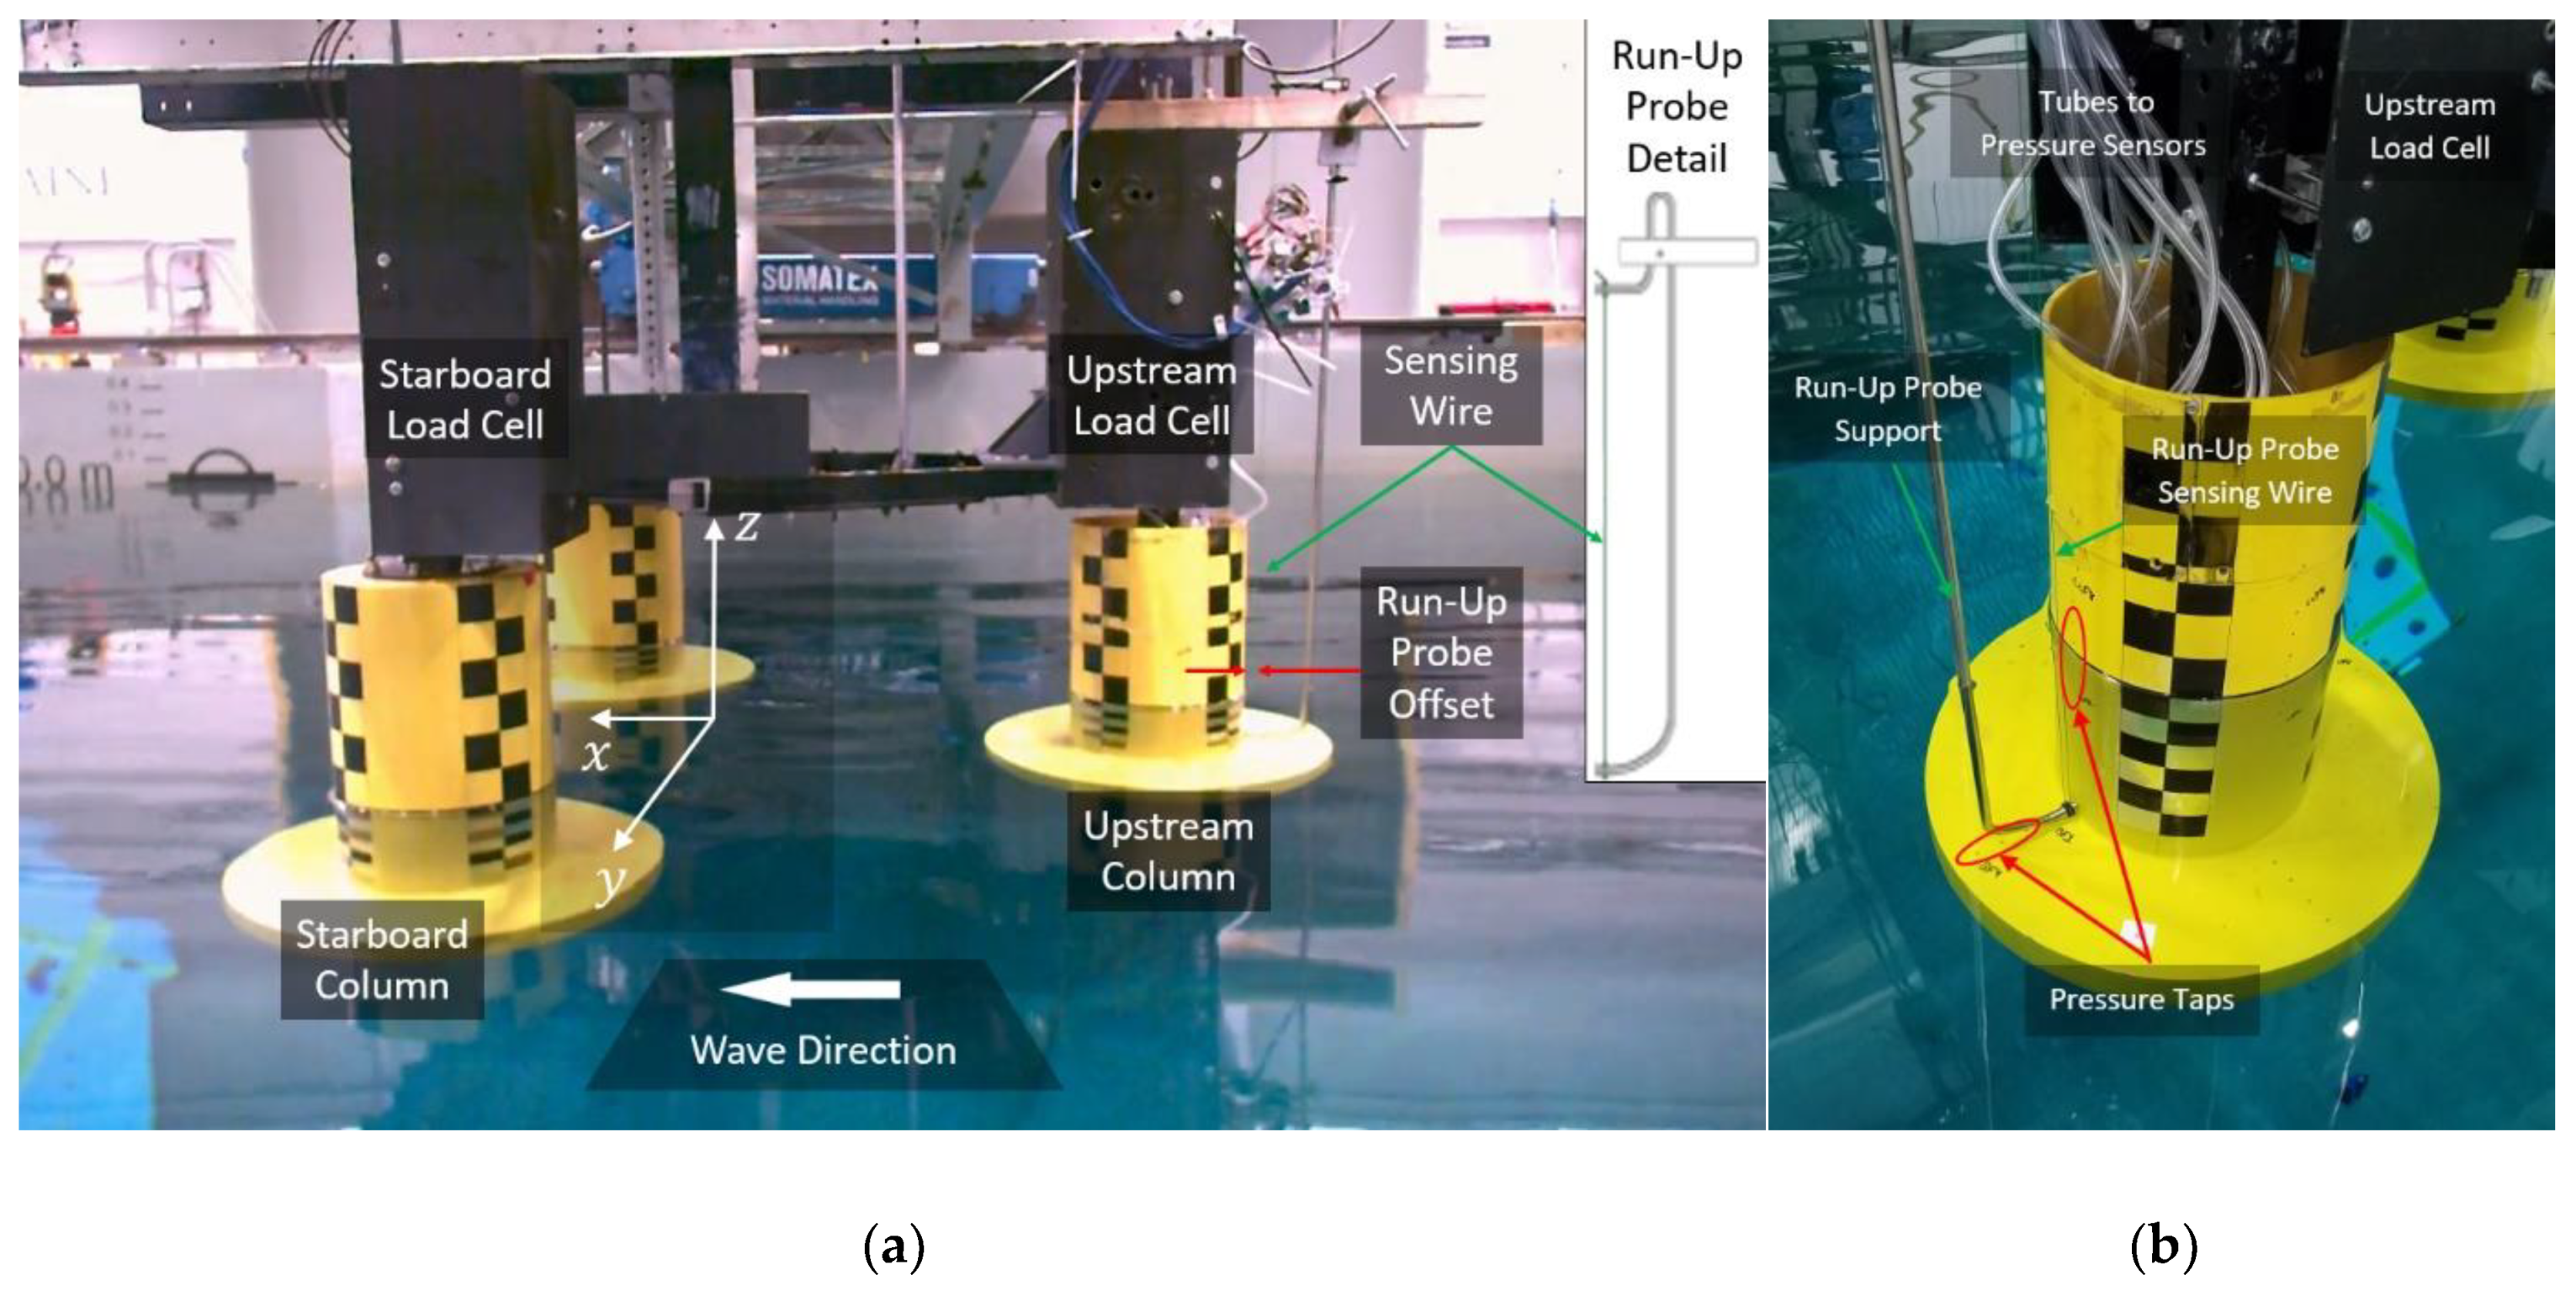
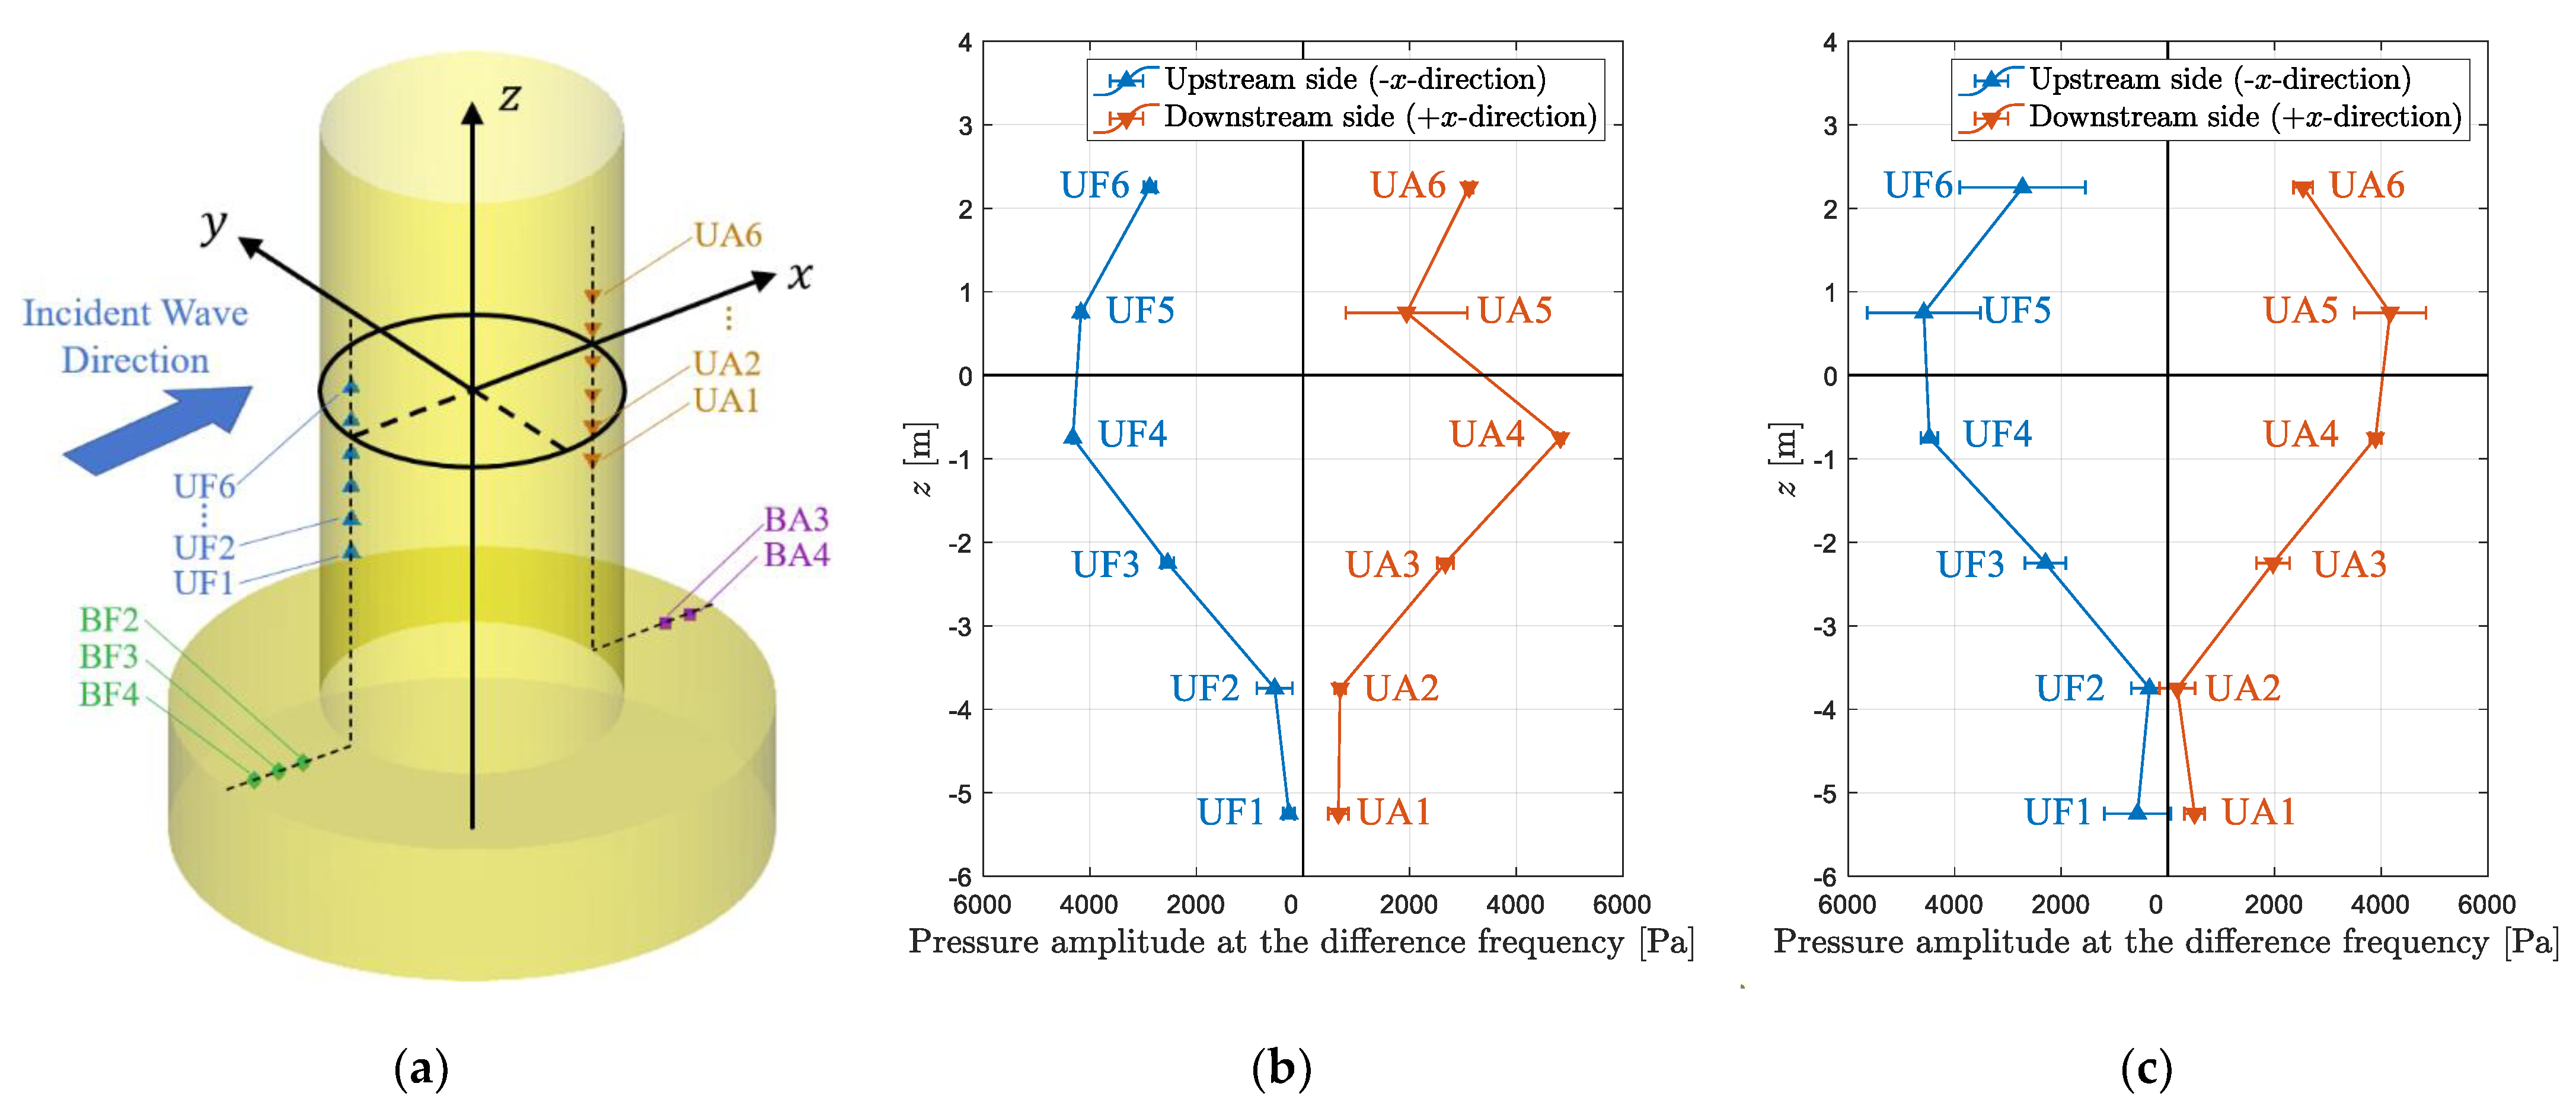
Detailed measurements were also integrated into this campaign to enable a better understanding of the components that drive the nonlinear hydrodynamic loading. In the previous OC5 and OC6 experiments, validation was only focused on the hydrodynamic loading across the entire semisubmersible structure, making it difficult to understand the reason for differences between simulations and experiments. The OC6 Phase Ib campaign incorporated load measurements for each of the column/heave plate components of the semisubmersible seen in Figure 2, as well as pressure measurements on the heave plate and near the still waterline, where it is expected that the nonlinear hydrodynamic loading is the highest. Prior examples of pressure measurement in a wave basin with a surface-piercing structure often focus on water impact problems during extreme wave events (see, e.g., [18,19,20,21,22]). In contrast, measurement of pressure on structures in nonbreaking and moderate waves is less common. Some examples are [23,24]; the latter considered a horizontal submerged cylinder rather than a vertical, surface-piercing one. While surface-mounted piezoelectric sensors are commonly used for pressure measurements in wave-basin experiments, the pressure measurement in this campaign was carried out using small pressure taps on the surface of the model, which were connected to an array of pressure sensors above the model through tubes. This is a cost-effective setup for achieving the desired sensor spatial density and limiting the impact on the hydrodynamic loading. However, several issues with this experimental setup negatively impacted the reliability of the pressure measurements, and, thus, the data can only be used in a qualitative manner. Nevertheless, the pressure measurements highlight the increased nonlinear, difference/low-frequency pressure oscillation near the calm waterline and provide qualitative references that can be compared to CFD results.
The incorporation of bichromatic waves in this campaign is motivated by two considerations. First, the measured difference-frequency loads from the experiment can be compared directly to the quadratic transfer functions (QTFs) from second-order potential-flow solutions, upon which many mid-fidelity engineering models are based [4]. Such comparison enables the identification of the limitations of potential-flow theory and provides an understanding of the resulting error. Second, the two frequencies of the bichromatic waves can be carefully chosen to obtain a short repeat period, and the corresponding CFD simulation to be validated only needs to run for several repeat periods (on the order of several hundred seconds full scale) to capture the difference-frequency loads, rather than the typical 3 h time window needed to resolve the low-frequency loads from irregular waves. The computing time is, therefore, significantly shortened.
The advantages of using bichromatic waves to investigate the nonlinear hydrodynamics of floating structures have already been recognized and exploited in the literature. Lopez-Pavon et al. [25] performed wave-basin experiments of a captive (fixed) offshore wind semisubmersible subjected to bichromatic incident waves, and the surge force on the structure was measured to extract the difference-frequency slow-drift force. It was observed that while second-order potential-flow solution captured the overall trend of second-order wave forces, there was a clear underprediction when compared to the experiment. A follow-up work by Simos et al. [26] reported an experimental investigation of the slow-drift motion of a freely floating offshore wind semisubmersible in bichromatic waves. The equivalent linear damping ratio estimated from the slow-drift motion was found to be mostly consistent with the values estimated from surge free-decay experiments for large amplitude motion. Do Carmo et al. [27] also investigated the slow-drift motion of a floating wind semisubmersible excited by bichromatic waves. In this investigation, however, it was observed that the damping estimated from both forced oscillation and free decay in surge led to an underestimation of the slow-drift motion. Li and Bachynski-Polić [28] performed a series of CFD simulations of a fixed offshore wind semisubmersible in bichromatic waves and successfully used the numerical predictions of the difference-frequency loads to modify the potential-flow QTFs to improve the prediction of nonlinear, low-frequency wave excitation from irregular waves. In contrast to the aforementioned experimental investigations with bichromatic waves, the present experimental campaign also provides measurements of the difference-frequency pitch moment on a fixed offshore wind semisubmersible, which was also underpredicted by engineering models [4]. Furthermore, the wave loads were also measured with the semisubmersible in a 5°-pitched configuration representative of the operating condition to investigate the effect of a steady pitch angle on wave excitation.
The remainder of this paper provides details about the OC6 Phase Ib experimental campaign so that others may use the dataset for their own purposes. The organization is outlined as follows: Section 2 and Section 3 describe the experimental facility and the various configurations of the physical model of the offshore wind semisubmersible substructure. The wave conditions included in this validation campaign are summarized in Section 4. The suite of measurements taken during the experiment is explained in Section 5, and the complete Test Matrix and the accessible data from the campaign are tabulated in Section 6. The uncertainty analysis of the present campaign is briefly summarized in Section 7, followed by the conclusions in Section 8.

2. Testing Facility

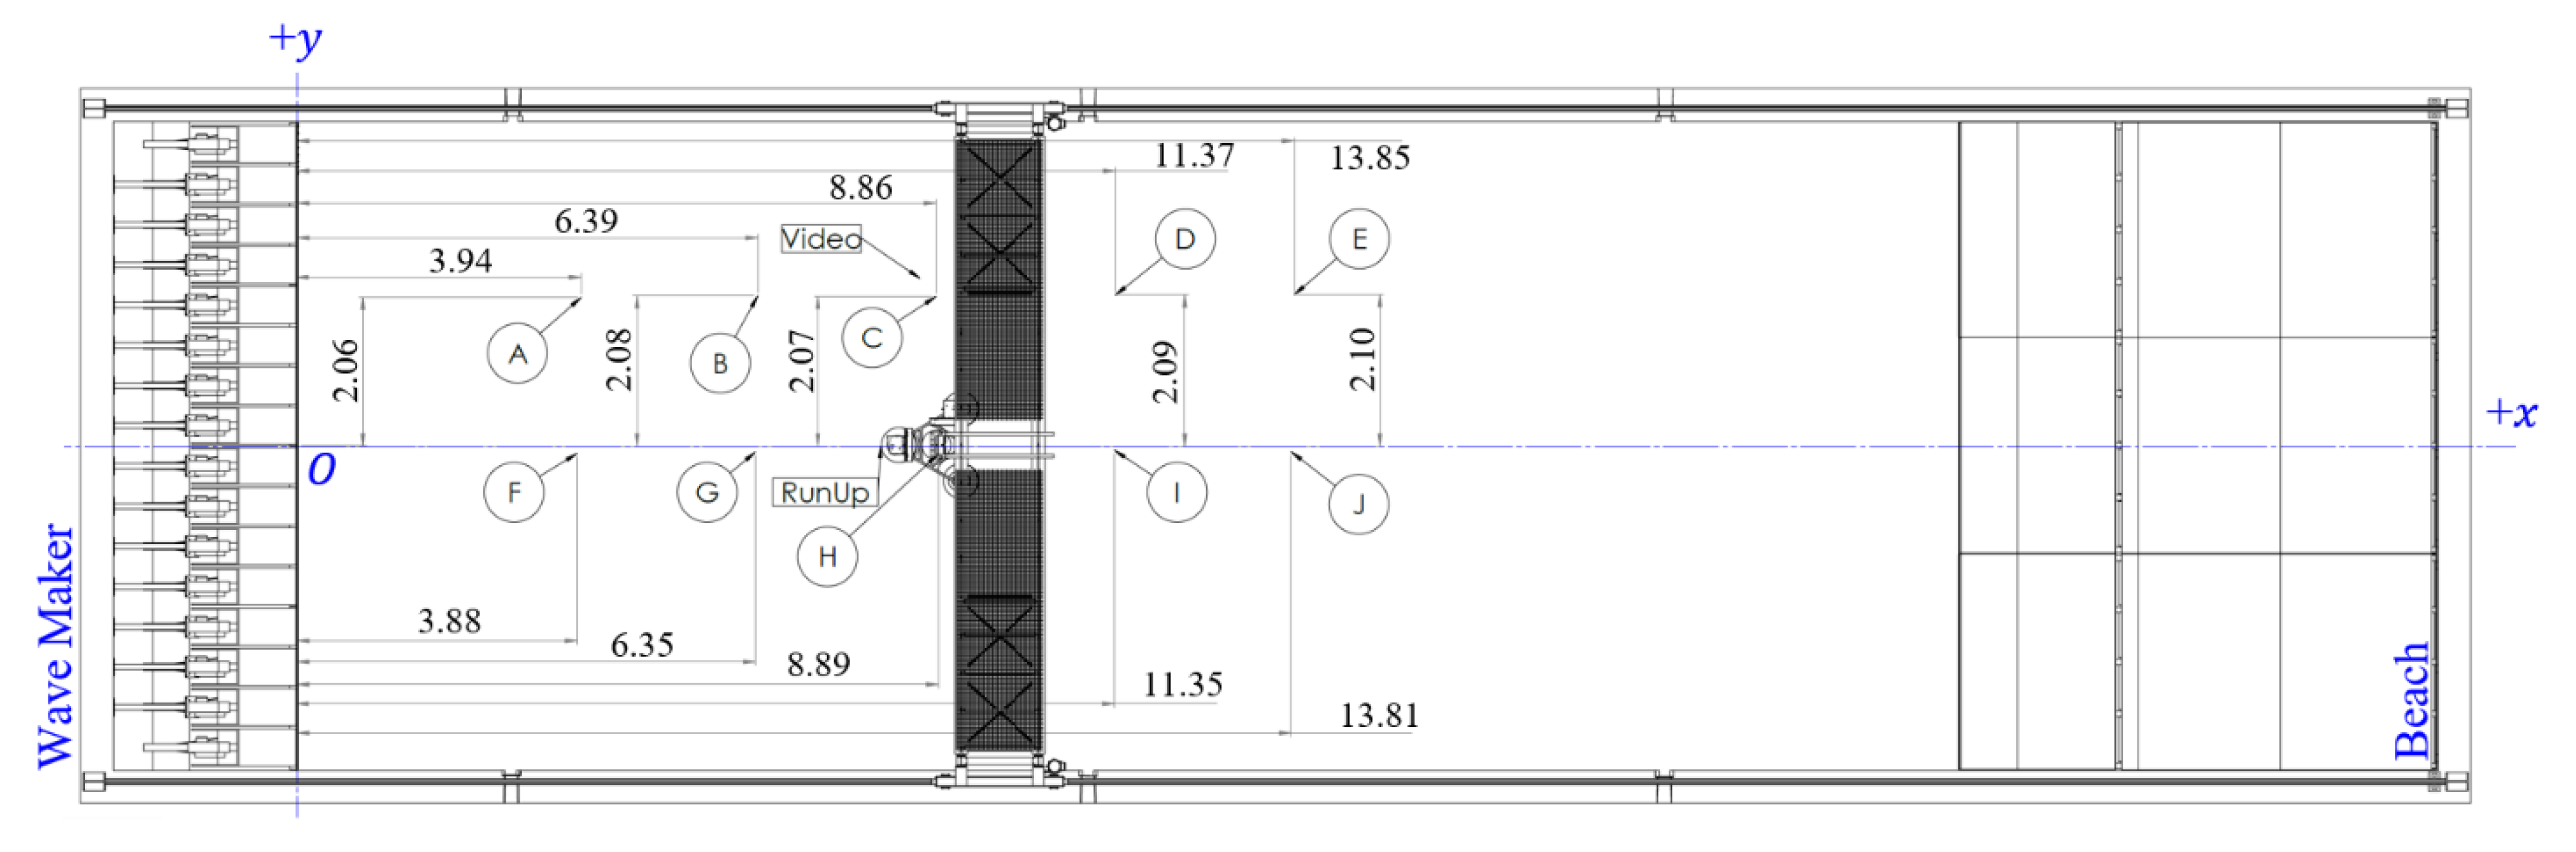
The validation campaign was performed at the W2 Harold Alfond Ocean Engineering Laboratory of the University of Maine in the United States (Figure 2), highlighting U.S. capabilities to support the emerging floating wind industry. The W2 facility includes infrastructure to support simultaneous excitation from both wind and waves, but only the wave generation capability was utilized in this project. The basin is 30 m long and 9 m wide, with an adjustable water depth set to 5 m for the present campaign. A flap-type wavemaker with 16 paddles was used to generate the prescribed wave conditions. The wavemaker can generate directional waves ± 60 degrees relative to the basin centerline with a maximum wave height of 0.6 m at 1.65-s period and 0.8 m at 2.3-s period. For the present campaign, however, only long-crested waves were generated along the length of the basin (zero-degree wave heading). An elliptical beach at the end of the basin opposite from the wavemaker minimizes wave reflection.
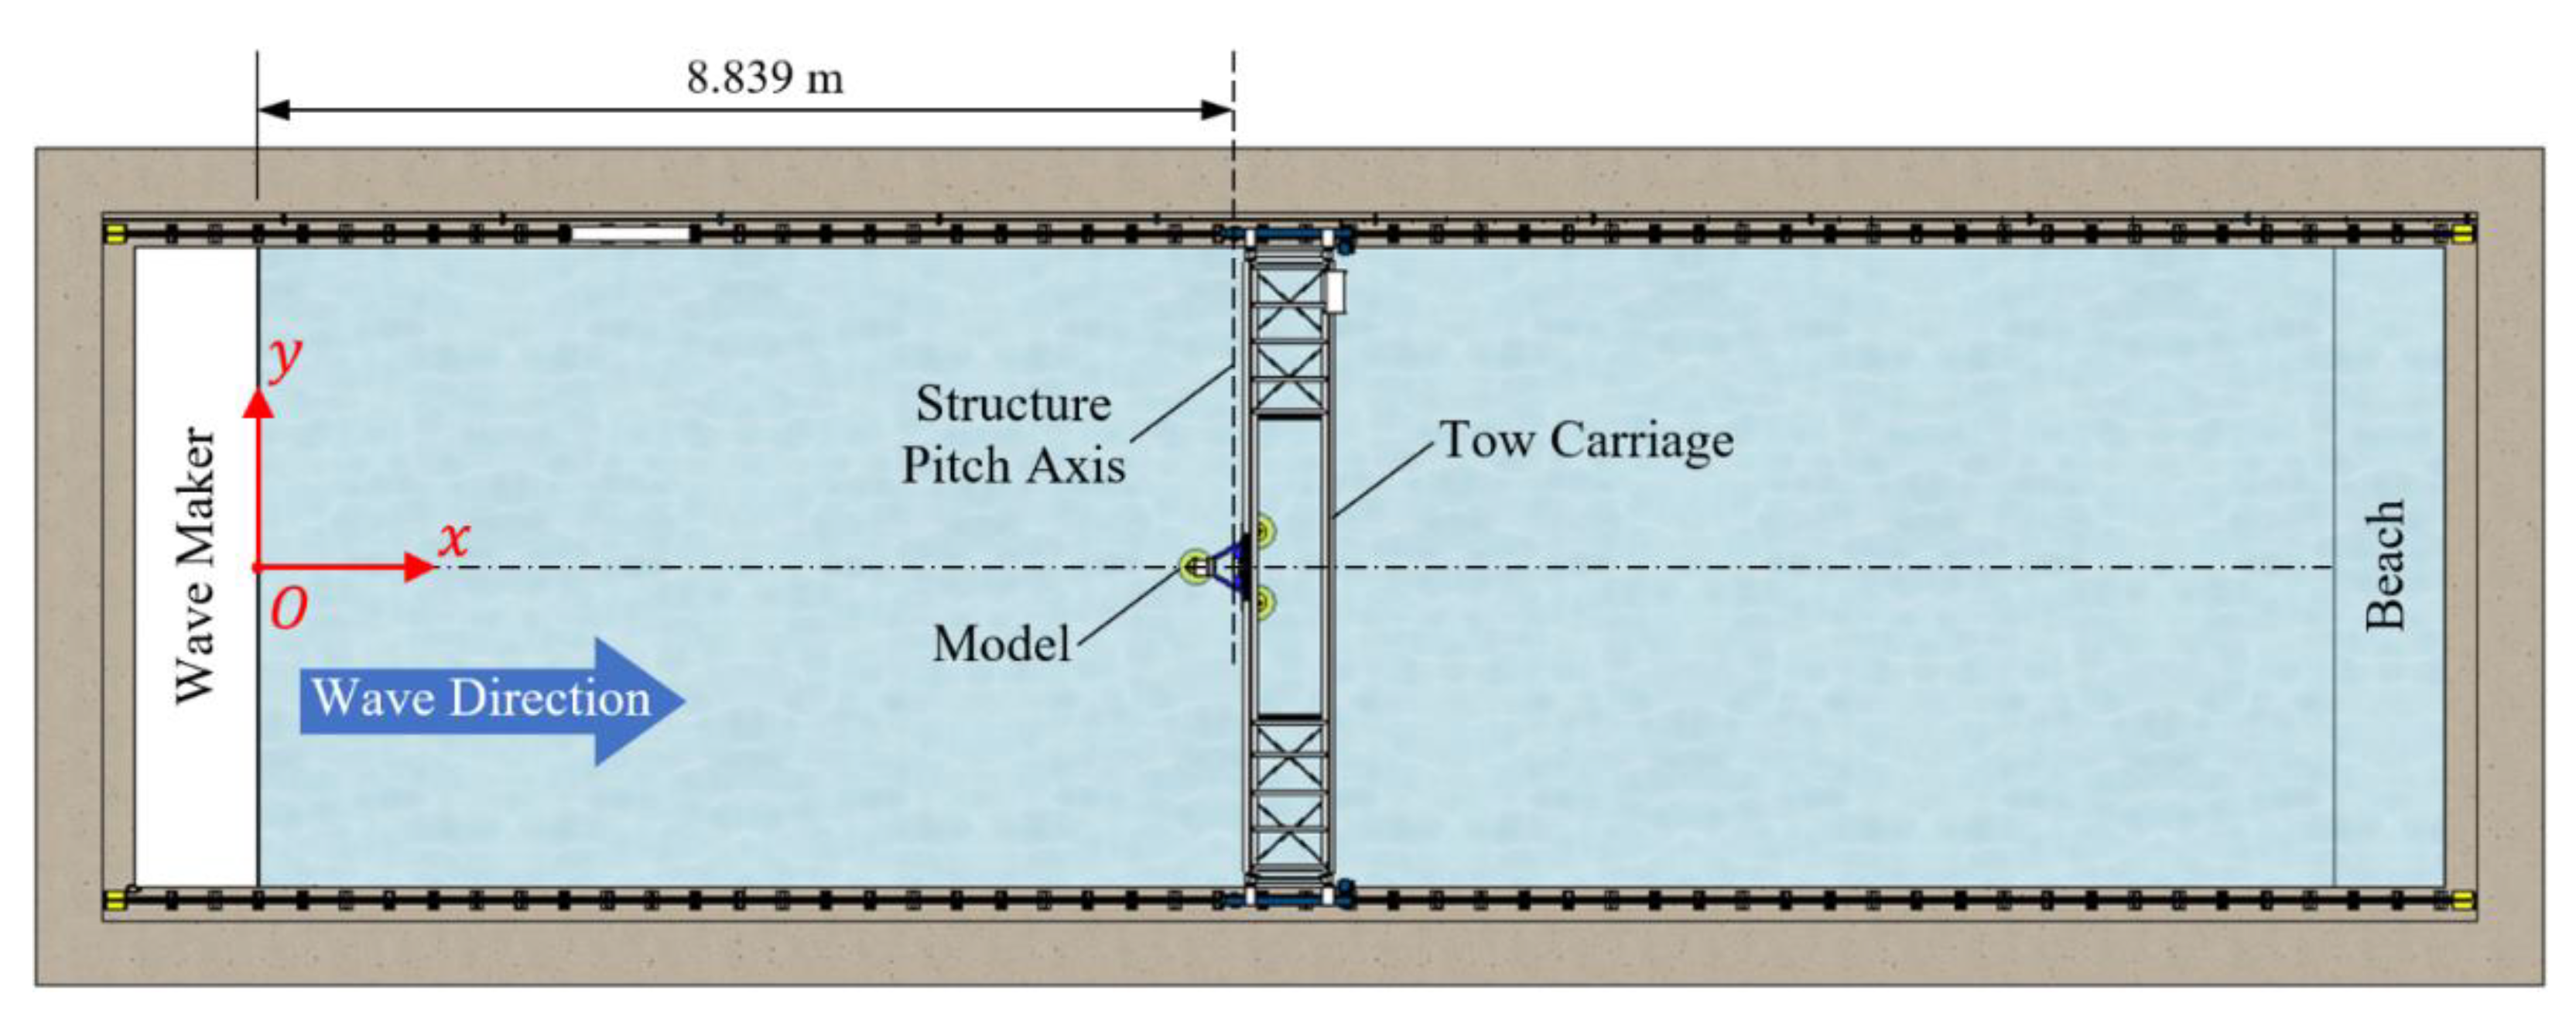
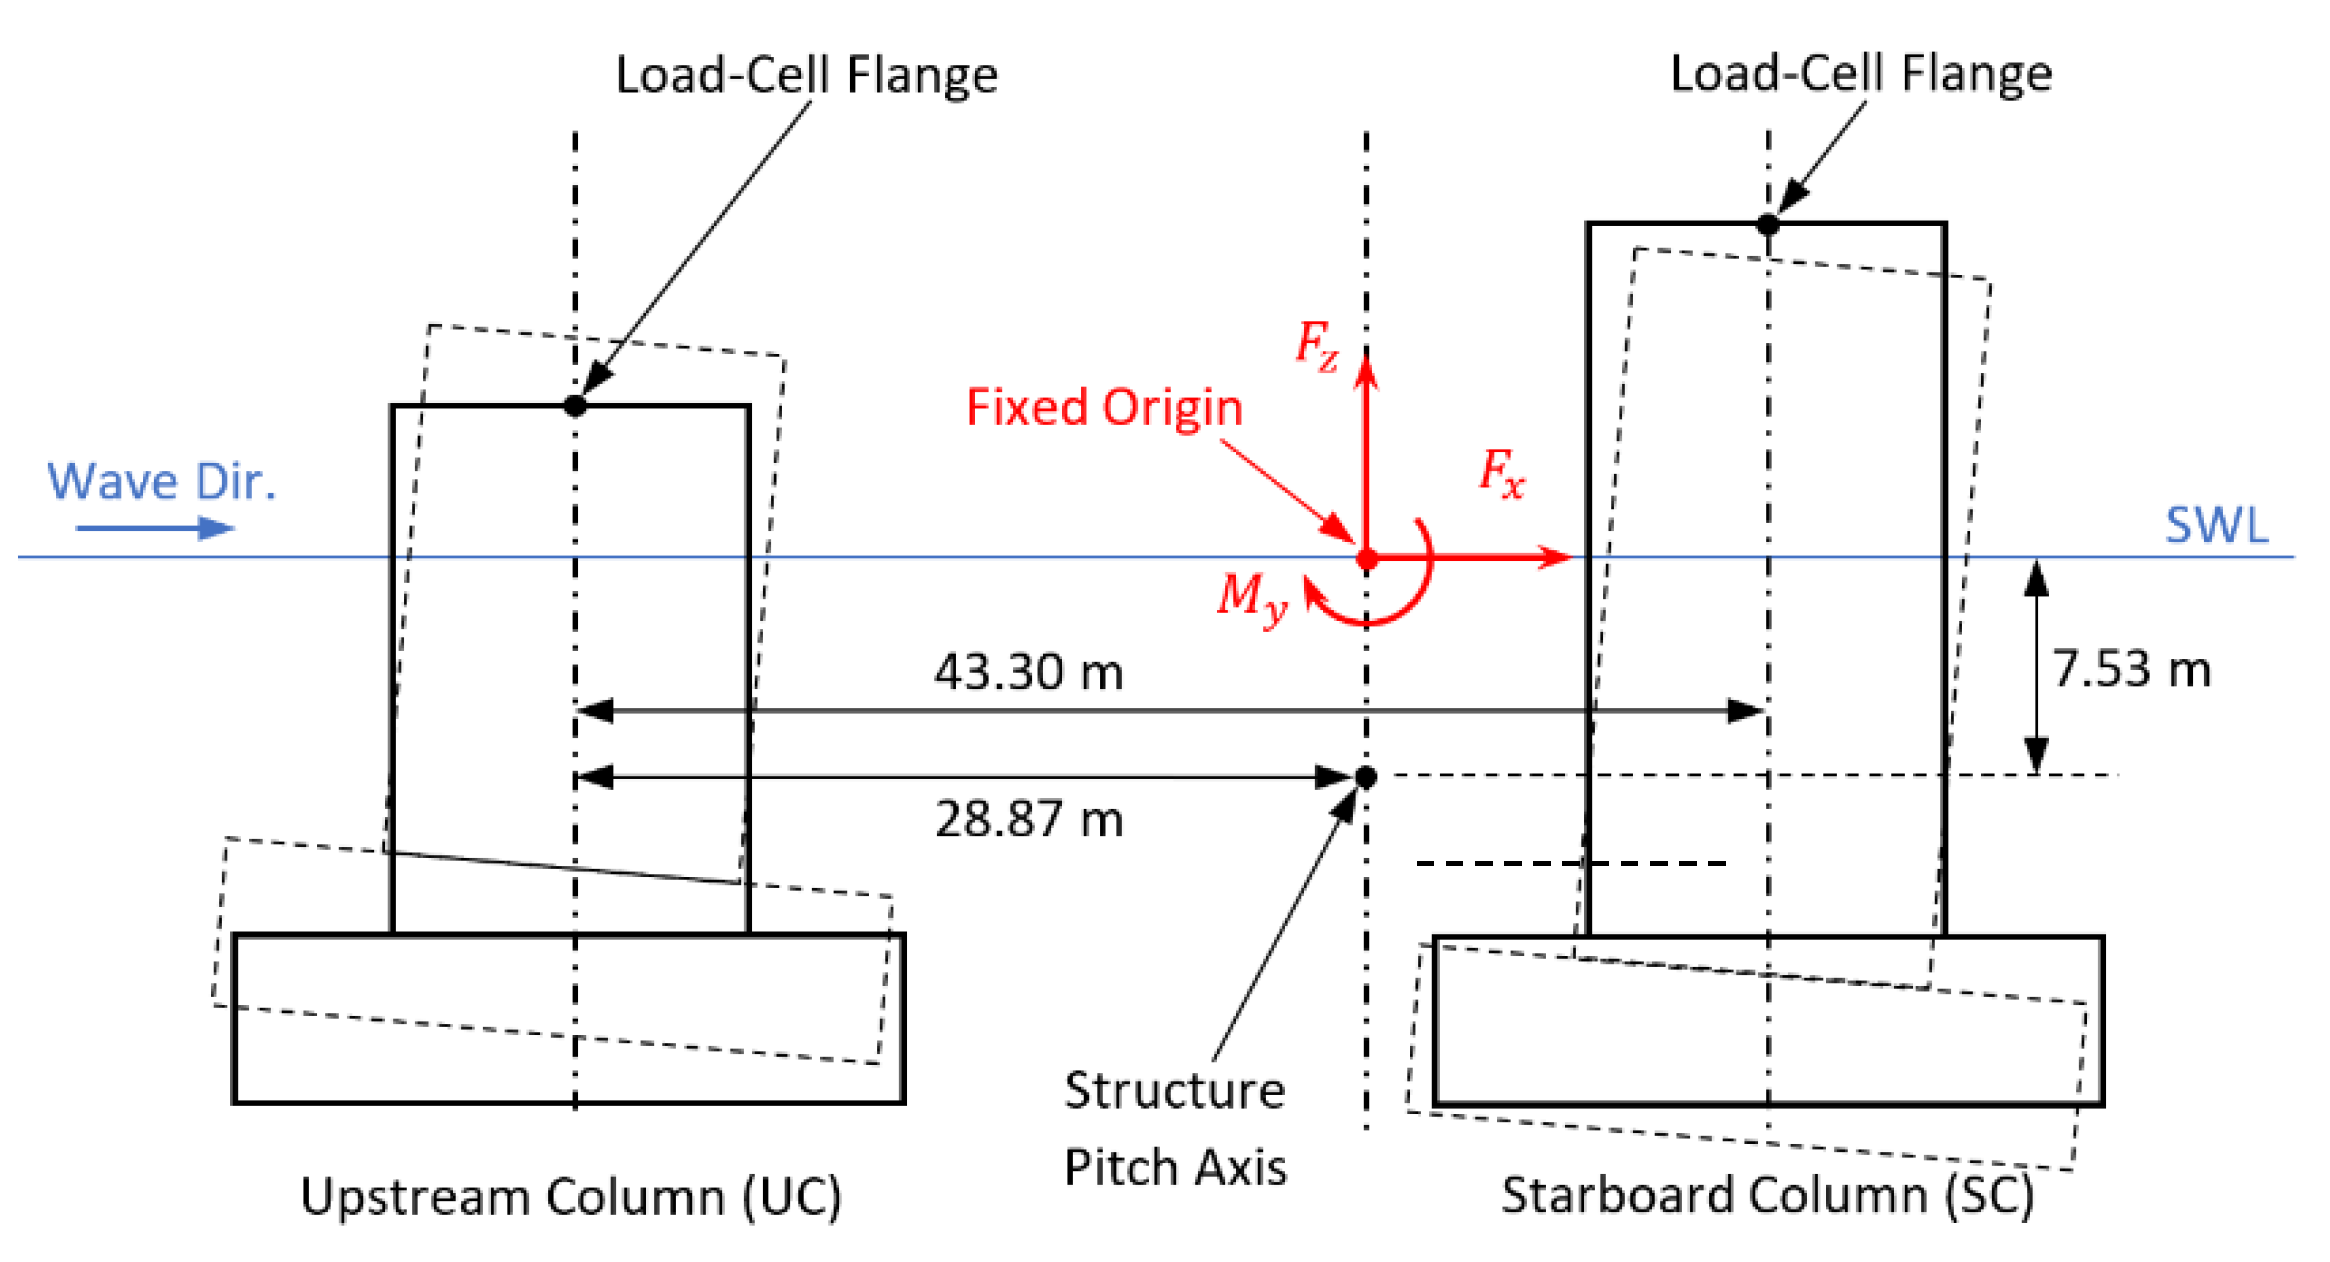
The position of the model during the experiment is shown in Figure 3. with the basin coordinate system. The origin of the basin coordinate system rests at the intersection of the wavemaker pedal plane at neutral position, the basin center plane, and the still water level (SWL). The + x -direction is along the length of the basin in the direction of wave propagation (0-degree wave heading). The + z -axis points vertically upward, and the + y -axis follows the right-hand convention. The model was installed symmetrically about the basin center plane with the axis of pitch rotation located at x = 8.839 m and z = −0.1506 m model scale. This position was maintained for all model configurations, including both single-column and three-column configurations with and without pitch angle (see Section 3). The model was fixed in place by rigidly attaching it to the tow carriage.

3. Model Description

A floating wind system can consist of many different components (e.g., multiple columns with attached heave plates in proximity), which violates the assumptions of simplified approaches for representing the hydrodynamic loads, such as the Morison equation originally developed for a single pile without bracing [29]. This campaign aims to further investigate the effects of the resulting complex hydrodynamic interactions among the structural components on the modeling of hydrodynamic loads in a more generic sense and to enable validation of various modeling approaches for a variety of floater designs.
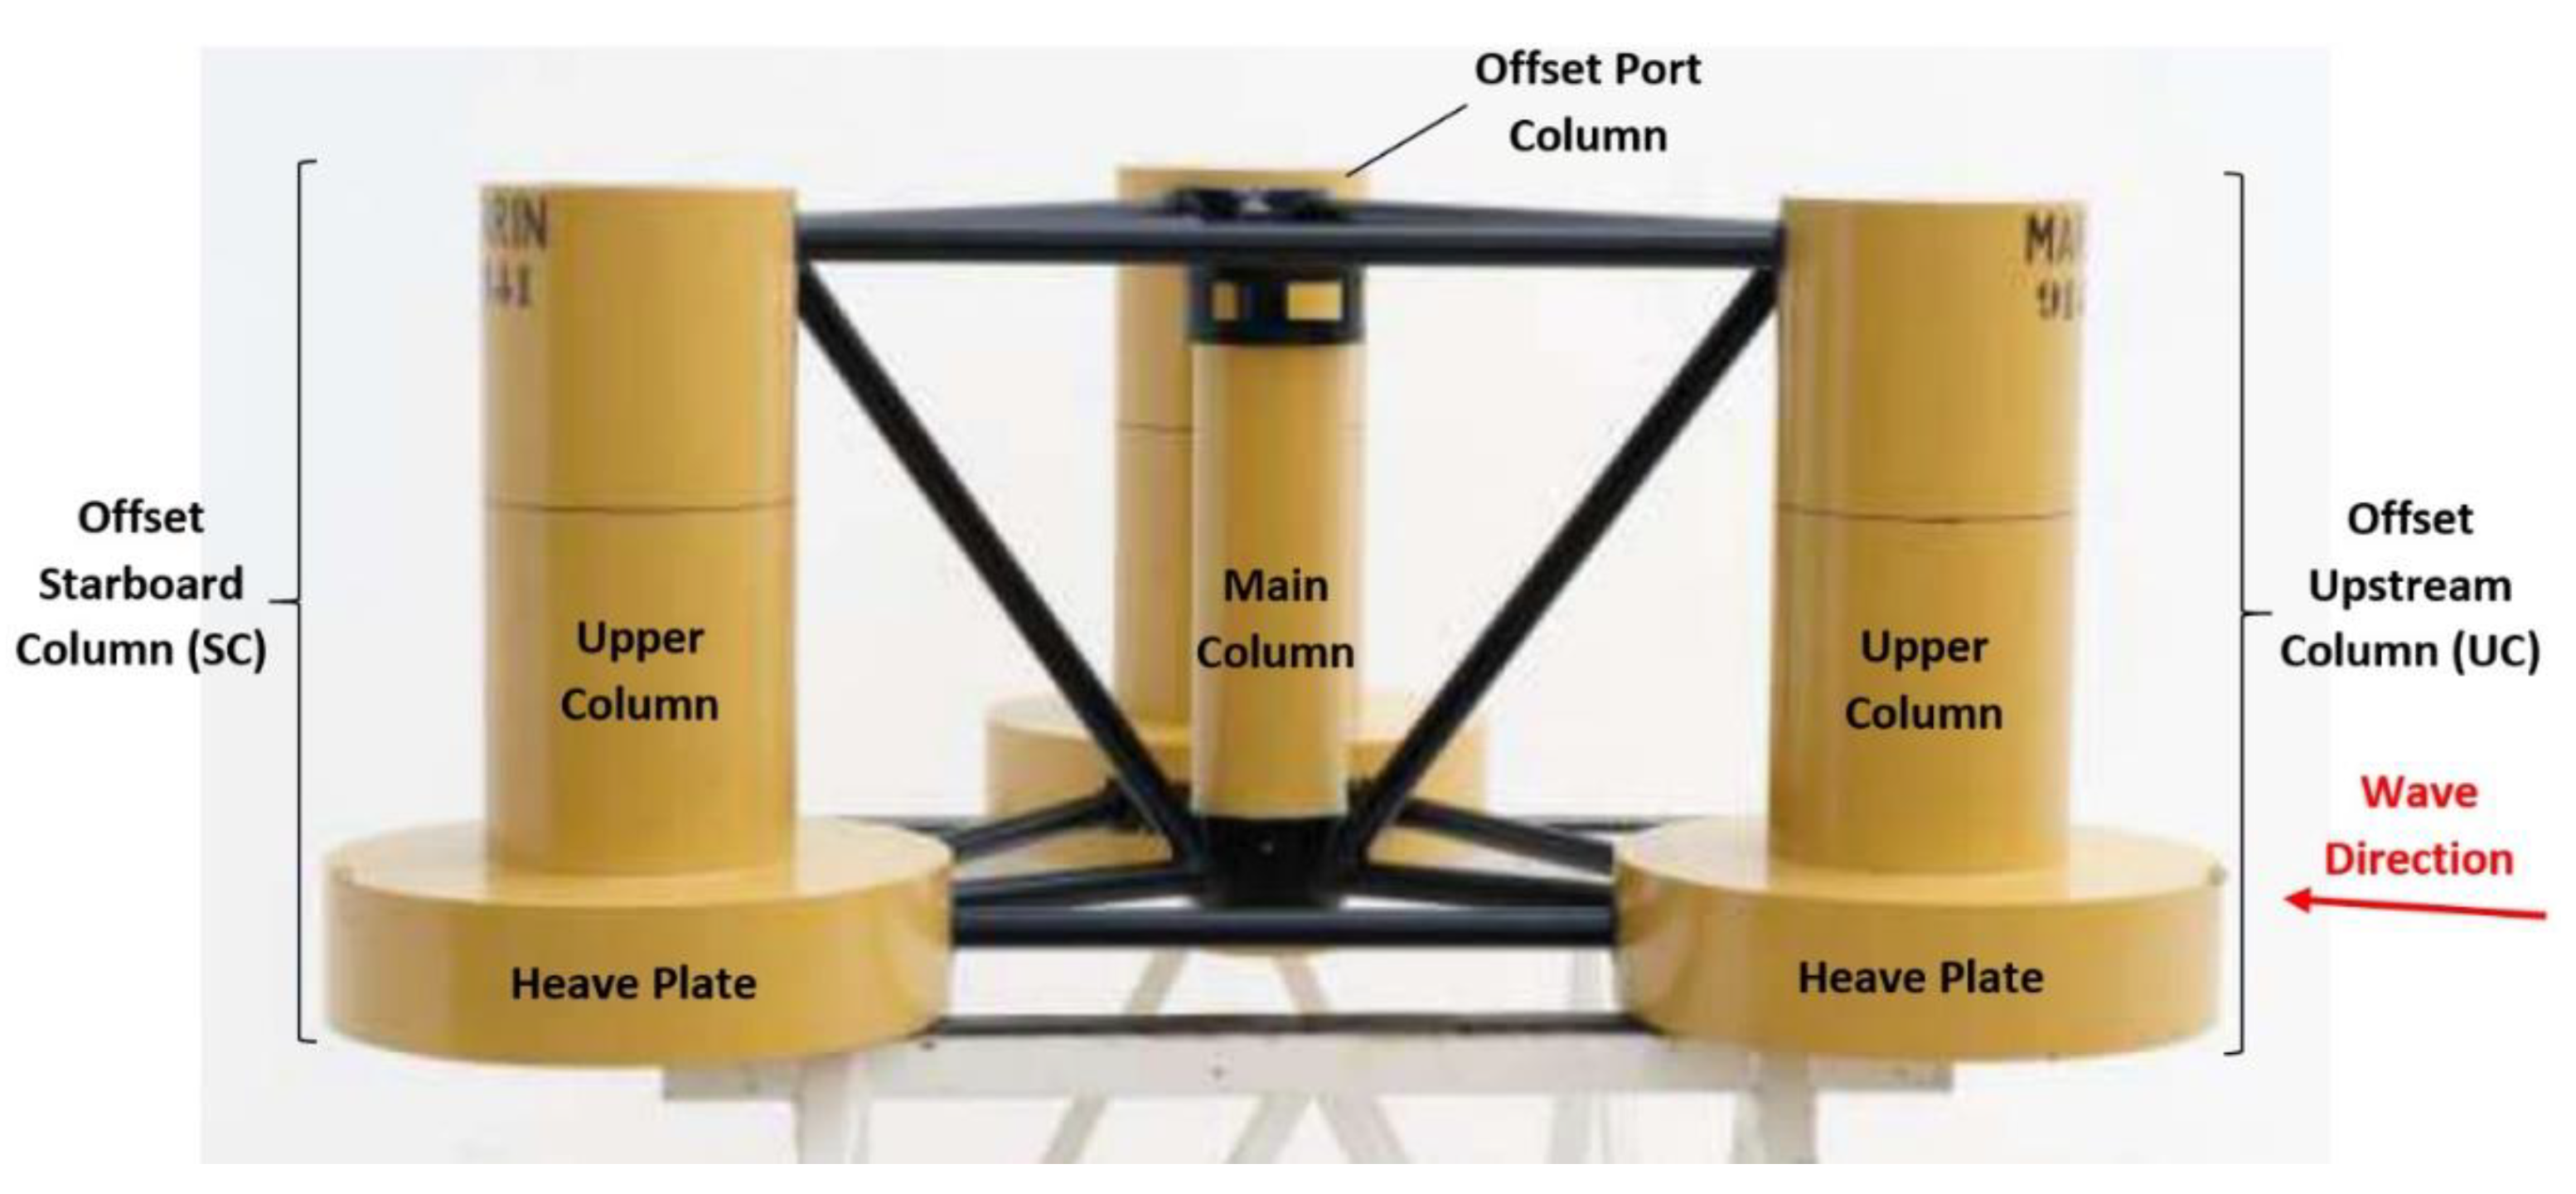
The model used in this validation campaign is based on the DeepCwind semisubmersible geometry (Figure 4 and Figure 5a) examined in the OC4, OC5, and OC6 projects [1,4,17]. A detailed definition of the geometry of the platform was given by Robertson et al. [17]. For the present experiment, however, the DeepCwind semisubmersible was further simplified to separate the various components of the structure. Only the large members (the three offset columns with heave plates) were retained; the small cross-members (shown in black in Figure 4) and the central main column were removed as shown in Figure 5b. Based on previous investigations, the large members provide the most significant contributions to the loads on the overall system. The same model scaling ratio of 1/50 from the previous projects was used in this campaign. For consistency, all dimensional values in the rest of this paper, unless specified otherwise, are presented at full scale following Froude scaling as detailed by Jain et al. [30].
The remaining three offset columns all have the same dimensions. The surface piercing upper columns have a diameter of 12 m and a draft of 14 m. The heave plates attached to the bottom of the upper columns all have a diameter of 24 m. Two versions of the heave plates with different heights were included in this experiment. The larger Heave Plate 1 (HP1), which is the geometry of the original DeepCwind heave plate design, has a height of 6 m, while the smaller Heave Plate 2 (HP2) has a height of 2.5 m. The thick heave plates used in the present investigation have the additional benefit of avoiding some of the numerical difficulties associated with solving the corresponding second-order potential-flow problem involving thin (zero-thickness) members [26].
The three upper columns were independently attached to a rigid top-of-column triangular frame to keep their positions fixed relative to each other and to the basin (see 
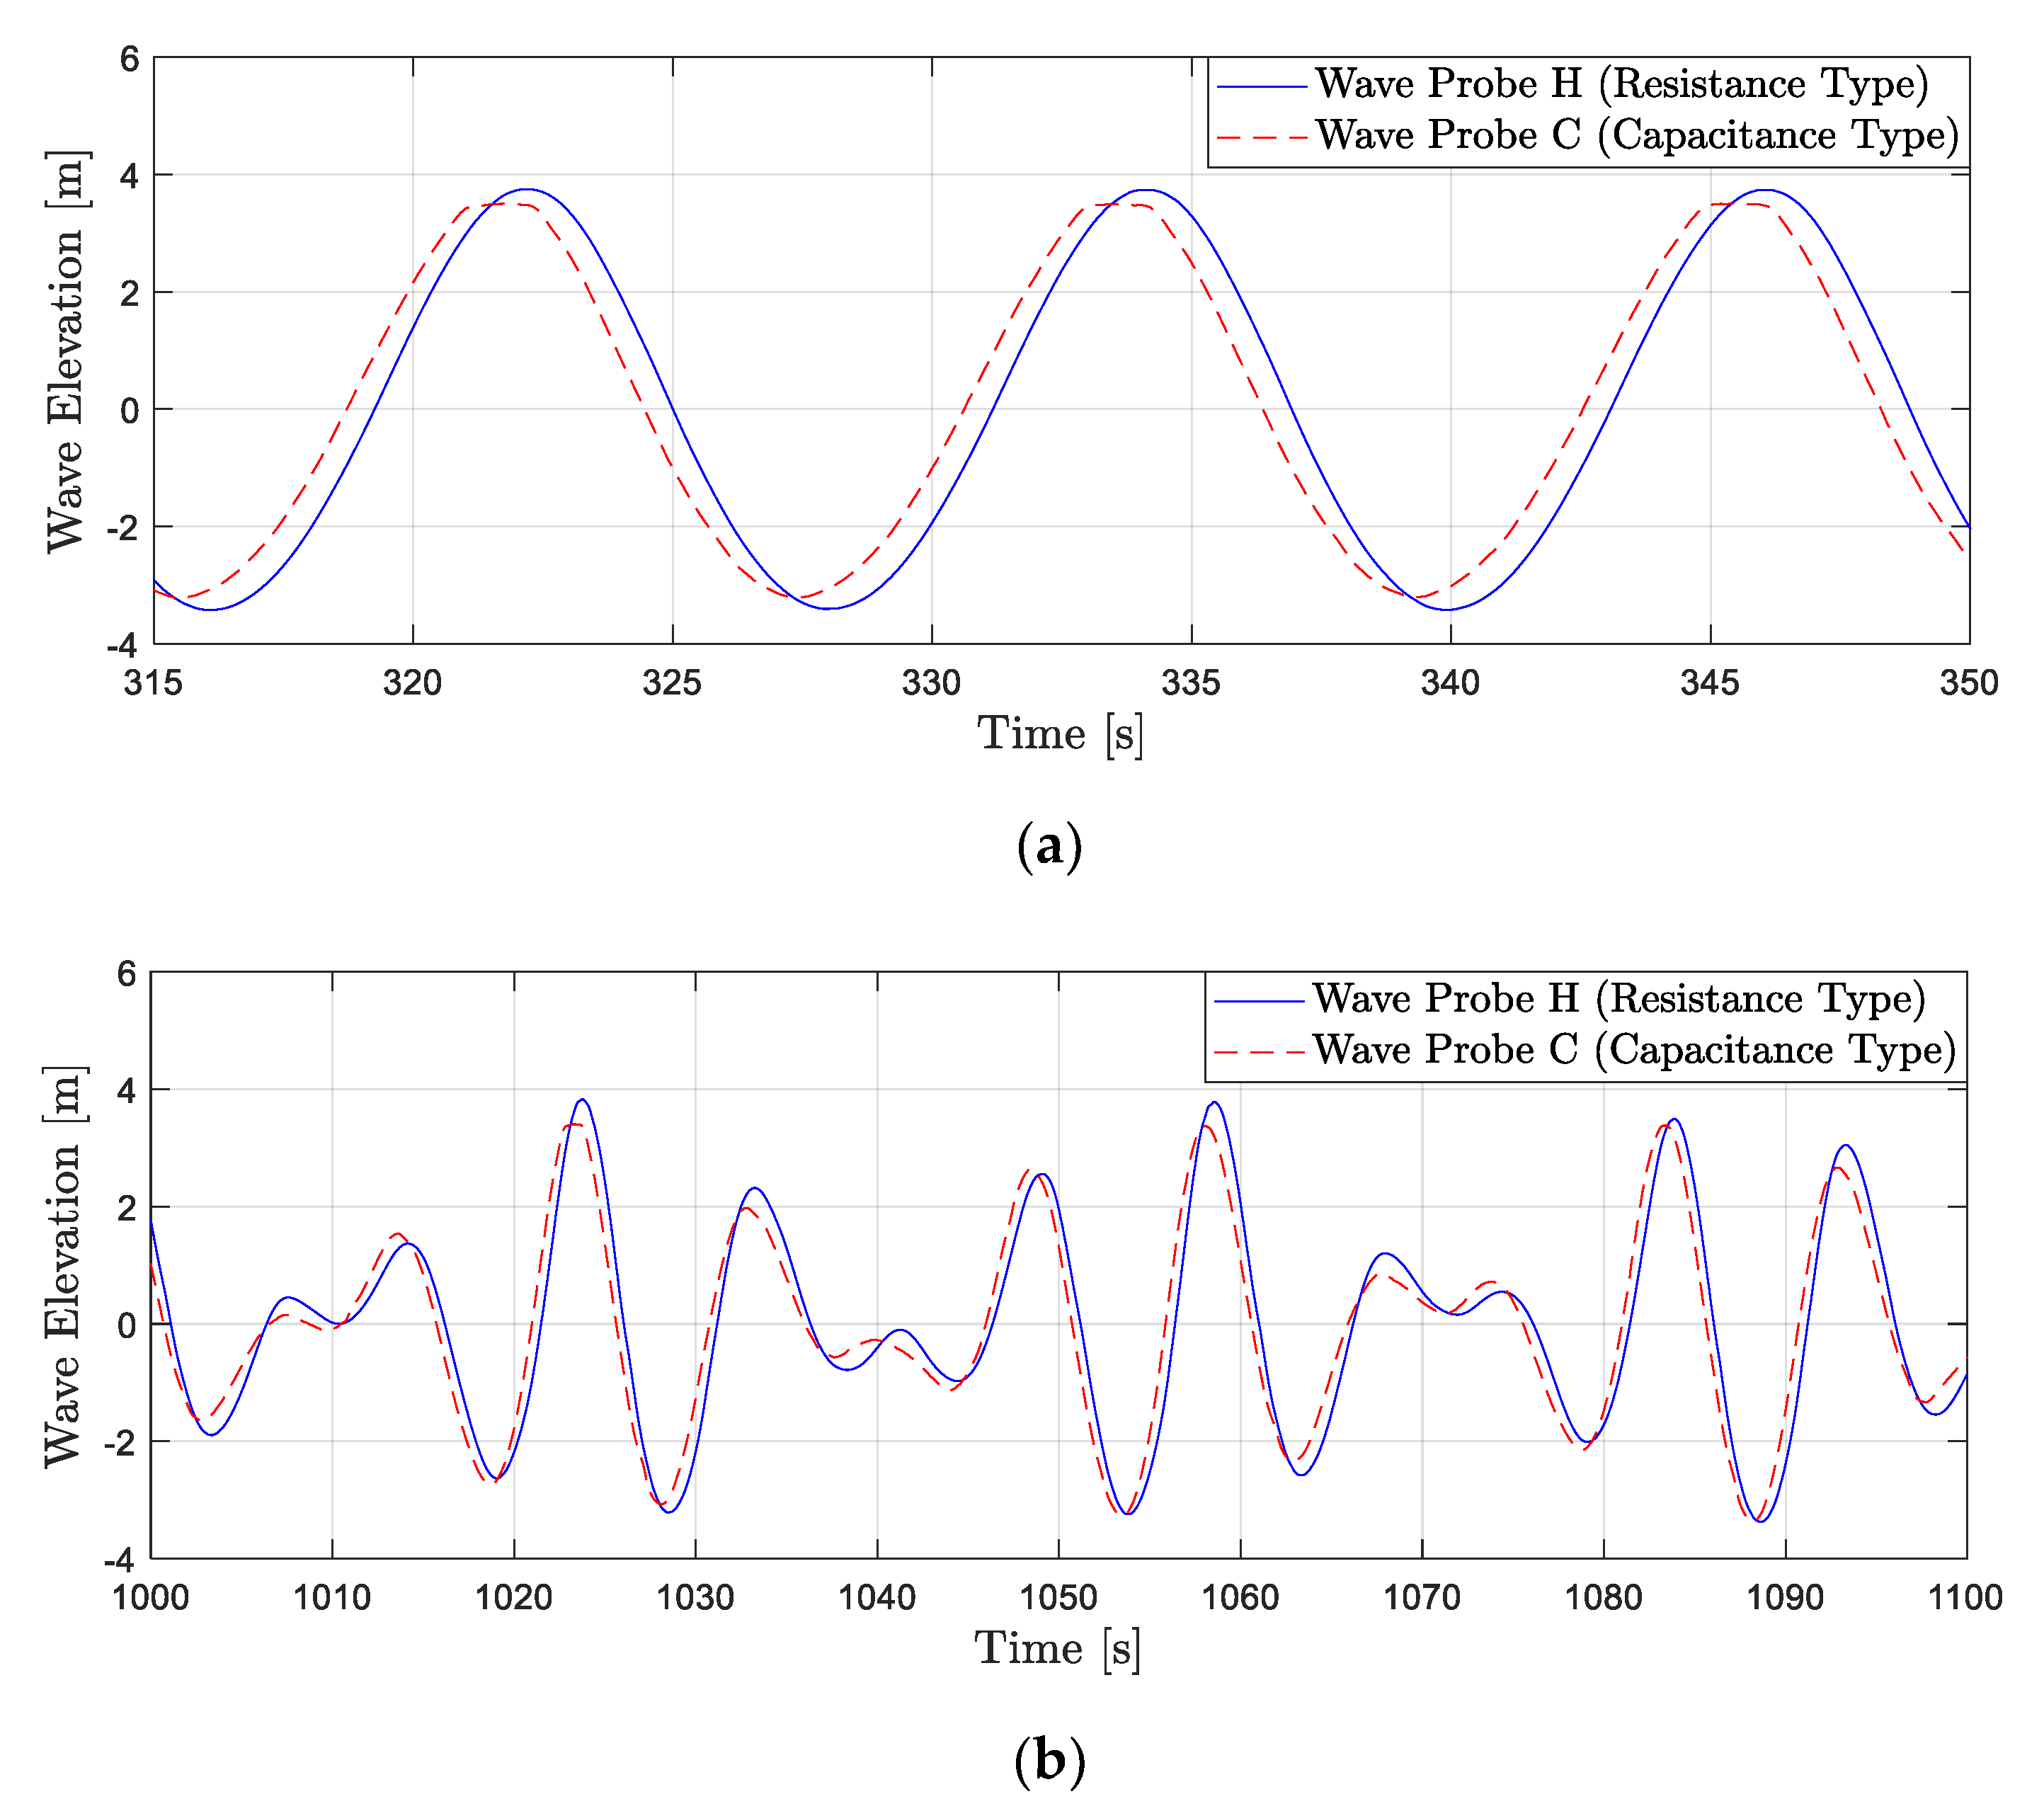
Figure 5b). As with the original DeepCwind semisubmersible, the three offset columns were placed to form an equilateral triangle with a centerline-to-centerline distance of 50 m between columns. Only one set of upper-column and heave-plate (HP1 and HP2) models has small pressure taps on the surface. The pressure taps were connected to an array of pressure sensors through thin tubes, which allowed the instantaneous pressure at the pressure taps to be measured (see Section 5.3 for details).
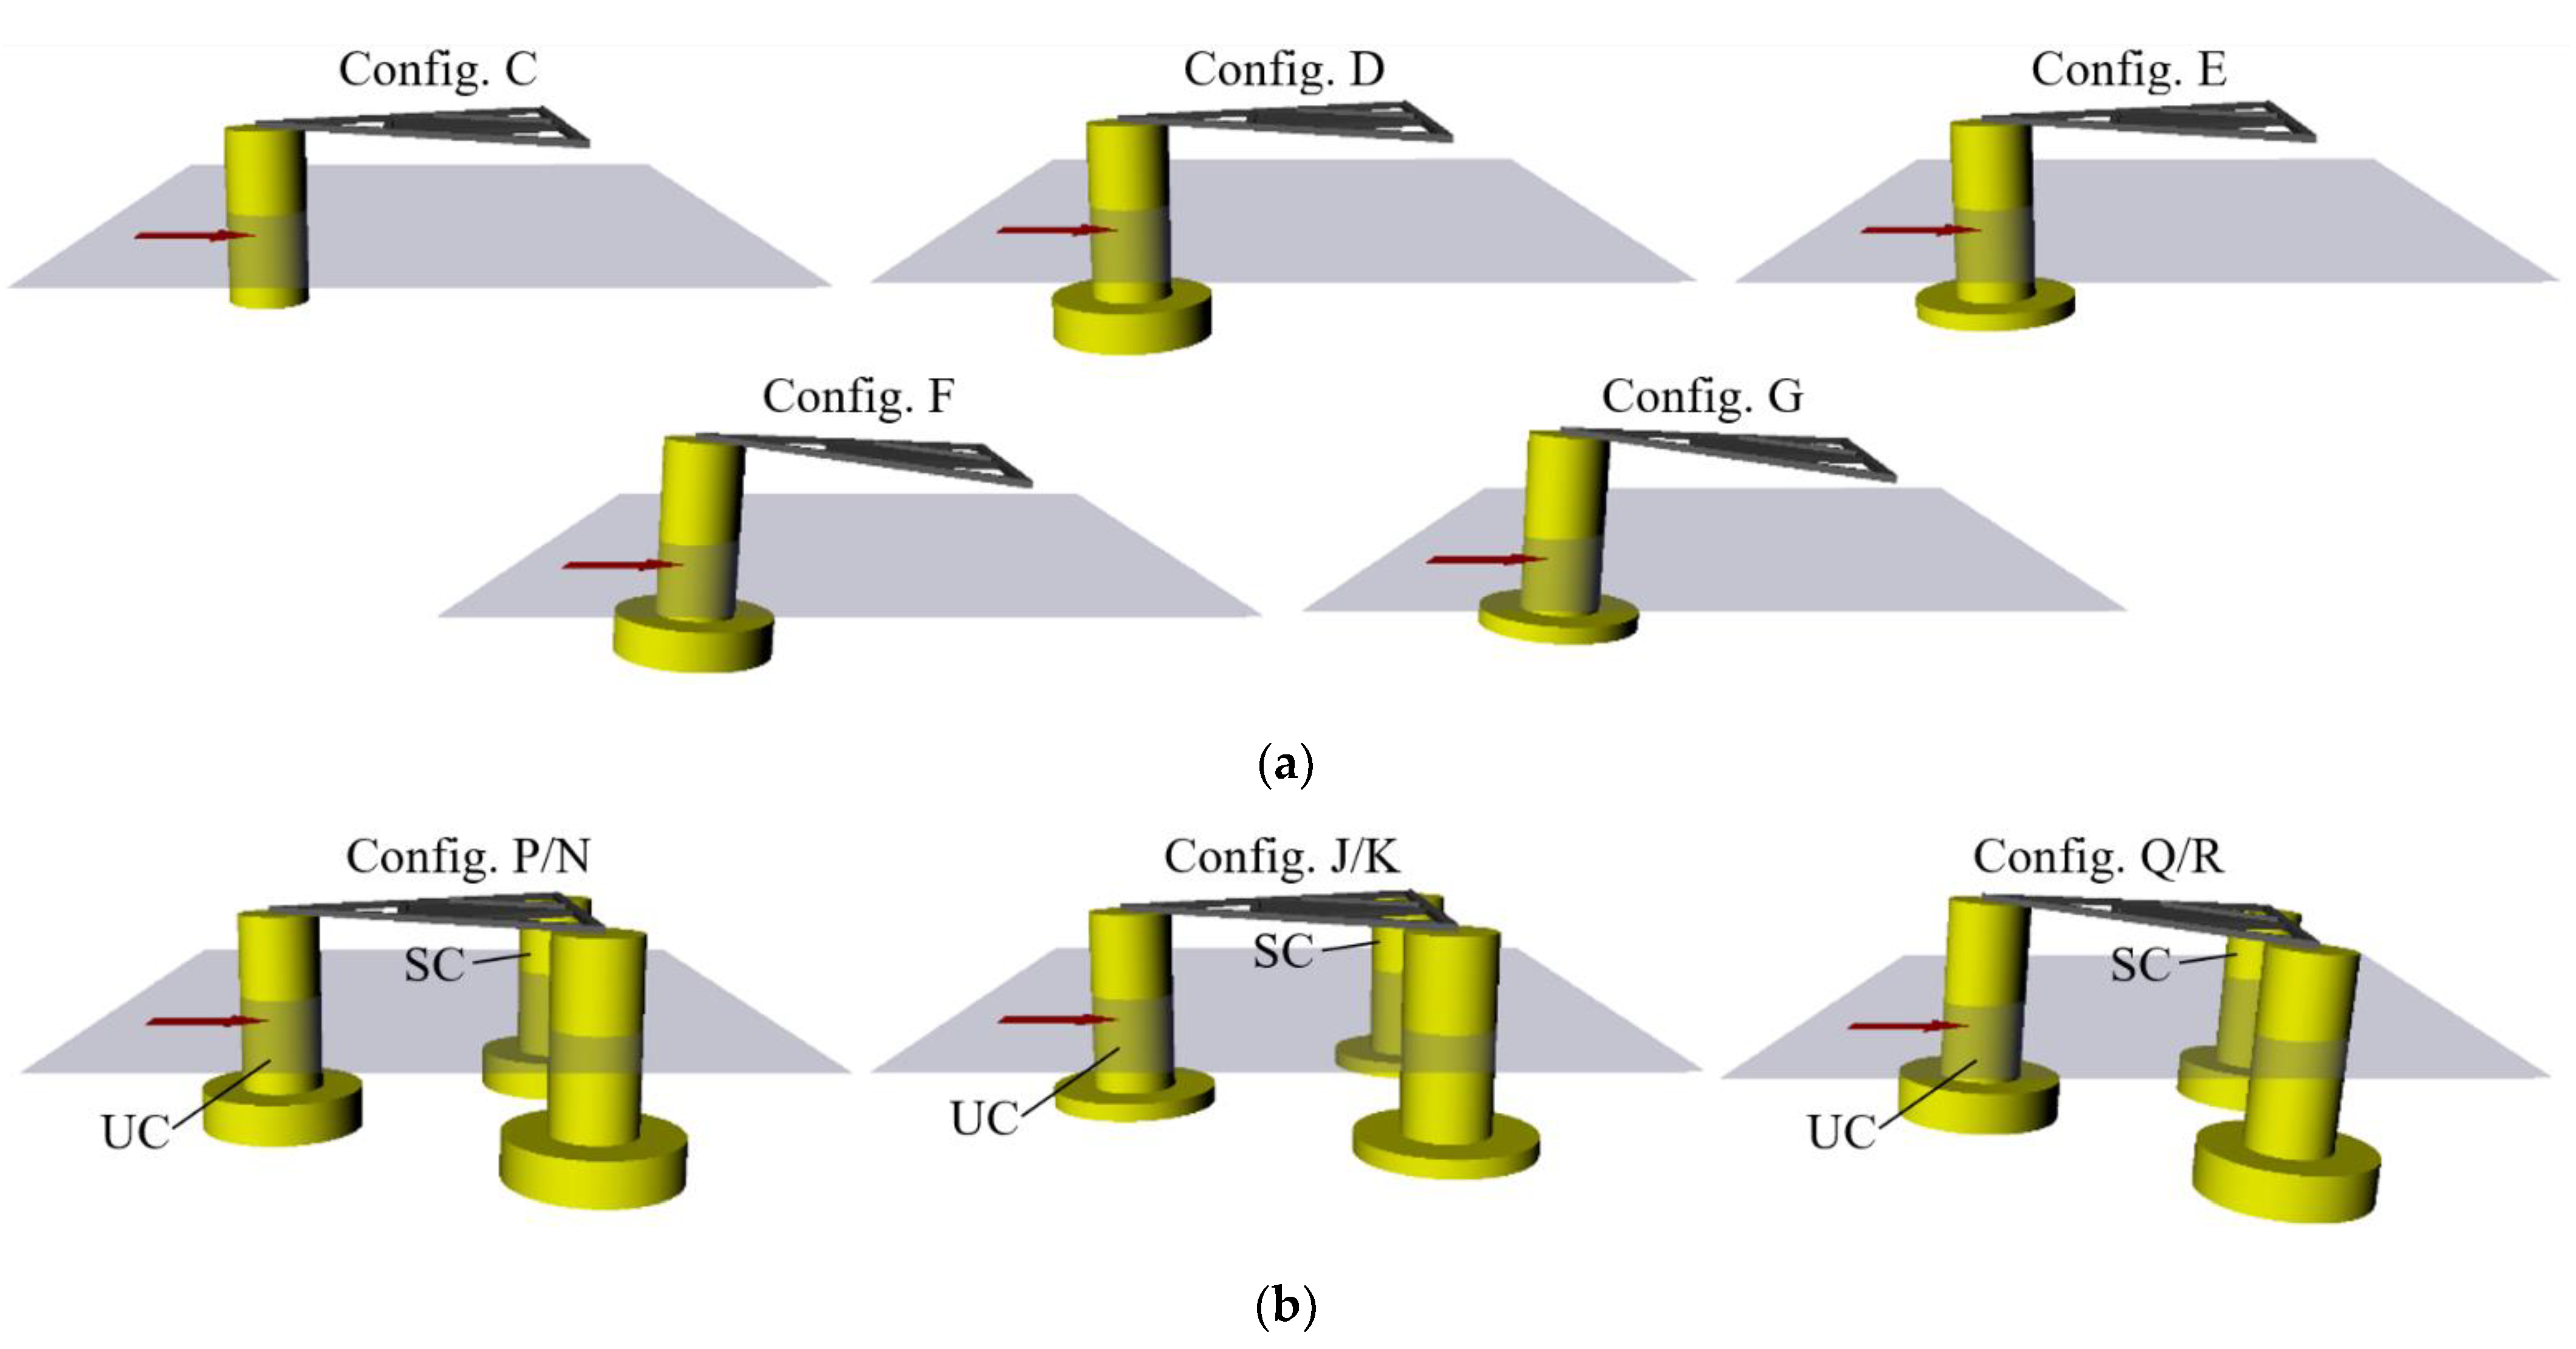
To examine the causes of the underprediction by the modeling tools, individual components of this system were first tested in isolation, and then complexity was built up by adding other components. A full list of the model configurations examined in this campaign is provided in Table 1, with a visual representation in Figure 6. By focusing on the components, the dataset supports the validation needs beyond just one specific design.
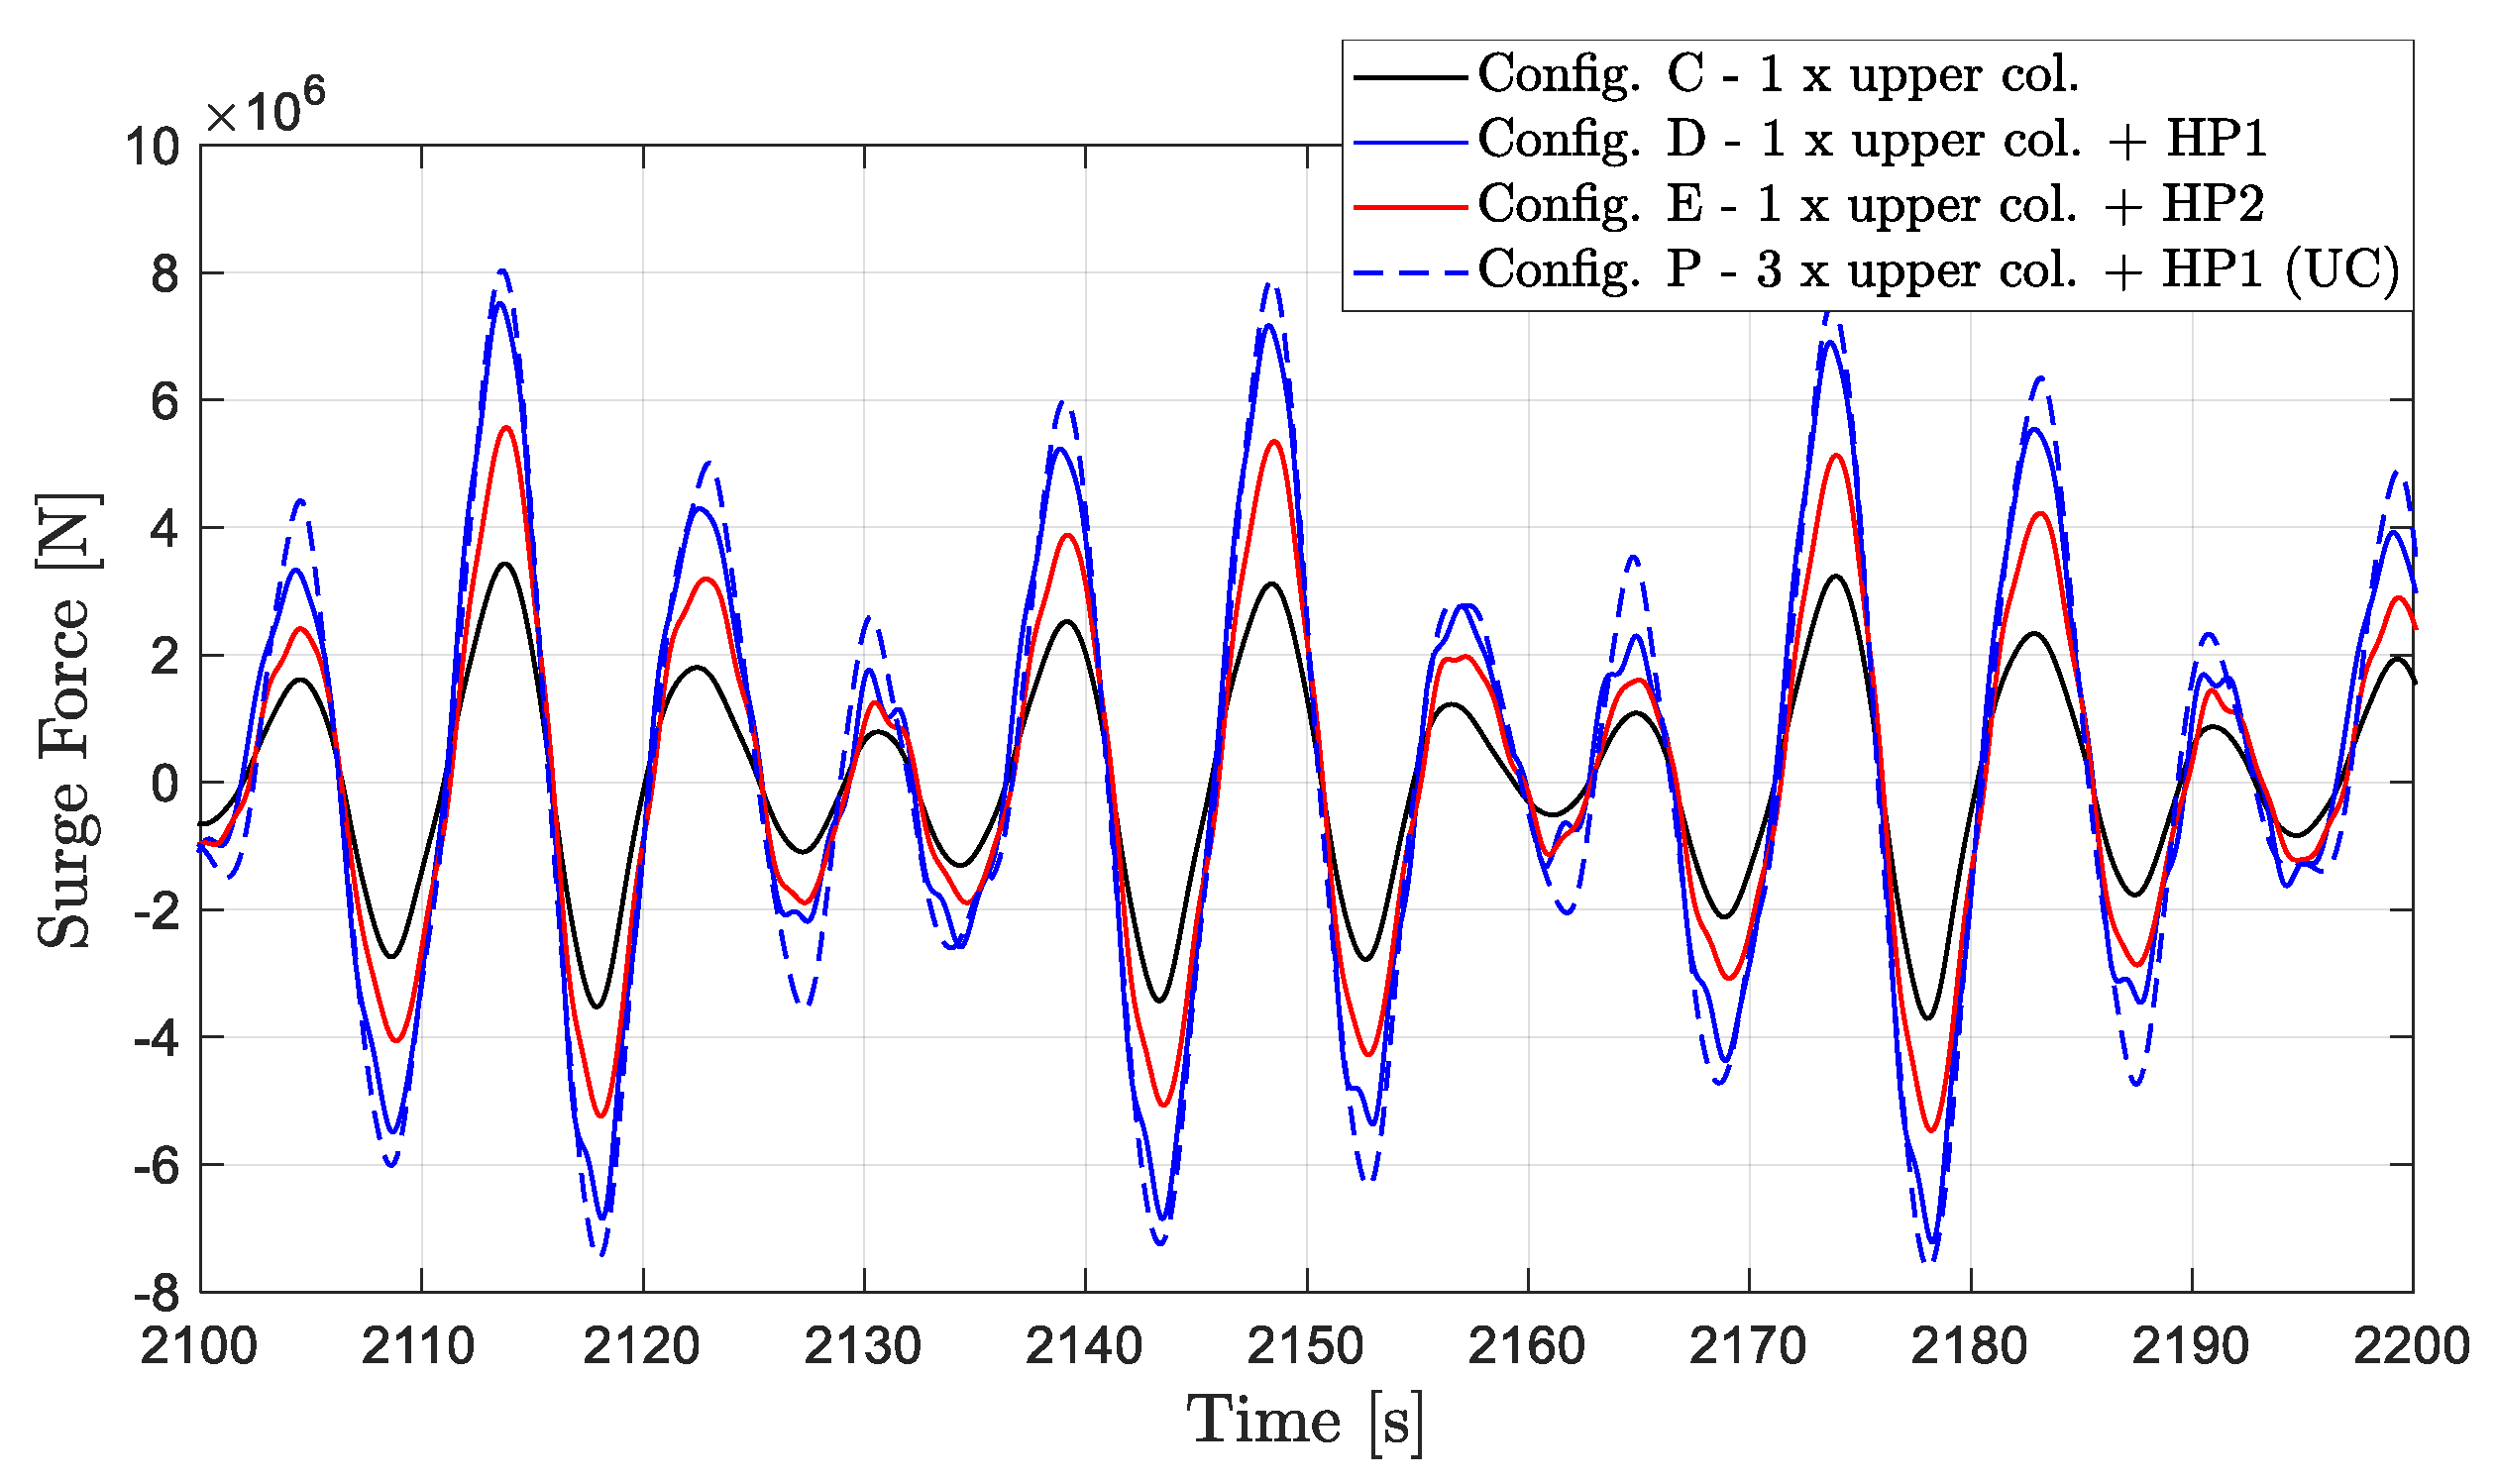
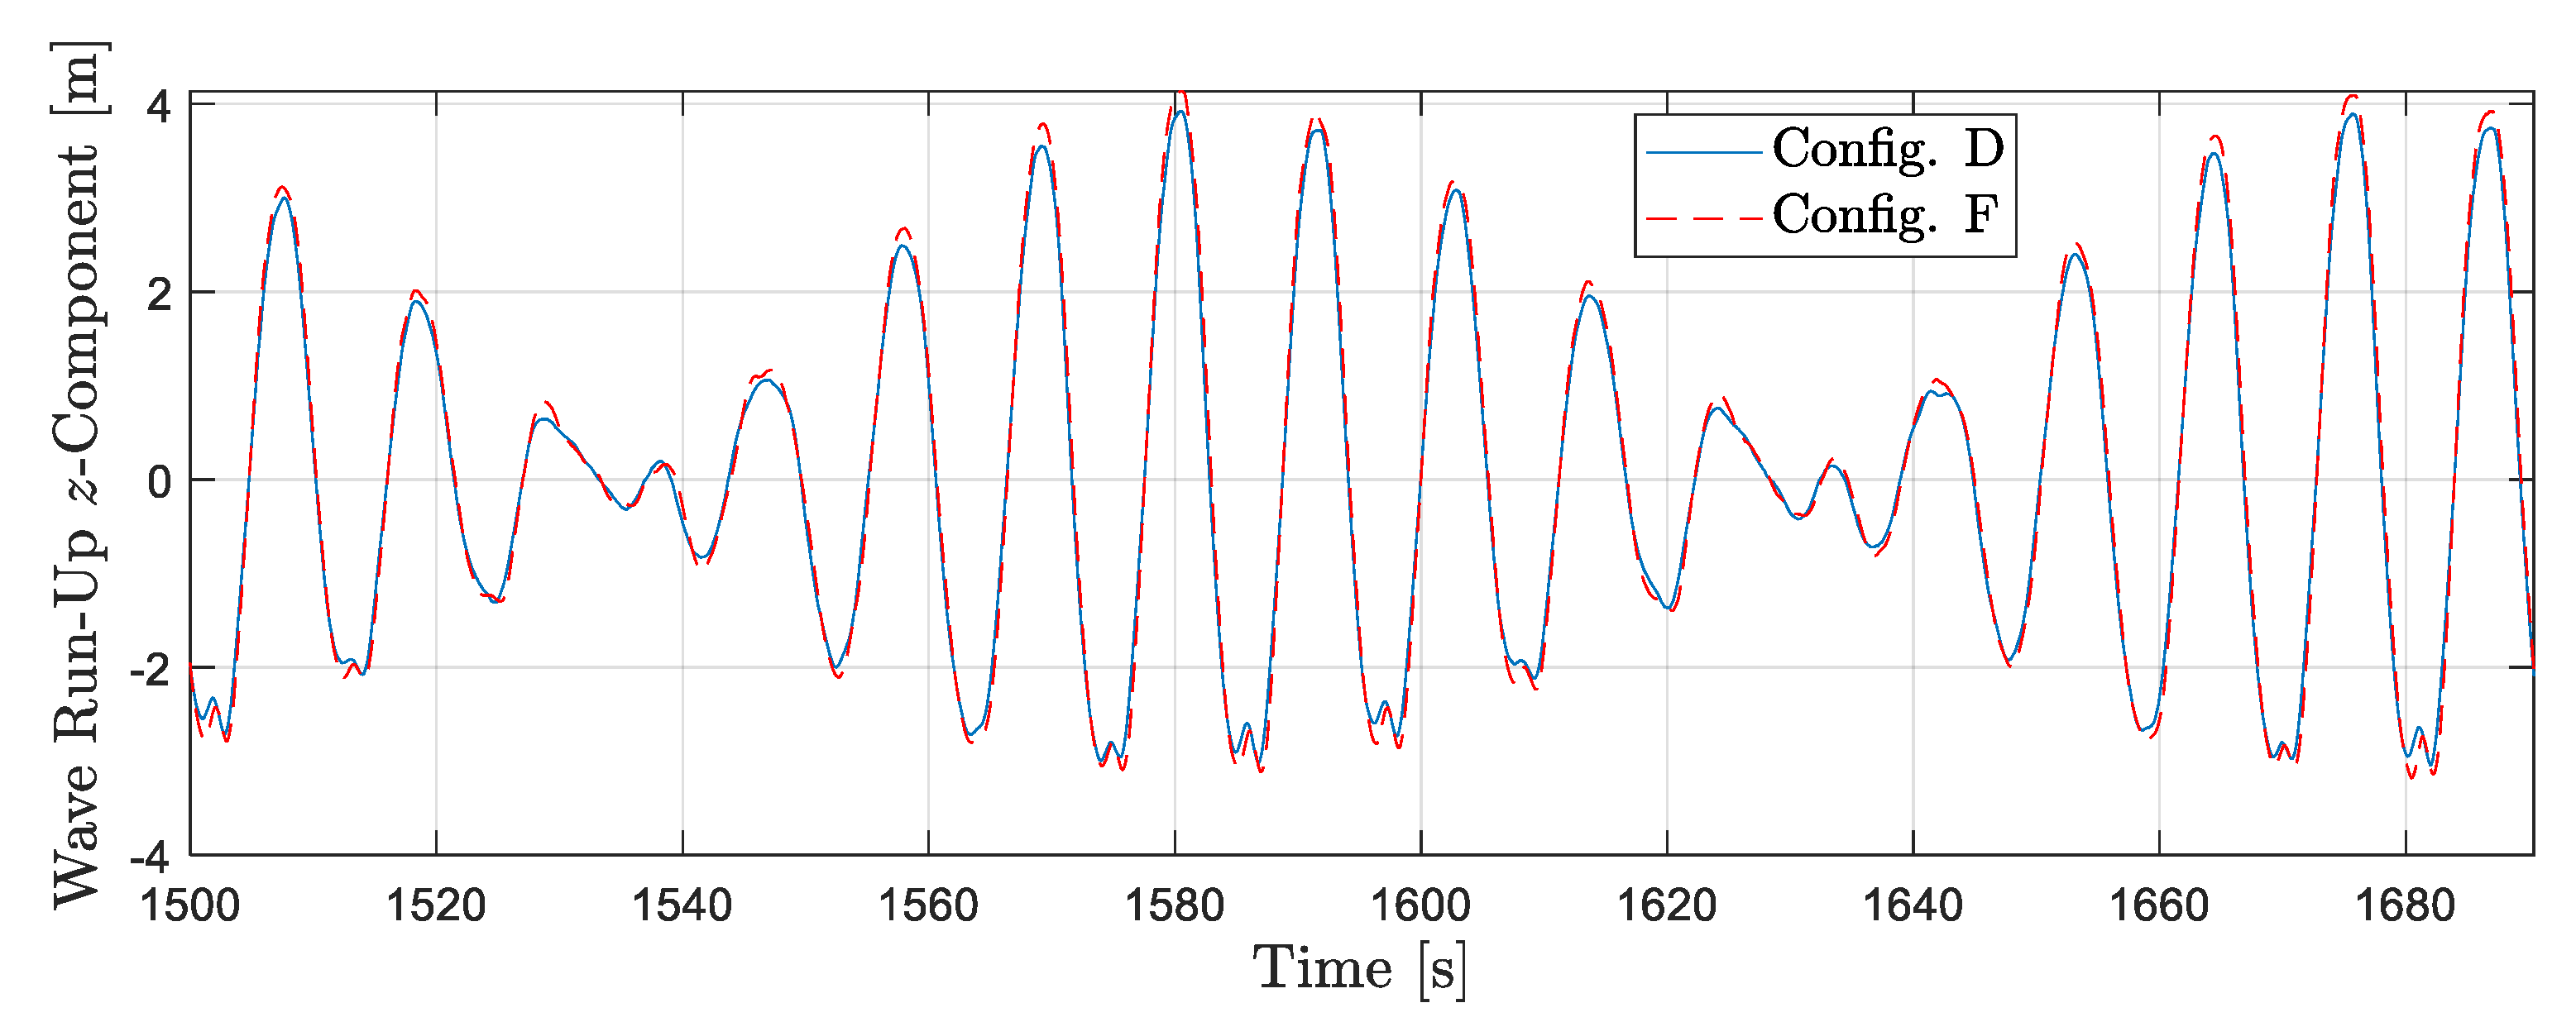
The simplest configuration tested consisted of just a single upper column with no heave plate placed at the upstream-column (UC) position with the two rear columns removed from the triangular frame (see Figure 6a—Configuration C). The larger HP1 was then attached to the single upper column to form Configuration D, shown in Figure 6a. Finally, three upper columns with HP1 arranged as they would for a traditional design, as shown in Figure 5b, were tested. This three-column arrangement corresponds to configurations P and N in 
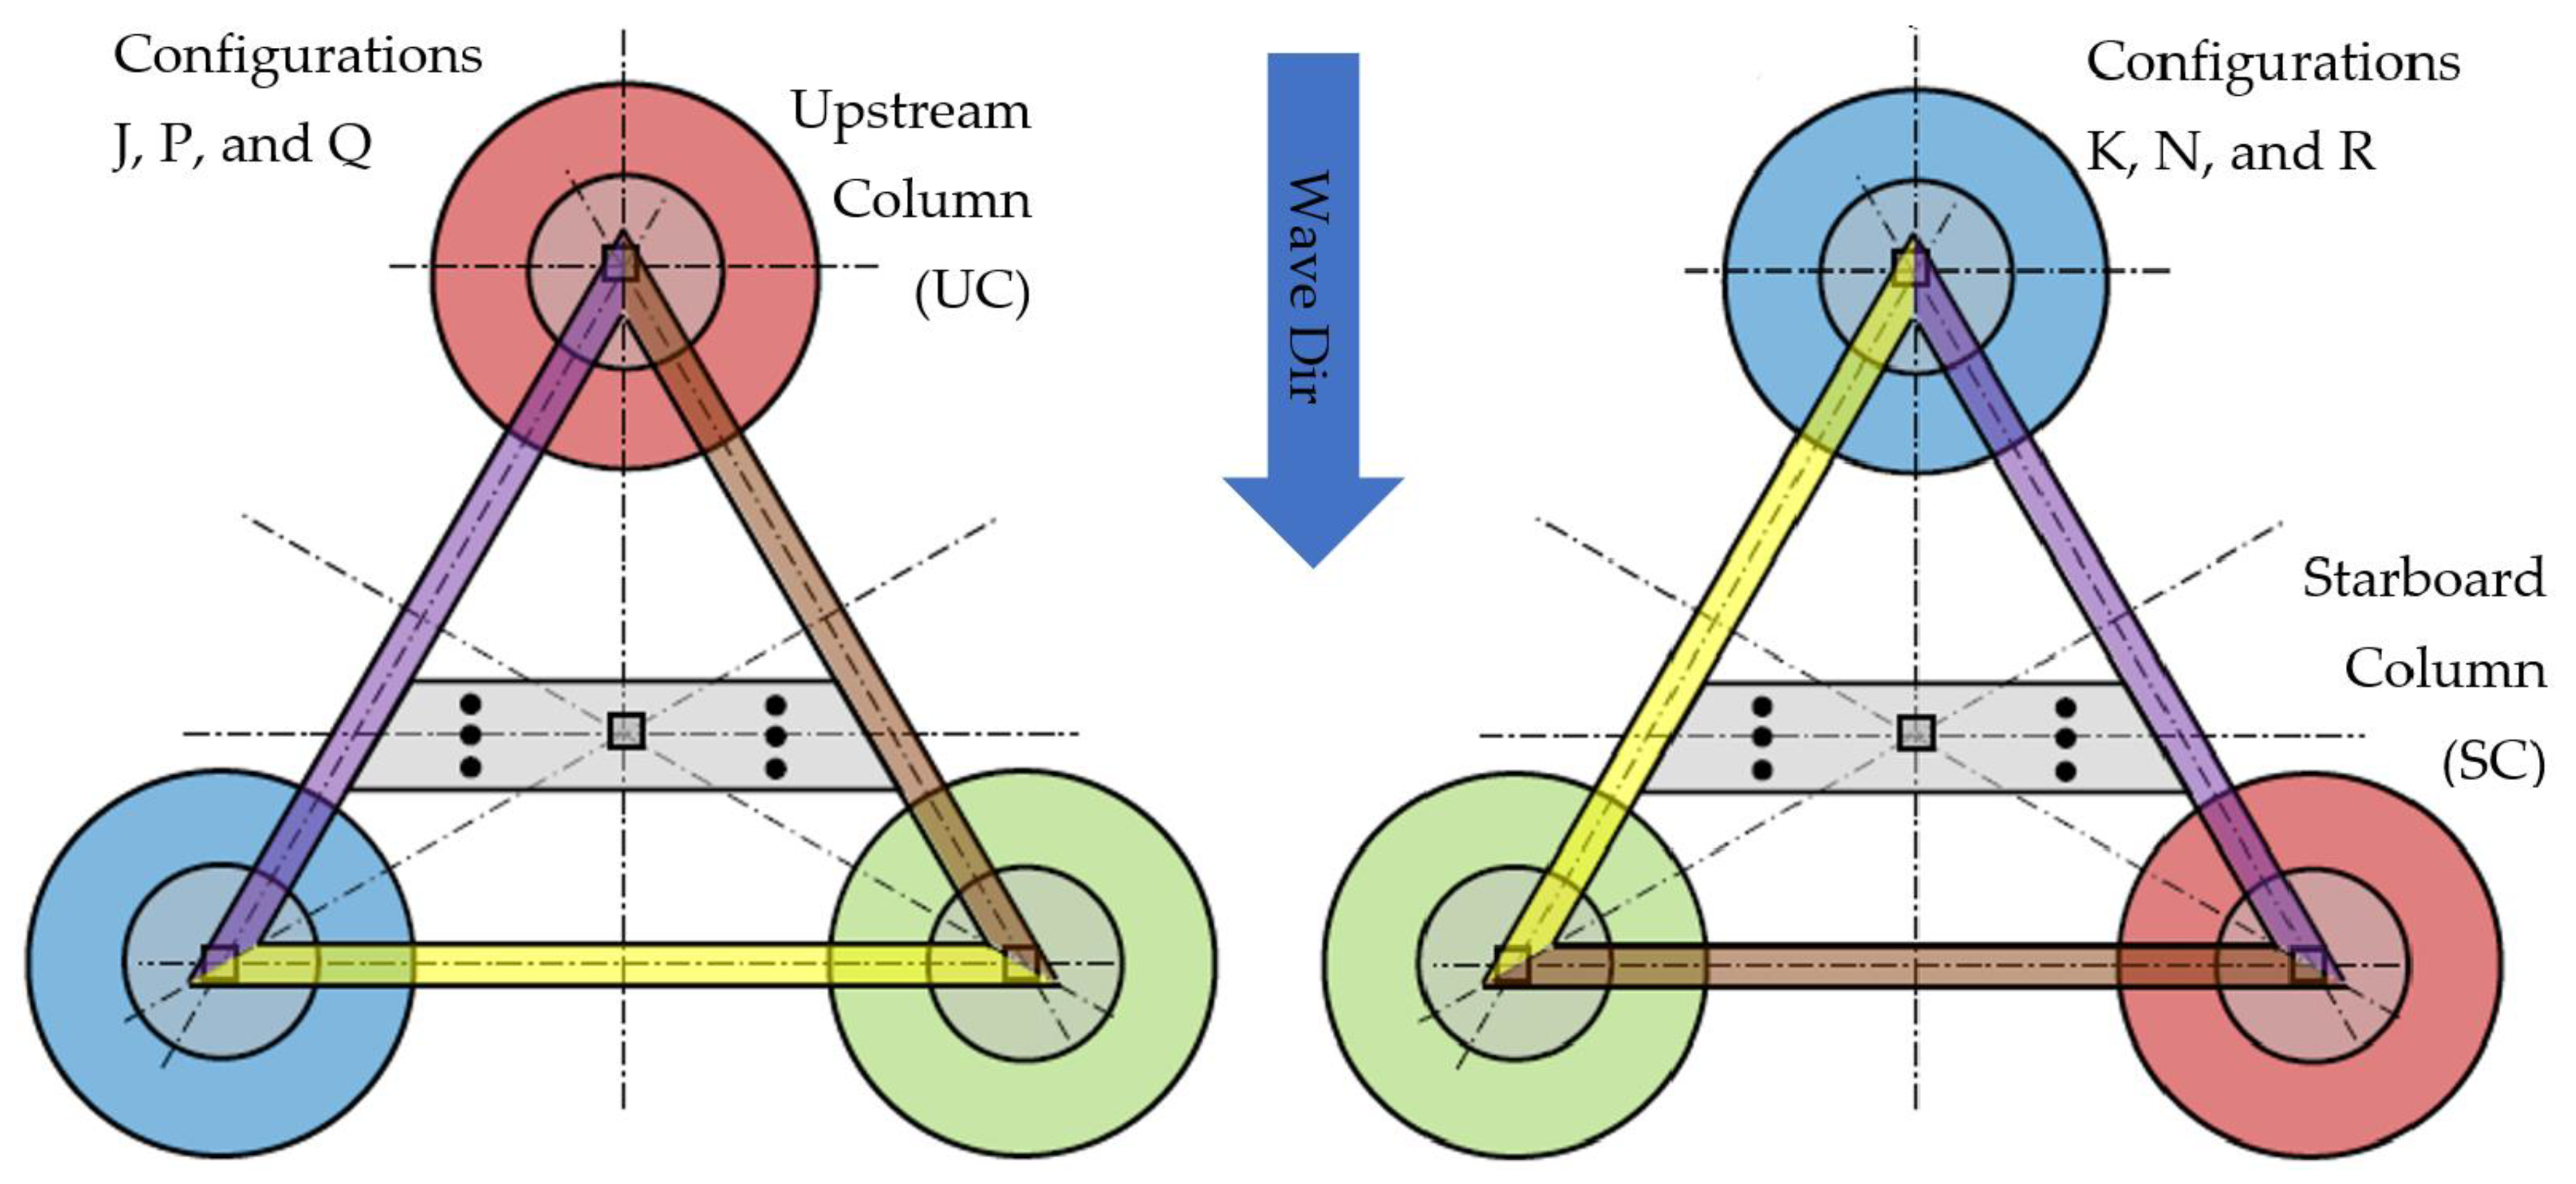
Figure 6b. These two model configurations are geometrically identical; the only difference is that the upper column/heave plate combination instrumented with pressure sensors was placed at the UC position in Configuration P and at the starboard-column (SC) position in Configuration N (see Figure 7). Switching the position of the column/heave plate combination with the pressure sensors and repeating the experiments allowed us to gather the pressure information on both the UC and the SC. The pressure on the third column on the portside is assumed to be comparable to that on the SC by symmetry.
Additionally, experiments with the smaller HP2 (configurations E and J/K in Figure 6) were performed to assess the influence of the heave-plate thickness on the hydrodynamic loads. The model was also rotated by 5 degrees about the pitch axis of the structure (configurations F, G, and Q/R in Figure 6) to an orientation representative of operational wind conditions. These arrangements are unique to offshore wind and provide relevant validation data to the community. As with configurations P/N, configurations J/K and Q/R are identical to each other except for the position of the column/heave plate combination instrumented with the pressure sensors.

4. Wave Conditions

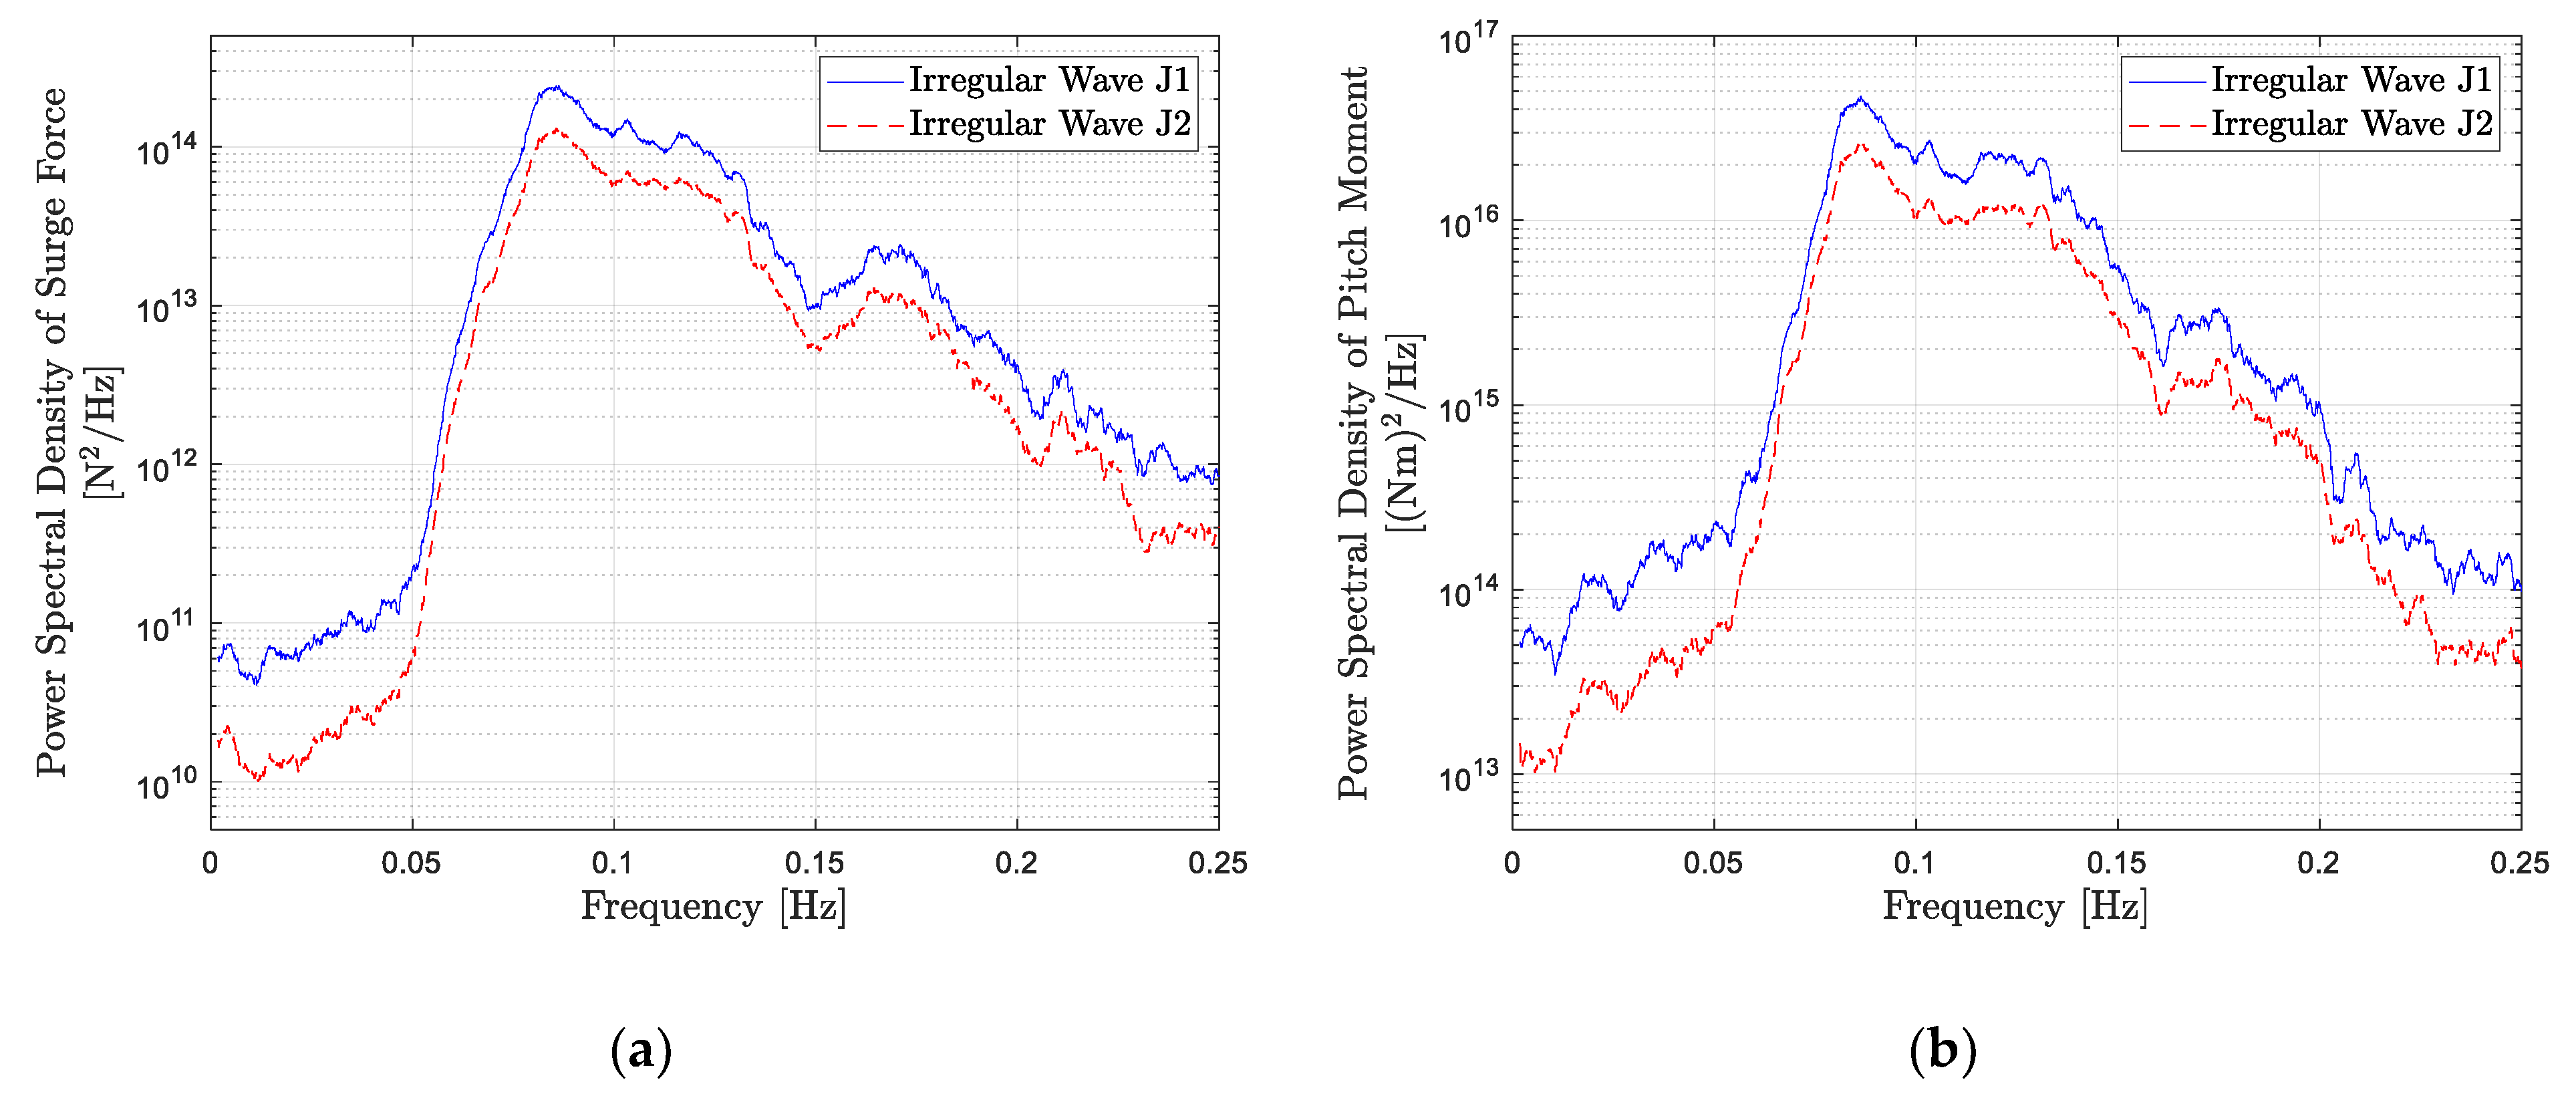
The primary focus of this validation campaign is the hydrodynamic loading at low frequencies near the surge and pitch natural frequencies of the floating wind semisubmersible at approximately 0.01 and 0.032 Hz, respectively [4]. These frequencies lie outside the linear wave-frequency region, and the hydrodynamic loading, therefore, originates from the nonlinear interaction among the linear wave components. A realistic, irregular wave spectrum can be considered as the superposition of many wave components at different frequencies. These individual waves combine to create the overall spectrum but also interact with each other to create loading at a frequency that is the difference between those of any two individual wave components.
The wave conditions investigated in this validation campaign are listed in Table 2. A JONSWAP wave spectrum (J1), which is approximately the same wave spectrum examined in the previous validation campaigns run under the OC4, OC5, and OC6 projects [1,4,17], was used to examine the low/difference-frequency loading. Another wave with the same spectrum but a lower significant wave height was also included (J2) to examine how the difference-frequency loading is affected by wave height.
This dataset is intended not just for the validation of engineering models, but also higher-fidelity CFD simulations. The large computational expense of CFD simulations makes it difficult to run full irregular-wave simulations, which typically take 3 h full scale to resolve the low-frequency hydrodynamic loads of concern. Therefore, an additional set of bichromatic waves was developed to focus on the difference-frequency wave-load components more directly and efficiently. Bichromatic waves are simply the addition of two regular waves, allowing one to directly examine the difference-frequency loads from one pair of waves rather than the many pairs that contribute to it in an irregular wave spectrum. If the frequencies are chosen well, bichromatic waves can be made repeatable over a short time window (see [31] for more information on the development of these bichromatic-wave cases), and the CFD simulations only need to be run for a few repeat periods (on the order of a few hundred seconds full scale) to capture the difference-frequency loads. Five different bichromatic-wave cases were run in this validation campaign (B1–B5). The B1–B3 wave pairs have a difference frequency near the pitch natural frequency of the semisubmersible, around 0.032 Hz. B3 uses the same wave-pair frequencies as B1 but with a reduced wave height. Waves B4 and B5 are wave pairs that have a difference frequency near the surge natural frequency, at approximately 0.01 Hz.
Finally, three regular-wave cases were also performed, R1–R3. The R1 wave frequency matches the peak frequency of the irregular waves, J1 and J2, and the frequency of one of the wave components of B1, B3, and B4. R2 has the same wave frequency as R1, but a lower wave height. Regular wave R3 has a frequency close to that of the other wave component of B1 and B3.
A preliminary characterization of the nature of the wave loading can be obtained based on the nondimensional wave height, H / λ , and the diffraction parameter, π D / λ , where H , λ , and D are the wave height, wavelength, and characteristic body dimension, respectively [32]. For the present campaign, it is appropriate to take D as the diameter of the upper columns, 12 m. H and λ are straightforwardly defined for the regular waves. For the irregular waves, the significant wave height, H s , can be used, and λ is taken as that corresponding to the peak wave period. Finally, for the bichromatic waves, a conservative characterization can be obtained by taking H as the sum of the wave heights of the two primary wave components and λ from the shorter of the two wave components.
Based on the various wave-loading regimes from [32] (Figure 4.18 on p. 167), all 10 wave conditions in Table 2 have 0.25 < H / D < 1.5 , falling in the regime where the wave loads are dominated by inertial effects with small but nonnegligible contributions from viscous drag. Furthermore, all wave conditions have π D / λ < 0.5 and fall in the region of negligible wave-diffraction effects. In the absence of wave radiation (the structure was fixed) and weak wave diffraction, it can be conjectured that the side walls of the basin should have little effect on the measured wave loads. Note that, however, this analysis assumes a single column in isolation. If all three columns were present, the hydrodynamic interactions among the columns could potentially result in a larger characteristic body dimension and push some of the wave conditions with shorter waves, such as B2, to the regime with nonnegligible wave-diffraction effects. If this is the case, the basin wall might influence the wave loads. We therefore suggest that the basin walls be included in, for example, CFD simulations if the intent is to validate the numerical simulation with the present dataset.

5. Measurements

A series of measurements were made in this campaign to study the distribution of the hydrodynamic loading across the structure and to obtain measurements needed for validation of higher-fidelity modeling tools, such as CFD. These measurements will help elucidate what drives the nonlinearity of the hydrodynamic loading and what our simplified models are missing.

5.1. Wave Measurements

During the calibration of the wave environment and during testing with the structure present, multiple wave probes were installed throughout the wave basin. Measurements at multiple locations in the basin allow wave-splitting analysis (see, e.g., [33]) to be performed to quantify the various wave components present in the experimental campaign. The information from such analyses is required to estimate errors and uncertainties in the experimental results, as discussed in Section 7.
Two different types of wave probes were used: a capacitance-type wave probe by Akamina and a resistance-type wave probe by Edinburgh Designs [5]. The resistance-type wave probes are more accurate but require frequent recalibration. Therefore, these were used only for the wave calibration cases and recalibrated prior to each use. The capacitance-type wave probes do not require recalibration and were, therefore, installed and kept largely in the same locations throughout the wave calibration and testing with the structure present.
The layout of the wave probes during wave calibration is shown in Figure 8 and summarized in Table 3. The resistance-type wave probes, labeled F–J, were installed in a linear array along the x -direction at the centerline of the wave tank. The capacitance-type wave probes, labeled A–E, were also installed in a linear array along the x -direction of the wave tank but offset from the centerline in the + y direction. Only the capacitance-type wave probes were retained for the tests with the structure present and were kept largely in the same location throughout the campaign. However, the exact positions of the capacitance probes changed slightly from wave calibration to the tests with a single column to the tests with three columns. The slight variations in the locations of the reference probes A–E are documented in Table 3. For the experiments with the structure, an additional wave probe was placed right in front of the upstream upper column to measure wave run-up (see Section 5.4 for details).
During the campaign, the reference capacitance wave probes A–E sometimes had issues in resolving the wave peaks. This issue is most prominent for regular waves, as shown in Figure 9a, and also present, though less conspicuous, for the bichromatic and irregular waves (see, e.g., Figure 9b). Therefore, the wave measurements from the capacitance probes should be treated as supplementary reference measurements only, and the readings from the resistance probes during wave calibration should be used to characterize the incident wave field. The exact cause of the wave-peak cutoff with the capacitance probes has not been identified.

5.2. Load Measurements

Previous validation campaigns of the OC4/OC5/OC6 projects focused on the global loads integrated across the entire structure. This made it difficult to have detailed validation and to identify the causes of the underprediction in the loads. In this new campaign, three-degree-of-freedom load cells were employed to measure the surge force, heave force, and pitch moment on individual upper columns or upper column/heave plate combinations. Two separate load cells were used, through which the UC and SC were rigidly mounted to the top-of-column triangular frame, as shown in Figure 10. The loads on the third column on the portside were not measured and are assumed to be comparable to that on the SC.
For the 5°-pitched configurations, the entire model assembly was rotated about the pitch axis, including the load cells. Therefore, the wave forces and moments were measured in a body-fixed coordinate system at the load-cell flanges.
For ease of use, all wave force and moment in the final dataset on the DAP (and in this paper) are resolved in an earth-fixed coordinate system about a fixed origin vertically above the center of pitch rotation at the still-water level, as shown in Figure 11. The consistent use of the same coordinate system for all model components and configurations, rather than a different axis for each individual column, allows one to compare the load contributions from each individual model component to the overall loading directly and compare the wave loads across different model configurations. Furthermore, the total wave loads on the three-column configurations can be obtained by simply summing the contributions from each column. With the information provided, the pitch moment can also be straightforwardly recomputed about any other axis.
Based on this coordinate system, the surge and heave forces are positive in the direction of wave propagation (+ x -axis) and vertically upward (+ z -axis), respectively. The pitch rotation and moment are positive in the + y -direction, as defined by the right-hand convention.
Some high-frequency fluctuation can be observed in the measured wave-load time history of the single-column configurations, most likely because of structural vibration in the model assembly. Therefore, the experimental setup was reinforced for the subsequent experiments with three columns, mostly eliminating the high-frequency fluctuation in the measured loads. The presence of structural vibration is illustrated in Figure 12. Higher-frequency vibration can be observed in, for example, the surge force of the single-column configuration D in both the time history (Figure 12a) and the amplitude spectra (Figure 12c). Fortunately, the structural frequencies and the wave frequencies are generally well separated with the structural frequencies being more than five times the typical wave frequencies; therefore, the structural vibration of the single-column configurations should have little effect on the measured wave-frequency and difference-frequency wave loads, which are the quantities of primary interest. Furthermore, the structural vibration can be effectively removed without affecting the wave-frequency loads with the low-pass filtering shown in Figure 12. For the three-column configurations, such as Configuration P with HP1 shown in Figure 12b,d, the measurements are mostly free from the high-frequency structural vibration. The filtered and unfiltered time series and spectra are effectively identical. Note that the data in the online repository has not been filtered to allow users of the dataset to perform their own postprocessing as they see fit.
Because a single column was tested in isolation, then with a heave plate, and finally within a three-column configuration, the influence on the loads on the UC by the presence of the other members was captured. Figure 13 shows the impact of the additional components on the hydrodynamic loads on the UC for bichromatic wave B1. The surge-force time histories shown in Figure 13 have been low-pass filtered to remove the effect of structural vibration in the same fashion as in Figure 12.
The power spectral densities of wave surge force and pitch moment on the UC of Configuration P under the two irregular-wave conditions, J1 and J2, are shown in Figure 14. The nonlinear, low-frequency force and moment below 0.05 Hz scale more strongly with the significant wave height compared to the wave-frequency loads above 0.055 Hz, consistent with the nonlinear nature of the low-frequency loads.
Finally, a qualitative comparison between the experimental results and the predictions from the Morison equation was performed to check the validity of the experimental measurements. For this simple validation, only the surge force was considered because the heave force and pitch moment are strongly influenced by the vertical drag force on the heave plates, which needs to be modeled with care. This is beyond the scope of this article and is discussed in detail in [34]. Using OpenFAST, which adopts a strip-theory-type implementation of the Morison equation [35], the surge (transverse) force on each upper column and heave plate was computed with an inertia coefficient of C M = 2 , which is the theoretical value for a fixed circular cylinder in an ideal infinite oscillatory flow. Following the recommendation from [36] for a similar geometry, a drag coefficient of C D = 0.4 was used for the upper columns and C D = 1.6 was chosen for the heave plates. No further tuning of the hydrodynamic coefficients was performed for the present preliminary comparison.
The wave-induced surge forces on the upstream and starboard columns of Configuration P (three columns with HP1 at zero pitch angle) and bichromatic wave B4 are compared in Figure 15. Both time series and amplitude spectra are shown. With the selected inertia and drag coefficients, the predictions from the Morison equation are qualitatively consistent with the experimental measurements, even for some of the higher-order nonlinear components, lending confidence to the experimental measurements. At the difference frequency, which falls on the surge natural frequency of the structure when floating, the nonlinear surge force from the Morison equation is of the same order of magnitude as that from the experiment for both columns. However, the experiment showed that the difference-frequency surge force on the starboard column is almost three times that on the upstream column, likely because of the hydrodynamic interactions among the three columns. This is, of course, not captured by the simplified Morison-equation model, which computes the wave loads based on the undisturbed wave field, effectively treating each column as if it were in isolation.
Furthermore, the predictions from the Morison equation shown in Figure 15 were computed by directly using the measured wave time history at Probe H from the wave calibration experiment as an input to OpenFAST. This wave signal also contains the nonlinear difference-frequency wave component, which was treated as a small linear low-frequency wave by OpenFAST, potentially affecting the predicted wave force at the difference frequency. Strictly speaking, the low-frequency contents in the experimental wave data should be filtered out first; however, this was not carried out for the present qualitative comparison.

5.3. Pressure Measurements

As described in Section 3, one of the upper column/heave plate sets was instrumented with pressure sensors to obtain information on the load distribution near the waterline and on the top face of the heave plate. The locations of the pressure taps are shown in Figure 16a. To obtain the pressure measurements on both the UC and SC, all experiments with the three-column configurations were repeated twice, once with the column and heave plate instrumented with the pressure sensors at the UC position (configurations J, P, and Q) and once with them in the SC position (configurations K, N, and R) as shown in Figure 7. The third column is considered to have loads comparable to that on the SC by symmetry.
Irrespective of the position the instrumented column was in, the pressure taps labeled UF1–6 and BF2–4 were always in the − x -direction facing the incident waves with the pressure taps UA1–6 and BA3–4 on the opposite side of the column as shown in Figure 16a. Note that no pressure measurement is available for the single-column configurations. The UF1–6 and UA1–6 pressure taps are evenly spaced in the z -directions between 5.25 m below SWL to 2.25 m above SWL. BF2–4 are evenly spaced in the radial direction between 3.6 m and 1.2 m to the outer edge of the heave plate. Finally, BA3 and BA4 are radially located on the top face of the heave plate at 2.4 m and 1.2 m to the outer edge of the heave plate, respectively. All dimensions are at full scale.
Example results for the bichromatic wave B4 are presented in Figure 16b,c, which show the amplitude of pressure oscillation at the difference frequency near the waterline on the UC (Config. P) and SC (Config. N), respectively. The pressure amplitudes were estimated from fast Fourier transforms of the pressure time history. The increased difference-frequency pressure oscillation near the still waterline at z = 0 indicates a region of high difference-frequency wave excitation.
Several factors in the experimental setup negatively impacted the reliability of the pressure measurements. First, the tubes connecting the pressure taps and the sensors extended above the free surface and were, therefore, only partially filled with water. The water in the tubes could potentially move under the action of the waves, introducing inertial effects in the measured pressure. Second, the periodic wetting of the pressure taps near the waterline caused further difficulties by introducing possible surface-tension effects at the pressure-tap openings and by potentially introducing air bubbles into the tubes, the presence of which could also strongly influence the measured pressure [37]. Finally, when the column with the pressure sensors was in the upstream position, the proximity of the wave run-up probe support to the pressure taps on top of the heave plate could also influence the measurements (see Figure 10b). Therefore, the measured pressure should only be used as qualitative references, and care must be taken when doing so. For instance, the reading from the pressure tap UA5 shown in Figure 16b does not follow the expected trend and should be considered unreliable. In future validation campaigns, high-sensitivity surface-mounted pressure transducers without tubing that are more robust against periodic wetting should be considered. However, this might not always be practical depending on the design and size of the model and cost considerations [37].

5.4. Measurement of Wave Run-Up

A measurement of the wave run-up was also included, as it can have a significant impact on the hydrodynamic loading, especially for higher-order contributions. A wave probe was mounted just in front of the upstream column at 0° ± 0.12° azimuth. For the unpitched configurations, the probe was oriented vertically. For the pitched configurations, the probe rotated with the entire assembly, so it was angled at 5° relative to the SWL for those cases. Videos of the wave run-up were also recorded using a synchronized video camera; a snapshot of this recording is shown in Figure 10a.
As an example, the wave run-up in front of a single column with Heave Plate 1, Configuration D (upright) and Configuration F (5° pitched), is shown in Figure 17 for the bichromatic wave B4. For consistency, the run-up of Configuration F is scaled by a factor of cos β , where β = 5° is the pitch angle, to obtain the vertical component of the run-up. The pitched orientation of Configuration F resulted in slightly increased run-up amplitudes.

6. Test Matrix and Data Availability

A test matrix summarizing the experiments performed is presented in Table 4. As shown in Table 4, not every possible wave-model combination was tested, but the three-column configurations that resemble the original DeepCwind design were examined with all wave conditions, both in the upright position (configurations P/N with HP1 and configurations J/K with HP2) and in the pitched position (configurations Q/R with HP1). Furthermore, three repetitions were performed for most of the wave-model combinations to help assess the random uncertainties in the measurements.
All data from this validation campaign is open to the public via DOE’s DAP at: https://a2e.energy.gov/data/oc6/oc6.phase1b (accessed on 24 September 2021). On this main site is a document that describes the format of the dataset [6] and a Test Report, which summarizes the campaign in more detail [5]. The repository contains 229 files covering both the experiments with the model present (listed in Table 4) and the wave-calibration runs without the structure.
The data files for the experiments with the structure are named using a convention that includes identification of the model configuration, wave condition, and repetition number. An example name is “oc6.phase1b.experiment.configQ.waveB1.repeat2.txt,” which indicates the Q configuration with wave B1, and the second repetition of this test. With Configuration Q, the column/heave plate combination instrumented with the pressure sensors was in the UC position (see Table 1); therefore, the pressure measurements included in this file are for the UC as well.
The file names for wave calibration also identify the wave condition and the repetition. For example, the wave measurements from the first repetition of the calibration of wave B1 are in “oc6.phase1b.experiment.wavecheck.waveB1.repeat1.txt.” All wave conditions were repeated three times during calibration.
This document as well as the data location should be cited in any publication using the dataset. The column headings included in the data files are summarized in Table 5. Note that not all data columns are present in every file; only the relevant ones are included.

7. Uncertainty Analysis

To make this data applicable to the validation of modeling tools, a thorough assessment of the uncertainty in the load measurements was performed. No uncertainty analysis was performed for the pressure measurements or wave run-up, as these are characterized as reference measurements for qualitative investigations only.
Uncertainty in the load measurements comes from three main sources: uncertainties in the waves, the physical models, and the sensors themselves. Because only fixed tests were performed in this campaign, the uncertainty in the physical model is primarily related to the sizing and orientation of the structures tested. With a low tolerance for model placement (generally within ±2 mm for draft at model scale or 0.5% of total draft and ±0.15° in orientation [5]) and sizing (all model dimensions verified to be within ±1 mm of specification [5]), it was determined that the physical model would have minimal contribution to the load uncertainty. Similarly, the systematic uncertainty in the load cells was deemed to be insignificant compared to the other sources based on the available information on sensor calibration [
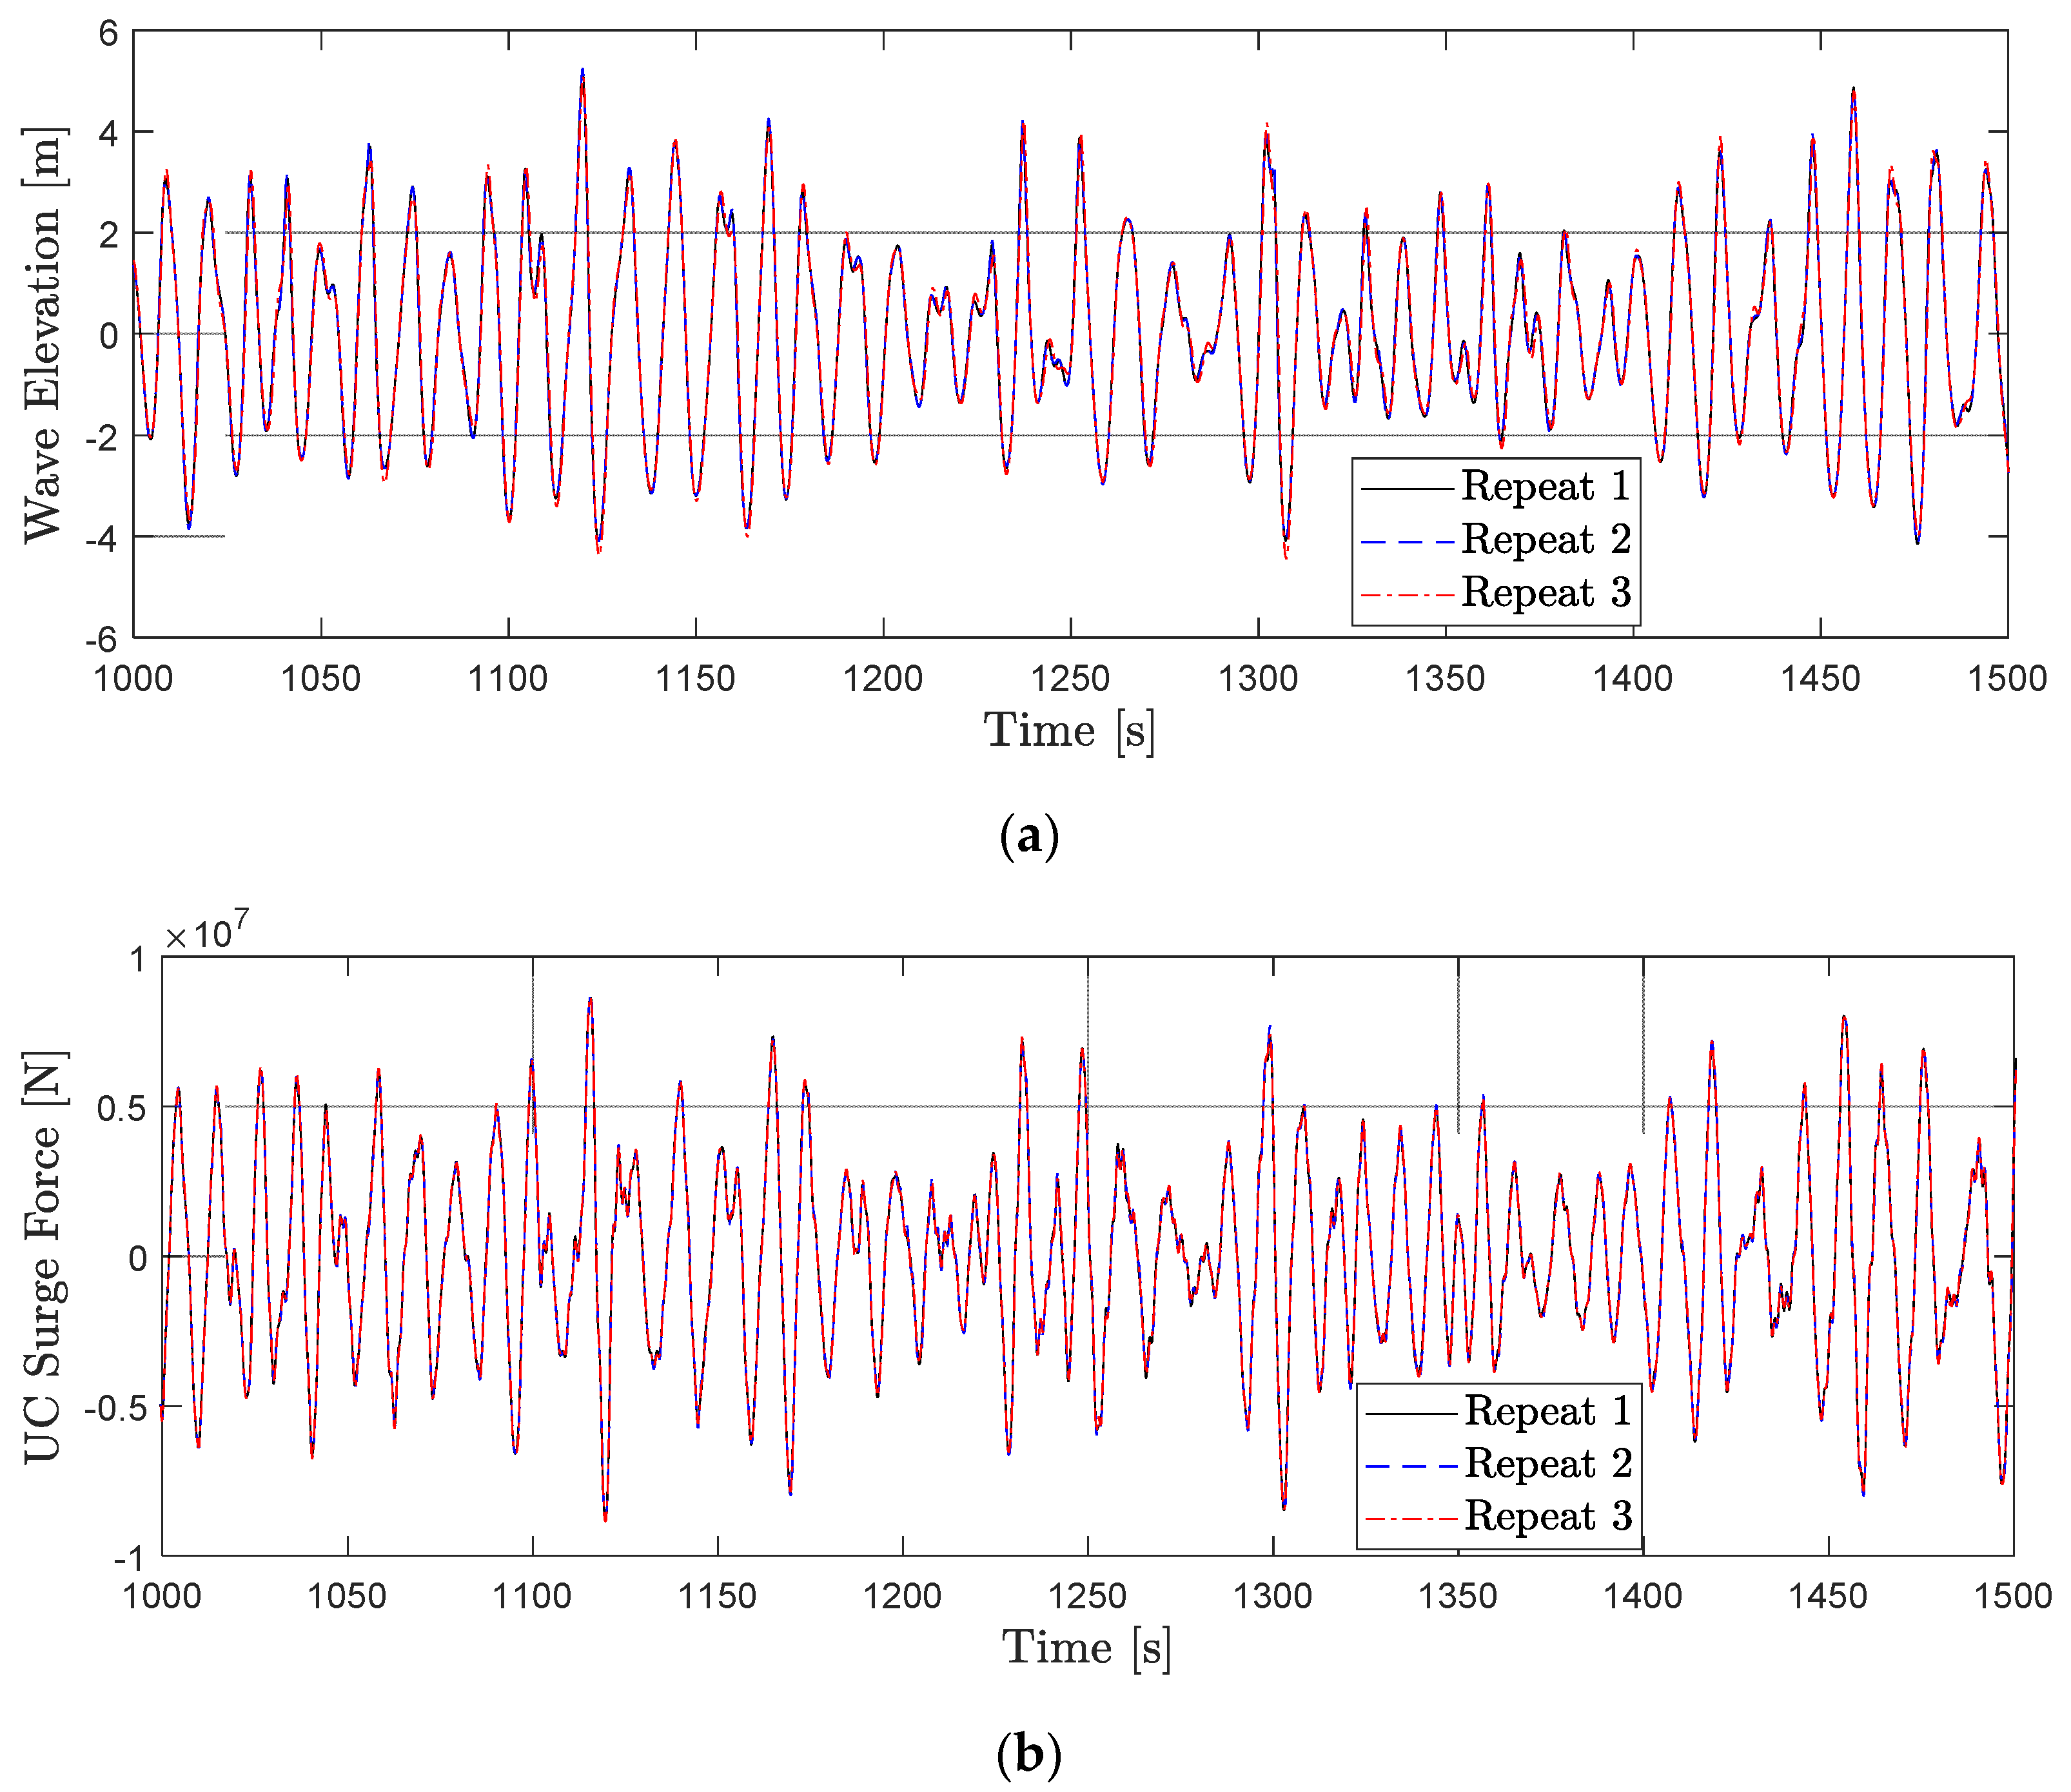
5], leaving only random uncertainty. An indication of the level of random uncertainty in the load measurements can be seen in 
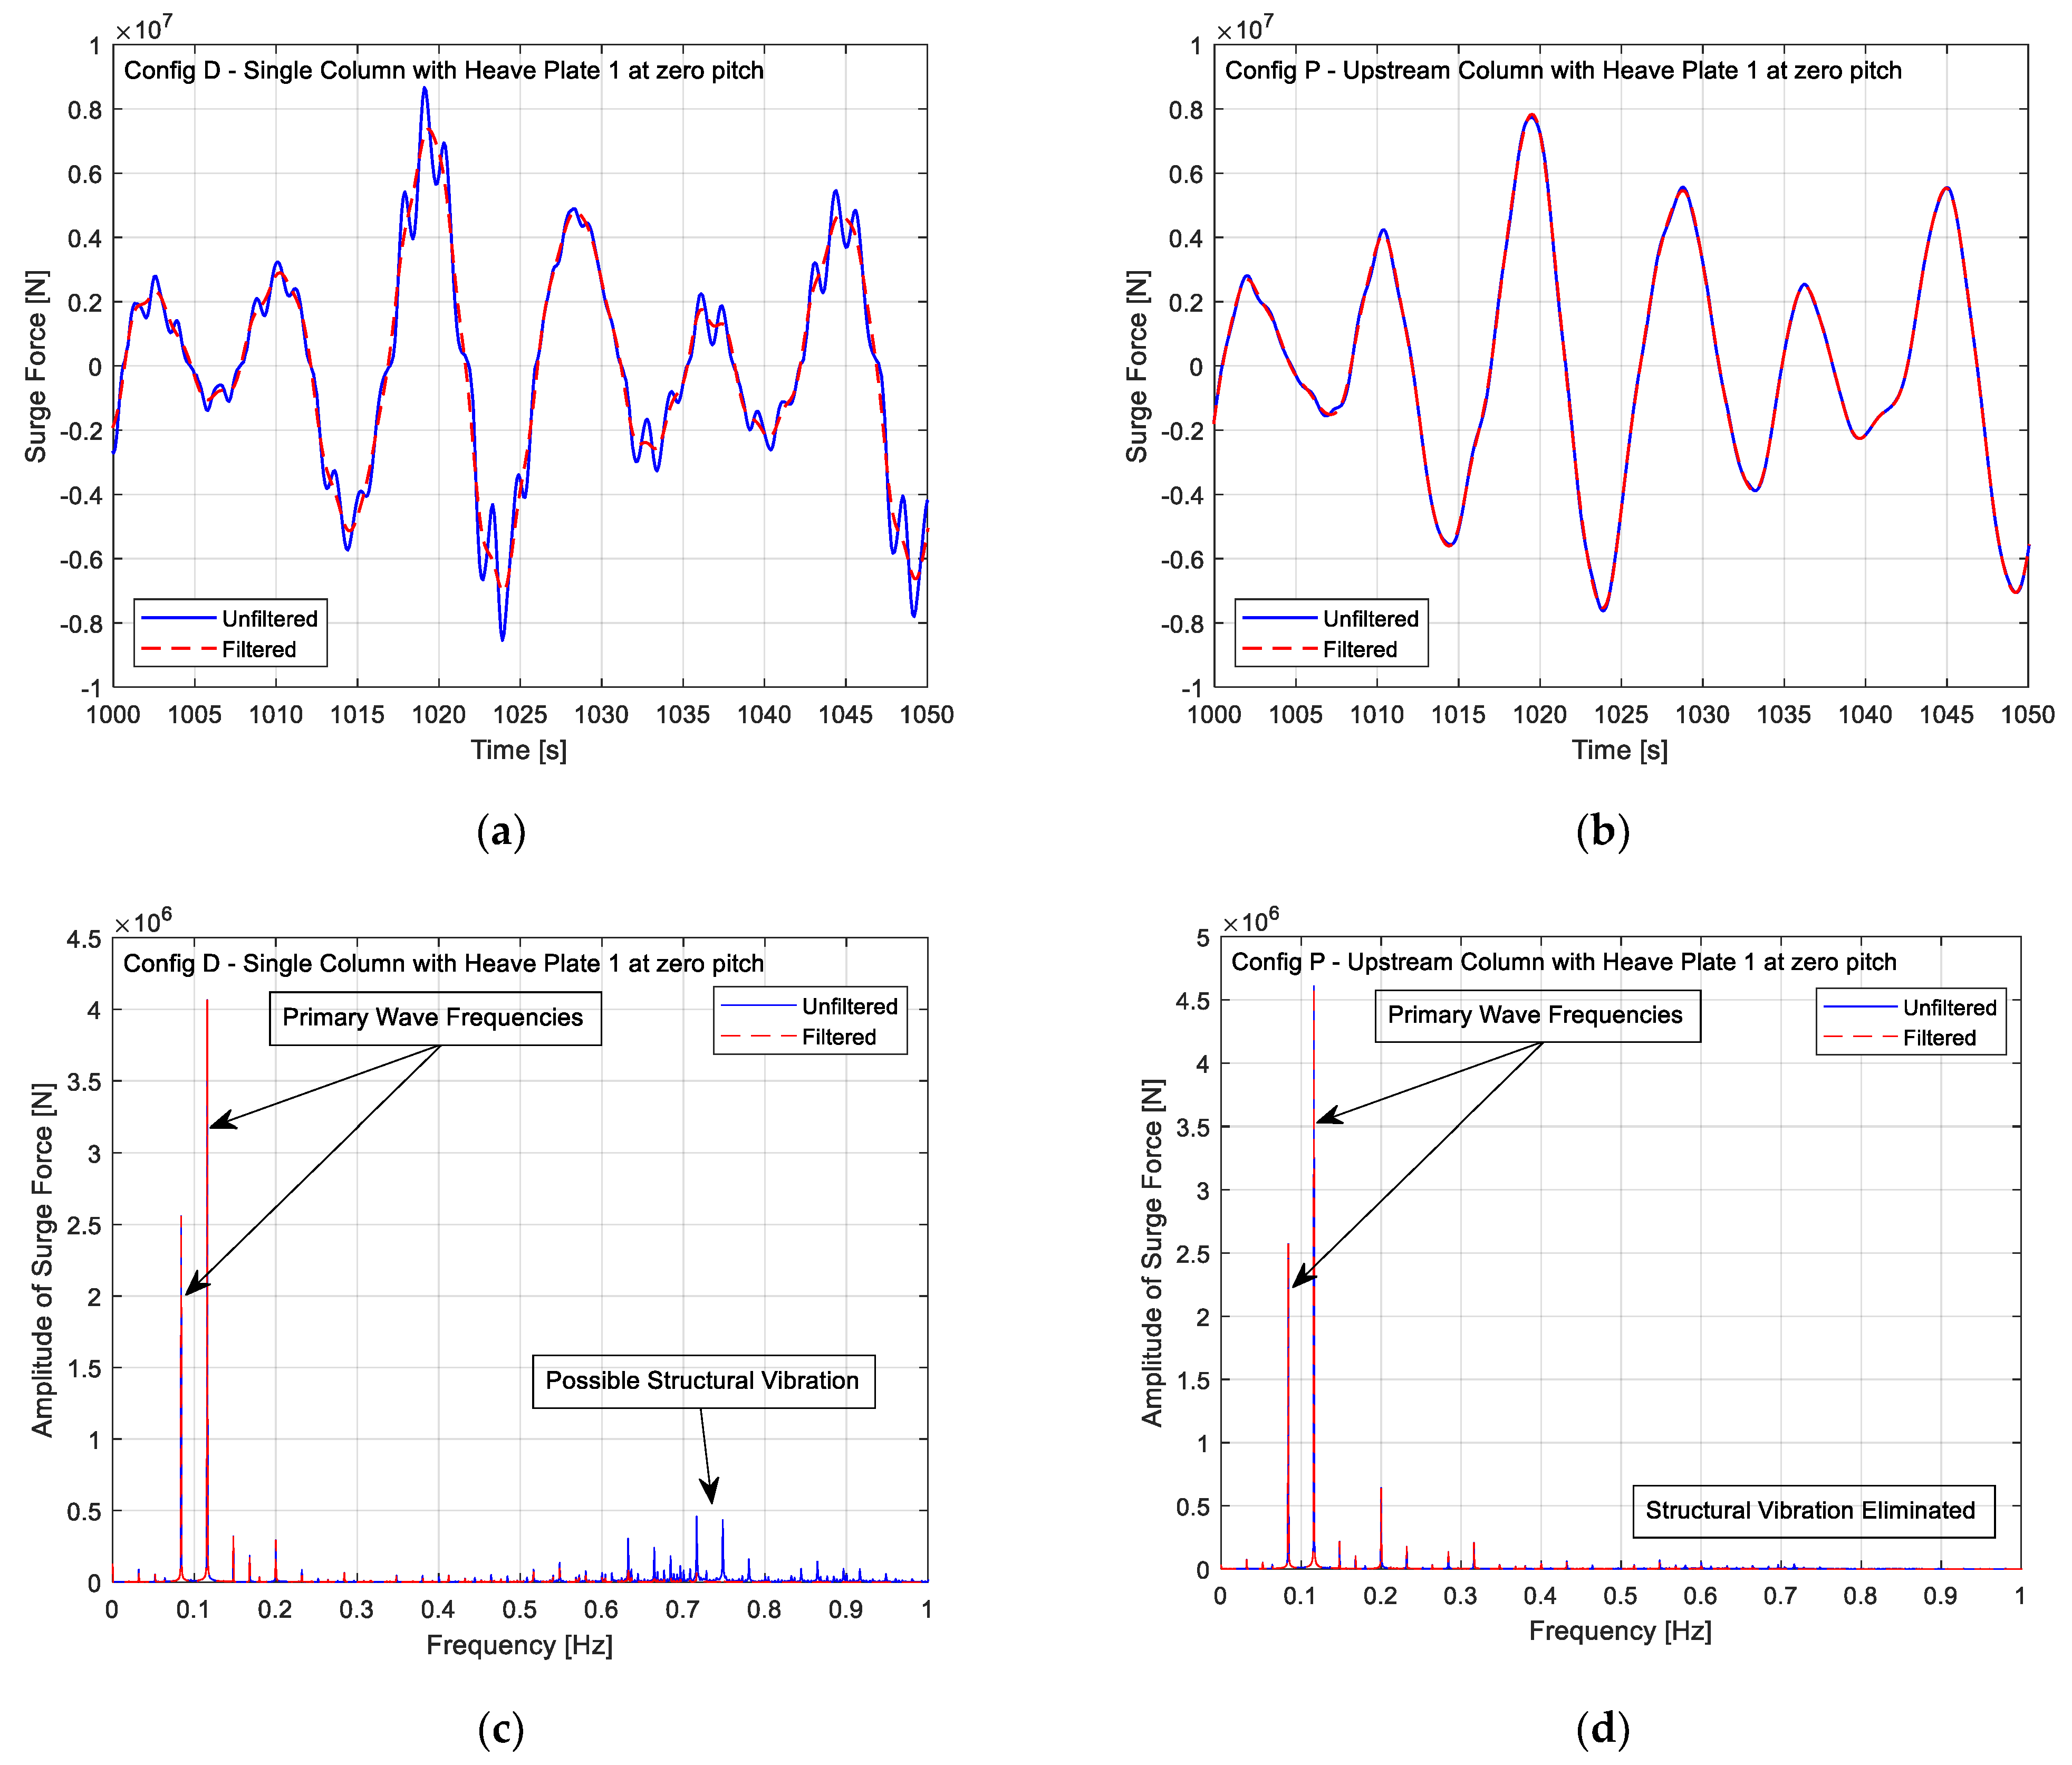
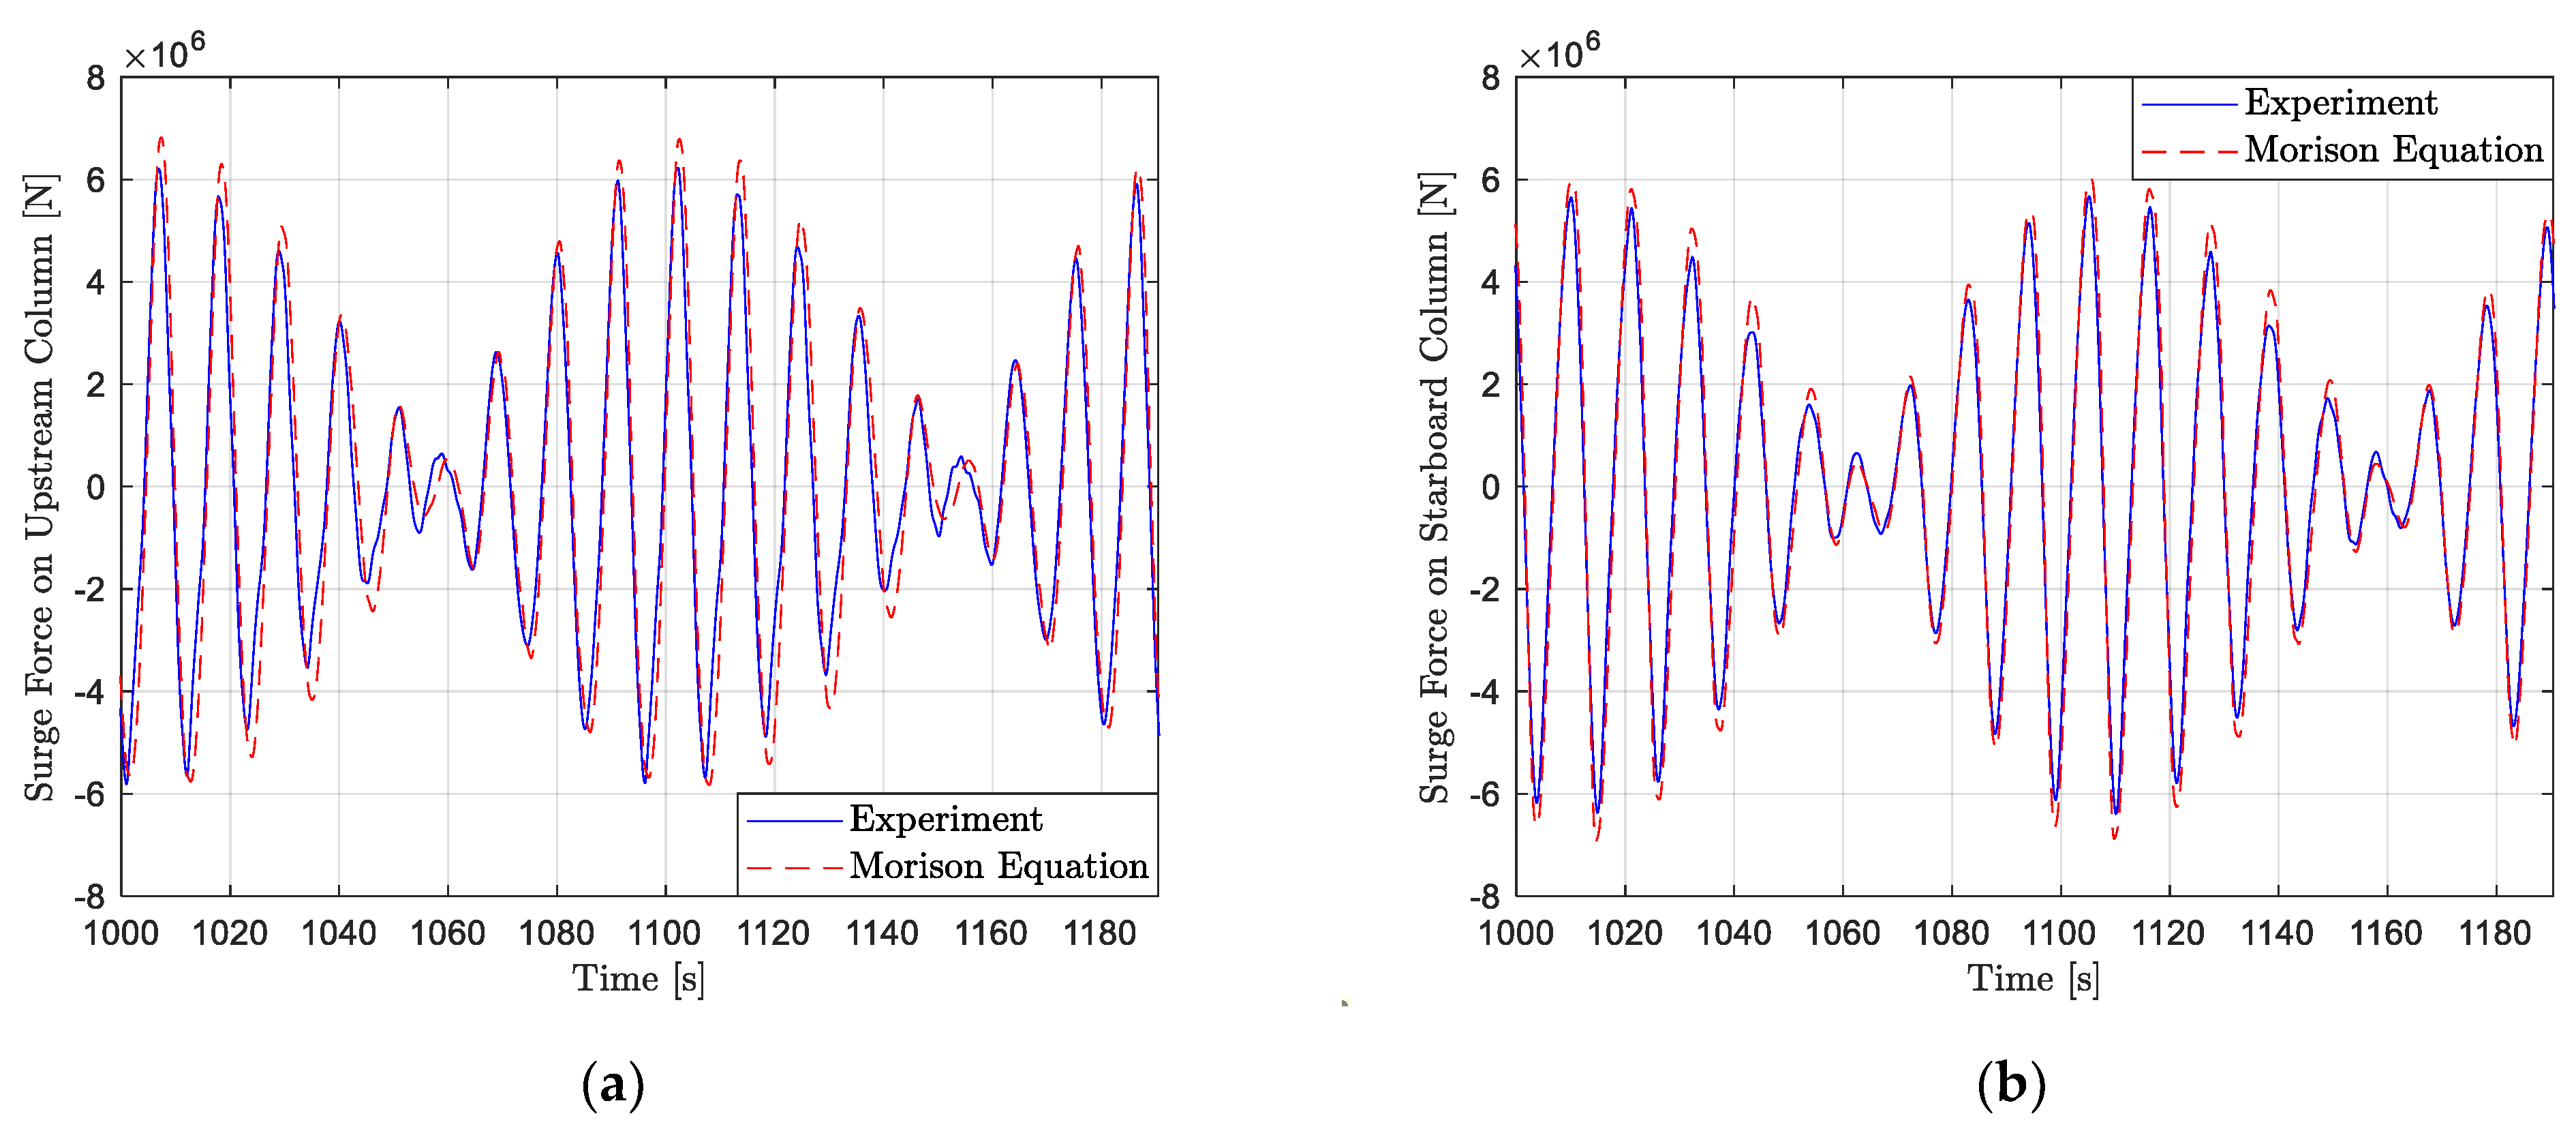
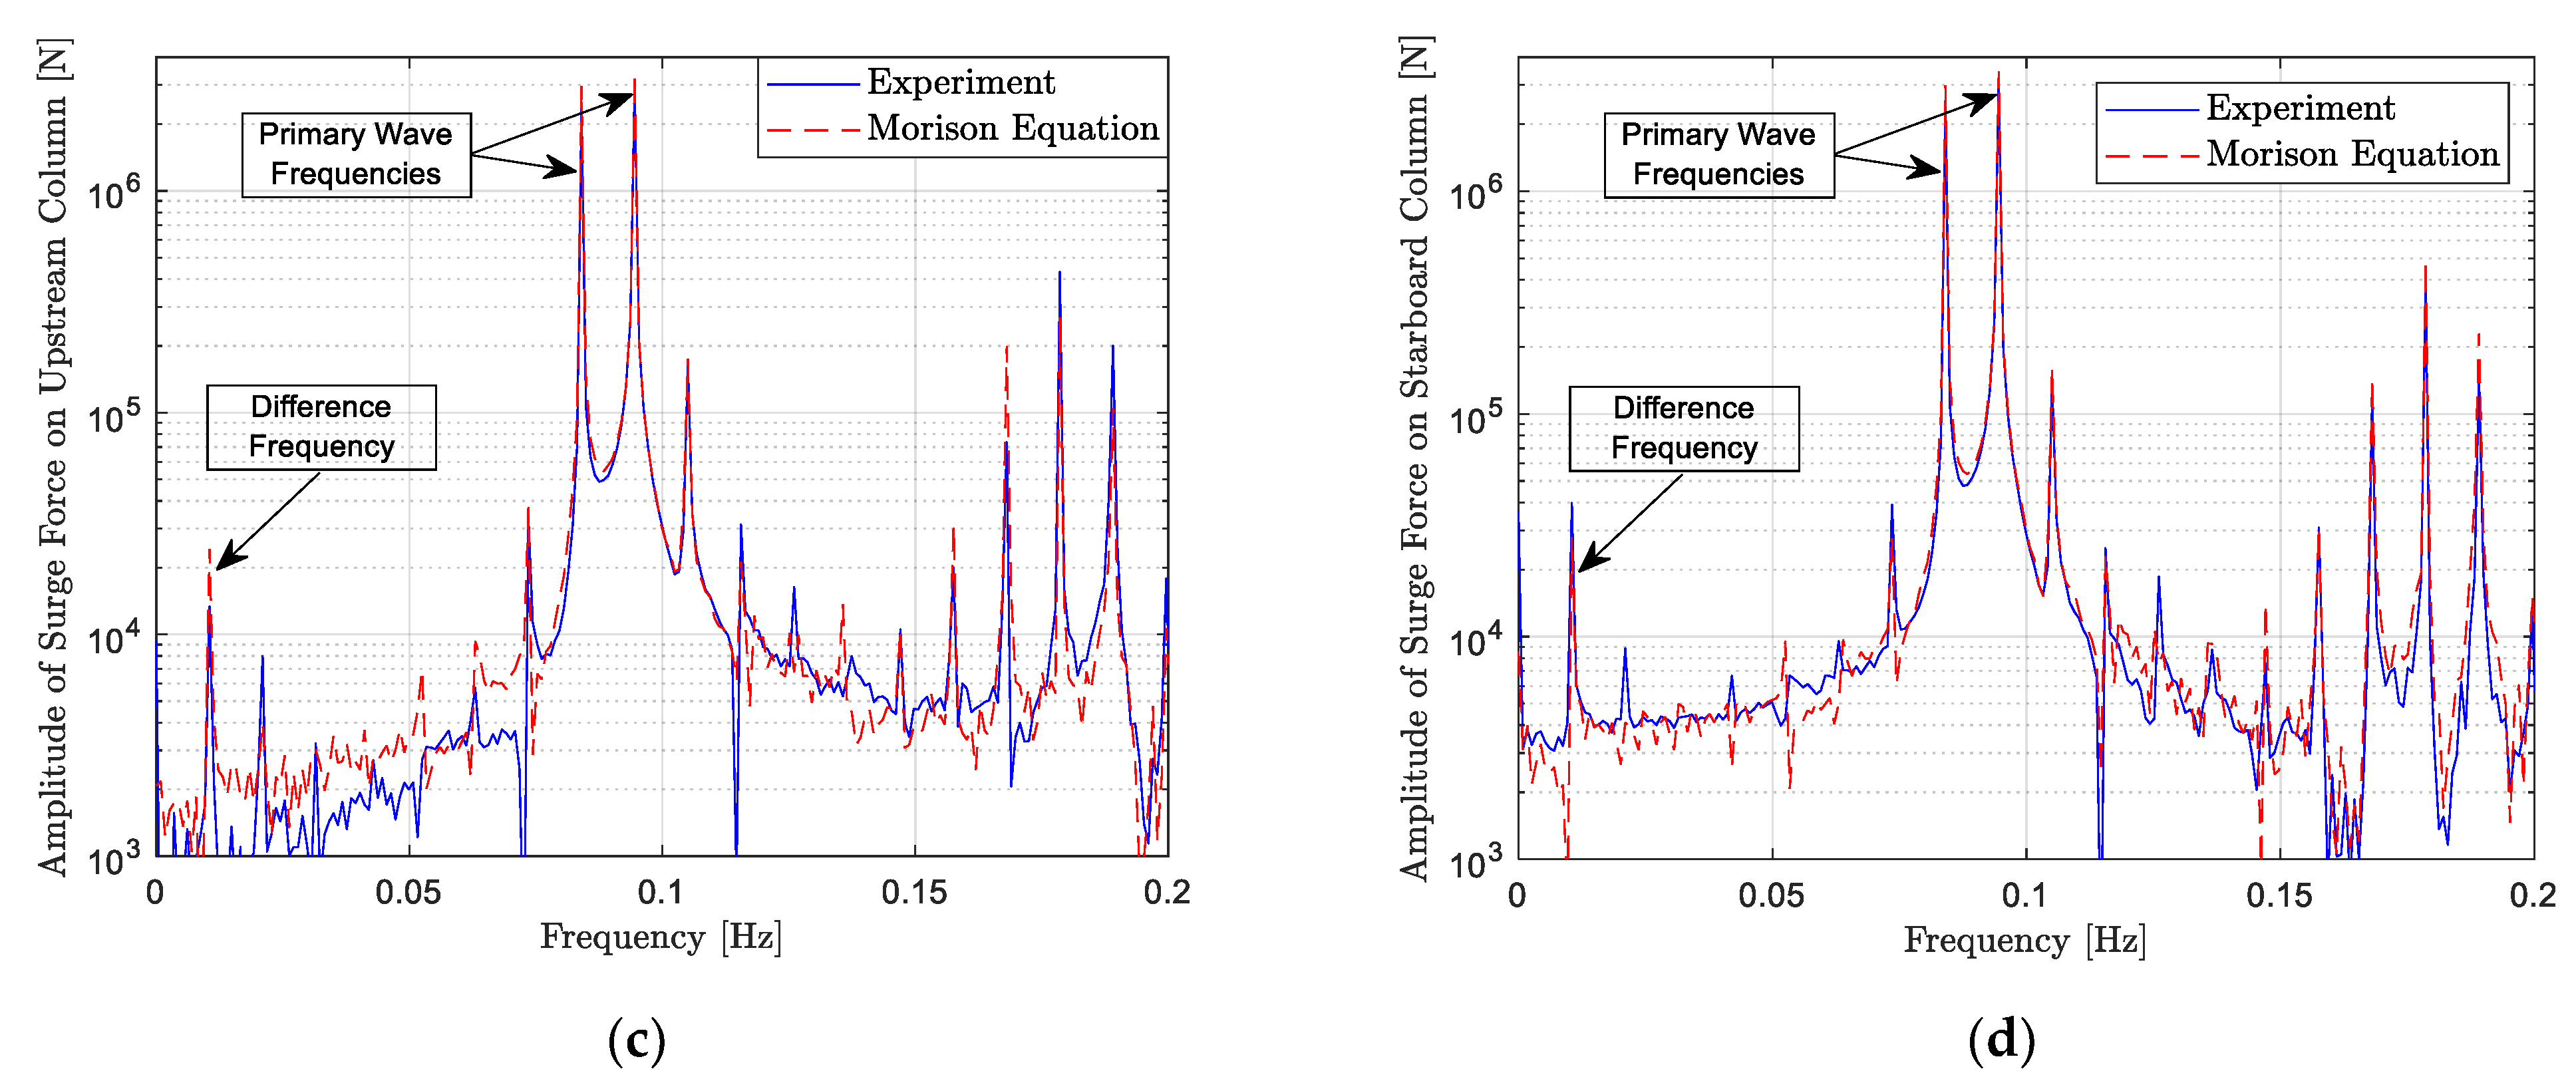
Figure 18, where three repeat measurements of the waves and surge force are show for the irregular wave J1. The excellent comparison exemplifies the low random uncertainty in the experimental campaign.
Therefore, the primary focus of the uncertainty assessment was on the impact of wave uncertainty on the load measurement. This includes the uncertainties in the wave measurements dictated by the performance and installation of the wave probes, but also the contributions from spurious wave components present in the basin.
Wang et al. [7] performed a thorough assessment of the wave-load uncertainty for the bichromatic-wave cases. The uncertainty level was calculated separately for each bichromatic-wave case for the three-column configurations P/N and for the load magnitudes in surge and pitch at the two primary wave frequencies as well as at the difference frequency, which is the focus of the validation study. At the two primary wave frequencies of the bichromatic waves, the possible presence of small, reflected waves from the downstream elliptical beach simultaneously affected the measurements of the waves and the wave loads. At the difference frequency, small, spurious free waves might also have been present because of imperfect wave generation caused by the mismatch between the wavemaker paddle motion and the exact wave-field velocity of nonlinear bichromatic waves [33]. The free waves, while small, can lead to nonnegligible contamination of the equally small difference-frequency nonlinear wave loads, an issue first identified in the CFD analysis of OC6 Phase Ib on bichromatic waves [38,39]. The errors from these spurious wave components that might have been present in the basin were estimated from a wave-splitting analysis based on the wave measurements taken at multiple locations along the length of the basin during wave calibration, and corresponding uncertainties in the final normalized wave loads were developed. Note that the errors and uncertainties caused by the reflection of the model diffracted waves coming from the side basin walls and the wavemaker were not included in the uncertainty analysis for CFD validation. This is because the exact width of the basin and the distance from the structure to the wavemaker were replicated in the CFD simulations [7].
The uncertainty levels in the combined wave loads on all three columns (see Table 7 in [7]) are low for some cases and higher for others, ranging from 5% to 25%. Higher uncertainties in the wave loads (around 20%) were found for bichromatic waves B2 and B5, which involves wave components with periods close to 9.6 s and 7.4 s full scale. Interestingly, higher systematic uncertainties in the wave measurements were also found for these wave components, which might be related to the increased spatial variability of the wave field in the basin. The higher uncertainties in the incident waves contribute to the final uncertainties in the normalized wave loads. The increased uncertainties for these wave components might be related to the wavelengths and the specific dimensions of the basin; however, the exact cause has not been determined definitively. The uncertainty in the normalized wave loads with bichromatic waves B1, B3, and B4 is generally around 10%, except for the difference-frequency surge force for wave B4, which has a higher uncertainty of 20%, partly because of the smallness of the difference-frequency loads in this case. Based on the estimated level of experimental uncertainty, the overall quality of the experimental results is deemed adequate for meaningful validation of numerical predictions.

8. Discussion and Conclusions

This paper summarizes a new validation campaign conducted under the OC6 Phase Ib project, focused on the nonlinear hydrodynamic loading on the components of a generic floating wind semisubmersible platform in a fixed condition. As first identified in the OC5 project, industry tools used to model the behavior of floating semisubmersibles underpredict the loading of these designs, especially at the low frequencies where difference-frequency, nonlinear hydrodynamic loading dominates. The OC6 Phase I project seeks to better understand the cause of this underprediction. In Phase Ia of the project, two experimental campaigns were run to examine whether uncertainty in the experiment contributed significantly to this underprediction, and then to break apart the loading components. Validation work using these experiments was able to identify sources of load underprediction but did not provide the detailed measurements needed to understand the physical phenomena driving the underprediction.
This new OC6 Phase Ib campaign builds on the previous validation campaigns of the OC5 and OC6 projects (see [1,4]) in an effort to better understand the physics of the low-frequency load underprediction. The focus is a fixed condition under wave loading examining the wave excitation, which was found to be the source of the largest discrepancies in load predictions in OC6 Phase Ia [4]. Components of the DeepCwind semisubmersible geometry were used with similar regular and irregular wave conditions, so that measurements from this campaign can be directly compared to past work in the previous projects. Tests were run across a variety of model configurations, building up complexity from simple cylinders to cylinders with heave plates, and then with multiple cylinders with heave plates in proximity. Wave cases were also run with increasing complexity from simple regular-wave cases to bichromatic waves, and finally to irregular wave conditions, with the regular waves matching the peak frequency of the irregular waves and the two main frequencies of the bichromatic waves.
The unique characteristics of this campaign are intended to provide the additional information needed to interrogate the low-frequency behavior of floating semisubmersibles. First, components of the DeepCwind semisubmersible were tested in isolation, and then combined with other members. This approach provides the measurements needed to understand how attached and adjacent members in the semisubmersible affect the loading behavior. Because many engineering models do not directly capture this influence, it is important to understand the impact and the need to address it in the modeling approach. In addition, the semisubmersible design was tested at a neutral position, as well as one offset in the pitch direction, to represent operational wind conditions. These measurements will help elucidate how the wave loading changes as the floating wind platform changes in orientation relative to the waves and improve the ability of models to capture this change.
Previous experiments focused only on the global hydrodynamic loading integrated across the entire structure, which limited more detailed investigations. In this new campaign, load measurements were made for each individual column along with distributed pressure measurements across the heave plate and near the waterline. Additionally, the wave run-up was recorded using a nearby wave probe, and video was taken to capture the behavior as well. These detailed measurements are most valuable for validating CFD models but can also be used to understand how to better tune engineering models. A validated CFD model may then, in turn, be used to perform further investigation into where the engineering models lack accuracy.
Finally, this new experimental campaign employs bichromatic waves in addition to the regular and irregular waves examined in previous projects. Bichromatic waves provide a means for a direct validation of the quadratic transfer functions, which are the main source of the low-frequency loading in the engineering models. They can also be performed over a shorter time frame and can be made repeatable, which makes CFD validation of the low-frequency loading much more feasible. The large computational time for CFD simulations makes irregular wave simulations difficult, especially when trying to ensure a converged solution. Additionally, trying to replicate an irregular wave field in CFD to enable direct validation is much more difficult than a bichromatic wave, which can be more precisely defined.
The end goal is to have this dataset provide the additional information needed to identify and address the inaccuracies in load predictions of floating semisubmersibles. Investigations using this dataset have already been conducted to validate CFD tools within the OC6 project [7] and to improve the OpenFAST engineering modeling tool [34]. The open access on the DOE DAP (https://a2e.energy.gov/data/oc6/oc6.phase1b; accessed on 24 September 2021) will allow other research groups to perform their own investigations with the present dataset. The methodical identification of sources of inaccuracy in high-fidelity CFD tools and mid-fidelity engineering models, enabled by this new dataset, will engender future improvements to the offshore wind design tools. These improvements, in turn, will enable further optimization of floating wind designs, helping to reduce the risk and lower the cost of offshore wind energy.

Author Contributions

Conceptualization, A.R.; methodology, A.R., L.W.; formal analysis, L.W.; investigation, L.W.; data curation, L.W.; writing—original draft preparation, A.R.; writing—review and editing, L.W.; project administration, A.R.; funding acquisition, A.R. All authors have read and agreed to the published version of the manuscript.

Funding

Funding provided by the U.S. Department of Energy Office of Energy Efficiency and Renewable Energy Wind Energy Technologies Office.

Institutional Review Board Statement

Not applicable.

Informed Consent Statement

Not applicable.

Data Availability Statement

All data from this validation campaign is open to the public via DOE’s DAP at: https://a2e.energy.gov/data/oc6/oc6.phase1b (accessed on: 24 September 2021).

Acknowledgments

This work was authored in part by the National Renewable Energy Laboratory, operated by Alliance for Sustainable Energy, LLC, for the U.S. Department of Energy under Contract No. DE-AC36-08GO28308. The views expressed in the article do not necessarily represent the views of the DOE or the U.S. Government. The U.S. Government retains and the publisher, by accepting the article for publication, acknowledges that the U.S. Government retains a nonexclusive, paid-up, irrevocable, worldwide license to publish or reproduce the published form of this work, or allow others to do so, for U.S. Government purposes.

Conflicts of Interest

The authors declare no conflict of interest.

References

  1. Robertson, A.N.; Wendt, F.; Jonkman, J.M.; Popko, W.; Dagher, H.; Gueydon, S.; Qvist, J.; Vittori, F.; Azcona, J.; Uzunoglu, E.; et al. OC5 project phase II: Validation of global loads of the DeepCwind floating semisubmersible wind turbine. Energy Procedia 2017, 137, 38–57. [Google Scholar] [CrossRef]
  2. Simos, A.N.; Sparano, J.V.; Aranha, J.A.P.; Matos, V.L.F. 2nd order hydrodynamic effects on resonant heave, pitch and roll motions of a large-volume semi-submersible platform. In Proceedings of the ASME 2008 27th International Conference on Offshore Mechanics and Arctic Engineering, Estoril, Portugal, 15–20 June 2008; pp. 229–237. [Google Scholar] [CrossRef]
  3. Bayati, I.; Jonkman, J.; Robertson, A.; Platt, A. The effects of second-order hydrodynamics on a semisubmersible floating offshore wind turbine. J. Phys. Conf. Ser. 2014, 524, 012094. [Google Scholar] [CrossRef] [Green Version]
  4. Robertson, A.N.; Gueydon, S.; Bachynski, E.; Wang, L.; Jonkman, J.; Alarcón, D.; Amet, E.; Beardsell, A.; Bonnet, P.; Boudet, B.; et al. OC6 Phase I: Investigating the underprediction of low-frequency hydrodynamic loads and responses of a floating wind turbine. J. Phys. Conf. Ser. 2020, 1618, 032033. [Google Scholar] [CrossRef]
  5. Fowler, M. 1/50-Scale DeepCwind Semi-Submersible Component Wave Testing; University of Maine: Orono, ME, USA, 2021; Available online: https://a2e.energy.gov/data/oc6/oc6.phase1b (accessed on 24 September 2021).
  6. National Renewable Energy Laboratory. OC6 Phase Ib Component-Level Validation Campaign Preparation of the Final Dataset; U.S. Department of Energy’s Wind Energy Technologies Office: Washington, DC, USA, 2021. Available online: https://a2e.energy.gov/data/oc6/oc6.phase1b (accessed on 24 September 2021).
  7. Wang, L.; Robertson, A.; Jonkman, J.; Yu, Y.-H.; Koop, A.; Borràs Nadal, A.; Li, H.; Bachynski-Polić, E.; Pinguet, R.; Shi, W.; et al. OC6 Phase Ib: Validation of the CFD predictions of difference-frequency wave excitation on an FOWT Semisubmersible. Ocean Eng. 2021. submitted. [Google Scholar]
  8. Tian, X.; Yang, J.; Li, X.; Peng, T. Experimental investigations on the hydrodynamic characteristics of heave plate. In Proceedings of the ASME 2013 32nd International Conference on Ocean, Offshore and Arctic Engineering, Nantes, France, 9–14 June 2013. V005T06A032. [Google Scholar] [CrossRef]
  9. Li, J.; Liu, S.; Zhao, M.; Teng, B. Experimental investigation of the hydrodynamic characteristics of heave plates using forced oscillation. Ocean Eng. 2013, 66, 82–91. [Google Scholar] [CrossRef]
  10. Yang, J.; Tian, X.; Li, X. Hydrodynamic characteristics of an oscillating circular disk under steady in-plane current conditions. Ocean Eng. 2014, 75, 53–63. [Google Scholar] [CrossRef]
  11. An, S.; Faltinsen, O.M. An experimental and numerical study of heave added mass and damping of horizontally submerged and perforated rectangular plates. J. Fluids Struct. 2013, 39, 87–101. [Google Scholar] [CrossRef]
  12. Thiagarajan, K.P.; Troesch, A.W. Effects of appendages and small currents on the hydrodynamic heave damping of TLP columns. J. Offshore Mech. Arct. Eng. 1998, 120, 37–42. [Google Scholar] [CrossRef]
  13. Lopez-Pavon, C.; Souto-Iglesias, A. Hydrodynamic coefficients and pressure loads on heave plates for semi-submersible floating offshore wind turbines: A comparative analysis using large scale models. Renew. Energy 2015, 81, 864–881. [Google Scholar] [CrossRef]
  14. Zhu, L.; Lim, H.-C. Hydrodynamic characteristics of a separated heave plate mounted at a vertical circular cylinder. Ocean Eng. 2017, 131, 213–223. [Google Scholar] [CrossRef]
  15. Antonutti, R.; Peyrard, C.; Johanning, L.; Incecik, A.; Ingram, D. An investigation of the effects of wind-induced inclination of floating wind turbine dynamics: Heave plate excursion. Ocean Eng. 2014, 91, 208–217. [Google Scholar] [CrossRef] [Green Version]
  16. Subbulakshmi, A.; Sundaravadivelu, R. Heave damping of spar platform for offshore wind turbine with heave plate. Ocean Eng. 2016, 121, 24–36. [Google Scholar] [CrossRef]
  17. Robertson, A.; Jonkman, J.; Masciola, M.; Song, H.; Goupee, A.; Coulling, A.; Luan, C. Definition of the Semisubmersible Floating System for Phase II of OC4; National Renewable Energy Laboratory: Golden, CO, USA, 2014. Available online: https://www.nrel.gov/docs/fy14osti/60601.pdf (accessed on 24 September 2021).
  18. Wienke, J.; Oumeraci, H. Breaking wave impact force on a vertical and inclined slender pile—Theoretical and large-scale model investigations. Coast. Eng. 2005, 52, 435–462. [Google Scholar] [CrossRef]
  19. Stansberg, C.T.; Berget, K.; Graczyk, M.; Muthanna, C.; Pakozdi, C. Breaking wave kinematics and resulting slamming pressures on a vertical column. In Proceedings of the ASME 2012 31st International Conference on Ocean, Offshore and Arctic Engineering, Rio de Janeiro, Brazil, 1–6 July 2012; pp. 679–689. [Google Scholar] [CrossRef]
  20. Huang, Z.; Spencer, D.; Oberlies, R.; Watts, G.; Xiao, W. Wave impact experiment of a GBS model in large waves. In Proceedings of the ASME 2017 36th International Conference on Ocean, Offshore and Arctic Engineering, Trondheim, Norway, 25–30 June 2017. V001T01A044. [Google Scholar] [CrossRef]
  21. Kamra, M.M.; Salami, J.A.; Sueyoshi, M.; Hu, C. Experimental study of the interaction of dambreak with a vertical cylinder. J. Fluids Struct. 2019, 86, 185–199. [Google Scholar] [CrossRef]
  22. Ha, Y.-J.; Kim, K.-H.; Nam, B.W.; Hong, S.Y. Experimental investigation for characteristics of wave impact loads on a vertical cylinder in breaking waves. Ocean Eng. 2020, 209, 107470. [Google Scholar] [CrossRef]
  23. Neelamani, S.; Sundar, V.; Vendhan, C.P. Dynamic pressure distribution on a cylinder due to wave diffraction. Ocean Eng. 1989, 16, 343–353. [Google Scholar] [CrossRef]
  24. Aristodemo, F.; Tomasicchio, G.R.; Veltri, P. New model to determine forces at on-bottom slender pipelines. Costal Eng. 2011, 58, 267–280. [Google Scholar] [CrossRef]
  25. Lopez-Pavon, C.; Watai, R.A.; Ruggeri, F.; Simos, A.N.; Souto-Iglesias, A. Influence of wave induced second-order forces in semisubmersible FOWT mooring design. J. Offshore Mech. Arct. Eng. 2015, 137, 031602. [Google Scholar] [CrossRef]
  26. Simos, A.N.; Ruggeri, F.; Watai, R.A.; Souto-Iglesias, A.; Lopez-Pavon, C. Slow-drift of a floating wind turbine: An assessment of frequency-domain methods based on model tests. Renew. Energy 2018, 116, 133–154. [Google Scholar] [CrossRef]
  27. do Carmo, L.H.S.; de Mello, P.C.; Malta, E.B.; Franzini, G.R.; Simos, A.N.; Gonçalves, R.T.; Suzuki, H. Analysis of a FOWT model in bichromatic waves: An investigation on the effect of combined wave-frequency and slow motions on the calibration of drag and inertial force coefficients. In Proceedings of the ASME 2020 39th International Conference on Ocean, Offshore and Arctic Engineering, Fort Lauderdale, FL, USA, 3–7 August 2020. V009T09A047. [Google Scholar] [CrossRef]
  28. Li, H.; Bachynski-Polić, E.E. Analysis of difference-frequency wave loads and quadratic transfer functions on a restrained semi-submersible floating wind turbine. Ocean Eng. 2021, 232, 109165. [Google Scholar] [CrossRef]
  29. Morison, J.R.; O’Brien, M.P.; Johnson, J.W.; Schaaf, S.A. The force exerted by surface waves on piles. J. Pet. Technol. 1950, 2, 149–154. [Google Scholar] [CrossRef]
  30. Jain, A.; Goupee, A.J.; Robertson, A.N.; Kimball, R.W.; Jonkman, J.M.; Swift, A.H.P. FAST code verification of scaling laws for DeepCwind floating wind system. In Proceedings of the Twenty-Second International Offshore and Polar Engineering Conference, Rhodes, Greece, 17–22 June 2012; ISOPE-I-12-032/12424. Available online: https://onepetro.org/ISOPEIOPEC/proceedings-abstract/ISOPE12/All-ISOPE12/ISOPE-I-12-032/12424 (accessed on 24 September 2021).
  31. Tom, N.; Robertson, A.; Jonkman, J.; Wendt, F.; Böhm, M. Bichromatic wave selection for validation of the difference-frequency transfer function for the OC6 validation campaign. In Proceedings of the ASME 2019 2nd International Offshore Wind Technical Conference, St. Julian’s, Malta, 3–6 November 2019. V001T01A022. [Google Scholar] [CrossRef]
  32. Chakrabarti, S.K. Loads and responses. In Handbook of Offshore Engineering; Chakrabarti, S.K., Ed.; Elsevier: London, UK, 2005; Chapter 4; pp. 133–196. [Google Scholar] [CrossRef]
  33. Waals, O.J. On the application of advanced wave analysis in shallow water model testing (wave splitting). In Proceedings of the ASME 2009 28th International Conference on Ocean, Offshore and Arctic Engineering, Honolulu, HI, USA, 31 May–5 June 2009; pp. 415–423. [Google Scholar] [CrossRef]
  34. Wang, L.; Robertson, A.; Jonkman, J.; Yu, Y.-H. OC6 Phase I: Improvements to the OpenFAST prediction of nonlinear, low-frequency responses of an FOWT platform. Renew. Energy 2021. submitted. [Google Scholar]
  35. Jonkman, J.; Robertson, A.; Hayman, G. HydroDyn User’s Guide and Theory Manual; Manuscript in Preparation; National Renewable Energy Laboratory: Golden, CO, USA, 2014. Available online: https://www.nrel.gov/wind/nwtc/assets/downloads/HydroDyn/HydroDyn_Manual.pdf (accessed on 24 September 2021).
  36. Böhm, M.; Robertson, A.; Hübler, C.; Rolfes, R.; Schaumann, P. Optimization-based calibration of hydrodynamic drag coefficients for a semisubmersible platform using experimental data of an irregular sea state. J. Phys. Conf. Ser. 2020, 1669, 012023. [Google Scholar] [CrossRef]
  37. Jentzsch, M.; Schmidt, H.-J.; Woszidlo, R.; Nayeri, C.N.; Paschereit, C.O. Challenges and procedures for experiments with steady and unsteady model velocities in a water towing tank. Exp. Fluids 2021, 62, 74. [Google Scholar] [CrossRef]
  38. Wang, L.; Robertson, A.; Jonkman, J.; Yu, Y.-H. Uncertainty Assessment of CFD Investigation of the Nonlinear Difference-Frequency Wave Loads on a Semisubmersible FOWT Platform. Sustainability 2021, 13, 64. [Google Scholar] [CrossRef]
  39. Wang, L.; Robertson, A.; Jonkman, J.; Yu, Y.-H.; Koop, A.; Borràs Nadal, A.; Li, H.; Shi, W.; Pinguet, R.; Zhou, Y.; et al. Investigation of nonlinear difference-frequency wave excitation on a semisubmersible offshore-wind platform with bichromatic-wave CFD simulations. In Proceedings of the ASME 2021 3rd International Offshore Wind Technical Conference, Boston, MA, USA, 16–17 February 2021. V001T01A009. [Google Scholar] [CrossRef]
Figure 1. Investigation of the nonlinear hydrodynamic loading on floating wind semisubmersibles across the OC5 (https://a2e.energy.gov/projects/oc5 accessed on 24 September 2021) [1] and OC6 (https://a2e.energy.gov/projects/oc6 accessed on 24 September 2021) projects [4,5,6,7]. (Photos for OC5 Phase II and OC6 Phase Ia by Amy Robertson, NREL. Photo for OC6 Phase Ib reproduced with permission from the University of Maine).
Energies 14 06417 g001
Figure 2. View towards the wavemaker in the W2 wave basin at the University of Maine showing the component model. Photo reproduced with permission from Matthew Fowler, 1/50-scale DeepCwind semi-submersible component wave testing [5]; published by the University of Maine, 2021.
Energies 14 06417 g002
Figure 3. Global basin coordinate system and general basin arrangement. The dimension is in model scale. The pitch axis of the model structure is 0.1506 m (model scale) below the still water level (SWL). The position of the model in the basin is not drawn to scale. Illustration adapted with permission from Matthew Fowler, 1/50-scale DeepCwind semi-submersible component wave testing [5]; published by the University of Maine, 2021.
Energies 14 06417 g003
Figure 4. The DeepCwind floating semisubmersible design [17]. Photo adapted with permission from the University of Maine.
Energies 14 06417 g004
Figure 5. Comparison of the models of the semisubmersible floating wind substructure in the OC6 wave-basin experiments. (a) The DeepCwind platform used in the previous OC6 Phase Ia investigation [4]. This complete floater model includes the central main column and the cross-members connecting the columns. The same model geometry was also used in the previous OC5 full-system investigation [1]. Photo by Amy Robertson, NREL. (b) The simplified floater geometry without the central main column and the cross-members used in OC6 Phase Ib (present campaign). The three columns were independently mounted to a triangular frame above. This setup allows the wave loads on the upstream and starboard columns to be measured separately and concurrently using two load cells. A camera recording the wave run-up is visible to the left in (b). Photo adapted with permission from the University of Maine.
Energies 14 06417 g005
Figure 6. Configurations of the physical model included in the OC6 Phase Ib validation campaign. (a) Single-column configurations. (b) Three-column configurations with the upstream column (UC) and starboard column (SC) labeled. The arrows indicate the direction of the incident waves. In (b), configurations N, K, and R are geometrically identical to configurations P, J, and Q, respectively. The only difference is that the column/heave plate with the pressure sensors was located at the UC position with P, J, and Q and at the SC position with N, K, and R.
Energies 14 06417 g006
Figure 7. Three-column configurations showing the column/heave plate with pressure sensors in red. Illustration reproduced with permission from Matthew Fowler, 1/50-scale DeepCwind semi-submersible component wave testing [5]; published by the University of Maine, 2021.
Energies 14 06417 g007
Figure 8. Locations of wave probes during wave calibration in the basin coordinate system (all dimensions in meters at model scale). Drawing adapted with permission from Matthew Fowler, 1/50-scale DeepCwind semi-submersible component wave testing [5]; published by the University of Maine, 2021.
Energies 14 06417 g008
Figure 9. Comparison of wave measurements during wave calibration from the resistance−type probe, Probe H, and the capacitance−type probe, Probe C, of (a) regular wave R1 and (b) bichromatic wave B1. The wave elevation is at full scale.
Energies 14 06417 g009
Figure 10. Experimental measurements. (a) Snapshot of a video recording from the validation campaign showing the three columns with heave plates, the two load cells, and the location of the wave run-up probe next to the upstream column. (b) Close-up view of the column/heave plate combination instrumented with pressure sensors in the UC position with the wave run-up probe. Tubes connecting the pressure taps near the waterline and on top of the heave plate to the pressure sensors can be seen emerging from the opening at the top of the upper column next to the load cell. Photos adapted with permission from the University of Maine.
Energies 14 06417 g010
Figure 11. Coordinate-system convention for the surge force F x , heave force F z , and pitch moment M y in the final dataset [6]. The directions of F x , F z , and M y along with the fixed origin about which M y is computed (highlighted in red) remain the same irrespective of the configuration and column. For single column configurations, the column was always placed at the upstream column position. All dimensions are at full scale.
Energies 14 06417 g011
Figure 12. Comparison of the full−scale surge−force time series (a,b) and amplitude spectra (c,d) before and after filtering out the structural vibration. The measured surge force with the bichromatic wave B1 is shown as an example. Structural vibration tends to be more significant with the single−column configurations such as Configuration D shown in (a,c), whereas measurements from the three−column configurations do not contain significant structural vibration as demonstrated in (b,d) with the upstream column of Configuration P. To have zero phase shift, the low−pass−filtered signals were obtained by first filtering in the forward direction and then in the backward direction with a fifth−order Butterworth filter with a cutoff frequency of 0.6 Hz.
Energies 14 06417 g012
Figure 13. Measured wave surge force on the upstream column (UC) in bichromatic wave B1, showing impact of additional model components and columns on the hydrodynamic loading. The force time histories have been low−pass filtered with a cutoff frequency of 0.6 Hz (full scale) to remove the effect of structural vibration.
Energies 14 06417 g013
Figure 14. Power spectral densities of full-scale (a) surge force and (b) pitch moment on the upstream column of Configuration P in irregular waves J1 and J2.
Energies 14 06417 g014
Figure 15. Comparison of full−scale surge−force time series (a,b) and amplitude spectra (c,d) from the experiment and the Morison equation. The results shown are for Configuration P (three columns with HP1 at zero pitch angle) in bichromatic wave B4. The surge force on the upstream column is shown in (a,c), and that on the starboard column in (b,d).
Energies 14 06417 g015aEnergies 14 06417 g015b
Figure 16. Pressure measurements. (a) shows the locations of the pressure taps (symbols). Example measurements on (b) the upstream column and (c) the starboard column near the waterline are shown for configurations P/N and bichromatic wave B4. In (b,c), the amplitudes of pressure oscillation at the difference frequency from fast Fourier transforms of the pressure time series are shown. The horizontal uncertainty bars are the 95%−confidence random uncertainties estimated from the three repeated trials. All values are at full scale.
Energies 14 06417 g016
Figure 17. Comparison of full−scale wave run−up in the vertical z −direction in front of a single upper column with Heave Plate 1 in bichromatic wave B4. Configuration D has an upright column, and Configuration F has a 5° pitched column.
Energies 14 06417 g017
Figure 18. Repeated measurements with the irregular wave J1 of (a) the incident wave elevation by wave probe H during wave calibration and (b) the surge force on the upstream column (UC) of Configuration P, three upright columns with HP1.
Energies 14 06417 g018
Table 1. Model configurations examined in OC6 Phase Ib.
Model Config.ArticleHeave Plate Height [m]Pitch [deg]Location of Column with Pressure Taps
C1 × Upper Column at UC position-0N/A
D1 × Upper Column + Heave Plate 1 at UC position6.00N/A
E1 × Upper Column + Heave Plate 2 at UC position2.50N/A
F1 × Upper Column + Heave Plate 1 at UC position6.0+5N/A
G1 × Upper Column + Heave Plate 2 at UC position2.5+5N/A
J3 × Upper Column + Heave Plate 22.50UC
K3 × Upper Column + Heave Plate 22.50SC
N3 × Upper Column + Heave Plate 16.00SC
P3 × Upper Column + Heave Plate 16.00UC
Q3 × Upper Column + Heave Plate 16.0+5UC
R3 × Upper Column + Heave Plate 16.0+5SC
No pressure measurement is available for the single-column configurations.
Table 2. Descriptions of all wave conditions (All values at full scale).
IDDescription Wave   Height   H / H s   [ m ] Period [s]Duration [s]
SpecifiedMeasuredSpecifiedMeasured
R1Regular wave 17.07.311.911.81739.4
R2Regular wave 23.53.411.911.81753.5
R3Regular wave 33.53.38.628.581810.1
J1JONSWAP wave 17.06.911.912.011,030.7
J2JONSWAP wave 25.04.911.911.911,030.7
B1Bichromatic wave 13.49 3.513.473.518.6211.908.6011.852545.5
B2Bichromatic wave 22.43 2.542.342.507.389.607.359.572545.5
B3Bichromatic wave 32.60 2.482.612.468.6211.908.6011.852545.5
B4Bichromatic wave 43.63 3.503.473.4710.5811.9010.5411.852545.5
B5Bichromatic wave 52.50 2.562.442.608.749.538.709.492545.5
Table 3. Locations of wave probes during wave calibration and model experiments in the basin coordinate system (model scale).
Wave ProbeWave-Probe TypeWave CalibrationSingle-Column ConfigurationsThree-Column Configurations
x [m] y [m] x [m] y [m] x [m] y [m]
ACapacitance3.942.063.862.013.942.06
BCapacitance6.392.086.372.006.392.08
CCapacitance8.862.078.902.038.862.07
DCapacitance11.372.0911.342.0411.372.09
ECapacitance13.852.1013.862.0513.852.10
FResistance3.88−0.10N/AN/AN/AN/A
GResistance6.35−0.08N/AN/AN/AN/A
HResistance8.89−0.12N/AN/AN/AN/A
IResistance11.35−0.06N/AN/AN/AN/A
JResistance13.81−0.08N/AN/AN/AN/A
Run-UpCapacitanceN/AN/AVaries 0.00Varies 0.00
The run-up wave probe was placed close to the upstream column on the upstream (− x ) side. See [5] for the exact x -offset of the run-up wave probe from the upper column wall for each model configuration.
Table 4. Test matrix referencing all waves tested across the different configurations. The number entries indicate the number of repeats performed for each wave-model combination. The symbol “-“ indicates no experiment was performed.
Model Config.Wave ID
R1R2R3J1J2B1B2B3B4B5
C1--3131122
D2113131122
E1--1111111
F1--1111111
G1--1111111
J3113133333
K3113133333
N3113133333
P3113133333
Q3113133333
R3113133333
Table 5. Experimental measurements included in the OC6 Phase Ib dataset.
HeadersFull-Scale Physical QuantityUnits
TimeTimes
Fx1Surge force on the Upstream Column (UC)N
Fz1Heave force on the UC
My1Pitch moment on the UCN∙m
Fx2Surge force on the Starboard Column (SC)N
Fz2Heave force on the SC
My2Pitch moment on the SCN∙m
RunupWave run-up in front of UCm
WP_A-WP_EWave elevation at reference wave probes A through E
WP_F-WP-JWave elevation at calibration wave probes F through J
UF1-UF6Pressure at taps UF1 through UF6Pa
UA1-UA6Pressure at taps UA1 through UA6
BF2-BF4Pressure at taps BF2 through BF4
BA3-BA4Pressure at taps BA3 through BA4
Publisher’s Note: MDPI stays neutral with regard to jurisdictional claims in published maps and institutional affiliations.

