Abstract
Hybrid microgrids constitute a promising solution for filling the electricity access gap that currently exists in rural areas; however, there is still relatively little information about their reliability and costs based on measured data in real working conditions. This article analyzes data obtained from the operation of a 9 kW hybrid microgrid in the fishermen’s cove of Laguna Grande, Paracas, in the Ica region of Perú, which has been running for 5 years. This microgrid has been equipped with data acquisition systems that measure and register wind speed, solar radiation, temperatures, and all the relevant electric parameters. Battery dynamics considerations are used to determine the depth of discharge in a real-time operative situation. The collected data are used to optimize the design using the specialized software HOMER, incorporating state-of-the-art technology and costs as a possible system upgrade. This work aims to contribute to better understanding the behavior of hybrid rural microgrids using data collected under field conditions, analyzing their reliability, costs, and corresponding sensitivity to battery size as well as solar and wind installed power, as a complement to a majority of studies based on simulations.
1. Introduction
Electricity is still not available to an important fraction of the world population that lives in remote rural communities, seriously affecting their possibilities of development and integration [1]. This is particularly relevant in developing countries where electricity, communication, and other services are absent in many areas that consequently become depressed and often abandoned by migration and centralism. Grid extension can be considered as a solution for this problem, but in many cases, long distances and complex topography make this alternative expensive and not economically viable, as the return of investment is not favorable due to low energy consumption [2]. On the other hand, using diesel or gasoline generators to electrify small remote communities normally produce an intermittent and expensive service that depends on unreliable fuel and spare part supplies, besides the evident air and sound pollution issues [3]. Fortunately, this situation can be overcome thanks to the remarkable technical developments undergone during recent decades in the field of photovoltaics, batteries, power electronics, and other components that allow using local energy resources to supply electricity to remote locations. Particularly, solar–wind hybrid microgrids can offer reliable, sustainable, and competitive electricity using resources that are generally available on these sites [4,5].
Rural hybrid microgrids, which manage solar and wind resources, constitute a valuable alternative to generate and distribute electricity sustainably using local resources. In the literature, there is a relative abundance of papers related to simulations undertaken to optimize the technical and economic performance of microgrids. Some of them apply sophisticated computational algorithms, such as particle swarm optimization (PSO), genetic algorithms (GA), and teaching–learning-based optimization (TLBO), to name only a few [6,7]. Others apply the well-known commercial software HOMER [8,9,10]. These studies provide valuable insights into hybrid microgrids. However, there is still little information about their detailed behavior and dynamics based on measured data taken in real working conditions and its analysis [11,12,13]. One of the few works that reports and closely analyzes measured electrical data obtained from a real working hybrid microgrid is [11], but in this case, no attention is given to meteorological or economical parameters. More recent works study reliability and costs [14]. Other studies focus exclusively on PV systems’ technical performance with measured data [15]. NREL’s performance-monitoring initiative for microgrids in Africa [16] specifically refers to “a limited understanding of the actual performance of operating systems” as the main obstacle for these electrification solutions to thrive in the continent.
This work aims to contribute to that aspect by analyzing the results obtained in the Laguna Grande 9 kW hybrid microgrid that has operated since 2016 and has been instrumented with all the necessary devices to measure and register its electrical parameters in parallel with meteorological data (see Section 2). Furthermore, special attention is given to the battery system as the main cost driver component in both initial installation and daily operation. The statistical behavior of the depth of discharge (DOD) of the battery bank in the daily working cycles of the microgrid determines its life expectancy and, consequently, strongly influences the levelized cost of energy (LCOE) [17]. Obtaining the real DOD on a non-stationary working condition requires that battery dynamics concepts and equations must be applied to compensate for the complex effects of battery current and temperature [18]. Naturally, the statistical behavior of wind and solar resources is of great importance to the overall performance and reliability of the microgrid. Time series obtained from the installed anemometer and pyranometer are analyzed in Section 3 together with electrical behavior to obtain relevant patterns of DOD under working conditions. Microgrid performance and economics are discussed in Section 4. A parametric study is performed to understand the effect of varying the size of the battery bank, PV array, and the number of wind turbines on LCOE and loss-of-load probability (LLP). This is the main contribution of this work. Foreseeing the possibility of a system upgrade, HOMER software is used together with the collected data to optimize the microgrid; the results of this study are shown in Section 5. Section 6 is the conclusion of this study.
Figure 1 illustrates the stages of the research undertaken in the Laguna Grande microgrid as an existing and working system. The first and second stages were described in [19] (depicted in grey). This paper focuses on the third and fourth stages (in black).
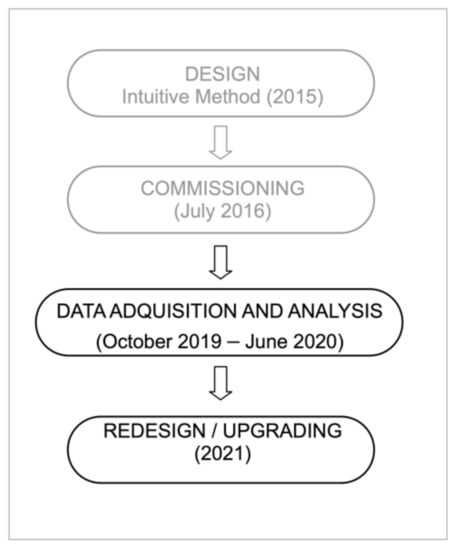
Figure 1.
Flow chart of research sequence.
2. Materials and Methods
2.1. Microgrid Setup
Laguna Grande is a fishermen’s cove located 35 km south of Paracas, Ica (Figure 2). Established in 1973, its population is variable between 50 and 200 people and has scarcely developed with any available services such as electricity and drinking water. Thanks to a grant given by the Interamerican Development Bank (IDB) in 2015, a hybrid microgrid and electric distribution network was installed and commissioned, reaching most of the cove’s houses and small businesses. Special attention was given to the social aspects and management of the microgrid to assure its sustainability. From the first day, the community participated in the process and written agreements, leading to the establishment of a managing committee, energy consumption fee, and service conditions [19]. The design stage was completed at the end of 2015 with a methodology described as “intuitive” in [14], taking into account the uncertainties of projected load estimations and technology available in Perú at that time. The microgrid consists of two 3 kWp photovoltaic arrays, one 3 kW wind turbine, power electronics, and an 800 Ah-48 V battery bank. The microgrid diagram and component specifications are shown in Figure 3 and Table 1, respectively.
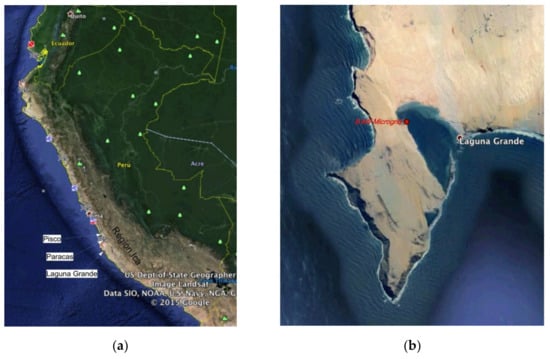
Figure 2.
(a) Coastline of Perú showing the location of the Ica region and Paracas; (b) detail of Laguna Grande and the location of the 9 kW microgrid. (14°08′50″ S, 76°16′06″ W. Reference: Google Earth.)
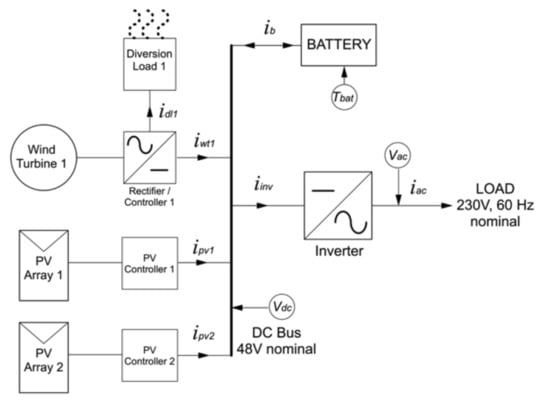
Figure 3.
Scheme of Laguna Grande hybrid microgrid.

Table 1.
Microgrid component specifications.
In order to assess the microgrid’s performance in relation to the meteorological conditions, several variables have to be taken into account and therefore measured and registered. Solar radiation is measured in W/m2 by means of a pyranometer, which is of great importance to quantify the intensity and availability of this resource. Likewise, wind speed is measured in m/s using an anemometer installed near to the turbines but unaffected by them. Precise wind speed measurement is required, especially because wind power has a cubic dependence on it [20]. Wind direction measurements by means of a wind vane are of secondary interest but nevertheless provide information about the stability of the resource. Ambient temperature affects overall performance, particularly of the PV arrays [21] and the battery bank. The temperature of the battery bank is of great importance for its real-time performance and long-term durability [22]; therefore, the measuring layout includes a temperature sensor attached to the batteries. Simultaneously, relevant electric parameters of the microgrid are measured and registered. Battery voltage and current are of paramount importance to calculate DOD. AC voltage indicates if the microgrid is active or if it is down. AC current delivered to load and the corresponding power factor allows calculating power delivered; DC currents coming from the PV and wind turbine controllers allow the corresponding power from these sources to be calculated. Finally, DC current going to the dump loads of the wind turbine controllers indicate excess wind conditions and must be accounted in these events. The voltages and currents measured in the microgrid are shown in Figure 3. The specification of the measuring and registering equipment is given in Table 2 and their layout in Figure 4. An attempt was made to generate a single registering unit for both electrical and meteorological parameters; this proved too time-consuming and was abandoned. The two data loggers are carefully synchronized and operate with identical granularity. Telecom access would be desirable for remote monitoring, but Laguna Grande is far from any cellular network access.
Table 2.
Measuring equipment specifications.
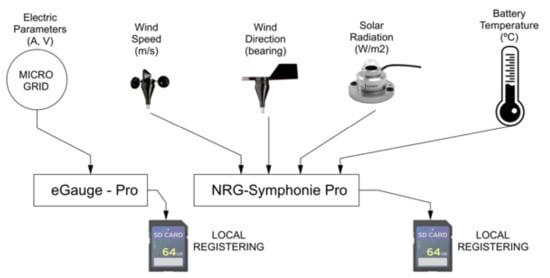
Figure 4.
General setup for data collection and registering.
The physical appearance and location of the microgrid’s battery bank, electronics, and measuring devices are presented in Figure 5. It is important to note (a) the ample and well-ventilated space available for the microgrid equipment in the community building space, which helps to keep the temperature very stable. Laguna Grande is located in a very windy area of the Peruvian coastal desert (b), where frequent dust storms called “Paraca” blow with wind speeds reaching up to 18 m/s. This presents a particular challenge for the wind turbines and their maintenance, as well as for keeping the PV arrays and electronics clean. The loads that are served by the microgrid are mainly lighting installations, TVs, refrigerators, and some freezers. A distribution network of approximately 500 m was laid to reach all the 35 village houses that agreed to take part in the communitarian electrification project by signing a simple contract. This document basically establishes the service conditions and mutual responsibilities as well as the energy cost and a flat monthly membership fee. All service points are equipped with a meter and main switch to allow consumption to be registered and charged by the community administration.
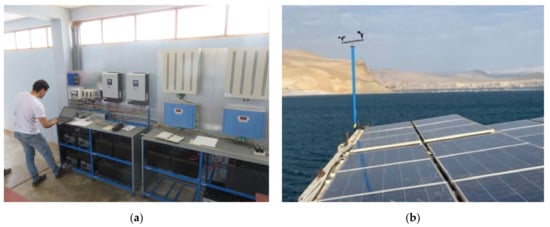
Figure 5.
(a): Overview of the inverters, controls, and battery consoles of the Laguna Grande microgrid, (b): view of the rooftop-mounted PV array with the anemometer and wind vane in the background.
Funds collected are used for maintenance, spares, and battery replacements. It is important to notice that the microgrid was designed assuming a load profile according to an approximate model, resulting in an average of 0.7 kWh/day per service point. In the beginning, this consumption was not achieved; it is rewarding to notice consumption increase each year as a result of community development and a better standard of living, nowadays reaching 0.85 kWh/day. This growth contributes to the economic sustainability of the communal microgrid through an increase in annual revenue.
2.2. Data Treatment
Data were registered from October 2019 to June 2020 (see Figure 1) with the considerations described below.
Granularity: All parameters are sampled every second and registered as an average every 10 min.
Electric measurements: As specified in Figure 3, currents and voltages are measured and registered in several key points of the microgrid, including AC voltage delivered by the inverters, battery voltage, DC battery current, DC inverter current, DC currents coming from the 2 PV arrays, DC current coming from the wind turbine, and AC current delivered to the load. In all the measurements, the 25% quartile, median, and 75% quartile are shown to better characterize the variability of the corresponding parameter.
Temperature: Battery outside wall temperature was measured and registered.
Solar irradiance: Irradiation profiles, total daily radiation, and derived percentiles are analyzed.
Wind data: Wind speed and wind azimuth are measured. Maximum speed or gust is also registered for that period. Data are processed to obtain the hourly wind speed distribution in percentiles. Wind speed daily profile is relevant to be able to support the load during evening and nocturnal peak hours. Similar statistical analysis to solar irradiance is performed.
3. Results and Discussion
Figure 6 presents selected measurements from the Laguna Grande microgrid, starting with the environmental conditions of solar irradiance, wind speed, battery temperature, then the hourly load profile of the Laguna Grande fishermen’s cove.
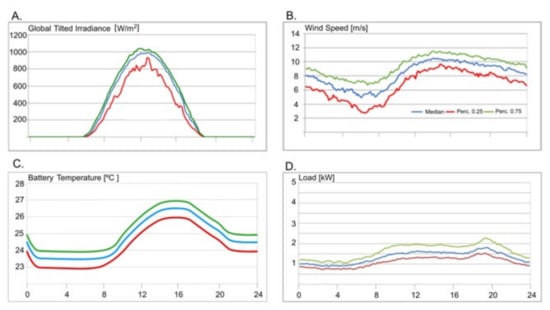
Figure 6.
(A): Hourly profiles of GTI; (B): Hourly profiles of wind speed; (C): Hourly profiles of battery temperature; (D): Hourly profiles of load.
3.1. Solar Irradiance
Figure 6A shows the available global tilted irradiance (GTI) throughout the day. Solar resource is very consistent in Laguna Grande, as seen by the relatively close percentiles. Irradiance is frequently over 1000 W/m2 at noon; however, there are some days with total cloud cover that can cause trouble for the microgrid’s stability.
3.2. Wind Speed
Figure 6B shows the daily wind speed profile in m/s. As it can be seen, the wind resource in Laguna Grande is also consistent and is available at night, which is very valuable to supply power during the load’s peak hours.
3.3. Temperature
The measurements taken are exhibited in Figure 6C, showing that battery temperature is considerably stable, ranging from 23 to 27 °C; this is due to the moderate battery currents and the large, ventilated space available in the control room. Consequently, no temperature effects are considered for battery performance and durability.
3.4. Load Characteristics
Power required by the total village loads is measured by the electrical data logger, together with the power factor and maximum power delivered in that period. Cumulative daily energy delivered is registered together with the availability of the system measured by means of the output voltage. Figure 6D shows the load profile corresponding to the daily electricity demand of the 35 fishermen’s cove power supply points. The daily load profile is substantially consistent, and the presence of a typical peak hour from 6 p.m. to 8 p.m. is evident.
3.5. Potential and Measured Power Generation
Potential generated solar and wind power is compared with measured generated power. Finally, the power balance profile is determined, and, consequently, battery voltage daily profiles are shown in Figure 7. Below is a description of the results and a brief discussion about them.
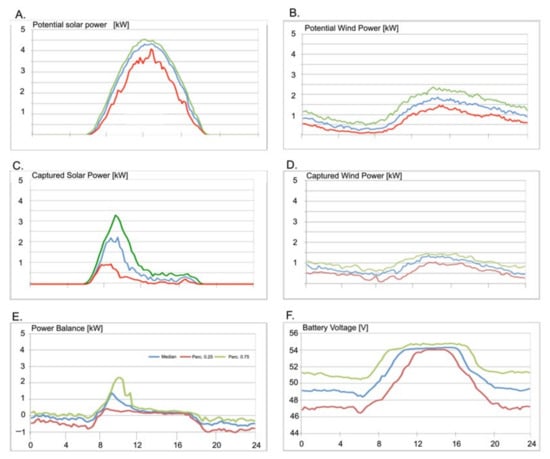
Figure 7.
(A): Hourly profiles of potential solar power; (B): Hourly profiles of potential wind power; (C): Hourly profiles of captured solar power; (D): Hourly profiles of captured wind power; (E): Hourly profiles of power balance; (F): Hourly profiles of battery voltage.
As mentioned above, the wind power available per unit area () is proportional to the cube of the wind speed () [20]
In this manner, the available wind power per unit area in W/m2 is calculated using an air density of 1.23 kg/m3, which corresponds to sea level and a temperature of 25 °C.
The available solar and wind resources can be applied to the corresponding areas of the PV arrays and wind turbines of the Laguna Grande microgrid.
If the corresponding efficiencies and power losses shown in Table 3 are considered, the potential captured power in W can be evaluated [20,21]; thus, net input from the PV arrays and turbines can be written as:
Table 3.
PV and wind turbine performance factors.
From (2) and (3), the potential solar and wind powers are obtained and shown in Figure 7A,B. This can be compared with the actual measured PV and wind turbine powers that are shown in Figure 7C,D, respectively.
Measured PV power differs substantially from the potential solar power that could be captured by the arrays mainly because of the absorption stage being reached in the batteries, which lowers the current as a constant voltage established by the MPPT controllers. The wind turbine taking a more dominant role in battery charging can also cause this effect [11]. Captured wind power is sometimes nearly 35% less than expected from the calculated potential power; this can be caused by several factors, including overestimation of the specified power coefficient () of the wind turbine and generator efficiency or dirty rotor blades but mainly because of competing power input with the PV array. This last cause is evidenced during sunlight hours, as can be seen by comparing Figure 7B,D. Better usage of the installed capacity could be reached by means of demand response by shifting as many loads as possible to midday, but this is not very applicable considering their nature in this case. Another route to enhance energy capture is to increase battery size. This implies higher initial investment and energy costs, as will be discussed in the next section.
From previous results, the measured net power into or out of the battery bank can be obtained by means of the balance between PV and wind turbine combined inputs and output to load consumption, as shown in Figure 7E. By integrating those curves, energy balance is obtained, which shows approximate equilibrium for the median, while the 25% percentile has a deficit of 7.2 kWh/day, and the 75% percentile has a surplus of 6.3 kWh/day. This shows that there is a risk that if two or more low resources days occur consecutively, the battery bank may reach its lower operating voltage, and service will be interrupted.
3.6. Battery Voltage
Figure 7F shows the battery voltage daily profile. Typically, minimum voltages are reached between 4 and 6 a.m., after the battery has been supplying energy to the system during the night. In fact, the collected time series show that most service interruptions occur during that period. In turn, maximum voltages are observed between 10 a.m. and 4 p.m., when the power from the PV array and wind turbine has been captured.
3.7. Battery Status
Batteries are electrochemical devices that exhibit complex behavior due to several overlapping internal phenomena such as polarization, ion solvation and transport, double layer effects, and diffusion [23,24]. A system’s approach to battery behavior considers battery electric current and ambient temperature as input signals, battery open-circuit voltage, battery temperature , battery internal resistance, and battery state of charge (SOC) and state of health (SOH) as output signals [25]. It is important to note that voltage measurements are undertaken in a working condition where there are currents being drained or supplied to the battery, so these must be taken into account to obtain a better approximation to the real DOD. The statistics of the DOD are determinant to the life expectancy of the battery bank and, as mentioned above, to the microgrid economics and reliability as a whole [26]. The relation between measured voltage, battery capacity, working current, and temperature has been extensively studied for lead–acid batteries [27,28], obtaining the empirical Equations (4)–(6) for the discharge and charge stages of single 2V cells:
In (4) and (5), is the battery voltage in the discharge stage; is the battery voltage in the charge stage, before overcharge; I is the battery current; is the 10 h rated capacity from the datasheet of the battery; and . In (4) and (5), the first term relates to the electrolyte concentration, while the second is to the internal resistance variation. Using this set of equations and accounting for the fact that in a 48V system, 24 units of 2V cells are used in series, the DOD is derived in Section 4 with a good approximation for real-time working conditions. This is particularly analyzed during critical early morning hours when the battery bank is in discharge, and the highest values of DOD are reached.
4. Microgrid Performance and Economic Analysis
This section presents the performance and economic analysis of the Laguna Grande microgrid. The reliability, investment, and energy costs reached by using measured data and battery dynamics are analyzed. This analysis is one of the main contributions of this study (see the third stage of Figure 1).
4.1. DOD Frequency Distribution
As mentioned above, the technical and economic performance of the microgrid depends heavily on the battery bank behavior, and this, in turn, depends strongly on the DOD to which it is subjected. According to the registered data, the highest DOD occurs early in the morning, and its frequency distribution determines the expected lifetime of the bank in terms of daily charge–discharge cycles. According to the manufacturer’s specifications, battery duration is considered when a SOH of 60% is reached as a function of the number of charge–discharge cycles at a certain DOD. This is shown in Figure 8 for VRLA-GEL batteries installed in the microgrid. Additionally, VRLA-AGM (absorbent glass mat) and Lithium-Ion LiFePO4 (Lithium Iron Phosphate) technologies are included for comparison.
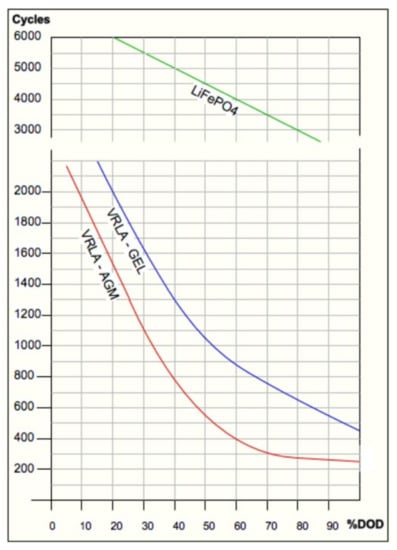
Figure 8.
Battery duration to 60% SOH in charge–discharge cycles for different DOD and technologies.
To determine the approximate DOD in a working condition with a measured battery voltage in discharge , Equations (4) and (6) are used, considering the discharge current at that time on each of the eight groups of four batteries in strings composed of 24 2V cells. It is important to point out that the voltage vs. DOD behavior of a sample VRLA-GEL battery unit was validated in discharge tests under laboratory conditions. This is shown in Figure 9.
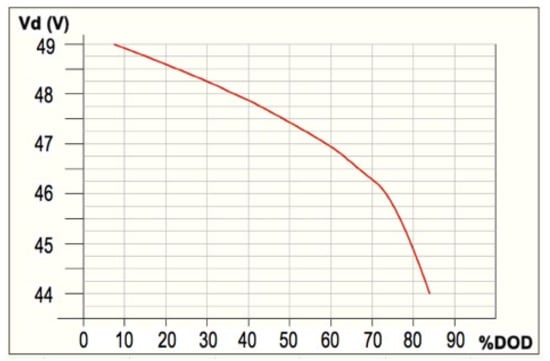
Figure 9.
Battery bank voltage measured in discharge and corresponding DOD.
Battery voltage time series are examined to determine the frequency distribution of the calculated DOD in percentile increments of 10% and translated into the corresponding expected duration in cycles. This is shown in Figure 10, resulting in an average estimated lifetime of 1230 cycles, equivalent to 3.37 years considering daily charge–discharge cycles. With this battery duration, five battery bank renewals will be required during the 20-year lifetime of the microgrid. This result follows reasonably well what has been verified as an average experience running the microgrid for 5 years, being aware of the complex behavior that batteries can show, failing prematurely or occasionally lasting more than expected.
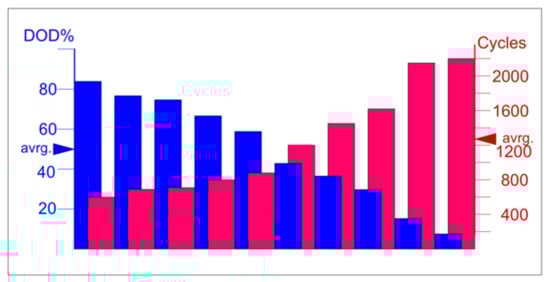
Figure 10.
Frequency distribution of DOD and corresponding expected battery duration in cycles.
4.2. Loss of Load Probability
This is an especially important performance indicator. In this paper, it is defined as:
where is the time duration of instances where the load is not attended by the system, and is the total time of measurement [18].
LLP directly affects the quality of the microgrid’s service to the community. Naturally, it also affects the cost of electricity, as there is no consumption during power outages, so delivered energy will be affected, and consequently, revenues will be lower. The availability of nocturnal wind power allows the loads to be supported during peak hours. If wind is absent and nocturnal demand is high, the battery voltage may drop below the allowed minimum of 43 V before dawn. At this point, the inverters will stop working, causing a power outage until the PV input is activated again.
Battery size is determinant with respect to LLP [29,30], with behavior as shown in Figure 11A. The time series shows that not all power outages are caused by a low battery condition; often, an overload or user mishandling can be the cause. In the case of the Laguna Grande microgrid, with its 38.4 kWh battery bank, approximately 7.2% of LLP is determined by low battery conditions.
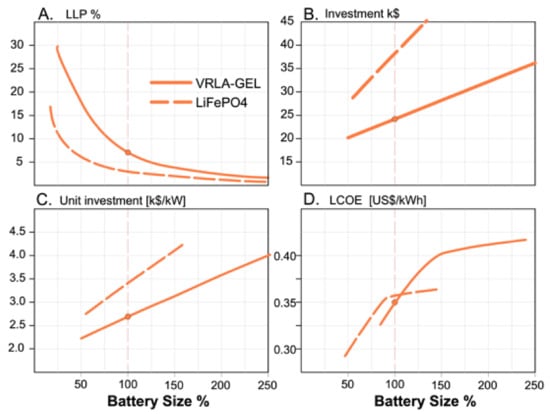
Figure 11.
(A): LLP for varying battery bank sizes; (B): Investment for varying battery bank sizes; (C): Unit investment for varying battery bank sizes; (D): LCOE for varying battery bank sizes (present situation is shown with a dot). Solid line is for VRLA-GEL; dashed line is the projected behavior for LiFePO4 technology.
4.3. Initial Investment and Levelized Cost of Energy
The economic aspects of a microgrid are of great importance to its success and competitive advantage with respect to other solutions for rural electrification, as diesel generator sets and grid extension. In this subsection, a sensitivity analysis is performed for LLP, investment, and LCOE with varying battery bank sizes [31]. A larger battery bank will be convenient to enhance the capture of the available solar and wind power, as shown in Figure 7A,B compared to the present performance in Figure 7C,D; it is also convenient to lower the LLP, as already referred. This is shown in Figure 11A. However, upsizing the battery bank naturally leads to an increase in initial investment and unit investment expressed in USD per installed generation power [32], as shown in Figure 11B,C.
LCOE expressed in USD/kWh is calculated for the system total lifetime of 20 years, for which all the relevant costs of commissioning, operation, and maintenance are accounted for and divided by the projected energy delivered to the loads in the same period as follows [33]
where is the initial investment, is the operation and maintenance cost, is fuel costs (null in this case), is the dispatched energy, n is the years of the life cycle of the system, and r is the financial discount rate. The main cost driver is the battery bank’s initial acquisition and periodic renewal according to its estimated duration in charge–discharge cycles. A larger battery is exposed to proportionately lower levels of DOD, leading to longer durability and fewer renewals in the microgrid’s total lifetime. Another benefit of a larger battery bank is the lower LLP that, besides evidencing a better service, contributes to delivering more energy to the loads and reducing costs. However, these positive effects do not compensate for the larger initial cost and renewals of a bigger battery bank, even if these are less frequent. Thus, LCOE increases with battery size, as shown in Figure 11D.
4.4. Projected Behavior with Varying Installed Generation Power
As seen in the previous subsection, there is a strong dependence on performance and economic indicators with battery size. A compromise solution must be chosen between the opposing effects on LLP and costs. Adjusting installed PV and wind power capacity can also be considered. In this subsection, a sensitivity analysis is performed for LLP, investment, and LCOE with varying sizes of PV arrays and number of wind turbines, considering a fixed demand and VRLA-GEL battery bank size of 38.4 kWh. This is shown in Figure 12. The PV array is considered to vary from 80% to 220% of its present value (6 kWp) and installed 3 kW wind turbines, from none to three units. Increasing installed power leads to lower values of LLP with a diminishing effect, as shown in Figure 12A. In this case, it is interesting to note the marked contribution of a lower LLP from a single wind turbine that can supply power during peak hours, often in the most critical early morning period. Installing more wind turbines has a positive but diminishing effect. Naturally, investment increases with installed power, and unit investment decreases as battery size is considered fixed, as shown in Figure 12B,C, respectively. LCOE behaves as a result of the combined effects of increasing costs but also increasing delivered energy by means of a lower LLP, as shown in Figure 12D. This is clearly the case when no wind turbine is considered (red line), and LCOE increases dramatically as the PV array is reduced to 80% due to a very large LLP that substantially affects delivered energy. Thus, under a fixed demand and battery size scenario, installing wind turbines clearly improves reliability but, due to the fact that the unit cost of small wind power system is considerably higher than PV systems (in this case 3200 vs. 1950 USD/kW), LCOE increases. As PV technology develops and its costs continue to drop, small wind turbine systems become convenient only in very windy locations as Laguna Grande, with an annual wind speed average above 7 m/s. Considering the above-described behaviors can be valuable in designing new hybrid microgrids for rural electrification projects or upgrading existing ones.
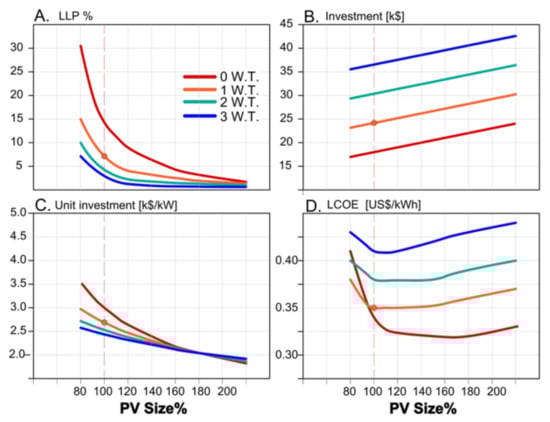
Figure 12.
(A): LLP for varying sizes of PV arrays and number of wind turbines with a fixed demand and VRLA-GEL battery bank size of 38.4 kWh; (B): investment for varying sizes of PV arrays and number of wind turbines with a fixed demand and VRLA-GEL battery bank size of 38.4 kWh; (C): unit investment for varying sizes of PV arrays and number of wind turbines with a fixed demand and VRLA-GEL battery bank size of 38.4 kWh; (D): LCOE for varying sizes of PV arrays and number of wind turbines with a fixed demand and VRLA-GEL battery bank size of 38.4 kWh (present situation is shown with a dot).
5. Design Upgrade
This section explores a re-design of the Laguna Grande microgrid by upgrading its main components (see the last stage shown in Figure 1). Once this microgrid has been in operation for years, this re-design based on good practices and measured data is one of the main contributions of this study.
The measured wind and solar resources, together with the measured load hourly profile of the Laguna Grande microgrid, are used to feed the well-known HOMER optimization software. State-of the-art PV half-cell PERC (passivated emitter rear contact), LiFePO4 storage technology and corresponding costs are incorporated. The results are given as three possible microgrid configurations with their respective outcomes for LLP, LCOE, and investment, as shown in Table 4.
Table 4.
HOMER optimized microgrid configurations compared with present case.
It is remarkable that with LiFePO4 technology, better microgrid performance can be attained with a reduced battery bank size compared to VRLA; this is because HOMER software takes account of the larger currents and DOD that can be managed with this type of battery, as shown in Figure 8. This allows for additional savings in transportation and cabinets, partially compensating for the higher unit costs of LiFePO4. Figure 13 shows the annual profiles of these three cases regarding load and capacity shortage (loss of load) calculated by HOMER. Figure 14 shows the corresponding annual profiles for SOC. The critical winter months from June to August, with low irradiance and lighter winds, are evident in both sets of graphs. It is clear from these results that an eventual microgrid upgrade to Case 1 will bring substantial benefits: with a 12.2% increase in initial investment, only 5.2% in unit investment, LLP is now limited to 3%, and LCOE is lowered from 0.35 to 0.259 USD/kWh. Case 2 uses two wind turbines and considerably less PV, resulting in higher costs compared with Case 1 and LLP of 5%. Case 3, with one wind turbine and less PV, has lower costs, but LLP is inconveniently high at 7.5%. The specifications of this upgraded microgrid are listed in Table 5.
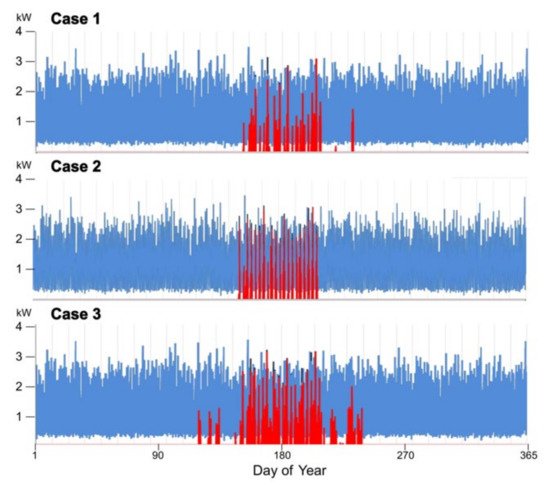
Figure 13.
Annual profiles for load (in blue) and capacity shortage (in red) for HOMER-optimized cases 1, 2, and 3.
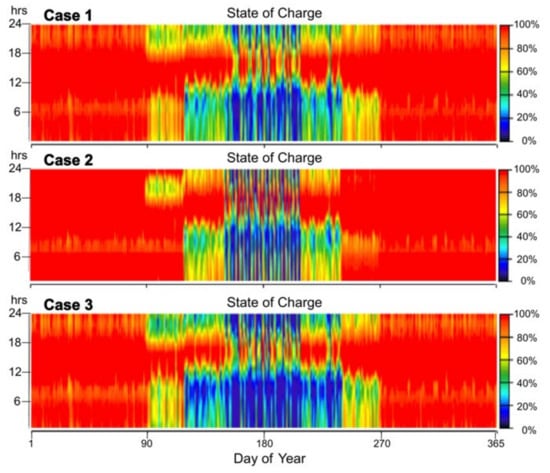
Figure 14.
Annual profiles for SOC for HOMER-optimized cases 1, 2, and 3.
Table 5.
Upgraded microgrid component specifications.
6. Conclusions and Future Work
The Laguna Grande microgrid and the knowledge gained in its design, commissioning, and maintenance are valuable for the consolidation and success of a sustainable solution to the still important fraction of rural communities in remote areas that do not have the benefit of electricity access. Establishing an effective communal management scheme has also been an important learning process. Designing a successful microgrid requires making proper resource assessment and load characterization to select and size all the components adequately, but particularly the main reliability and cost driver: the battery bank. This study reveals how a compromise was reached between reliability (low LLP), initial investment, and LCOE with a 38.4 kWh VRLA-GEL battery bank. In this microgrid, LLP reaches 7.2%, LCOE is 0.35 USD/kWh, and investment is USD 2687 per kW of installed power. A sensitivity analysis was performed to understand the expected behavior of the microgrid by varying the size of the battery bank, PV array size, and the number of installed wind turbines. The reported behavior can be useful for future designs or upgrading existing ones. Optimizing the present microgrid with HOMER software together with state-of-the-art technology and costs shows that clear benefits can be obtained through substantially lower LLP and LCOE with a relatively minor increase in initial investment.
Taking this work as a starting point, future activities include validating the benefits of incorporating Lithium-Ion technology as the new electric energy storage horizon. This technology promises better performance and electricity costs, as it becomes progressively more competitive through research and massive production. Another initiative is to investigate the possibility of reaching higher reliability standards without substantially affecting the LCOE by incorporating low-load diesel technology into the microgrid [34]. Variable diesel generators can contribute to lower LLP without the high costs and maintenance problems that accompany standard backup diesel units in rural microgrids. Further research can be undertaken considering the analysis of parameter uncertainties and robust optimization techniques.
Author Contributions
Conceptualization and investigation, F.C. and R.V.; methodology, formal analysis, visualization, and writing—original draft preparation, F.C.; formal analysis and writing—review and editing, M.C. and J.M. All authors have read and agreed to the published version of the manuscript.
Funding
This research received no external funding.
Institutional Review Board Statement
Not applicable.
Informed Consent Statement
Not applicable.
Data Availability Statement
The data presented in this study are available on request from the corresponding author.
Acknowledgments
The authors want to acknowledge the diligent support of the Laguna Grande community in microgrid maintenance and day-to-day operation.
Conflicts of Interest
The authors declare no conflict of interest.
References
- Access to electricity (% of population)/Data. Available online: https://data.worldbank.org/indicator/EG.ELC.ACCS.ZS (accessed on 24 May 2021).
- López-González, A.; Domenech, B.; Gómez-Hernández, D.; Ferrer-Martí, L. Renewable microgrid projects for autonomous small-scale electrification in Andean countries. Renew. Sustain. Energy Rev. 2017, 79, 1255–1265. [Google Scholar] [CrossRef]
- Kirubi, C.; Jacobson, A.; Kammen, D.M.; Mills, A. Community-Based Electric Micro-Grids Can Contribute to Rural Development: Evidence from Kenya. World Dev. 2009, 37, 1208–1221. [Google Scholar] [CrossRef]
- Global access to electricity has increased over the past two decades—Today in Energy—U.S. Energy Information Administration (EIA). Available online: https://www.eia.gov/todayinenergy/detail.php?id=31552 (accessed on 24 May 2021).
- Hirsch, A.; Parag, Y.; Guerrero, J. Microgrids: A review of technologies, key drivers, and outstanding issues. Renew. Sustain. Energy Rev. 2018, 90, 402–411. [Google Scholar] [CrossRef]
- Gangwar, S.; Bhanja, D.; Biswas, A. Cost, reliability, and sensitivity of a stand-alone hybrid renewable energy system—A case study on a lecture building with low load factor. J. Renew. Sustain. Energy 2015, 7, 013109. [Google Scholar] [CrossRef]
- Sawle, Y.; Gupta, S.C.; Bohre, A.K. A novel methodology for scrutiny of autonomous hybrid renewable energy system. Int. J. Energy Res. 2018, 42, 570–586. [Google Scholar] [CrossRef]
- Olatomiwa, L.; Mekhilef, S.; Huda, A.S.N.; Ohunakin, O.S. Economic evaluation of hybrid energy systems for rural electrification in six geo-political zones of Nigeria. Renew. Energy 2015, 83, 435–446. [Google Scholar] [CrossRef]
- Bahramara, S.; Moghaddam, M.P.; Haghifam, M.R. Optimal planning of hybrid renewable energy systems using HOMER: A review. Renew. Sustain. Energy Rev. 2016, 62, 609–620. [Google Scholar] [CrossRef]
- Esan, A.B.; Agbetuyi, A.F.; Oghorada, O.; Ogbeide, K.; Awelewa, A.A.; Afolabi, A.E. Reliability assessments of an islanded hybrid PV-diesel-battery system for a typical rural community in Nigeria. Heliyon 2019, 5, e01632. [Google Scholar] [CrossRef] [PubMed] [Green Version]
- Louie, H. Operational analysis of hybrid solar/wind microgrids using measured data. Energy Sustain. Dev. 2016, 31, 108–117. [Google Scholar] [CrossRef]
- Louie, H.; Goldsmith, G.; Dauenhauer, P.; Almeida, R.H. Issues and applications of real-time data from off-grid electrical systems. In Proceedings of the 2016 IEEE PES PowerAfrica, Livingstone, Zambia, 28 June–2 July 2016; pp. 88–92. [Google Scholar] [CrossRef] [Green Version]
- Vink, K.; Ankyu, E.; Koyama, M. OPEN Data Descriptor: Multiyear. Scientific Data, February 2019; Volume 6. [Google Scholar]
- Alikhani, P.; Mrad, A.; Louie, H.; Tjernberg, L.B. On the reliability and life cycle cost analyses of small-scale standalone solar systems in rural areas. In Proceedings of the 2021 IEEE Power Energy Society Innovative Smart Grid Technologies Conference (ISGT), Washington, DC, USA, 16–18 February 2021; pp. 1–5. [Google Scholar] [CrossRef]
- Petreuş, D.; Bălan, M.; Pop, O.; Etz, R.; Patărău, T. Evaluation of the PV energy production determined by measurements, simulation and analytical calculations. E3S Web Conf. 2019, 85, 04002. [Google Scholar] [CrossRef]
- Li, X.; Booth, S.S.; Esterly, S.R.; Baring-Gould, E.I.; Clowes, J.; Weston, P.; Shukla, P.; Thacker, J.; Jacquiau-Chamski, A. Performance monitoring of African Micro-Grids: Good practices and operational data. January 2020; NREL/TP--7A40-71767. [Google Scholar] [CrossRef]
- Lotfi, H.; Khodaei, A. Levelized cost of energy calculations for microgrids. In Proceedings of the 2016 IEEE Power and Energy Society General Meeting (PESGM), Boston, MA, USA, 17–21 July 2016; pp. 1–5. [Google Scholar] [CrossRef]
- Jacob, A.S.; Banerjee, R.; Ghosh, P.C. Trade-off between end of life of battery and reliability in a photovoltaic system. J. Energy Storage 2020, 30, 101565. [Google Scholar] [CrossRef]
- Canziani, F.; Vargas, R.; Gastelo-Roque, J.A. Hybrid Photovoltaic-Wind Microgrid With Battery Storage for Rural Electrification: A Case Study in Perú. Front. Energy Res. 2020, 8, 528571. [Google Scholar] [CrossRef]
- Walker, R.P.; Swift, A. Wind Energy Essentials: Societal, Economic, and Environmental Impacts; John Wiley & Sons Inc: Hoboken, NJ, USA, 2015. [Google Scholar] [CrossRef]
- Smets, A.; Jäger, K.; Isabella, O.; van Swaaij, R.; Zeman, M. Solar Energy: The Physics and Engineering of Photovoltaic Conversion, Technologies and Systems; UIT Cambridge Limited: Cambridge, UK, 2016; Available online: https://research.tudelft.nl/en/publications/solar-energy-the-physics-and-engineering-of-photovoltaic-conversi (accessed on 24 May 2021).
- Hutchinson, R. Temperature Effects on Sealed Lead Acid Batteries and Charging Techniques to Prolong Cycle Life; Sandia National Laboratories (SNL): Albuquerque, NM, USA; Livermore, CA, USA, 2004; SAND2004–3149. [Google Scholar] [CrossRef] [Green Version]
- Treptow, R.S. The Lead-Acid Battery: Its Voltage in Theory and in Practice. J. Chem. Educ. 2002, 79, 334. [Google Scholar] [CrossRef]
- Jossen, A. Fundamentals of battery dynamics. J. Power Sources 2006, 154, 530–538. [Google Scholar] [CrossRef]
- Rahn, C.D.; Wang, C.Y. Battery Systems Engineering; John Wiley and Sons: Hoboken, NJ, USA, 2013. [Google Scholar] [CrossRef] [Green Version]
- Ding, Y.; Vijay, D.A.; Neal, D.; McCulloch, M. Predictive Control of Rural Microgrids with Temperature-dependent Battery Degradation Cost. In Proceedings of the 2020 IEEE PES Innovative Smart Grid Technologies Europe (ISGT-Europe), The Hague, The Netherlands, 26–28 October 2020; pp. 509–513. [Google Scholar] [CrossRef]
- Copetti, J.B.; Chenlo, F. Lead/acid batteries for photovoltaic applications. Test results and modeling. J. Power Sources 1994, 47, 109–118. [Google Scholar] [CrossRef]
- Copetti, J.B.; Lorenzo, E.; Chenlo, Y.F. A general battery model for PV system simulation. Prog. Photovolt. Res. Appl. 1993, 1, 283–292. [Google Scholar] [CrossRef]
- Singh, S.S.; Fernandez, E. Method for evaluating battery size based on loss of load probability concept for a remote PV system. In Proceedings of the 2014 6th IEEE Power India International Conference (PIICON), Delhi, India, 5–7 December 2014; pp. 1–5. [Google Scholar] [CrossRef]
- Vega-Garita, V.; Sofyan, M.F.; Narayan, N.; Ramirez-Elizondo, L.; Bauer, P. Energy Management System for the Photovoltaic Battery Integrated Module. Energies 2018, 11, 3371. [Google Scholar] [CrossRef] [Green Version]
- Hanif, S.; Bhattacharya, S.; Bhattacharya, S.; Bhatnagar, D.; Alam, M.j.; Robertson, B.; Preziuso, D.; O’nei, R. Storage requirements for grid integration of marine renewable energy—A parametric study. In Proceedings of the 2021 IEEE PES Innovative Smart Grid Technologies Conf. (ISGT), Washington, DC, USA, 16–18 February 2021; pp. 1–5. [Google Scholar] [CrossRef]
- Lee, M.; Soto, D.; Modi, V. Cost versus reliability sizing strategy for isolated photovoltaic micro-grids in the developing world. Renew. Energy 2014, 69, 16–24. [Google Scholar] [CrossRef]
- Donovan, C.W. (Ed.) Renewable Energy Finance; Elsevier: Amsterdam, The Netherlands, 2020. [Google Scholar] [CrossRef]
- Semshchikov, E.; Negnevitsky, M.; Hamilton, J.; Wang, X. Cost-Efficient Strategy for High Renewable Energy Penetration in Isolated Power Systems. IEEE Trans. Power Syst. 2020, 35, 3719–3728. [Google Scholar] [CrossRef]
Publisher’s Note: MDPI stays neutral with regard to jurisdictional claims in published maps and institutional affiliations. |
© 2021 by the authors. Licensee MDPI, Basel, Switzerland. This article is an open access article distributed under the terms and conditions of the Creative Commons Attribution (CC BY) license (https://creativecommons.org/licenses/by/4.0/).