Article

Costs to Reduce the Human Health Toxicity of Biogas Engine Emissions

1
Department of Industrial Engineering, University of Padova, 35131 Padova, Italy
2
Department of Engineering and Management, University of Padova, 36100 Vicenza, Italy
*
Author to whom correspondence should be addressed.
Energies 2021, 14(19), 6360; https://doi.org/10.3390/en14196360
Submission received: 31 August 2021 / Revised: 25 September 2021 / Accepted: 27 September 2021 / Published: 5 October 2021

Abstract

:
The anaerobic digestion of biodegradable substrates and waste is a well-known process that can be used worldwide to produce a renewable fuel called biogas. At the time of writing, the most widespread way of using biogas is its direct usage in combined heat and power internal combustion engines (CHP-ICEs) to generate electricity and heat. However, the combustion process generates emissions, which in turn have an impact on human health. Therefore, there is a need to: (i) measure the ICE emissions (both regulated and unregulated), (ii) compute the impact on human health, (iii) identify the substances with the highest impact and (iv) calculate the avoided damage to human health per Euro of investment in technology able to abate the specific type of pollutant. To this end, the authors conducted an experimental campaign and selected as a test case a 999 kWel biogas internal combustion engine. Then, the collected data, which included both regulated and unregulated emissions, were used to calculate the harmfulness to human health and identify the more impactful compounds. Thus, combining the results of the impact analysis on human health and the outcomes of a market analysis, the avoided damage to human health per Euro of investment in an abatement technology was computed. In this manner, a single parameter, expressed in DALY €−1, provided clear information on the costs to reduce each disability-adjusted life year (DALY). The impact analysis on human health, which was performed using the Health Impact Assessment, showed that NOx was the main contributor to damage to human health (approximately 91% of the total), followed by SOx (6.5%), volatile organic compounds (1.4%) and CO (0.7%). Starting from these outcomes, the performed investigation showed that the technology that guarantees the maximum damage reduction per unit of cost is the denitrification system or the oxidizing converter, depending on whether the considered plant is already in-operation or newly built. This is an unexpected conclusion considering that the most impacting emission is the NOx.

1. Introduction

Biogas is the result of the natural degradation of organic matter such as animal manure and slurry, sewage sludge, agricultural, industrial and municipal organic waste, energy crops, etc. The conversion process, which is called anaerobic digestion (AD), is performed by micro-organisms under anaerobic conditions in tanks called fermenters or digesters. Anaerobic digestion being a well-known process and organic matter being available everywhere, biogas facilities can be built all around the globe with a nameplate electric power ranging from tens of kilowatts to a couple of megawatts, a fact that makes biogas the chief competitor of natural gas.
In contrast to natural gas, biogas is renewable and can be produced near the utilization site without requiring expensive and dangerous transportation infrastructure. However, contrary to what one might think, biogas is not only composed of methane and carbon dioxide. In fact, as discussed in, e.g., Benato and Macor [1], the CH4 and CO2 content ranges from 47–53% and 41–48%, respectively. The rest are impurities such as nitrogen, oxygen, hydrogen, hydrogen sulphide, ammonia, siloxanes, water, silica, oily mists and particulates. Therefore, before using biogas, it needs to be purified, a process not required for natural gas.
Focusing on biogas utilization, in the developing counties, it is combusted on-site in boilers for heating purposes, while in Europe and the USA, biogas is purified and directly burned in combined heat and power internal combustion engines (CHP-ICEs) to generate electrical energy and heat [2,3,4,5,6,7]. Therefore, considering the feedstocks’ widespread availability, the versatility of its use and the stability and programmability of both heat and electricity production, biogas fuel constitutes a great opportunity for countries that want to (i) reduce fossil fuel dependency, (ii) cut down greenhouse gas emissions, (iii) fight climate change, (iv) enhance the energy content of agricultural, industrial and municipal organic waste and residues, (v) shrink the quantity of household and similar waste sent to landfill, (vi) develop local markets, (vii) spread the distributed generation concept and (viii) encourage sustainable energy communities.
However, despite biogas constituting an attractive renewable energy pathway, its vast spread is a source of concern for both researchers and citizens. The former highlights the potential reduction or even disruption of food supplies, as well as the environmental impact and biodiversity loss linked to land use change [8,9,10,11,12,13,14]. In fact, to support the spread of biogas, governments can establish financial support for farmers that devote their agricultural areas to bioenergy cultivation instead of crops for food. The conversion of arable lands can increase the competition between food and bioenergy, especially in developing countries where food (and even water) shortage is already a serious problem and the cause of malnutrition and premature death. On the other hand, speeding up the growth of energy crops or non-native plants, which implies boosting the yield per hectare and, therefore, the revenue, farmers can be forced into the massive use of pesticides, fertilisers or other chemical substances characterised by a high environmental impact, as well as unknown effects on human health.
The latter is the key concern of citizens, particularly those living near biogas facilities, who are focused on the harmfulness of the emissions released via the internal combustion engine’s stack. In fact, they stress the fact that:
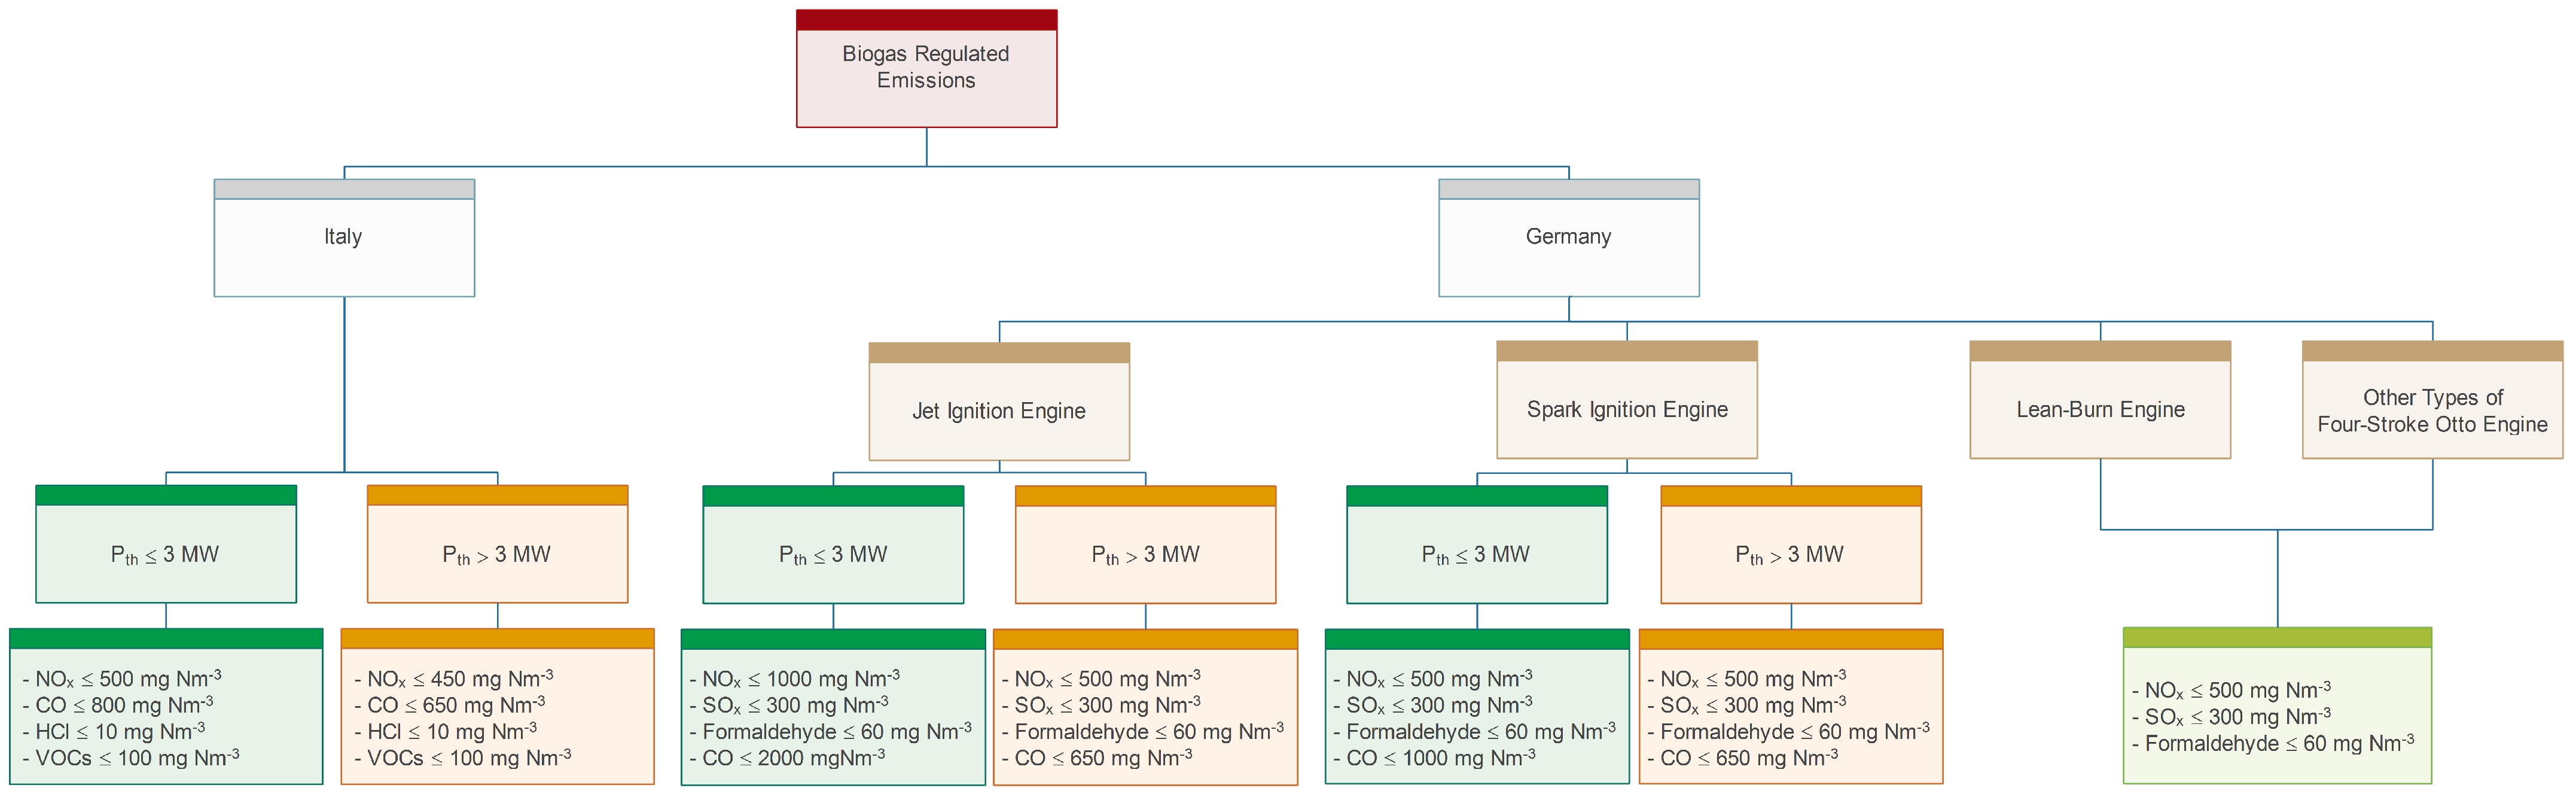
  • There is no common emissions standard, nor a clear distinction among regulated and unregulated emissions;
  • The literature lacks studies in which experimental measurements acquired from in-operation plants are used to compute the impact of the measured pollutants on human health.
The first point raised by citizens is the object of discussion in the scientific community because neither the standards, nor the literature precisely report a definition for both regulated and unregulated emissions. Therefore, it is viable to include a compound among the “regulated emissions” if it is featured in the standard and a maximum value is set as the mandatory limit. On the contrary, “unregulated emissions” are substances not monitored by the standard and without fixed regulatory limits. In the standards of the members of the European Union (EU), nitrogen and sulphur oxides (NOx and SOx), hydrogen chloride (HCl), volatile organic compounds (VOCs), carbon monoxide (CO) and particulate matter (PM) are almost everywhere considered “regulated emissions”, while aldehydes, polycyclic aromatic hydrocarbons (PAHs) and dioxins and furans are always regarded as “unregulated emissions”. However, even inside this common framework, there are many differences among the European standards, because each Member State defines which of the above-mentioned substances must be included among the “regulated emissions” and with which maximum admissible value.
As an example, Figure 1 shows the regulations of Italy [15] and Germany [16,17] for emissions from biogas engines.
The comparison between the two regulations highlights their diversity: the substances included among the regulated ones are different, as well as their limit values, which depend on the size and type of engine. In particular, the German regulation does not monitor VOCs and HCl, as the Italian one does, while it monitors two substances not present in the Italian regulation: SOx and formaldehyde. The latter is a compound known to be a carcinogen in humans. Despite that, usually, it is included among the unregulated emissions. Its inclusion among the regulated substances highlights the will of the country of monitoring the pollutants which are known to be dangerous to human. An aspect that reinforce the need of monitoring both regulated and unregulated emissions and determine their impact on human health. To do that, in this work, the attention is devoted to the Italian framework.
In addition to the forgoing discussion, citizens also point out that the literature lacks studies that experimentally measure the regulated and unregulated emissions of in-operation plants and evaluate the impact on human health. This is a very important issue because, first of all, the vast majority of experimental research on internal combustion engines emissions has been conducted on single-cylinder laboratory-scale ICEs fed by simulated biogas. This fuel is prepared using natural gas or methane and carbon dioxide before being injected into the ICE. Secondly, the measured substances are NOx, CO2, PM and unburned hydrocarbons (UHCs) (see, e.g., [18,19,20,21]) instead of the entire set of regulated and unregulated emissions. To the authors best knowledge, only Kristensen et al. [22], Nielsen et al. [23] and Macor and Benato [24,25] examined both regulated and unregulated emissions. However, contrary to Kristensen et al. [22] and Nielsen et al. [23], Macor and Benato [24,25] focused only on agricultural biogas fed by different feedstocks instead of wastewater treatment biogas units and other renewable-based plants. In addition, Macor and Benato [24,25] examined only plants characterised by the same nameplate ICE power, and after the computation of the damage to human health, they compared the obtained findings on biogas with the ones calculated from measurements acquired in a natural-gas-fired ICE characterised by the same nameplate power. They pointed out that the most harmful substances are NOx. These substances produce approximately 90% of the damage to human health from biogas, as well as natural gas. However, in the case of biogas, the damage generated by NOx is approximately three-times that produced by natural gas. Second place is taken by SOx; these contribute more or less 6% to the total damage from biogas, while in the case of natural gas, the contribution is null. Hence, the research highlights the crucial role of nitrogen and sulphur oxides. However, the latter are not regulated emissions for biogas. Therefore, the suggestion is to include SOx among the regulated emissions with a proper limit, as its contribution to the total damage is non-negligible.
Based on these analyses, it is clear that nitrogen and sulphur oxides are the major sources of harmfulness to human health. However, the knowledge of the damage itself is worthless if it is not used to guide both legislators and technology. In fact, in defining new limits, legislators should take into account the cost of the related abatement device, so as not to impose excessive costs on such an important sector for energy transition, the incentives of which will be reduced or cancelled in the upcoming years. Legislators should impose limits on those emissions, the removal of which brings the greatest benefit at the same cost. The benefit must not be so much the amount of emissions captured as the avoided damage to human health. Therefore, with the aim of taking a step forward, the authors propose a method to link the damage to human health (defined as the disability-adjusted life year (DALY)), to the costs. Using the most modern technologies for pollutant abatement, the avoided damage to human health per Euro of investment is estimated for the most impacting substances. The new parameter, expressed in DALY €−1, provides clear information about the costs that must be borne to reduce each DALY. To foster the novelty of the work, we computed this parameter in two scenarios after (i) measuring the emissions of an in-operation biogas plant and (ii) computing the damage to human health.
To the authors’ best knowledge, no one has proposed a similar approach that is able to directly link the investment cost of an abatement technology to the impact on human health, a point of novelty that can help biogas ICEs be more friendly to human health and, subsequently, more accepted by the citizens.
Note that, at the time of writing, approximately 71% of biogas facilities (12 GW) are located in Europe, while the Americas and Asia rank second and third with 17.7% and 6.6%, respectively [26]. In addition, given that 7.5 GW out of 12 GW of the biogas installed electricity capacity is accommodated in the two densely-populated countries of study (Germany and Italy) [1,24,27]), the proposed investigation is of key importance to reinforce the acceptability of biogas. In addition, this study can be considered a good starting point for both the improvement of the biogas standards and the development of new technologies to abate the most harmful pollutants.
The rest of the manuscript is given as follows. In Section 2, the design characteristics of the biogas facilities are presented, while in Section 3, the methods adopted to perform the experimental measurements, to compute the human health damage and to evaluate the avoided damage to human health per Euro of investment are described. Section 4 presents and discusses the obtained findings, while in Section 5, concluding remarks are given.

2. The Biogas Facility

Since 2016, the authors have been involved in a research project devoted to measuring both regulated and unregulated emissions released by ICEs fed by the biogas produced in agricultural facilities. The monitored plants (over 25) are installed in the northern regions of Italy and are fed with different substrates, but are characterised by the same nameplate power: 0.999 MWel.
The authors, when parsing the Italian biogas sector’s historical evolution, turned their attention to units (i) characterised by a nameplate thermal power of the ICE equal to the most widespread one and (ii) fed by a mix of feedstocks that are different from one another. In this manner, the analysed plants were comparable because the generation units are characterised by the same nameplate electrical power, but the feedstock in the input being different, the comparison of both the biogas’ and the exhaust gases’ compositions can highlight the similarities and discrepancies, an analysis approach not previously adopted in the biogas sector.
As discussed in Benato and Macor [1], in Italy, the most widespread ICE nameplate thermal power and electrical power are 2.459 MW and 0.999 MW, respectively, while the plants’ date of entry into service was before 31 December 2012. All this stems from the fact that respecting both the power and the date deadline, the plant is granted with (i) the highest incentive rate ever established in the EU, 280 € MWh−1, for 15 years, and (ii) dispatching priority for the generated electricity.
The vast majority of biogas ICEs release the exhaust gases into the environment at a temperature higher than 440–450 C, a fact that determines two types of issues:
  • The higher the exhaust gases’ temperature is, the higher the thermal pollution is. Thus, these engines are the source of waste heat. On the market, there are waste heat recovery technologies that can be used to recover the waste heat and to produce (i) thermal energy (e.g., hot water or steam) or (ii) electrical energy. However, the latter is not an applied solution because the additional electricity coming from, e.g., an organic Rankine cycle turbogenerator is added to the ICE one and, then, this leads to exceeding the 999 kWel and losing the generous incentivised tariff.
  • An exhaust gases’ temperature higher than 300 C does not allow measuring some types of emissions due to equipment technical limits.
Among the analysed biogas plants, in the present work, the authors selected a low-thermal-polluting unit. In particular, the ICE being equipped with a waste heat recovery unit, which generates hot water (90 C), the plant results in being a low-thermal-polluting unit, but thanks to the waste heat recovery device, the exhaust gases’ temperature is released at a value lower than 300 C, a temperature that allows measuring the entire set of substances constituting both regulated and unregulated emissions without encountering equipment limitations.
The selected plant is structured as follows:
  • Three earth-banked silos: These structures are made of precast concrete panels, and the plant owner uses them to stock maize silage as a silage pit. The stored quantity of maize silage needs to be enough to cover the daily need (27–28 ton day−1) for a year of operation.
  • One concrete-walled covered structure for solid manure storage: In this storage area, the plant owner stocks chicken manure in a quantity able to feed the biogas plant for at least 10 days. The daily introduced quantity varies from 22–23 ton.
  • One fully sealed underground tank: This storage device is used to store a quantity of pig manure able to cover 15 d of operation considering a plant daily need of 59–61 m3.
  • One preliminary tank (sometimes called a pit): In this storage, the different types of biomass and manure are collected and mixed. Then, the mixture is pumped into the primary fermenter.
  • Two primary and two secondary digesters: In these devices, the anaerobic digestion process takes place, and the biogas fuel is produced and stored at the top (hood) of the fermenter. The biogas is directly collected and stored above the fermenting biomass (digesters’ domes). In the digesters’ ground surface and walls, a heating system is integrated to maintain the anaerobic digestion process at a temperature ranging from 42–44 C. In the heating system, hot water is circulated, which is heated up by the internal combustion engine’s waste heat.
  • One digestion residue storage: From this tank, there is a system that separates the liquid part from the solid one. The former is sent back to the digesters, while the solid part is collected in an earth-banked silo. Following the regional directives, the solid part is used as fertiliser to cultivate the maize.
  • A biogas filtration unit.
  • A CHP unit adopting the ICE technology. As said, the ICE nameplate thermal power is 2.459 MW, while the electrical one is 0.999 MW. The engine rotates at 1500 rpm; it is characterised by an electrical efficiency of 40.58%, and annually, it runs for 8000–8200 h. Additional technical data of the engine can be found in the manufacturer’s data sheet [28]. In terms of fuel consumption, the biogas ICE requires 547 Nm3 h−1 of raw biogas. At the stack, the exhaust gases’ flow rate and temperature are equal to 5312 kg h−1 and 457 C, respectively. The heat recovered from the engine-cooling water and from the lube oil is used to heat up the water that circulates in the digesters’ heating system, while the exhaust gases’ heat content is used to generate hot water at 90 C for an external user. After the waste heat recovery unit, there is an oxidizing catalytic converter, and then, the flue gases are released into the environment.
  • A pumping station to circulate the digestate in the digesters, preliminary tank, digestion residue tank, etc.
  • A control room that accommodates the electric and electronic apparatuses.
Considering the above-mentioned plant arrangement (which is also graphically summarised in Figure 2), the cost of the entire facility, in Italy, is approximately 4.8–5.0 M€, while the annual costs for plant servicing and to produce the biomass, spread the solid and the liquid parts of the digestate, etc., range between 0.9 M€ and 1.2 M€. The plant entered in operation on 31 December 2012, and as of today, on an average bases, it operates for 8000 h a year. Having entered into operation before 1 January 2013, it sells, with dispatching priority, the generated electricity at a fixed and incentivised price of 0.18 € kWh−1 for 15 years.
In regards to the emissions’ legal limits, the operating permit establishes that the regulated emissions and their limits are the ones set in the in-force Italian standard [15].

3. Materials and Methods

The experimental campaign devoted to detecting both regulated and unregulated compounds was conducted following the standards listed in Figure 3. The experimental campaign, as discussed in [24,25], was conducted in collaboration with a specialised laboratory. This collaboration guaranteed that the performed measurements had an uncertainty at the 95% confidence level.
To compute the weight of each emission released by the biogas ICE, the damage assessment analysis needed to be performed adopting the Health Impact Assessment (HIA). The HIA is a well-established procedure derived from the Life Cycle Impact Assessment (LCIA) [29,30]. As summarised by Macor and Benato [24], the LCIA is a method proposed by Jolliet et al. [29] that enables computing the impact on human health or on the environment of the emissions generated by human activities. In a nutshell, the procedure consists of four steps, respectively named as:
1.
Emissions’ inventory;
2.
Characterization;
3.
Damage assessment;
4.
Normalization.
Following the specifications provided by Macor and Benato [24,25], the assessment of damage to human health was performed excluding the damage to the ecosystem and climate change because these two damage categories do not affect the impact on human health from the ICE’s regulated and unregulated emissions. In addition to that, it is important to clarify that, during the computations, the measured values below the instrument detection limit were conventionally set equal to half of the instrument detection threshold itself, as suggested by Menichini and Monfredini [31].
Practically speaking, the measured quantities of each emission can be used to compute the damage D caused by the mass m of the general polluting emissions as:
D = m × c f × s d
where m is the emitted mass expressed in (kg) and “cf” (kgsubstance,eq. kgemission−1) is the characterization factor. “sd”, expressed as DALY kgemission−1, is the specific damage, i.e., the damage caused by a unit quantity of the reference substance.
The damage is expressed in DALY and represents the number of years of life lost by a population due to premature death and/or disability caused by a single harmful emission [29,30].
The emissions considered in this analysis were:
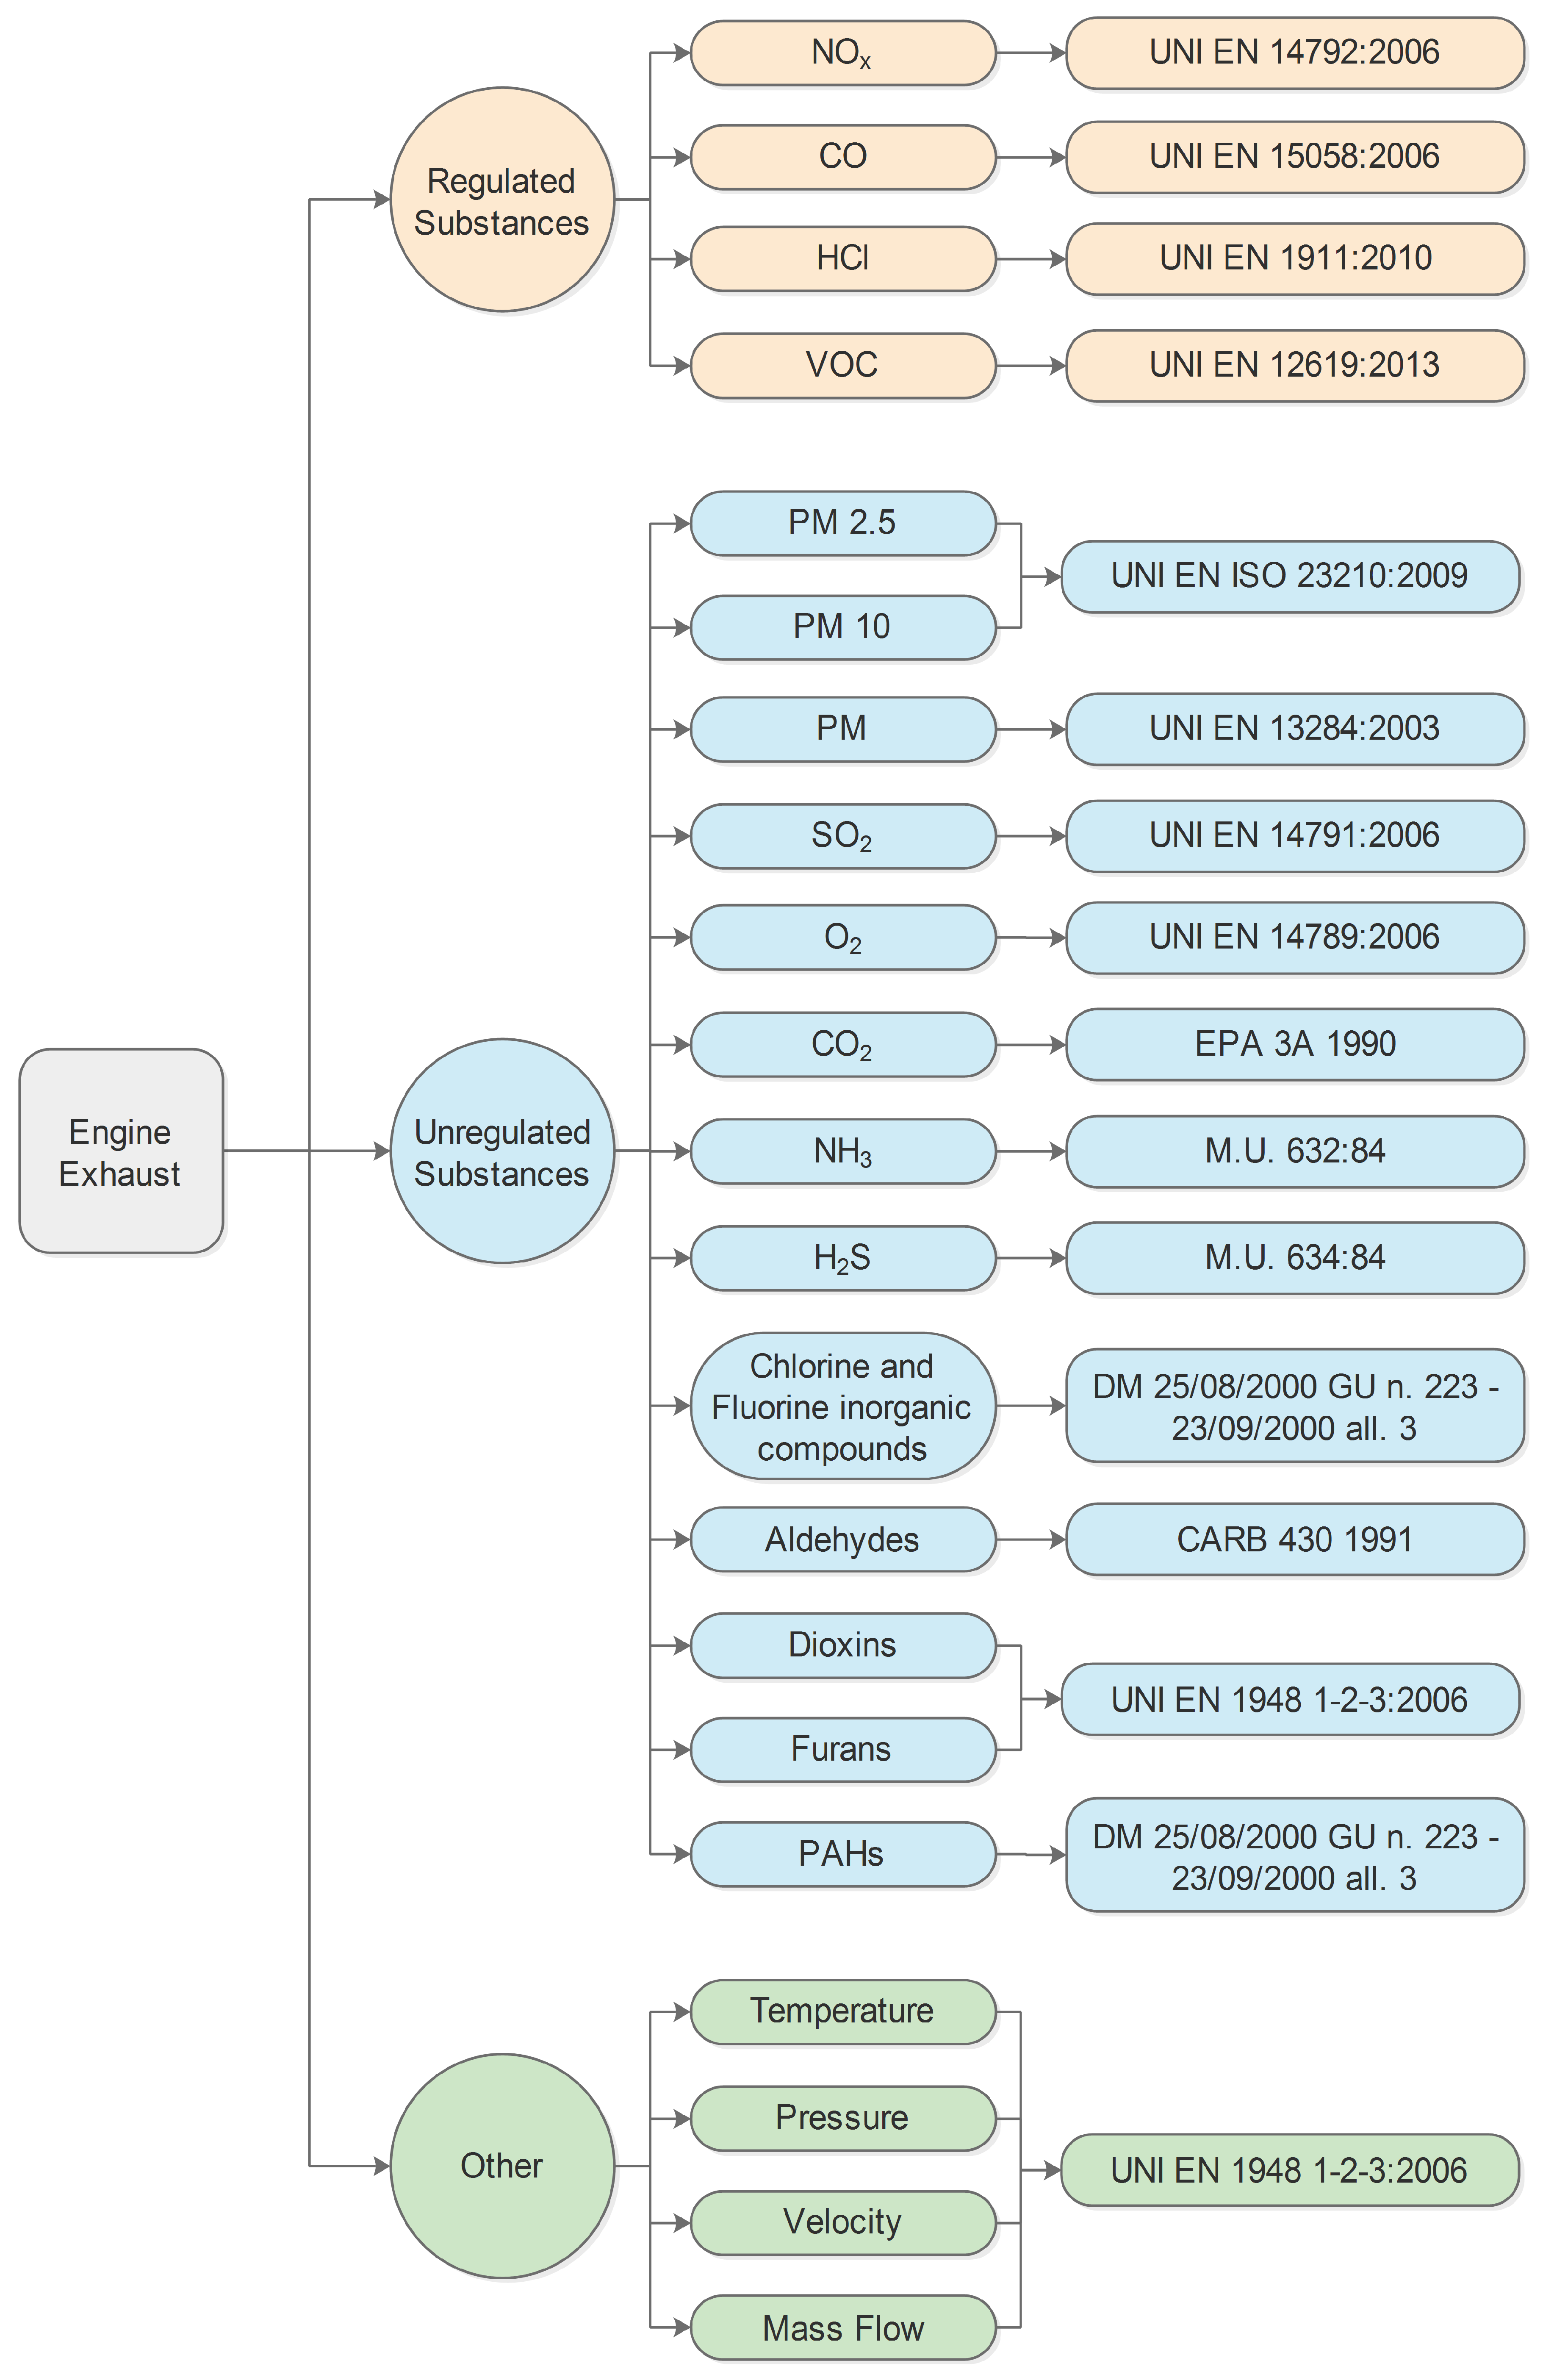
  • The ones monitored in the Italian standard in the case of biogas: NOx, CO, VOCs and HCl.
  • The ones monitored in the German standards and not in the Italian ones in the case of biogas: SOx and formaldehyde.
  • The ones monitored by the Italian standard in the case of the direct competitor of biogas: natural gas, thus particulate matter and, in particular, PM 2.5.
  • Benzo(a)pyrene (B(a)P), one of the most dangerous PAHs because it is well known to be carcinogenic to humans.
Note that the above-mentioned substances were included only in the categories named respiratory inorganics (RI), respiratory organics (RO), carcinogens (CAR) and noncarcinogens (NCAR); therefore, to assess the damage to human health, it was enough to end the LCIA at the human health step. For more details about the HIA method and how to compute the damage to human health, please refer again to [24,25,29,30].
As said, the evaluation of the damage to human health of a single or multiple emissions is absolutely interesting, but there is a need to link this parameter also to the costs and technologies able to abate one or more pollutants. Therefore, to evaluate or compare multiple technologies for the reduction of an emission, the specific reduction cost, c s , i.e., the expenditure C incurred to remove the emission mass m, can be defined as:
c s = C m k g .
When an abatement device must be chosen among devices of different technologies, the one with the lowest value of this index is the best choice.
A new point of view regarding emission abatement arises from the awareness that not all emissions are equally important or, rather, harmful.
However, if there is a need to identify which emission is more convenient to remove, it is possible to immediately observe that the specific cost c s is no longer enough, because it does not allow a comparison between different emissions. It is therefore necessary to define a criterion based on a characteristic common to all emissions. This characteristic is the previously defined damage to human health, D.
The new index can be expressed by the ratio between the cost incurred to remove a certain mass and the avoided damage produced by the removal of that mass; in other words, it is the cost necessary to obtain a unitary reduction of the damage. This index can be called the “cost of avoided damage” and is indicated by C A D :
C A D = C D D A L Y .
Its reciprocal represents the avoided damage per unit of incurred expenditure. Therefore, it can be called the specific avoided damage, S A D , and expressed as:
S A D = D C D A L Y .
The comparison among devices for the capture of different substances is possible by means of these indices ( C A D and S A D ), and it is easy to identify which device leads to the greatest reduction in damage to human health at the same expenditure.
Obviously, the correct evaluation of the above-mentioned parameters depends on the cost estimation. In fact, the cost of the device is the sum of the installation cost and the operating cost. For the abatement devices examined in the present work, the hourly cost can be approximately expressed as:
C ˙ = I + C p s N · n o p + C e = I + C p s N · n o p + c e · m ˙ = h
where C ˙ is the cost flow, I is the device investment cost expressed in €, N is the number of years of service life of the abatement device, n o p (which is equal to 8000 h) is the number of annual operating hours of the biogas unit, C e is the hourly operating cost, c e is the operating cost expressed per unit of the removed substance and m ˙ is the hourly flow rate of the removed substance. Cps is the loss of earnings caused by the plant shutdown for the abatement device installation, and it is expressed in €. It can be given as:
C p s = n · 24 · P · p e
where P is the power of the ICE (kW), n is the number of days for which the plant is shut down and pe is the electricity selling price expressed as € kWh−1.

4. Results and Discussion

The experimental campaign outcomes are summarized in Section 4.1, while Section 4.2 presents the damage computations. Finally, in Section 4.3, the results in terms of the cost of avoided damage and of specific avoided damage are given.

4.1. Results of the Experimental Campaign

The results of the experimental campaign conducted on the selected plant revealed that the exhaust gases’ temperature and mass flow at the engine stack were 267 C and 4300 Nm3 h−1, respectively. However, the measured temperature of the exhaust before the waste heat recovery unit exceeded the nameplate value (457 C) because it was equal to 501 C, a measure that underlines the effectiveness of installing the waste heat recovery device to reduce the thermal pollution, but also that shows that measuring compounds such as PAHs, dioxins and furans is not an easy task if the temperature overcomes the available instrument’s maximum operating temperature (300 C).
The analysis of the biogas regulated emissions revealed that NOx were 527 mg Nm−3, a value that exceeded the limit set by the law (500 mg Nm−3). Considering that NOx are usually controlled by means of the engine’s combustion calibration, in this case, it was clear that the ICE needed to be calibrated. Note that the engine’s calibration is performed twice a year, and the NOx are not measured continuously. Therefore, the ICE could operate for long periods out of calibration and, then, with, e.g., NOx emissions higher than the prescribed ones, an unacceptable operation mode that can be avoided if the biogas plant is equipped with a denitrification system.
The HCl content in the exhaust gases was lower than 0.2 mg Nm−3 (below the instrument measurement threshold) and did not constitute a source of concern because it was significantly below the legal limit of 10 mg Nm−3.
As said, the CO legal limit is set equal to 800 mg Nm−3, a value 20% lower than the one set by the German standard. Despite that and thanks to the oxidizing catalytic converter, its value was reduced from 5210 mg Nm−3 (before the oxidizing catalytic converter) to 512 mg Nm−3 at the engine stack. Therefore, as previously, the content of this compound was far lower than the legal limit of both the Italian and German standards.
The total VOCs’ quantity measured on the engine stack was equal to 560 mg Nm−3, a value that apparently largely exceeded the limit set by the standard (100 mg Nm−3). However, the Italian standard prescribes to measure only nonmethane VOCs, which were equal to 60 mg Nm−3 in the analysed case, thus, again, under the legal limit.
As previously discussed, contrary to the German and Italian standards for natural gas, SOx (expressed as SO2) are not considered a regulated emission in the case of biogas. Despite that, the measure of this compound revealed that its content was equal to 62 mg Nm−3, a value 77% higher than the legal limit set in the case of Italian natural-gas-fuelled ICEs, but 4.84-times lower than the value set for biogas by the German standard.
The PM (in particular, PM 2.5) is a regulated substance only for Italian ICEs fed by natural gas, while formaldehyde is restricted only by the German law for biogas ICEs. For both pollutants, the measured values were below the instruments’ detection limits (<0.1 mg Nm−3 and <0.03 mg Nm−3, respectively), which means at least one order of magnitude below the standards’ prescriptions.
In the analysed case, also the measurement of the other 10 aldehydes (e.g., acetaldehyde, acrolein, crotonaldehyde, propionaldehyde, etc.) registered values below the detection limits, a trend confirmed also in the case of dioxins and furans, as well as PAHs. Note that, among the 26 PAHs, benzo(a)pyrene is the most dangerous substance, but its measured value was below the instrument detection limit (<3.0 × 10⁻³ μg Nm−3).

4.2. The Health Impact Assessment Outcomes

Starting from the measured values acquired during the experimental campaign and by means of the HIA procedure, the impact on human health of each emission released by the ICE was assessed. The results are summarized in Table 1.
Note that the values of the emissions under the instrumental detection threshold, as given in [31], were not neglected, but considered equal to half of the instrumental limit in the performed calculation.
The computations listed in Table 1 showed that the damage caused by NOx was over 91% of the total, while SO2, VOCs and CO followed in the ranking.
Therefore, this analysis confirmed the general outcomes of the work presented by Macor and Benato [25] and, in particular, that NOx is the main source of damage, but, despite it being the second source of damage to human health, SO2 is not envisaged as a regulated emission for biogas engines. This analysis also points out that the damage caused by NOx is 125-times higher than the damage caused by CO and 65-times the one caused by VOCs. CO and VOCs together produce 43-times less damage than NOx. Despite the very low value (half of the instrument threshold), benzo(a)pyrene contributes 0.29%.

4.3. The Cost of Avoided Damage

The analysis of damage to human health for both regulated and unregulated emissions on the selected biogas plant showed that the most impacting emissions are NOx, CO, VOCs and SOx (expressed as SO2). Despite that, the performed analysis dealt only with NOx, CO and VOCs because SOx are not substances regulated by the Italian standards, and in addition, there is no reliable industrial data for devices devoted to the removal of such substances in biogas units.
NOx are usually removed by means of a selective catalytic reduction denitrification system, which uses urea as a reducing agent.
The CO and VOCs emissions are both treated by an oxidizing catalytic converter, which is already installed in the biogas power plant.
The analysis considered two scenarios. The first one involved the installation in an existing plant of a denitrification system or of an oxidizing catalytic converter in addition to the one already existing in the plant. The installation and commissioning of the system were designed for the year 2021, a solution that guarantees to the plant owner to be able to take advantage of the incentives for another 7 years. In the economic evaluations, in addition to the costs of the devices, there was a need to consider the loss of production due to the plant shutdown for the devices’ assembly. These costs were computed on the basis of the unit cost of electricity granted by law, 0.18 € kWh−1. Thus, for a 0.999 MWel biogas plant, the shutdown costs amounted to 180 € h−1.
The second scenario involved the installation of the two devices in the year in which the plant entered into operation (31 December 2012). Thus, the plant manager can take advantage of the feed-in tariff for 15 years, as granted by the law. In this second scenario, the costs of the devices were discounted according to the 2012 cumulative inflation, which amounted to 7%.
In the case of installing a denitrification system, for an ICE characterised by a design power of 999 kWel, a manufacturer provided the following data:
  • System type: selective catalytic reduction;
  • Installation cost: 72,000 including VAT;
  • Reducing agent: urea;
  • Maximum urea flow rate: 2 L h−1;
  • Operating cost for the urea mass flow rate: 1.68 € h−1.
The calculation of the installation and operating costs for the denitrification system is a crucial point. In particular, in regards to the installation cost, it was necessary to distinguish between the two scenarios.
In the first scenario, in addition to the device costs, the loss of profits related to the denitrification system installation needed to be considered. Obviously, in the second scenario, the latter was equal to zero. Moreover, it was necessary to consider the service life of the device, i.e., in which year of the plant’s life the additional device would enter into service. In this regard, in the first scenario, the device was installed during the plant construction phase, while, in the second case, the denitrification system was installed during the seventh year. Thus, the plant owner would receive the feed-in tariff for an additional 7 years.
For the previous scenarios, it was also assumed:
  • Biogas plant lifespan: 15 years;
  • Installation cost of the denitrification system: 72,000 €;
  • Year of operation of the denitrification system if the plant is already in operation: 7 years;
  • Installation time if the plant is already in operation: 15 days;
  • Installation cost of the denitrification system in the case of a new plant: 67,000 €;
  • Year of operation of the denitrification system if the plant is a new installation: 15 years;
  • Installation time if the plant is a new installation: 0 days.
To evaluate the operating cost of the denitrification system, it was necessary to make a hypothesis about its working conditions because the manufacturer did not precisely specify the operating range.
Normally, in an Italian biogas plant, the legal limit, 500 mg Nm−3, is reached by regulating the engine’s combustion process. Therefore, it can be assumed that the urea consumption, 2 L h−1, allows the maximum reduction of NOx, for example, from 500 mg Nm−3 to a value of around 100 mg Nm−3.
The cost, c e , is therefore calculated as:
c e ˙ = 1.68 500 100 · 10 6 4300 = 0.98 k g 1 k g
Furthermore, for the oxidizing catalytic converter, a distinction must be made between the two scenarios. The converter regularly used in biogas plants has an efficiency exceeding 90%. Therefore, in the following calculations, the efficiency was assumed equal to 90% and constant over time. Furthermore, unlike the denitrification system, the oxidizing catalytic converter has no degrees of freedom and works at a fixed point.
For an existing plant (first scenario), the installation of the second oxidizing catalytic converter would require a plant shutdown, which must be counted among the costs, as well as the cost of the housing itself. The cost of the housing can be estimated as 3000 €, while the cost of the downtime was still 180 € h−1 for three working days.
For the second scenario, there is no plant shutdown cost; however, the housing was not built "ad-hoc". In fact, the device was directly installed during the building phase. Therefore, this drastically reduced the costs. Based on the manufacturer’s data, the installation cost was equal to 1000 €.
In regards to the operating costs, in the case of an existing plant, it is important to note that the oxidizing catalytic converter device is usually changed every year, although its duration may be longer, a condition that has an average yearly cost equal to 2000 €.
Based on the performed measurements, before the already-installed oxidizing catalytic converter, the CO concentration produced by the biogas engine varied between 5000 mg Nm−3 and 8000 mg Nm−3.
Considering, for simplicity, the worst condition, 8000 mg Nm−1, and an average capturing efficiency of 90%, the oxidizing catalytic converter would be able to reduce the emission until 800 mg Nm−3, a value that corresponds to the maximum allowed by the in-force Italian law.
The second converter, which was installed in series with the first one and presented the same efficiency, reduced the CO concentration up to 80 mg Nm−3. Therefore, the second converter processes one-tenth of the CO processed by the first one, so its duration can be considered 10-times longer than that of the first one. For the first scenario, only one converter needed to be purchased, the second one, because the first one was already installed. The same conclusion can be reached by considering the alternative management of the two oxidizing elements, i.e., at the end of the year, the second device replaces the first one, now exhausted, and completes its life in the following year. For the second scenario, two converters need to be purchased because the plant life is, now, 15 years, with no plant shutdown costs.
The results of the computations are presented in Figure 4 for the first scenario and in Figure 5 for the second one.
The analysis of the trends depicted in Figure 4 and Figure 5 allows drawing three fundamental results:
  • The SAD of the denitrification system and the SAD of the oxidizing catalytic converter had the same order of magnitude, while the hourly damage of the NOx emissions was 43-times that of the CO+VOCs emissions. In a nutshell, the cost of the device had a great weight in determining the value of the SAD: the low cost of the system for CO+VOCs raised its SAD almost to the level of the NOx one;
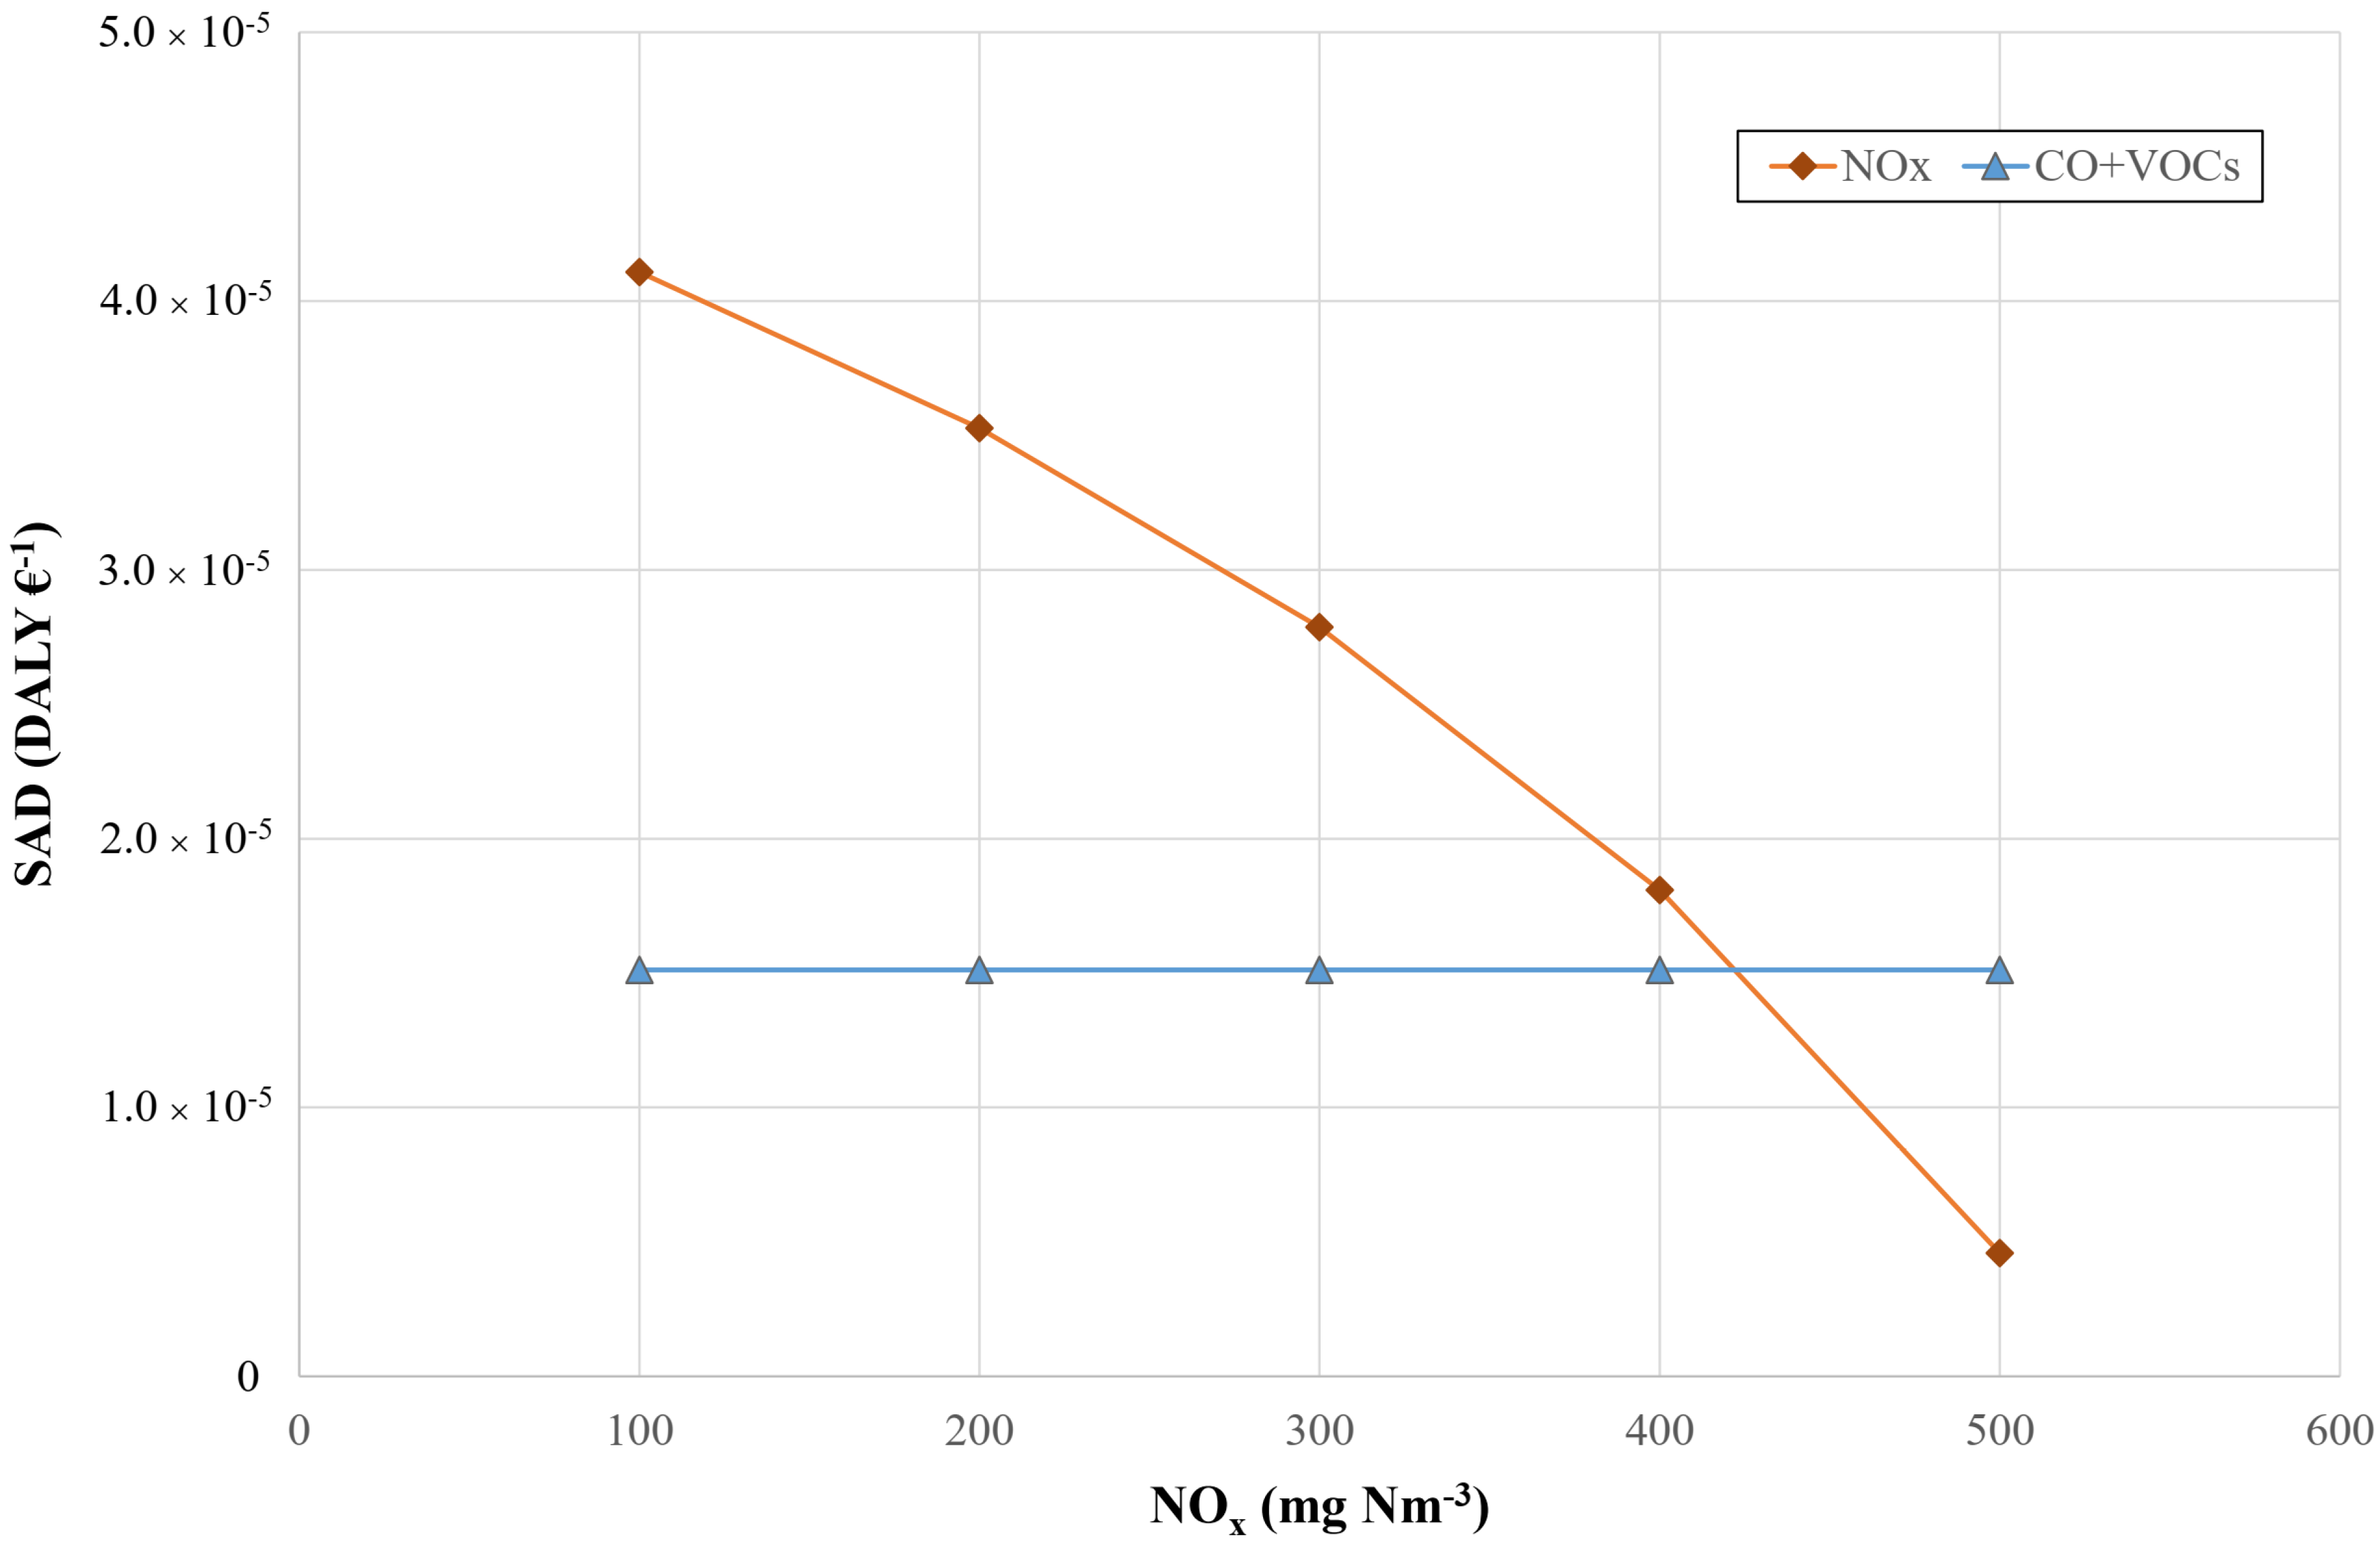
  • In the case of Scenario 1 (see Figure 4), if the reduction of NOx required or imposed by law is modest (between 350 mg Nm−3 and 500 mg Nm−3), there is no health advantage in investing in a denitrification system rather than in an oxidizing converter, especially taking into account that the latter requires less investment. In other words, if legislators want to make biogas technology more acceptable by lowering the NOx limit to that of natural gas, i.e., from 500 to 350 mg Nm−3, the installation of the denitrification system could have specific costs practically equivalent to those of a simple oxidant converter. On the other hand, if the required reduction is conspicuous, it is always beneficial to invest in the installation of the denitrification system, because its SAD is three-times the one achievable with the oxidizing converter;
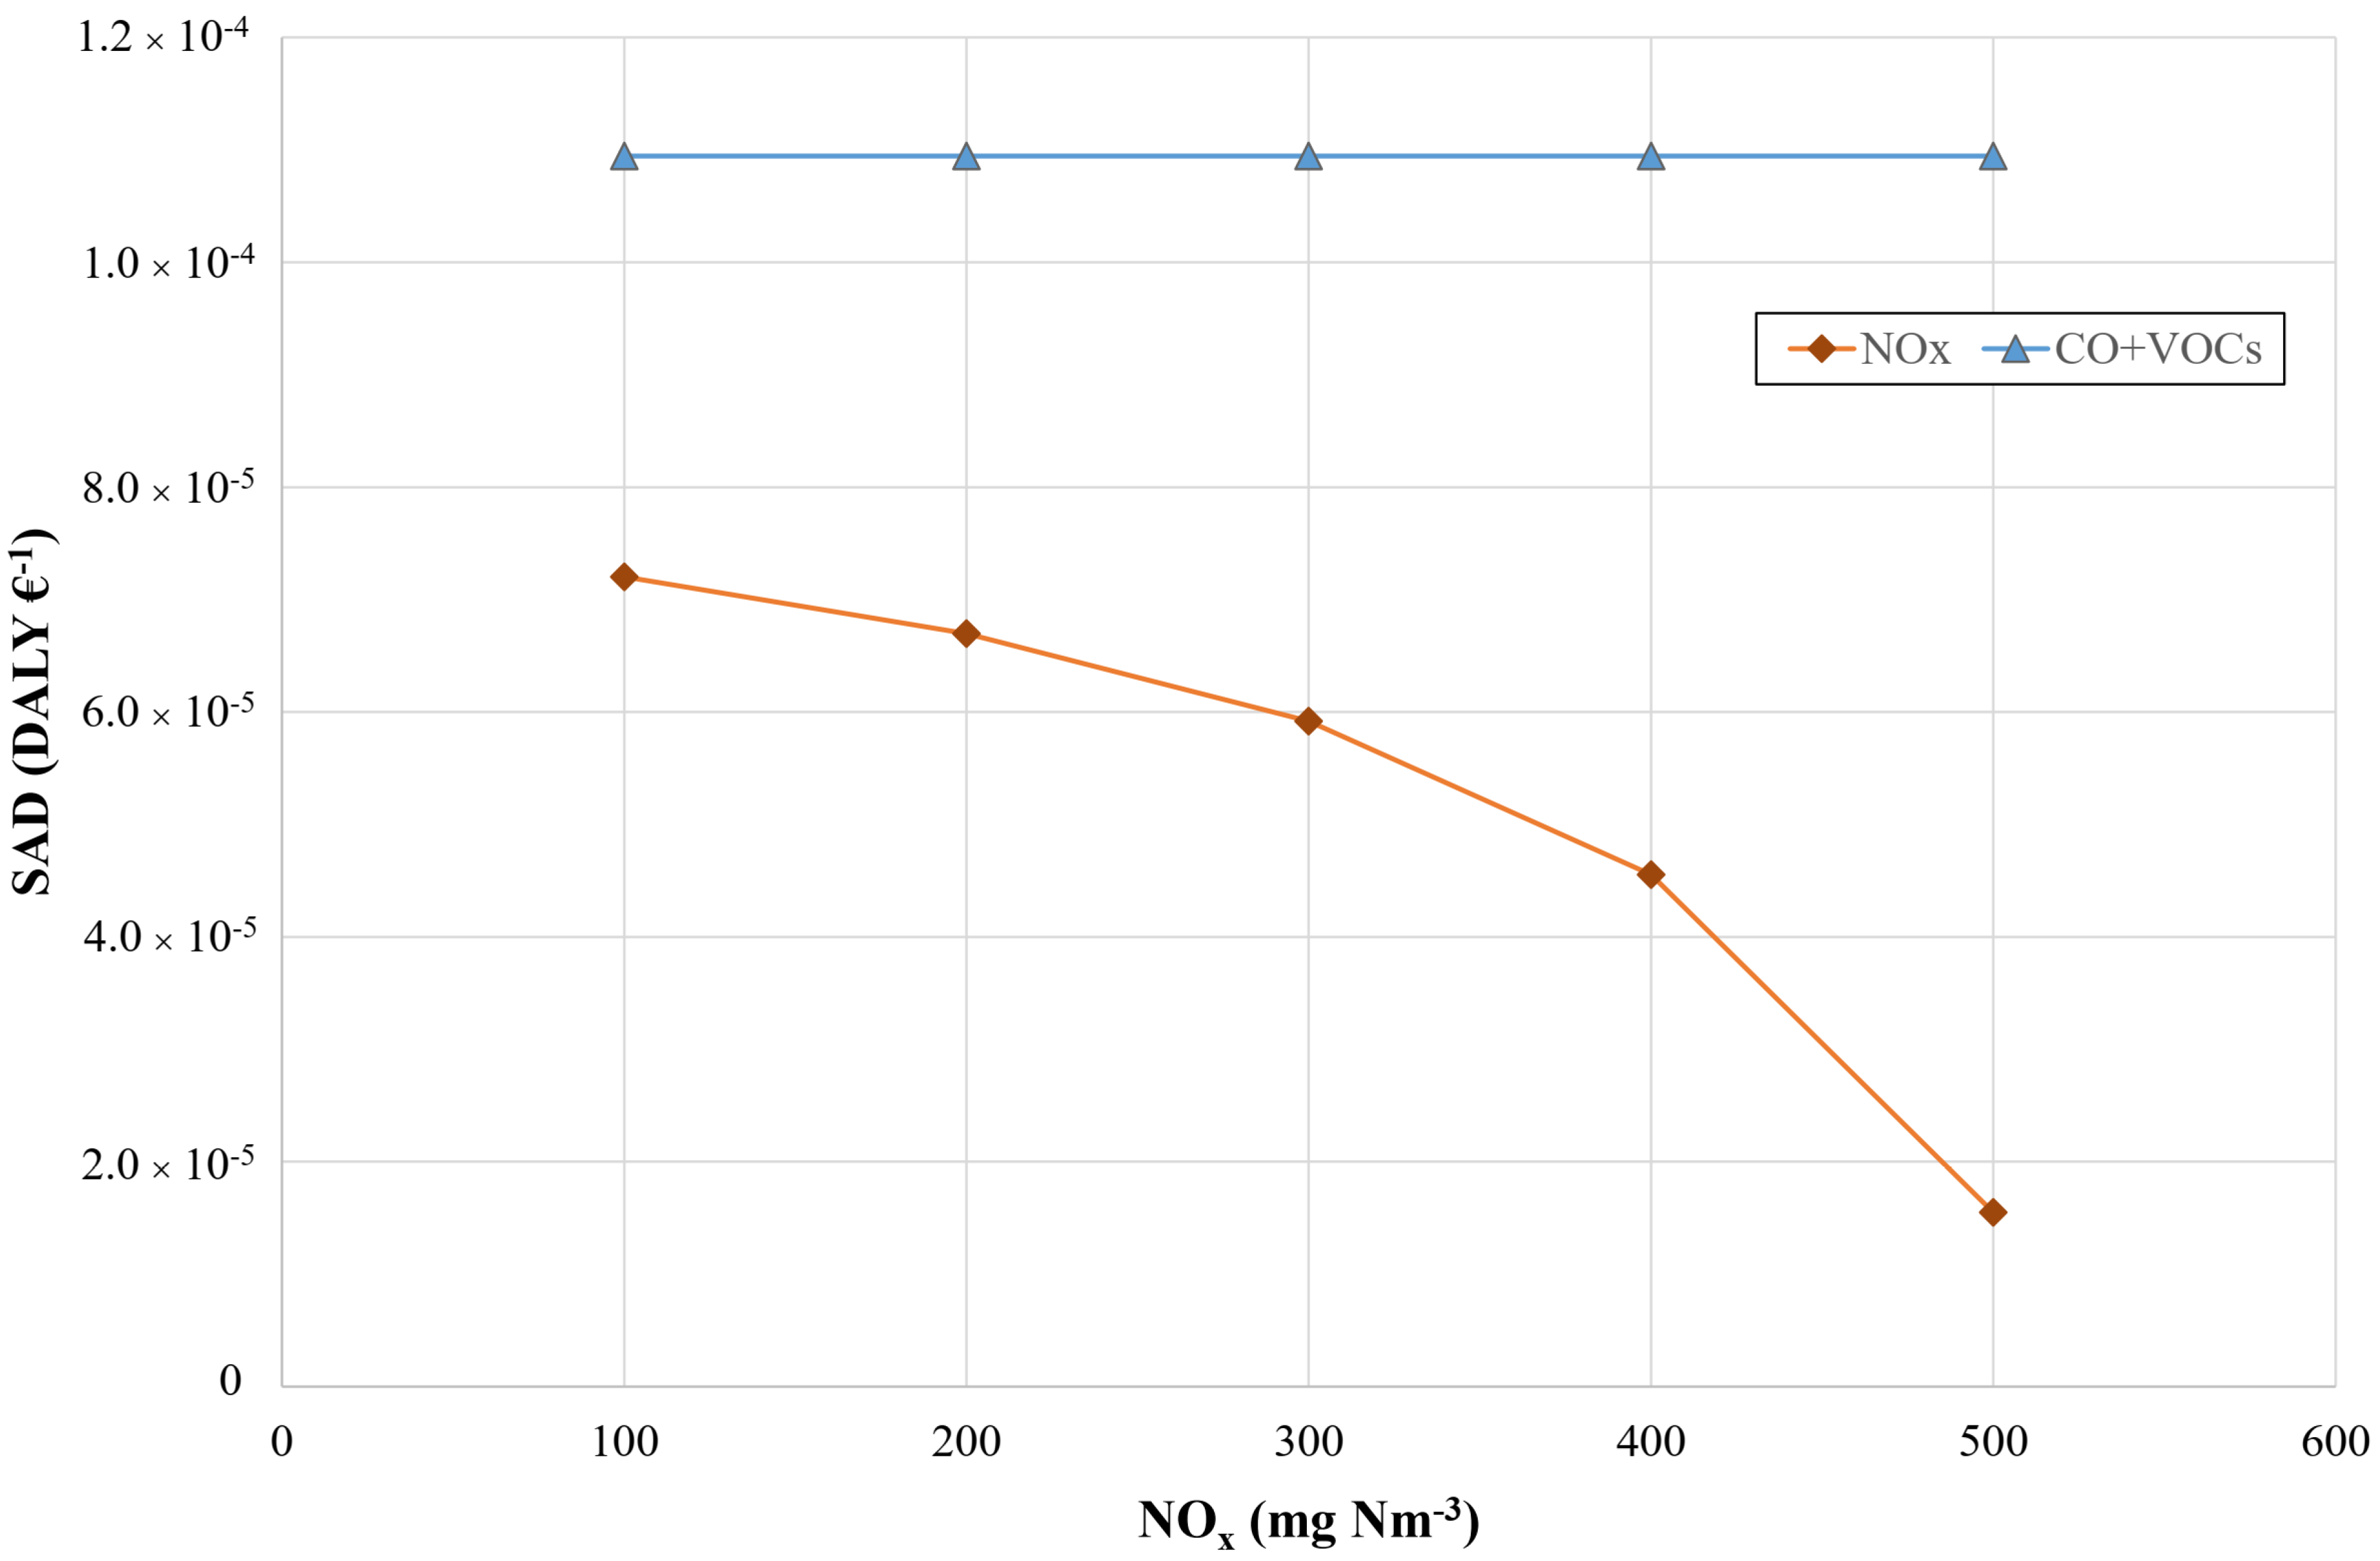
  • In the case of Scenario 2 (see Figure 5), the situation is paradoxically reversed: it is always convenient to act on the least harmful emissions, CO+VOCs, rather than on NOx. This is linked to the converter costs, which are even lower than in Scenario 1, as there are now no plant shutdown costs. The denitrification system, on the other hand, maintains very high costs despite the absence of plant shutdown costs.
Therefore, this analysis provides some indications for legislators to lower the emission limits. In fact, the future limits for existing plants should be related to NOx, but only if the new limit is really low compared to the current one. Only in this case can some benefits be achieved. Otherwise, the installation of the denitrification system would certainly produce a strong reduction in damage to human health, but at a very high cost. This would discourage the plant manager from investing in this direction. In fact, it would be less expensive for the owner to invest in a further reduction of CO+VOCs, which can, in any case, produce a reduction in damage, but at lower costs.
For the same reasons, the future limits for new plants should be related to the CO+VOCs group.
It is important to emphasize the fact that these results were derived from data related to in-operation ICEs, so directly linked to the current technological stage of development. With more technological advancements in ICE technology, the conclusions could be different.

5. Conclusions

In this work, a method for the evaluation of the emissions’ abatement systems based on the avoided damage to human health was presented. The method defines a relationship between the damage avoided by an abatement system and the costs of the system itself. On the other hand, its reciprocal represents the incurred expense per unit of avoided damage. It is evident that between two or more devices, the most convenient is the one that costs less for the same amount of damage avoided.
This method was applied to the case of the engine of a biogas plant, to determine the convenience of further abatement systems. On the basis of the measurements carried out of the plant, the most harmful emissions were determined, which resulted in: NOx, SO2, CO and VOCs. As abatement systems, only the denitrification system and the oxidizing catalytic converter were considered due to the lack of reliable industrial data for devices devoted to the removal of SO2 in biogas units.
Two different scenarios were considered: The first one assumed that the plant was currently in operation. Therefore, it can take advantage of incentives for a few more years. On the contrary, the second scenario assumed that the abatement system was installed when the plant was new, i.e., reported at the beginning of the period of validity of the incentives, therefore being able to fully exploit the period of validity of the feed-in tariff.
The results of this analysis were rather surprising, because it is not always more convenient to cut down the most harmful emission (NOx). For an in-operation plant, it is convenient to use the denitrification system, provided that this is fully exploited; otherwise, it is practically indifferent to the use of a denitrification system or an oxidizing catalyst. However, if the abatement unit is installed at the beginning of the plant’s operation, it is more convenient to use an oxidizing catalytic converter, which removes both CO and VOCs.
These conclusions constitute a suggestion for legislators who must impose new limits for the emissions to make biogas plants more acceptable to the public, without excessively increasing abatement costs and, subsequently, the plant’s total investment.

Author Contributions

Conceptualization, A.M. and A.B.; data curation, A.M. and A.B.; formal analysis, A.M. and A.B.; funding acquisition, A.M.; investigation, A.M. and A.B.; methodology, A.M. and A.B.; writing—original draft, A.B.; writing—review and editing, A.M. and A.B. All authors have read and agreed to the published version of the manuscript.

Funding

This research was funded by “Fondazione Cariverona” Grant Number 2015.0873—3 Poli 5.

Institutional Review Board Statement

Not applicable.

Informed Consent Statement

Not applicable.

Data Availability Statement

Not applicable.

Acknowledgments

The authors acknowledge “Fondazione Cariverona” for selecting and financing the research project named “Studio per l’implementazione delle fermentazioni anaerobiche a fini energetici e analisi del loro impatto ambientale”, Grant Number 2015.0873—3 Poli 5.

Conflicts of Interest

The authors declare no conflict of interest.

Abbreviations

The following abbreviations are used in this manuscript:
ADanaerobic digestion
B(a)Pbenzo(a)pyrene
CARcarcinogens
CHPcombined heat and power
COcarbon monoxide
CO2carbon dioxide
DALYdisability-adjusted life year
EUEuropean Union
HClhydrogen chloride
HIAHealth Impact Assessment
ICEinternal combustion engine
LCIALife Cycle Impact Assessment
NCARnoncarcinogen
NOxnitrogen oxides
PAHspolycyclic aromatic hydrocarbons
PMparticulate matter
RIrespiratory inorganics
ROrespiratory organics
SOxsulphur oxides
UHCunburned hydrocarbons
VOCsvolatile organic compounds
Cexpenditure, €
C e hourly operating cost
C p s loss of earnings, €
C A D cost of avoided damage, € DALY−1
C ˙ cost flow, € h−1
c e operating cost expressed per unit of removed substance
c f characterization factor, kgsubstance,eq. kgemission−1
c s specific reduction cost, € kg−1
Ddamage, DALY
Idevice investment cost, €
mmass, kg
m ˙ hourly flow rate of removed substance
Nnumber of years of service life of the abatement device, y
nnumber of days, d
n o p number of operating hours
Ppower, kW
p e electricity selling price, € kWh−1
S A D specific avoided damage, DALY €−1
s d specific damage, DALY kgsubstance,eq.−1

References

  1. Benato, A.; Macor, A. Italian Biogas Plants: Trend, Subsidies, Cost, Biogas Composition and Engine Emissions. Energies 2019, 12, 979. [Google Scholar] [CrossRef] [Green Version]
  2. Jaffrin, A.; Bentounes, N.; Joan, A.M.; Makhlouf, S. Landfill biogas for heating greenhouses and providing carbon dioxide supplement for plant growth. Biosyst. Eng. 2003, 86, 113–123. [Google Scholar] [CrossRef]
  3. Amiri, S.; Henning, D.; Karlsson, B.G. Simulation and introduction of a CHP plant in a Swedish biogas system. Renew. Energy 2013, 49, 242–249. [Google Scholar] [CrossRef]
  4. Yağli, H.; Koç, Y.; Koç, A.; Görgülü, A.; Tandiroğlu, A. Parametric optimization and exergetic analysis comparison of subcritical and supercritical organic Rankine cycle (ORC) for biogas fuelled combined heat and power (CHP) engine exhaust gas waste heat. Energy 2016, 111, 923–932. [Google Scholar] [CrossRef]
  5. Benato, A.; Macor, A. Biogas engine waste heat recovery using organic Rankine cycle. Energies 2017, 10, 327. [Google Scholar] [CrossRef]
  6. Zhang, T.; Tan, Y.; Zhang, X. Using a hybrid heating system to increase the biogas production of household digesters in cold areas of China: An experimental study. Appl. Therm. Eng. 2016, 103, 1299–1311. [Google Scholar] [CrossRef]
  7. Colorado, A.; McDonell, V. Emissions and stability performance of a low-swirl burner operated on simulated biogas fuels in a boiler environment. Appl. Therm. Eng. 2018, 130, 1507–1519. [Google Scholar] [CrossRef]
  8. Berglund, M.; Börjesson, P. Assessment of energy performance in the life-cycle of biogas production. Biomass Bioenergy 2006, 30, 254–266. [Google Scholar] [CrossRef]
  9. Pehnt, M. Dynamic life cycle assessment (LCA) of renewable energy technologies. Renew. Energy 2006, 31, 55–71. [Google Scholar] [CrossRef]
  10. Amponsah, N.Y.; Troldborg, M.; Kington, B.; Aalders, I.; Hough, R.L. Greenhouse gas emissions from renewable energy sources: A review of lifecycle considerations. Renew. Sustain. Energy Rev. 2014, 39, 461–475. [Google Scholar] [CrossRef]
  11. Ingrao, C.; Bacenetti, J.; Adamczyk, J.; Ferrante, V.; Messineo, A.; Huisingh, D. Investigating energy and environmental issues of agro-biogas derived energy systems: A comprehensive review of life cycle assessments. Renew. Energy 2019, 136, 296–307. [Google Scholar] [CrossRef]
  12. Food and Agriculture Organization of the United Nations. Bioenergy and Food Security-the BEFS Analytical Framework; Food and Agriculture Organization of the United Nations: Rome, Italy, 2010. [Google Scholar]
  13. Tran, N.; Illukpitiya, P.; Yanagida, J.F.; Ogoshi, R. Optimizing biofuel production: An economic analysis for selected biofuel feedstock production in Hawaii. Biomass Bioenergy 2011, 35, 1756–1764. [Google Scholar] [CrossRef]
  14. Wesseler, J.; Drabik, D. Prices matter: Analysis of food and energy competition relative to land resources in the European Union. NJAS Wagening. J. Life Sci. 2016, 77, 19–24. [Google Scholar] [CrossRef]
  15. Ministero dell’Ambiente e Della Tutela del Territorio e del Mare. Decreto 19 Maggio 2016, n. 118. Regolamento Recante Aggiornamento dei Valori Limite di Emissione in Atmosfera per le Emissioni di Carbonio Organico Totale Degli Impianti Alimentati a biogas, ai Sensi dell’articolo 281, Comma 5, del Decreto Legislativo n. 152 del 2006. Available online: https://www.gazzettaufficiale.it/eli/id/2016/06/30/16G00129/sg (accessed on 20 September 2021).
  16. GMBl (Gemeinsames Ministerialblatt). Technische Anleitung zur Reinhaltung der Luft-TA Luft; 2002; pp. 25–29. Available online: https://www.bmu.de/fileadmin/Daten_BMU/Download_PDF/Luft/taluft.pdf (accessed on 20 September 2021).
  17. Bundesministerium für Wirtschaft und Enrgie. Das Erneuerbare-Energien-Gesetz. 2016. Available online: https://www.bundesregierung.de/breg-de/leichte-sprache/bundes-ministerien/bundes-ministerium-fuer-wirtschaft-und-energie (accessed on 20 September 2021).
  18. Bari, S. Effect of carbon dioxide on the performance of biogas/diesel duel-fuel engine. Renew. Energy 1996, 9, 1007–1010. [Google Scholar] [CrossRef]
  19. Swami Nathan, S.; Mallikarjuna, J.M.; Ramesh, A. An experimental study of the biogas-diesel HCCI mode of engine operation. Energy Convers. Manag. 2010, 51, 1347–1353. [Google Scholar] [CrossRef]
  20. Kalsi, S.S.; Subramanian, K.A. Effect of simulated biogas on performance, combustion and emissions characteristics of a bio-diesel fueled diesel engine. Renew. Energy 2017, 106, 78–90. [Google Scholar] [CrossRef]
  21. Hotta, S.K.; Sahoo, N.; Mohanty, K. Comparative assessment of a spark ignition engine fueled with gasoline and raw biogas. Renew. Energy 2019, 134, 1307–1319. [Google Scholar] [CrossRef]
  22. Kristensen, P.G.; Jensen, J.K.; Nielsen, M.; Illerup, J.B. Emission Factors for Gas Fired CHP Units <25 MW. 2004. Available online: https://www2.dmu.dk/1_viden/2_Miljoe-tilstand/3_luft/4_adaei/doc/EmissionfactorsforgasfiredCHPunits.pdf (accessed on 20 September 2021).
  23. Nielsen, M.; Nielsen, O.K.; Marlene, P. Danish Emission Inventories for Stationary Combustion Plants-Inventories Until 2011; Technical Report; Department of Environmental Science, Aarhus University: Aarhus, Denmark, 2014. [Google Scholar]
  24. Macor, A.; Benato, A. Regulated emissions of biogas engines—On site experimental measurements and damage assessment on human health. Energies 2020, 13, 1044. [Google Scholar] [CrossRef] [Green Version]
  25. Macor, A.; Benato, A. A Human Health Toxicity Assessment of Biogas Engines Regulated and Unregulated Emissions. Appl. Sci. 2020, 10, 7048. [Google Scholar] [CrossRef]
  26. International Renewable Energy Agency. Renewable Energy Capacity Statistics 2018; Technical Report; 2018; Available online: https://www.irena.org/publications/2018/mar/renewable-capacity-statistics-2018 (accessed on 20 September 2021).
  27. Benato, A.; Macor, A.; Rossetti, A. Biogas Engine Emissions: Standards and On-Site Measurements. Energy Procedia 2017, 126, 398–405. [Google Scholar] [CrossRef]
  28. GE. GE’s Jenbacher Gas Engines. 2021. Available online: https://www.innio.com/en/products/jenbacher (accessed on 20 September 2021).
  29. Jolliet, O.; Margni, M.; Charles, R.; Humbert, S.; Payet, J.; Rebitzer, G.; Rosenbaum, R. IMPACT 2002+: A New Life Cycle Impact Assessment Methodology. Int. J. Life Cycle Assess. 2003, 8, 324–330. [Google Scholar] [CrossRef] [Green Version]
  30. Frischknecht, R.; Editors, N.J.; Althaus, H.J.; Bauer, C.; Doka, G.; Dones, R.; Hischier, R.; Hellweg, S.; Köllner, T.; Loerincik, Y.; et al. Implementation of Life Cycle Impact Assessment Methods. Am. Midl. Nat. 2007. Available online: https://inis.iaea.org/collection/NCLCollectionStore/_Public/41/028/41028089.pdf (accessed on 20 September 2021).
  31. Menichini, E.; Monfredini, F. Monitoring of Carcinogenic PAHs in Air Under Mild-Warm Ambient Temperatures: Relative Importance of Vapour- and Particulate-phase Analyses in Assessing Exposure and Risk. Int. J. Environ. Anal. Chem. 2003, 83, 897–908. [Google Scholar] [CrossRef]
Figure 1. Italian and German regulatory limits for biogas plants as defined by the countries’ standards [15,16,17].
Energies 14 06360 g001
Figure 2. Sketch of the biogas facility structure.
Energies 14 06360 g002
Figure 3. Standards adopted to measure the ICE exhaust gases’ substances.
Energies 14 06360 g003
Figure 4. Trend of the SAD index (expressed in DALY €−1) of the two devices as a function of the released NOx for the first scenario.
Energies 14 06360 g004
Figure 5. Trend of the SAD index (expressed in DALY €−1) of the two devices as a function of the released NOx for the second scenario.
Energies 14 06360 g005
Table 1. Evaluation of the impact on human health of the most significant emissions.
EmissionUnitImpactMeasuredDamage
CategoryValue(DALY Nm−3)(DALY h−1)(%)
NOxmg Nm−3RI5274.70 × 10−82.04 × 10−491.22
COmg Nm−3RI5123.74 × 10−101.61 × 10−60.73
VOCsmg Nm−3RO5607.24 × 10−103.11 × 10−61.41
SO2mg Nm-3RI623.39 × 10−91.46 × 10−56.58
PM 2.5mg Nm−3RI<0.13.50 × 10−111.51 × 10−70.07
Formaldehydemg Nm−3RO<0.031.64 × 10−147.16 × 10−110.00
Formaldehydemg Nm−3CAR<0.033.80 × 10−141.64 × 10−100.00
Formaldehydemg Nm−3NCAR<0.031.37 × 10−135.90 × 10−100.00
Benzo(a)pyreneμg Nm−3CAR<0.0031.49 × 10−106.39 × 10−70.29
2.21 × 10−4100.00
Impact category abbreviations: RI = respiratory inorganic, RO = respiratory organic, CAR = carcinogen, NCAR = noncarcinogen.
Publisher’s Note: MDPI stays neutral with regard to jurisdictional claims in published maps and institutional affiliations.

