Article

Integrated Sustainable Energy for Sub-Saharan Africa: A Case Study of Machinga Boma in Malawi

James Watt School of Engineering, University of Glasgow, Glasgow G12 8QQ, UK
*
Author to whom correspondence should be addressed.
Energies 2021, 14(19), 6330; https://doi.org/10.3390/en14196330
Submission received: 6 September 2021 / Revised: 23 September 2021 / Accepted: 30 September 2021 / Published: 4 October 2021
(This article belongs to the Special Issue Research on Hybrid Solar Photovoltaic/Thermal (PV/T) System)

Abstract

:
Nearly 60% of the population of sub-Saharan Africa still live without access to electricity. Comparing the access rate of the countries in the region, Malawi ranks as one of the least electrified, with electricity available to only 14.6% of its population, as of 2018. This issue makes Malawi the case study of this research and poses the research question, “How can the low electricity access rate in Malawi be addressed?”. To address this research question, possible off grid, integrated, sustainable energy systems based on locally available energy resources—solar, wind, and diesel—are proposed. The multiyear and sensitivity analysis function of HOMER Pro microgrid simulation software is used to analyze the off grid performance of the proposed combinations of diesel generators, wind turbines, solar Photovoltaics, and battery storage, in providing power for an estimate of 400 households and nonresidential outlets in Machinga Boma, a community in the Southern region of Malawi. Based on the analysis, the Solar Photovoltaic/Diesel Genset/battery system combination consisting of 750 kWp solar Photovoltaic array, 460 kW (575 kVA) diesel generator and 3000 kWh nominal capacity battery bank is shown to be the most optimal system, with an overall energy cost of $0.339/kWh. Under the imposed design constraints and the sensitivity analysis performed to analyze the impact of changing the base fuel price, varying load growth, changing solar irradiation, and wind levels on the system performance, the most optimal system remained the preferred system choice.

1. Introduction

Development opportunities in sub-Saharan Africa (SSA) are significantly hindered by the severe shortage of energy supply in the region. On a global scale, this region is classified as one of the least electrified. As of 2018, the estimated number of people living without access to electricity was estimated to be 860 million, with 595 million of this estimate residing in sub-Saharan Africa [1]. Despite the connection of 15 million people in this region to electricity from 2013 to 2018, nearly 60% of the population in the sub-Saharan Africa region still live with no access to electricity. The energy supply crisis of the sub-Saharan region is attributed to a number of factors, such as the limited availability of capital investment, underdeveloped energy policies, poor planning, and inefficiencies in power infrastructure [2,3].
The fact that a considerable proportion of the population in sub-Saharan Africa reside in remote areas also poses a constraint on electrification attempts. In Malawi, for instance, 84% of the total population reside in remote areas [4]. Therefore, while the grid extension approach is encouraged, it is an insufficient and expensive attempt at bridging the gap between energy demand and supply in sub-Saharan states, such as Malawi. As a result of this, the use of decentralized off grid energy systems is claimed to be a more appealing way to electrify remote areas in Malawi, with the working hypothesis that these systems are technically and economically suited for this purpose. Taking into consideration the available resources in the study area, this paper adopts a system design approach that synergises both technical and economic aspects of the possible system configurations, bearing in mind the nexus that exists between the affordability of energy and the societal acceptance of the system.

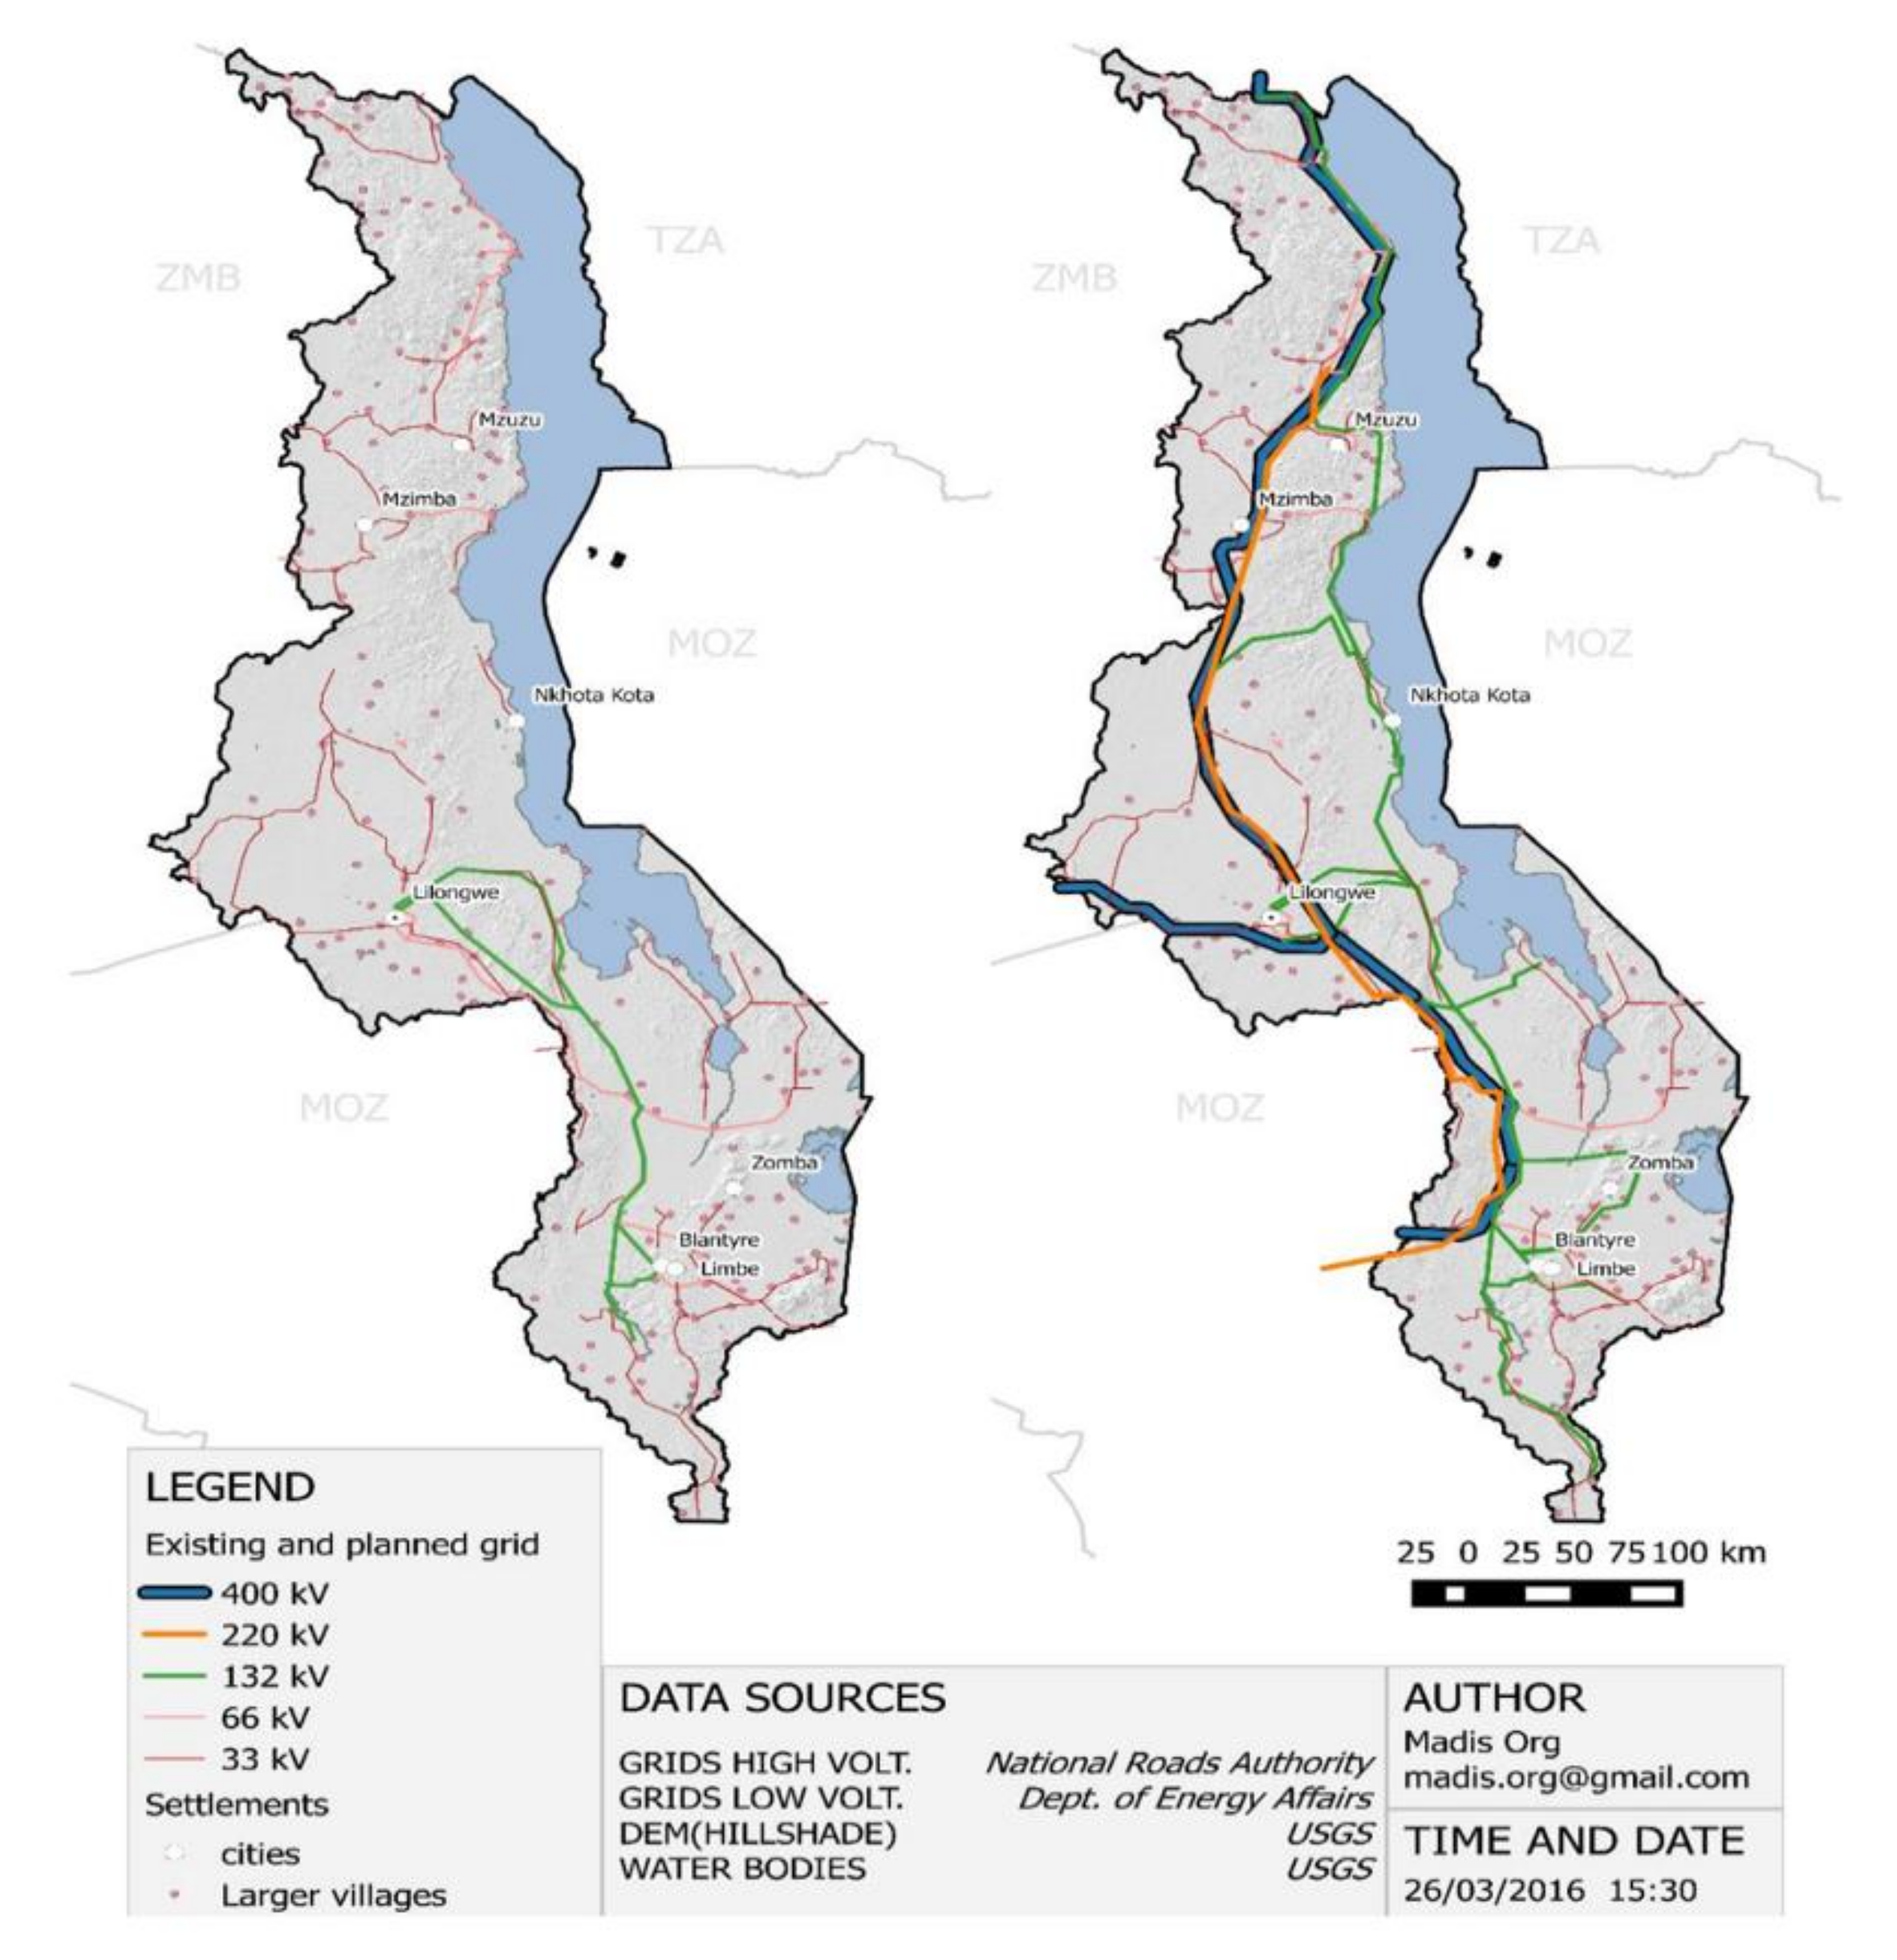
1.1. Overview of Malawi: Electricity Crises and Opportunity for Hybrid Systems

Malawi is a landlocked southeastern sub-Saharan African country with a population of 17,563,749 people [4]. Overall, 16% of the population of Malawi reside in the major urban areas, which refers to the four major cities—Blantyre, Lilongwe, Mzuzu and Zomba—while the remaining 84% of the population reside mostly in rural areas [4]. The total area of Malawi is 118,483 26 km2, and 20% of this area is occupied by water [4]. This is a probable reason for 98% of the centralized grid electricity generation of the country being hydropower. In comparison with South Africa and Ghana, two of the most electrified countries in the sub-Saharan region, over a period from 2005 to 2018, Malawi, Chad, Democratic Republic of Congo, and Burundi have consistently shown a trend of exceptionally low growth in electrification, as presented in Table 1.
Currently, the power generation capacity of Malawi is 351 MW, which is significantly lower than the country’s estimated energy demand of 700 MW [5]. The power infrastructure in Malawi is owned and operated by Electricity Supply Corporation of Malawi (ESCOM) and 99% of ESCOM generated electricity is from hydropower stations. Power transmission across the country is at 132 kV and 66 kV, only extends to the major cities and the power is distributed to some remote areas through 11 kV and 33 kV lines [6]. The major energy sources in the country are traditional biomass, coal, and hydropower. About 98% of the hydro generated electricity in the country is generated along the Shire River, located in the southern region of the country, and it is often constrained by occasional droughts and low water levels [6]. The concentration of the hydropower plants in the southern region results in long distance power transmissions to other regions, leading to significant power losses and disturbances in supply [5]. The current and planned centralized grid network of Malawi is displayed in Figure 1.
Considering the unreliability of the electricity supply in the country, grid refurbishment is essential, but its extension to the unserved and remote areas characterized with sparse population and lower incomes may, however, be an expensive and daunting technical challenge. This situation makes off grid electricity supply from sustainable energy resources one of the most appealing means of increasing generation capacity and electricity access in a sustainable manner within the country [7]. The sustainable energy options of Malawi include solar energy, with an annual average value ranging from 1642.5 kWh/m2 to 2555 kWh/m2 [3], relatively good wind speeds in the Northern and Central regions, hydropower, bio energy and geothermal potentials. The full extent of these energy resources in meeting Malawi’s electricity supply shortage have, however, not been fully explored.
The modelling and simulation of decentralized, off grid hybrid energy concepts that incorporate these energy resources in tackling the electrification crises in the unserved areas of Malawi, where grid expansion would incur high costs and the reliability of supply is affected by the technical losses associated with long distance transmission, is, therefore, paramount. This is, therefore, a gap in literature that this study is intended to bridge.

1.2. Hybrid Energy Systems in Sub-Saharan Africa

A number of research publications have explored the past and current energy situation of the sub-Saharan region, and have explored the technical feasibility and economic performance of various decentralized off grid hybrid energy system designs for implementation in unelectrified remote areas in sub-Saharan Africa. The most common hybrid configuration in sub-Saharan Africa is a combination of Solar PV, diesel generators and batteries, due to the unreliability of supply associated with electricity generation from intermittent renewable energy resources and familiarity of these technologies in the region. Hybrid systems with diesel generators as backup are a relatively cheap and widespread technology for rural electrification, especially in cases where a grid is absent and easy access to fossil fuel is possible. However, in the absence of an easy access and the continuous price fluctuations of fossil fuels, this solution becomes unrecommended and costly [8].
Olatomiwa et al. [9] for instance, analyzed the energy resource potential of the six geopolitical zones in Nigeria. Using HOMER microgrid simulation software, the economic and technical feasibility of seven hybrid energy system configurations—diesel generator only, PV–diesel generator, PV–diesel generator–battery, wind turbine–diesel generator, wind turbine–diesel generator–battery, PV–wind turbine–diesel generator, PV–diesel generator–battery and PV–wind turbine–diesel generator–battery—in the identified sites of each of the geopolitical zones was investigated. An additional sensitivity analysis on changes in the price of diesel ($1.1/L and $1.3/L) was also performed as part of the optimisation criteria. Despite the global reduction in the prices of solar, wind, and battery technology components, the optimisation results by HOMER shows the hybrid energy system with a combination PV–diesel generator–battery hybrid is considered the most cost-effective system configuration for implementation on the sites considered in the study [9].
Adaramola et al. [10], on a levelized cost of electricity, the net present cost of system components, and the locally available energy resources, performed a techno–economic feasibility study using HOMER, on the implementation of a hybrid PV–wind turbine–diesel generator–battery system configuration for sustainable electricity generation in a community in southern Ghana. The study shows the complementary nature of the energy sources and the considered system is capable of sustainably generating required electricity demand over its lifespan, accounting for the ease of the scalability of the system to meet growing demand as well. Already understanding that an incorporation of diesel generators into the energy mix of a hybrid energy system would make the system relatively cheaper, Baghdadi et al. [11], also studied the feasibility and performance of a hybrid standalone wind–solar and fossil generator system, over short and long periods, for the electrification of rural areas of Algeria. The combination of the system was optimised for fuel savings. The renewable energy components of the system configuration contributed 69% of the electricity generated by the system, while the remaining 31% was compensated for by the fossil (diesel) generator [11].
In communities with a reliable supply of hydro energy, as is attainable in some areas of Malawi, the incorporation of this could lead to a cheaper hybrid energy system, in comparison to that attainable with hybrid systems comprising a fossil/diesel generator. As an alternative to fossil generators, Kenfack [8] modelled and studied the performance of a hybrid micro hydro–PV system for implementation in a Cameroonian community. Although largely feasible and suited for application in the area of study, the system configuration studied is subject to technical constraints, such as power synchronism and intermittency associated with system energy resources [8]. In addition, factoring in the energy resource potential and need to develop a low cost and sustainable hybrid energy system for electricity generation in remote areas in South Africa, Kusakana [12] modelled different hybrid system concepts, comprising of solar PV, wind turbine, diesel generator and hydrokinetics using HOMER simulation software. The results of the simulation show the hybrid systems with hydrokinetic and pumped hydro storage integrated better and offered lower net present costs in comparison to configurations without them, largely due to the abundance of hydro potential in the area of study. While developing hybrid energy systems that incorporate hydropower is a cost competitive approach, an approach that diversifies the country’s energy mix and reduces its reliance on hydropower, which currently represents more than 95% of its energy mix, would be more sustainable in the long term.
The inclusion of any of the energy resources—solar, wind or hydro—in hybrid system configurations aimed at electrifying Malawi is largely based on the availability of the resources in the community considered. Solar is, however, in abundant supply and, as such, often serves as a principal energy source in most proposed off grid energy systems for the electrification of Malawi. In order to increase access rates, academic research on feasible energy system configurations and governmental interventions to boost the penetration of integrated energy systems have seen an increase in the country in recent years. Eales et al. [13] assessed the solar, wind and hydro resources in the Dedza district of Malawi using a detailed options appraisal methodology and proposed the incorporation of Pico Solar Products (PSP), Solar Home systems (SHS), Solar PV, micro hydro, and small wind turbines into the energy mix of the Dedza district, to boost the rate of electrification within the district. Zalengera [14] investigated the techno–economic feasibility of integrating solar PV and wind turbines for electricity generation on Likoma Island, Malawi—an island fully powered by diesel generators. The results of this analysis present a case for the possible inclusion of the hybrid PV–wind system into the energy mix of Likoma island, for a more sustainable and reliable electricity generation coupled with the added advantage of cost savings and reduced dependence on the already existing diesel generators, which compromise air quality due to high release of CO2. A repertoire of literature exists on the technical performance and economic feasibility of hybrid energy systems in providing reliable electricity to unelectrified sub-Saharan states. The papers highlighted in the review prove that the generation of affordable electricity is possible using decentralized, off grid, hybrid energy systems. Systems capable of integrating diesel generators or hydro technologies offer a more reduced cost of energy in comparison to systems without them. As such, most hybrid energy systems in sub-Saharan Africa usually comprise of one or both of these technologies.
Despite the promotion of decentralized, off grid energy solutions as an appealing approach to electrify remote areas in Malawi, there still exists an enormous insufficiency of credible reports and publications on its suitability and performance in Malawi. This paper is, therefore, focused on contributing to mitigating this gap.

2. Methodology

This study estimated the electrical load of a suitable site, Machinga Boma, with coordinates 15°10.2′ S, 35°18.0′ E. The proposed off grid energy systems were based on the solar irradiation, wind speed levels, and diesel fuel price of the study location. The design of the hybrid energy system was performed using HOMER Pro microgrid simulation software. HOMER Pro [15] is a microgrid simulation software developed by National Renewable Energy Laboratory (NREL) and capable of designing both grid connected and off grid power systems. In the design of a power system, decisions of the components to use, size of the components and cost of components are important and, often due to the considerable number of possible configurations of available energy conversion technologies, such decisions become complicated. HOMER pro makes it easy to evaluate several off grid system configurations and provides the system designer the option of evaluating the suitability of the designed system for the specific cases. The decision of an optimal system in HOMER is on a technical and economical basis, using inbuilt optimization and sensitivity analysis algorithms.

2.1. HOMER Mathematical Model of System Components and Dispatch Strategies

2.1.1. Solar PV Component Model

HOMER uses temperature and solar irradiation data (2.3.1) to model the power output of solar panels. The power output from the solar PV panels is calculated using Equation (1).
P = Y f ( G t G t , s t c ) [ 1 + a p ( T c T c , S T C ) ]
where P represents power output from solar PV, Y is the power output under standard test conditions (STC), f is the derating factor (accounting for losses in PV output), Gt is incident solar radiation on PV panel in current time step, Gt,STC is incident solar radiation on panel at STC, ap is temperature coefficient of power, Tc and Tc,STC represent the temperature of PV cell at current time step and at STC, respectively [16]

2.1.2. Wind Turbine Component Model

The power output of a wind turbine is calculated using linear interpolation at different intervening points on a turbine’s power curve. HOMER calculates the power output of a wind turbine by first attaining the hub height wind speed at standard temperature and pressure (STP) using the input wind resource component and wind turbine power curve. The STP values are then adjusted to actual, site specific conditions by applying a density correction. Mathematically, the output power of a wind turbine is calculated according to Equation (2) [17]
P W T = ( p p 0 )   P W T , S T P
where p and p0 are actual air density and air density at STP and PWT and PWT,STP are actual wind turbine output power and output power at STP, respectively.

2.1.3. Diesel Component Model

Considering the intermittency associated with renewables, incorporation of diesel generators in hybrid power systems model is often to function as backup power supply. A diesel generator model in HOMER is characterized by its efficiency and fuel consumption. Mathematically, fuel consumption of a diesel generator from [18,19] is defined by Equation (3) as:
Fd = (aTd + bPd)
where Fd, Td and Pd represent the diesel generator fuel consumption, rated capacity of the generator and power output of generator, respectively. The coefficients a and b are obtained from the linear fuel consumption curve. They represent fuel curve intercept, i.e., the no load consumption of a diesel generator divided by the rated capacity of the generator, and the fuel curve slope, which represents the marginal diesel consumption of the generator, respectively.

2.1.4. HOMER Power Management and Dispatch Strategies

Dispatch strategies are important for hybrid energy systems comprising of generators and BESS, as it dictates how baseline load is met and battery bank is charged. For an optimal performance of the modelled hybrid energy system, the most common dispatch strategies used are the cycle charging and load following dispatch strategies.
Cycle charging (CC) allows a (diesel) generator to run at full capacity and surplus power from the generator performs low priority objectives, such as charging of battery banks. This dispatch strategy performs optimally in systems where no renewable energy resources are required [17]. Under the load following (LF) strategy, when a generator is required, it only produces enough power to meet primary load. Low priority objectives, such as battery bank charging, are left to the renewable sources in the configuration [17]. LF is optimal in systems where renewable power generated sometimes exceeds load [17].

2.2. Community Load Estimation

2.2.1. Household Load Estimation

According to the 2018 Census report of Malawi [20], the population of Machinga Boma is 1833. The average household size in Machinga district is 4.5 [4], hence, the total number of households in Machinga Boma is estimated to be 400. The typical Malawian household appliances include radio, stereo, and television [13]. The community load profile generated is based on typical energy consumption patterns of sub-Saharan African communities and guided assumptions made based on literature [13,21,22]. In this paper, an average household is assumed to have three rooms: two bedrooms and a living room comprising; an 80 W rated power television, 50 W sound system (stereo), two electric fans each with a rated capacity of 80 W, and seven units of 20 W LED light bulbs. The possibility of the existence of other household appliances outside the mentioned appliances exists, therefore, an additional 100 W is considered to account for any other household appliances.

2.2.2. Nonhousehold Load Estimation

Existence of nonresidential loads is expected and, as such, the estimation of nonresidential community load is as follows. Typically, about 86% of load consumption in a community is accrued by households in Malawi, making nonhousehold consumption 14% [23]. For this paper, the nonresidential load of the reference community is assumed to be 11% of the total community power consumption. Based on this, the total nonresidential load consumption of the community is 23.5 kW, and time of use of this load is distributed between 07:00 to 23:00 daily.

2.3. Community Energy Resources

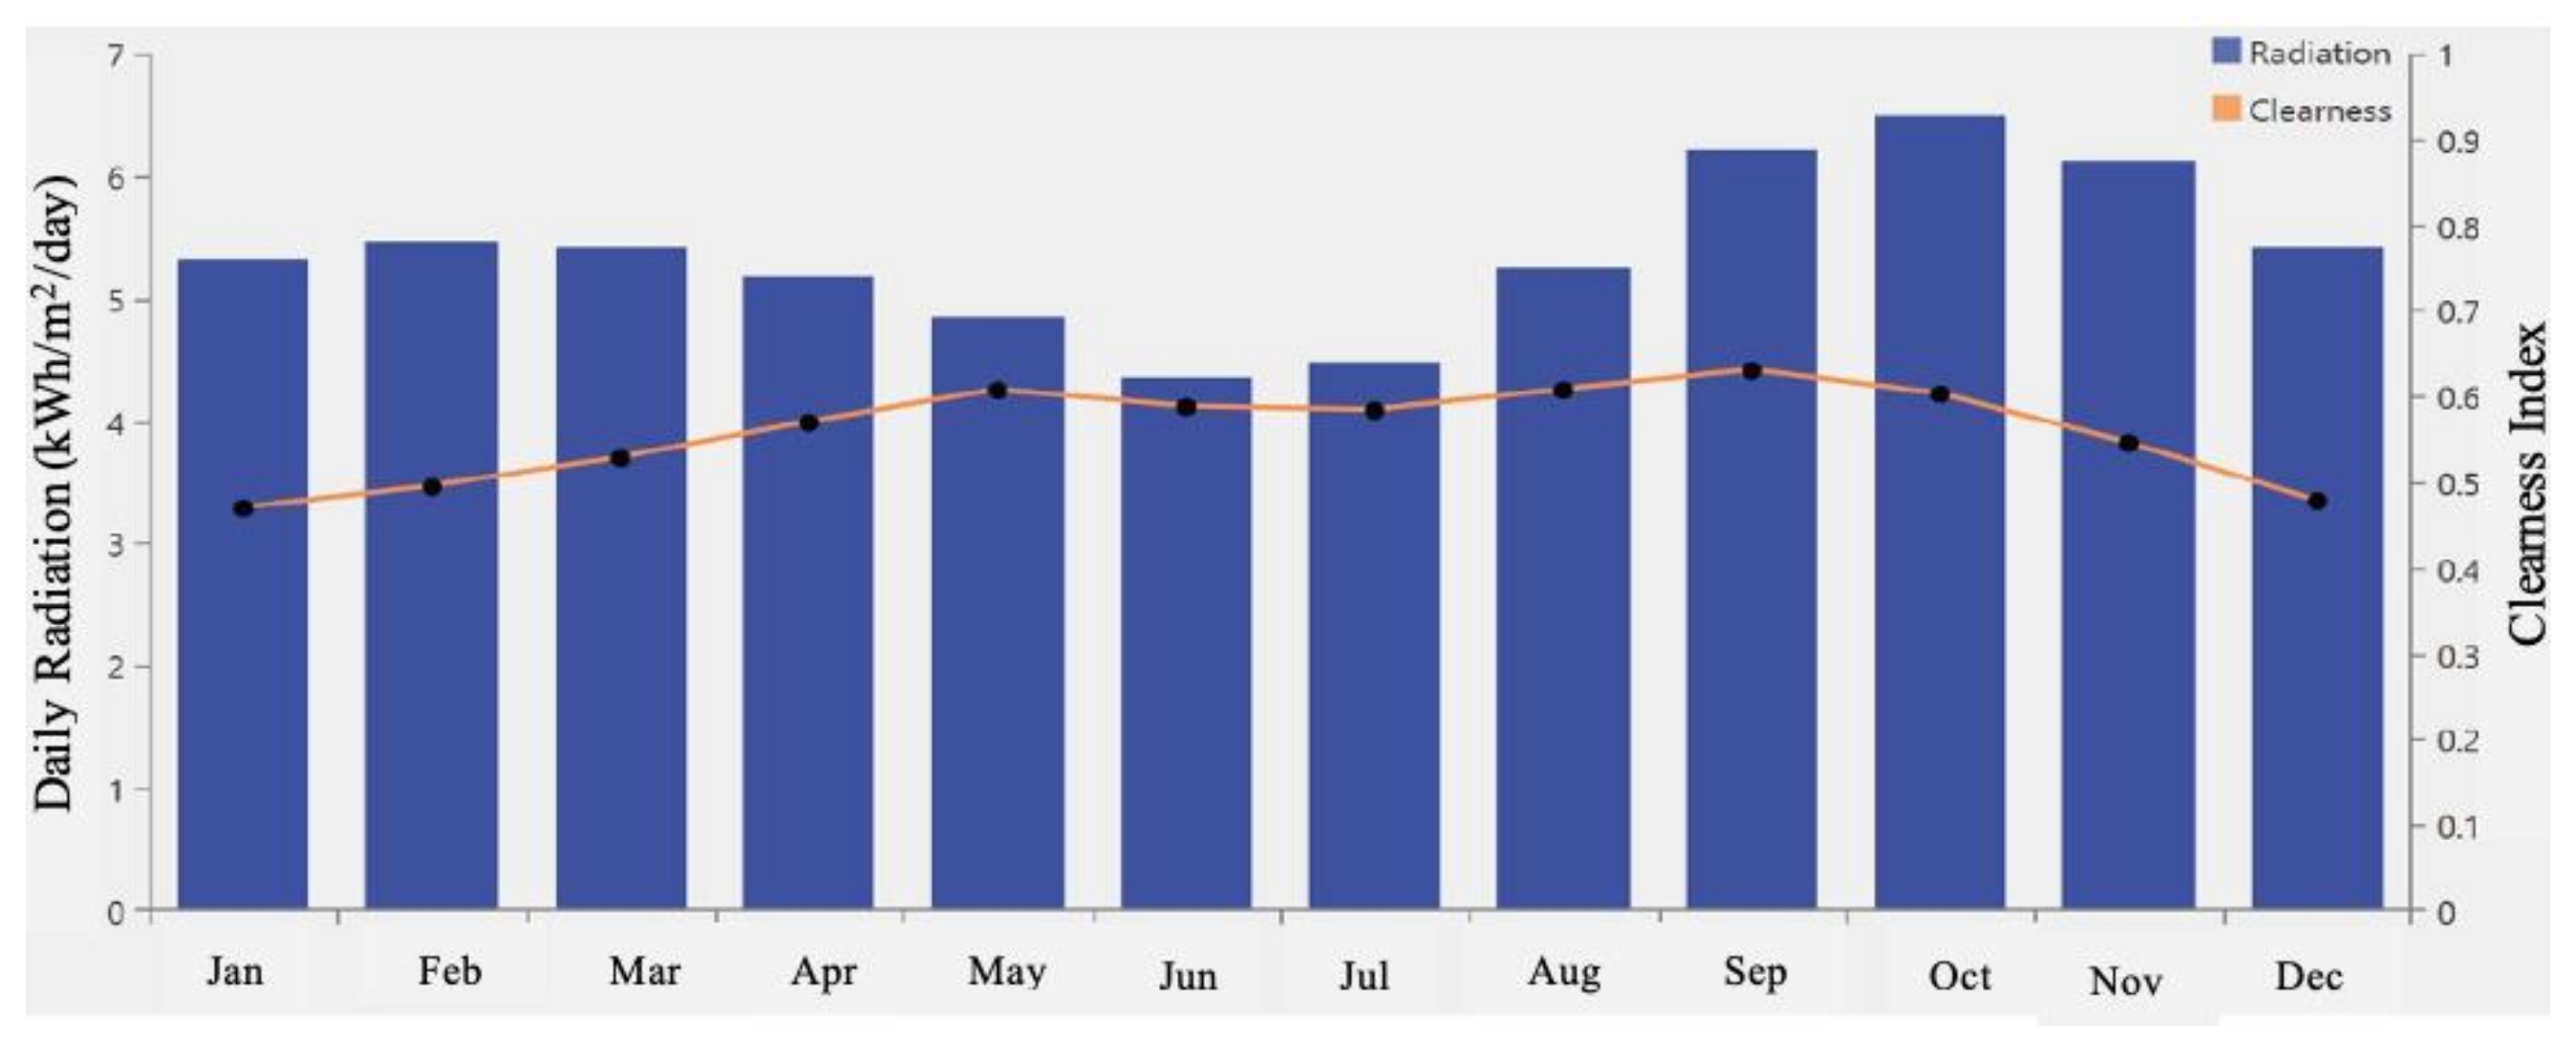
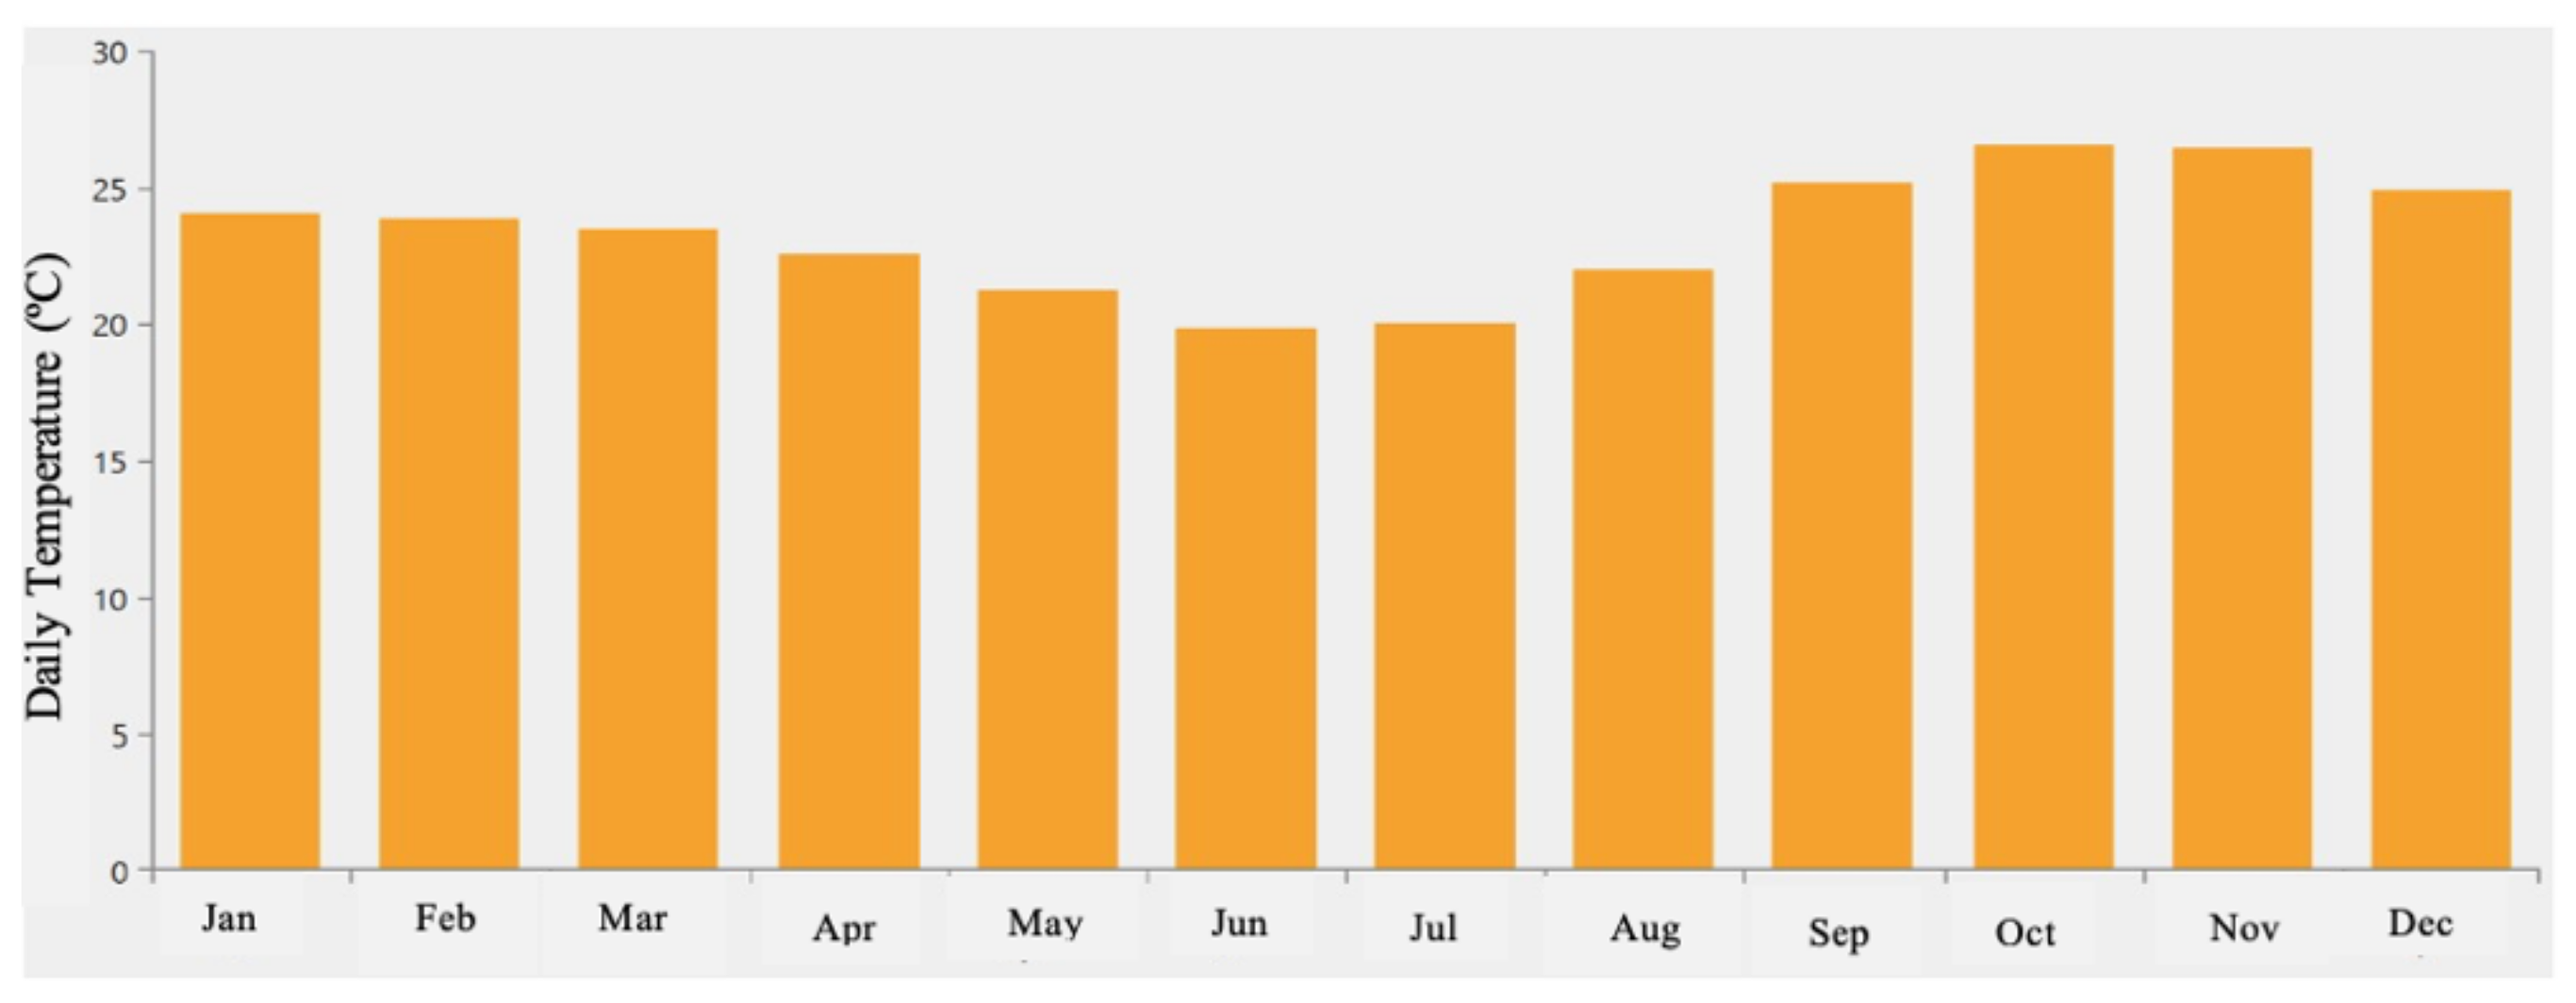
2.3.1. Solar Irradiation and Temperature Data

The monthly global horizontal irradiation (GHI) and temperature data input of the study area are averaged values over a 22-year period, obtained from the NASA surface meteorology and solar energy data base [24]. Global horizontal irradiation is an important criterion in determination of the performance of solar photovoltaics. On HOMER, site specific global horizontal irradiation is superimposed with clearness index, a dimensionless number between 0 and 1 that presents a measure of the degree of clearness of the atmosphere. The clearer and sunnier the day, the closer the clearness index is to unity. Essentially, the clearness index is an indication of the cloudiness of the day—higher clearness index indicates a less cloudy day, and vice versa. Solar yield from solar panels is proportional to the direct irradiation received by the panel surface, as such, the clearness index is a useful indicator of the fraction of diffused or direct radiation a solar panel would receive, subject to the cloudiness of the day. Figure 2 provides a visual representation of the average monthly global horizontal irradiation and clearness index of the Machinga community, both of which are seen to be least during the rainy season in Malawi, which occurs from November to April, and increases in the dry season, which is characterized with a clearer sky. The annual average solar irradiation of the Machinga Boma is 5.38 kWh/m2/day.
The temperature of Machinga typically ranges between 19 °C to 26 °C, and the minimum temperature of the community occurs in June/July while the community’s maximum temperature of 26 °C occurs in October/November. The average monthly temperature data of the study area is shown in Figure 3.

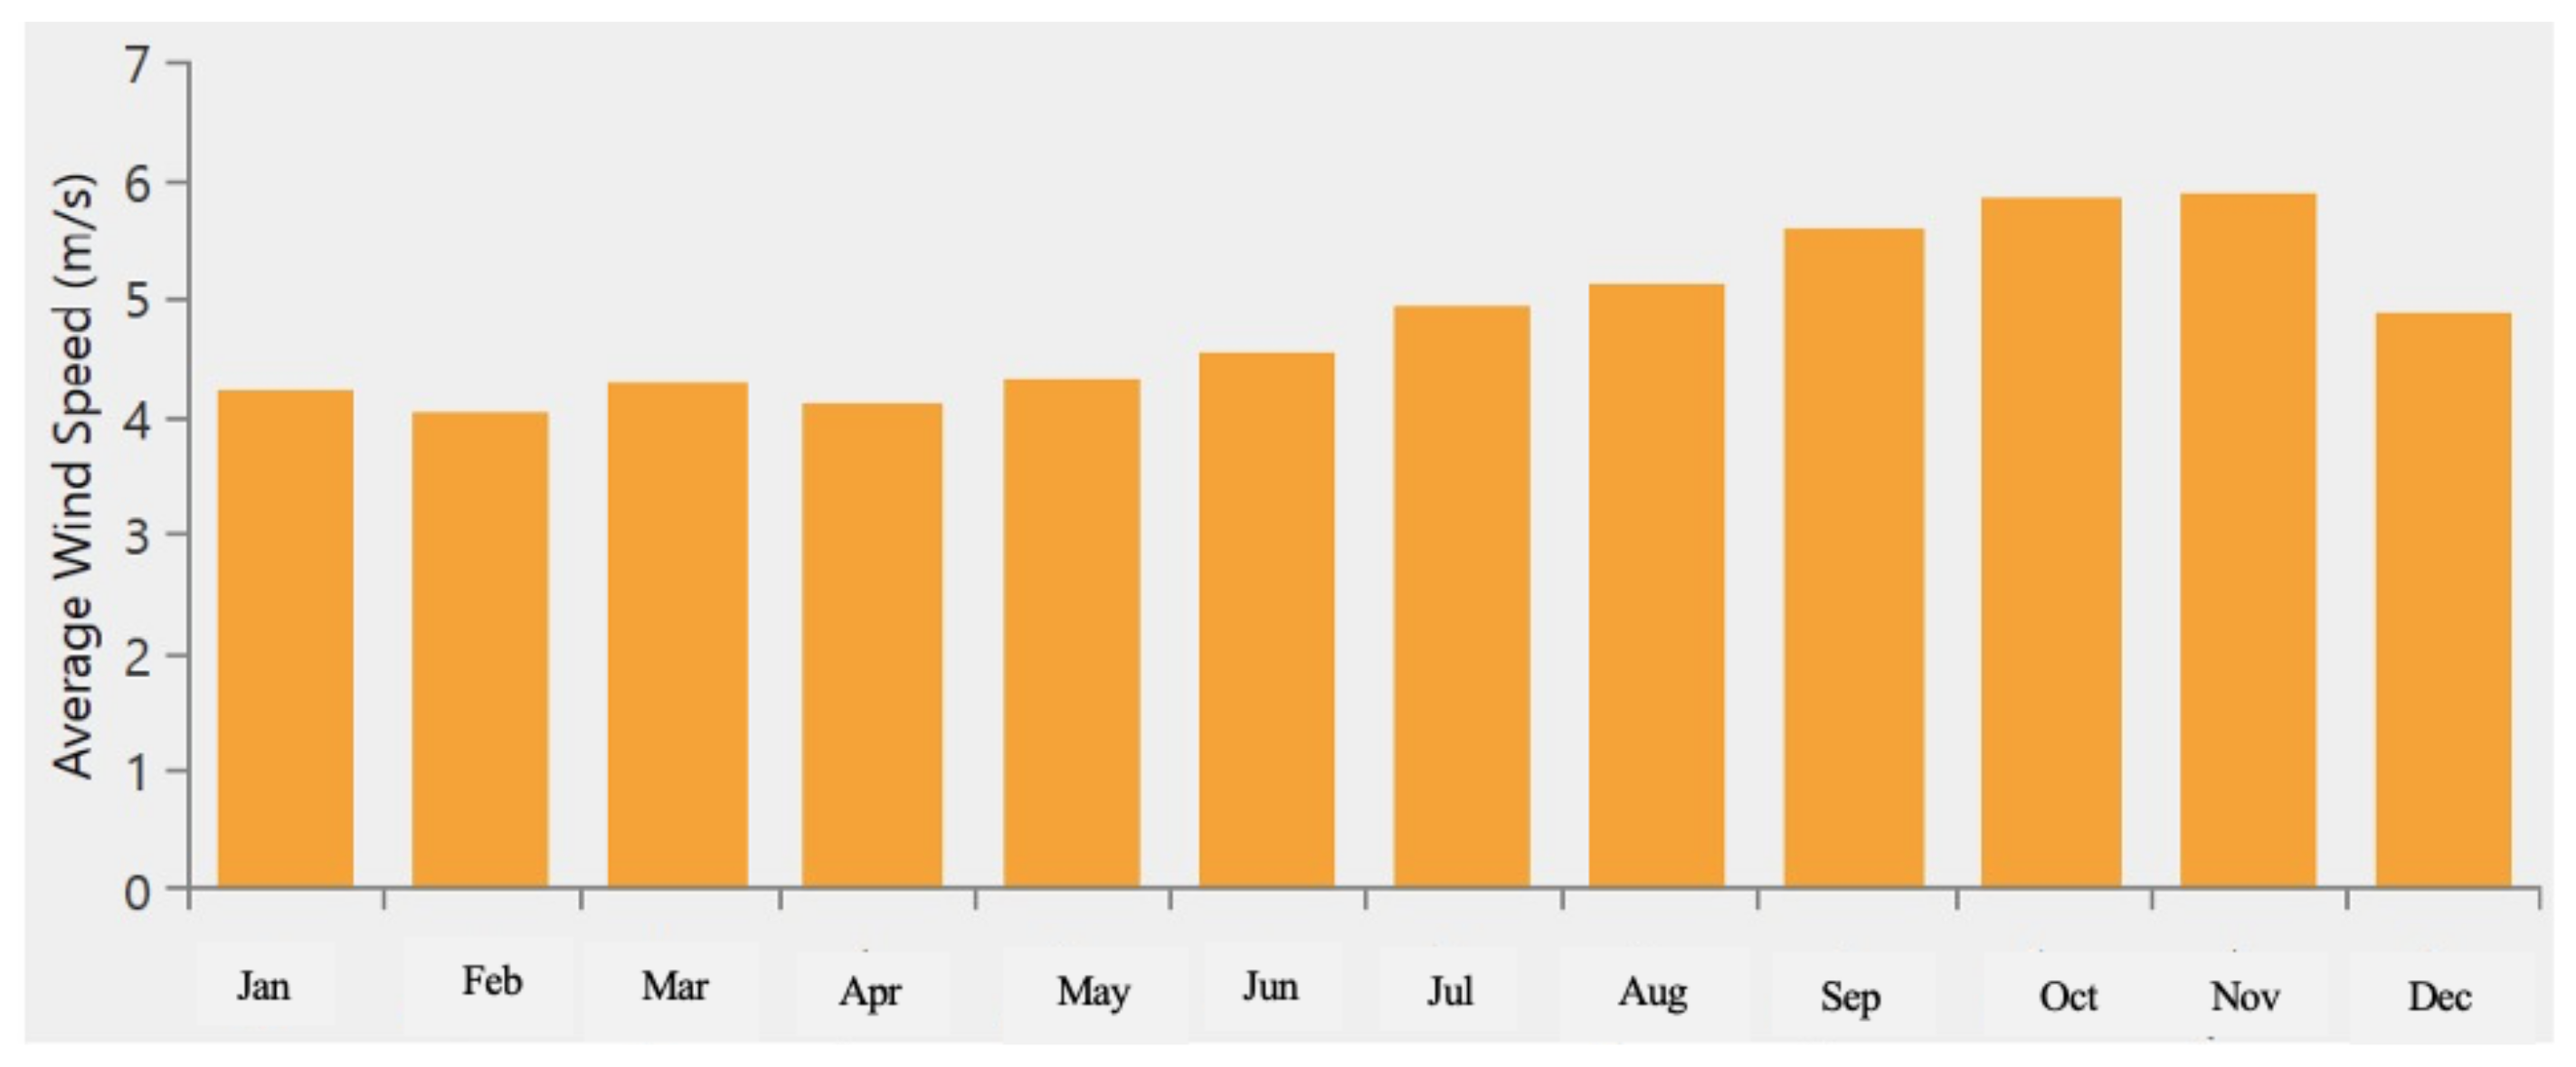
2.3.2. Wind Energy Resource

The monthly averaged wind speed for Machinga Boma is also obtained from the NASA Surface meteorology and solar energy data base [24]. The wind measurements are taken at a hub height of 50 m over a 10-year period. Figure 4 displays the average wind speed in m/s over Machinga Boma. The average wind speeds are seen to increase steadily from May, and peak in October and November, which marks the start of the rainy season.
Based on the resource data presented in Figure 4, the mean annual wind speed for Machinga Boma is 4.81 m/s. This is used as the base design wind speed value.

2.3.3. Generator Fuel

According to Malawi Energy Regulatory Authority, diesel price in Malawi is $1.25/L [25]. Considering the familiarity of this fossil fuel resource in Malawi, a diesel generator component is included in the proposed configurations to serve as backup power supply.

2.4. Proposed Hybrid Energy System Configuration, Design Constraints, and Simulation

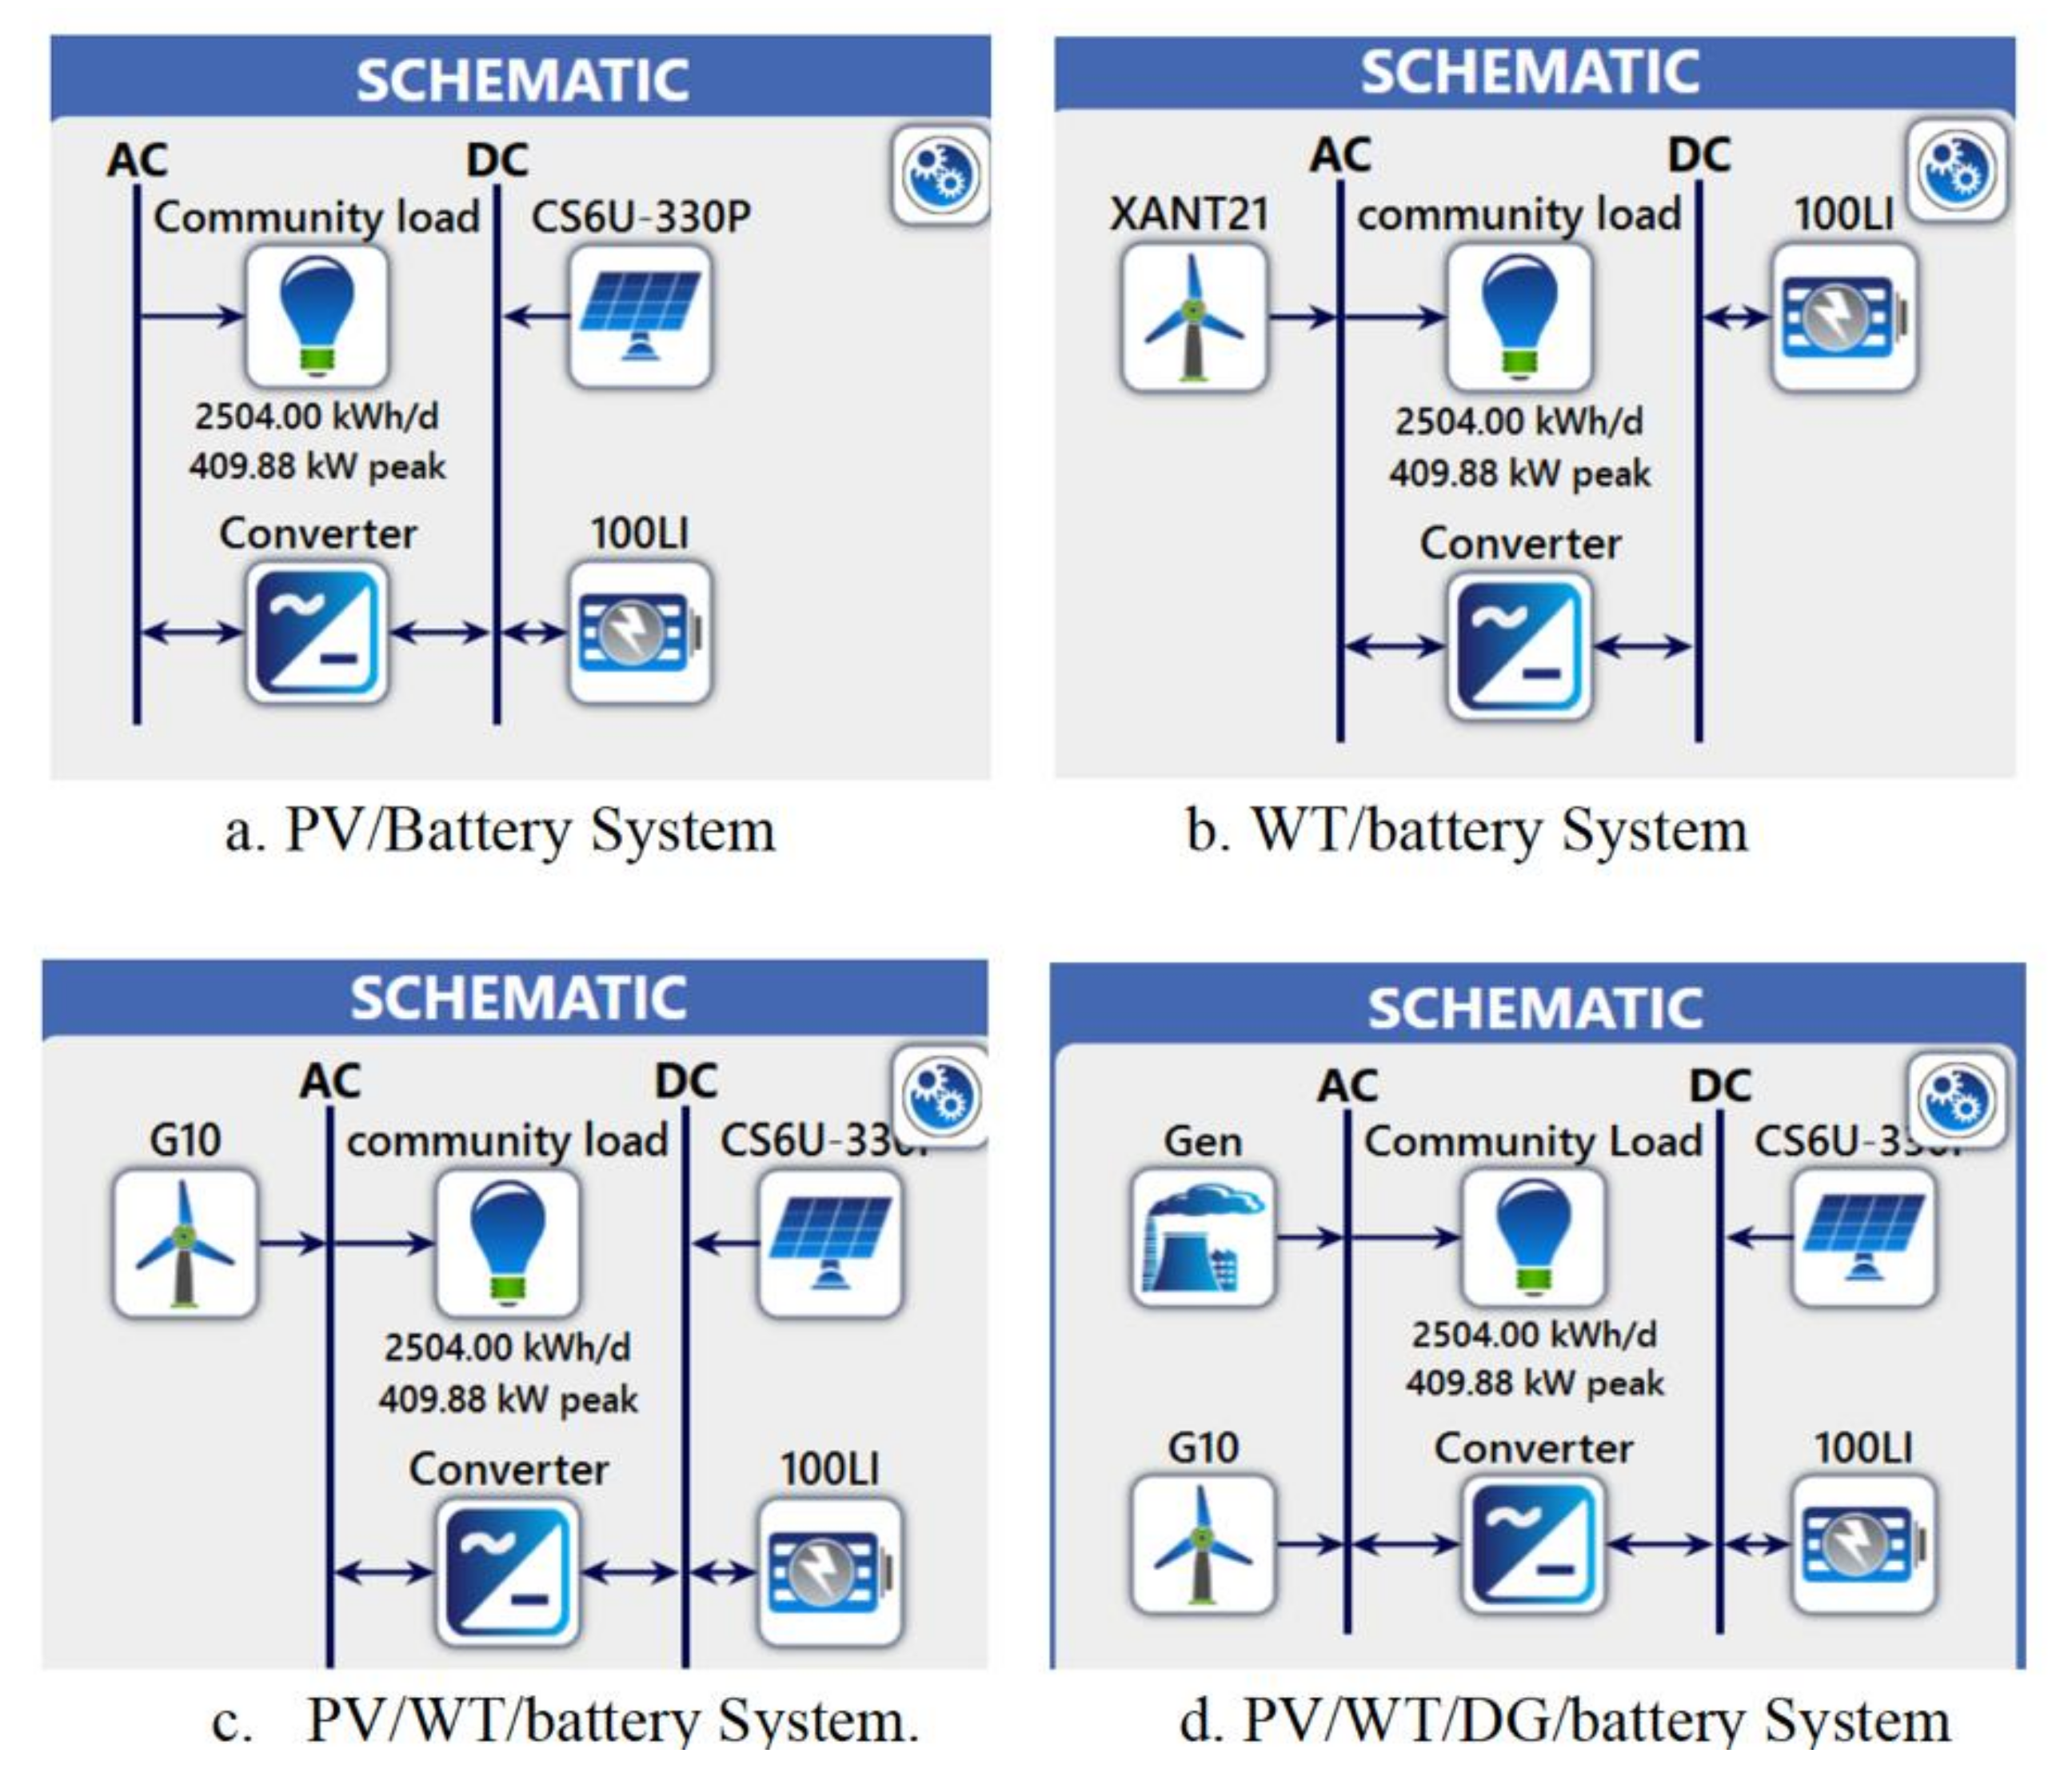
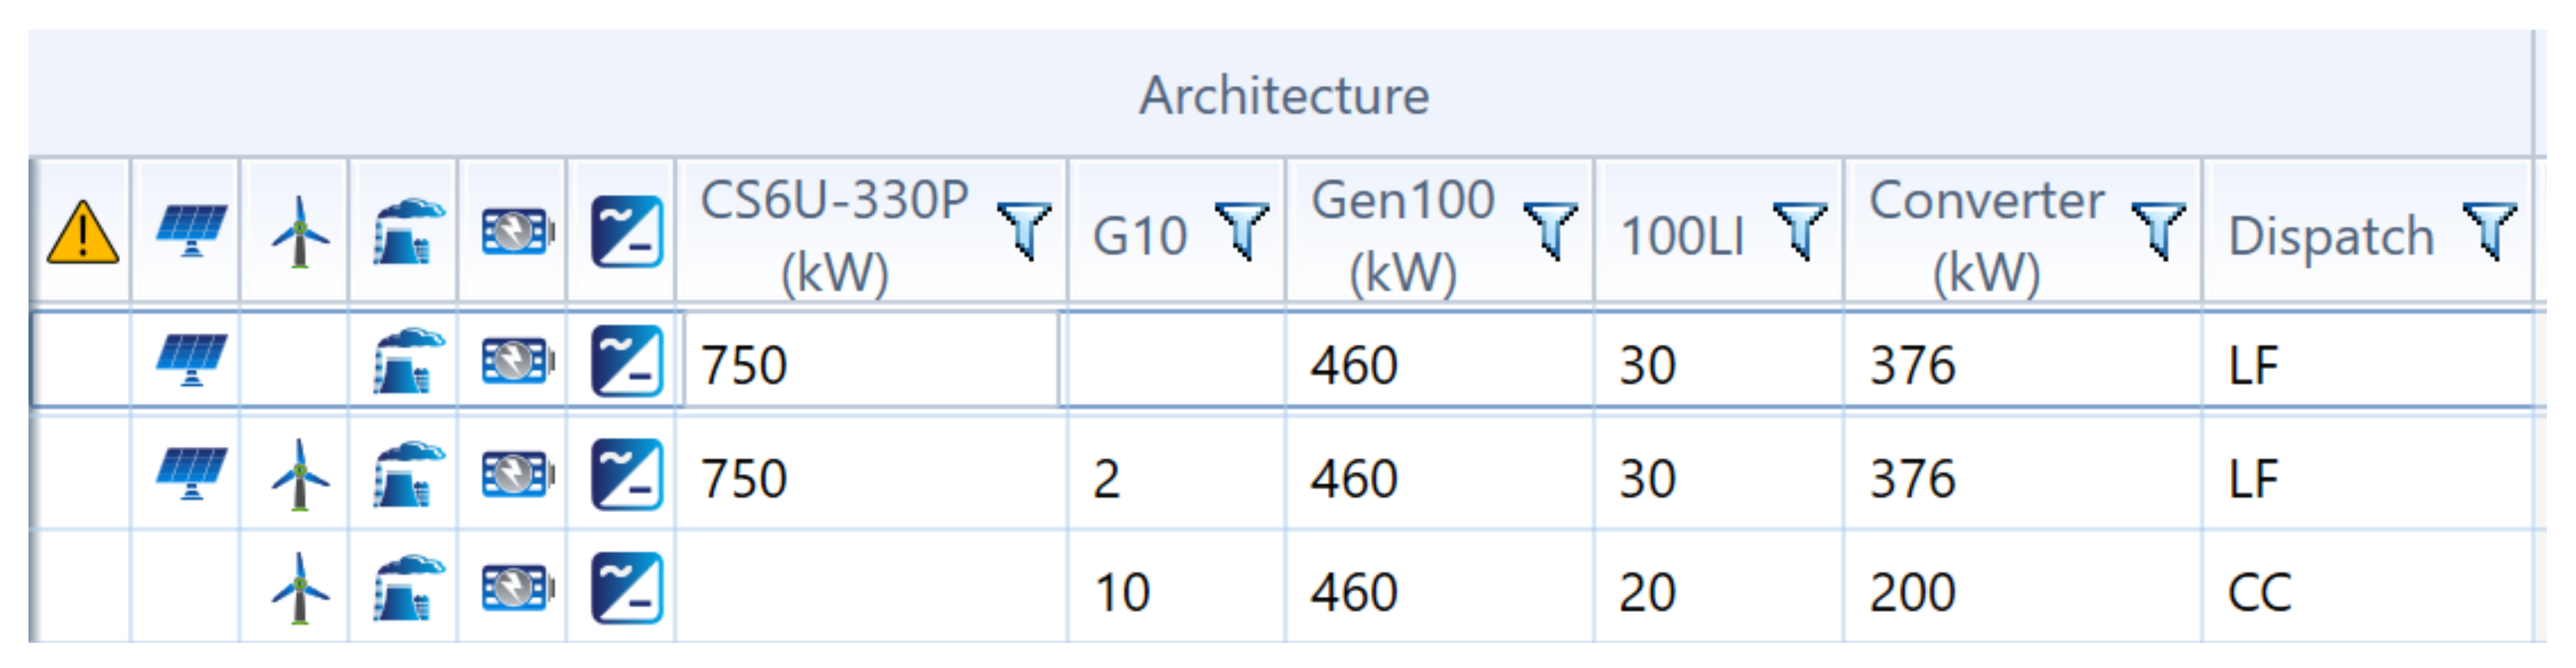
2.4.1. System Configuration

Considering the availability of solar, wind and the familiarity of fossil fuel resources in Machinga Boma, the proposed hybrid energy systems comprise of solar, wind and diesel energy resources modelled under off grid conditions. The system components include a bidirectional converter for conversion of alternating current (AC) to direct current (DC) and DC to AC, wind turbine (WT), diesel generator (DG), solar PV panel (PV) and lithium-ion battery. Five combinations of the system components are explored and simulated, namely, PV/WT/battery/WT/DG/battery, PV/battery, WT/battery, and DG only system, as shown in Figure 5.
The combined capacity of the Solar PV module, diesel generator, wind turbine, battery, and converter are simulated over the following search values; 0–800 kW, 0–500 kW, 0–2 units, 0–30 units and 0–376 kW, respectively, to attain an optimum configuration suited for serving the electrical load over the 25-year system lifespan.

2.4.2. Input Component Specifications and Cost

The cost specification of system components is crucial, as the optimal system is the least cost system that satisfies the imposed technical constraints. The major cost parameters required for each system component are capital cost, replacement cost, and operation and maintenance costs, all of which were inputted in US dollars prior to system simulations.

Solar PV Component Specifications and Cost

The solar PV panel used for the simulation is a 330 Wp polycrystalline Canadian Solar panel (CS6U-330P). The panels are ground and fixed mounted with no sun tracking technology considered. The PV module orientations used are as follows: panel slope of 15.17° and panel azimuth (West of South) of 180°. Cost components, which include initial cost (including capital cost of component, transportation, and installation cost), replacement cost and operation and maintenance cost of the panel, are important for the system simulation. The initial and replacement cost are assumed to be the same, and based on the $1257.86 per kW initial PV panel cost estimate proposed by Zalengera [14] for Likoma Island, Malawi; the initial capital and replacement costs of the CS6U-330P panel is taken to be USD 1250. Considering the minimal maintenance costs associated with PV panels, this cost component is assumed to be USD 10/year.

Wind Turbine Component Specifications and Cost

The wind turbine used for the simulation is modelled with an AC output, a rated capacity of 10 kW, 20 year lifespan and a hub height of 50 m. Comparing market prices and the cost per kW of wind turbine proposed by Zalengera [14], the wind turbine’s initial capital cost per kW is USD 4000, with a replacement cost of USD 3200 per kW, 60% of the capital cost and an annual operation and maintenance cost of USD 500/unit.

Diesel Generator Component Specifications and Cost

Factoring in the peak electrical demand of the community and potential for load growth, the generator component is sized to be 460 kW. The initial capital cost and replacement cost of the generator are taken to be the same, and set at USD 400 per kW, and an operation and maintenance cost of USD 0.02/operating hour. Currently, the cost of diesel in Malawi is about 924 Malawian Kwacha (MWK), an equivalent of USD 1.25/L. This value is set as the base diesel price. The possibility of an annual fluctuation in the diesel price is factored in during the multiyear system analysis

Converter and Battery Component Specifications

Lead acid and lithium-ion batteries are some of the most used BESS for hybrid energy systems in the sub-Saharan region. For this project, a 100 kWh lithium-ion battery with 600 V nominal voltage, 90% round trip efficiency and a life span of 15 years, is considered. The higher energy storage density and useful lifespan of lithium-ion batteries is the major consideration in the selection of this battery. The load type considered for this project are only AC loads. The solar component of the system configuration outputs DC, while the other components, wind and diesel genset, output AC, which is suitable for the AC loads. However, a BESS is included in the system configuration and, as such, there is a need for bidirectional converter/inverter for proper voltage conversions. A summary of the technical specifications is given in Table 2.

2.4.3. System Constraints and Power Dispatch Strategy

The operating life span of the hybrid energy system is set to 25 years. To ensure a reliable simulation, the maximum unserved load constraint is set as 0%. This means only systems capable of meeting 100% of the estimated community load are considered. In addition, factoring in the possibility of an unprecedented rise in demand over the life span of the system and the intermittency associated with renewables, operating reserves are considered.
Operating reserve is surplus operating capacity of a power system; this ensures reliability of electricity supply, should an unprecedented rise in load or fall in renewables output occur [17]. The load in current step is set at 10%, to cater to any unprecedented rise in peak demand. The solar power output and wind power output are set at 25% and 60%, respectively, to ensure optimal performance of system and supply to load, should a decrease in output of renewables generators by the respective percentages occur. The variability associated with wind is higher than solar, hence necessitating a higher value for the wind power output. The major dispatch strategies considered for the systems simulation are cycle charging (CC) and load following (LF), and the justification for the use of these dispatch strategies is that they are sufficient and offer a robust degree of power dispatch mechanism that is within the scope of the research. Under normal operation of the modelled hybrid system configurations, electrical load is met primarily by the renewable energy sources, and the excess electricity generated is stored in the battery energy storage system (BESS) and dispatched based on demand. The primary purpose of the generator included in the hybrid system configuration is to function as a guaranteed power backup in a scenario of poor yield from solar PV component or low battery bank supply capacity.

2.4.4. Simulation Sequence

The first set of simulations is performed on a single year basis using HOMER optimizer function, to determine the most preferred system combination based on a number of parameters, top of which are the ability of the system to;
  • meet an unserved load constraint of 0% and,
  • offer the least cost of energy.
The results obtained from the multiple systems simulations of the schematics shown in Figure 6 are compared against one another on a cost of energy basis, and the most preferred system (system 4) is simulated in more details using the HOMER multiyear analysis function. Multiyear analysis function enables the calculation and study of the impacts of parameters, such as annual components degradation, diesel price fluctuations and load growth on system performance over the 25 years system life span. Global PV annual degradation value ranges between −0.4% to −2.0% [26]. Based on this and the Canadian solar polycrystalline module performance warranty, the annual PV degradation of the CS6U-330P PV panel used for the simulation is −0.7%. The values of annual load growth and annual diesel price fluctuation percentages considered in the simulation are 0.5% and 1%, respectively. The value for diesel fuel price fluctuation is kept conservative, and serves only to demonstrate any possible effects of a change in this parameter on the system’s operation.

2.5. Sensitivity Analysis

A sensitivity analysis on the impact of a variation of solar irradiation and wind speed on the operational behaviour of the system is taken into consideration. The sensitivity analysis on wind speed and solar irradiation variation is performed at 30% of average/base design values to model scenarios of low availability, mean resource availability and high resource availability. The wind speeds considered are 3.36 m/s, 4.81 m/s and 6.25 m/s, and the solar irradiation considered are 3.76 kWh/m2/day, 5.38 kWh/m2/day and 6.99 kWh/m2/day.
Additionally, the optimal hybrid system includes a diesel generator, and the impact of a change in base diesel price, from USD 1.25/L to USD 1.92/L and USD 3/L, on overall system performance and cost of energy is considered. The system’s efficiency is also largely dependent on the system’s ability to meet a specified electrical load. For this reason, a sensitivity analysis on the system’s ability to accommodate load growths outside the base design annual load growth of 0.5%, is also considered. The annual load growths explored include 0% (no annual load growth), 1.5% and 2.5%.

3. Results Analysis and Discussion

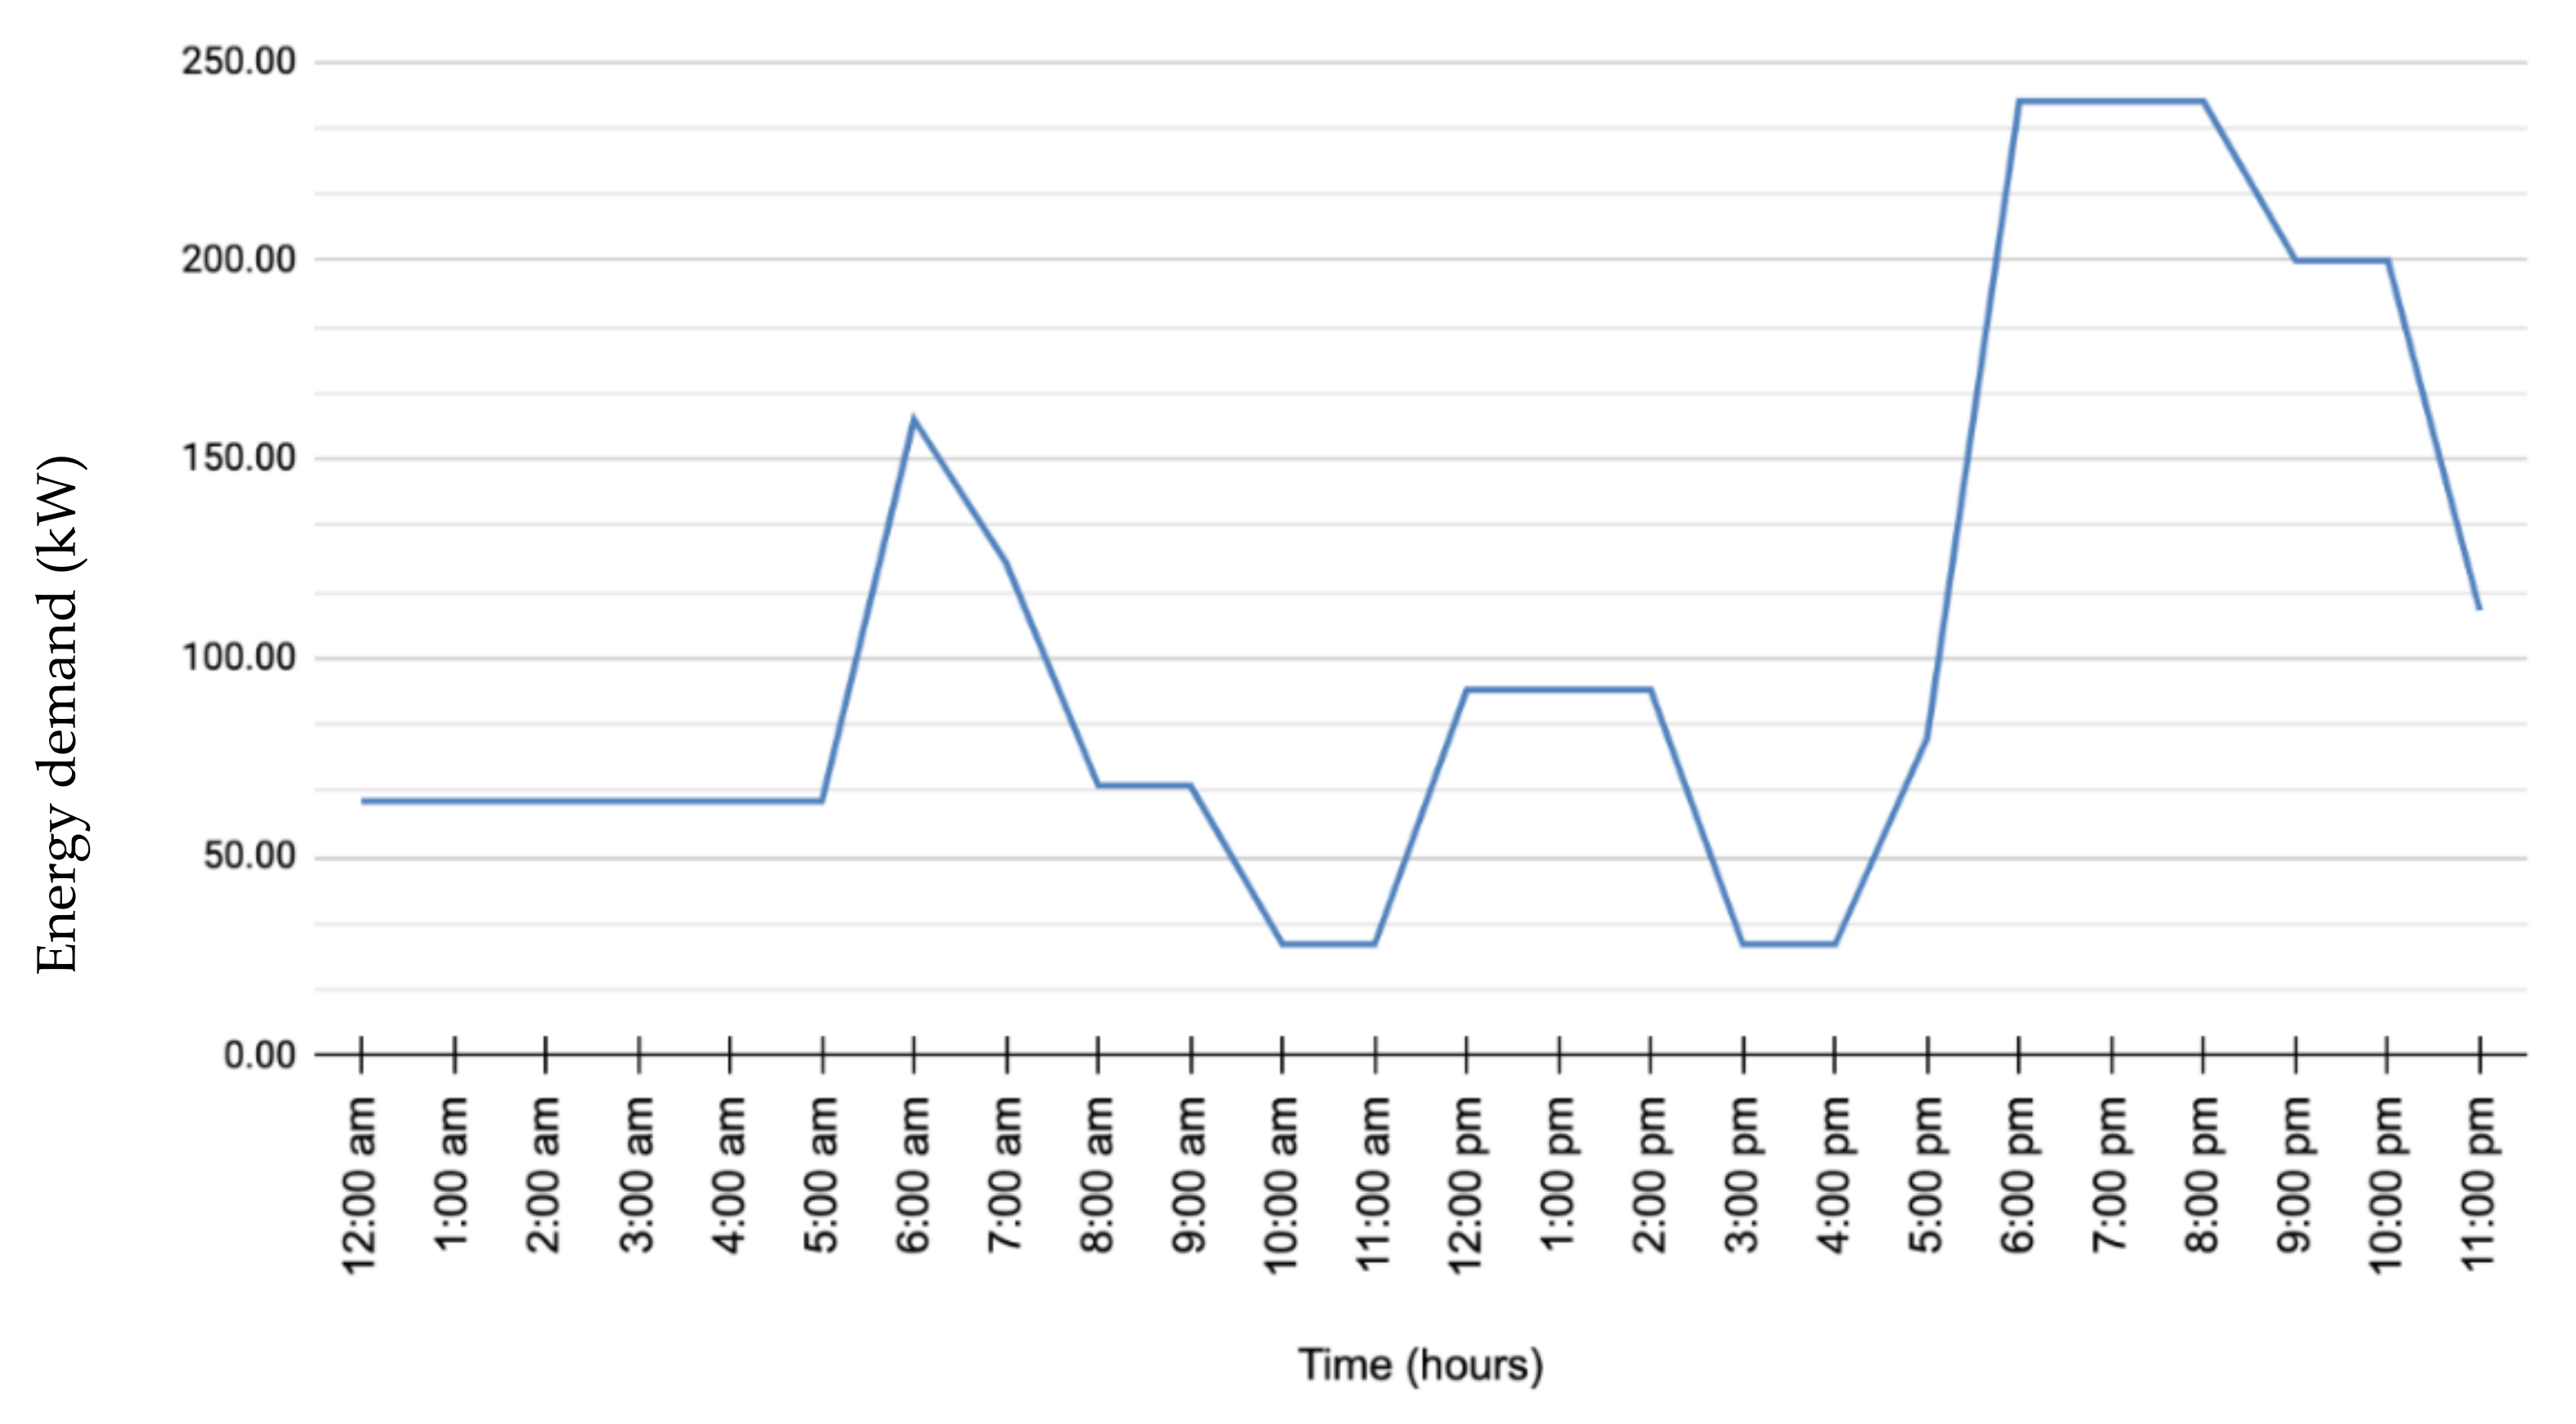
3.1. Load Profile and Hourly Consumption

Based on the assumptions for household and nonhousehold energy demand in 2.2, an average household load is 530 W and the summary of the rated capacities and assumed time of the use of household appliances are presented in Table 3. The overall community load profile is displayed in Figure 6.

3.2. Single Year Analysis

On a single year basis, the simulation of the five proposed combinations of solar PV, wind turbines, diesel generator and battery components are performed to select the most optimal and preferred system configuration. The results presented in Table 3 are a summary of all the optimum system configurations attained from the simulation of the schematics shown in Figure 6.
From Table 4, system 4, comprising of PV, wind turbine, diesel generator, and battery storage, offers the lowest cost associated with electricity generation. This is expected, especially considering the application of this hybrid energy system configuration is widespread in rural electrification attempts in sub-Saharan Africa. System 2, comprising of wind turbine and battery storage, has the highest cost of energy (COE). The decision of the most preferred system is made based on the system cost of energy. In reality, the acceptance of an energy system is largely dependent on its cost of energy, i.e., cost per kWh of energy generated by the system, and considering the overall cost of any selected system would potentially affect its energy tariff unless subsidized; the system offering the least cost of energy should be more preferred. Each of the system types presented in Table 4 is capable of meeting baseline electrical load sufficiently but, considering cost effectiveness, system 4 offers the least COE and, as such, is selected as the preferred site specific optimum system configuration.

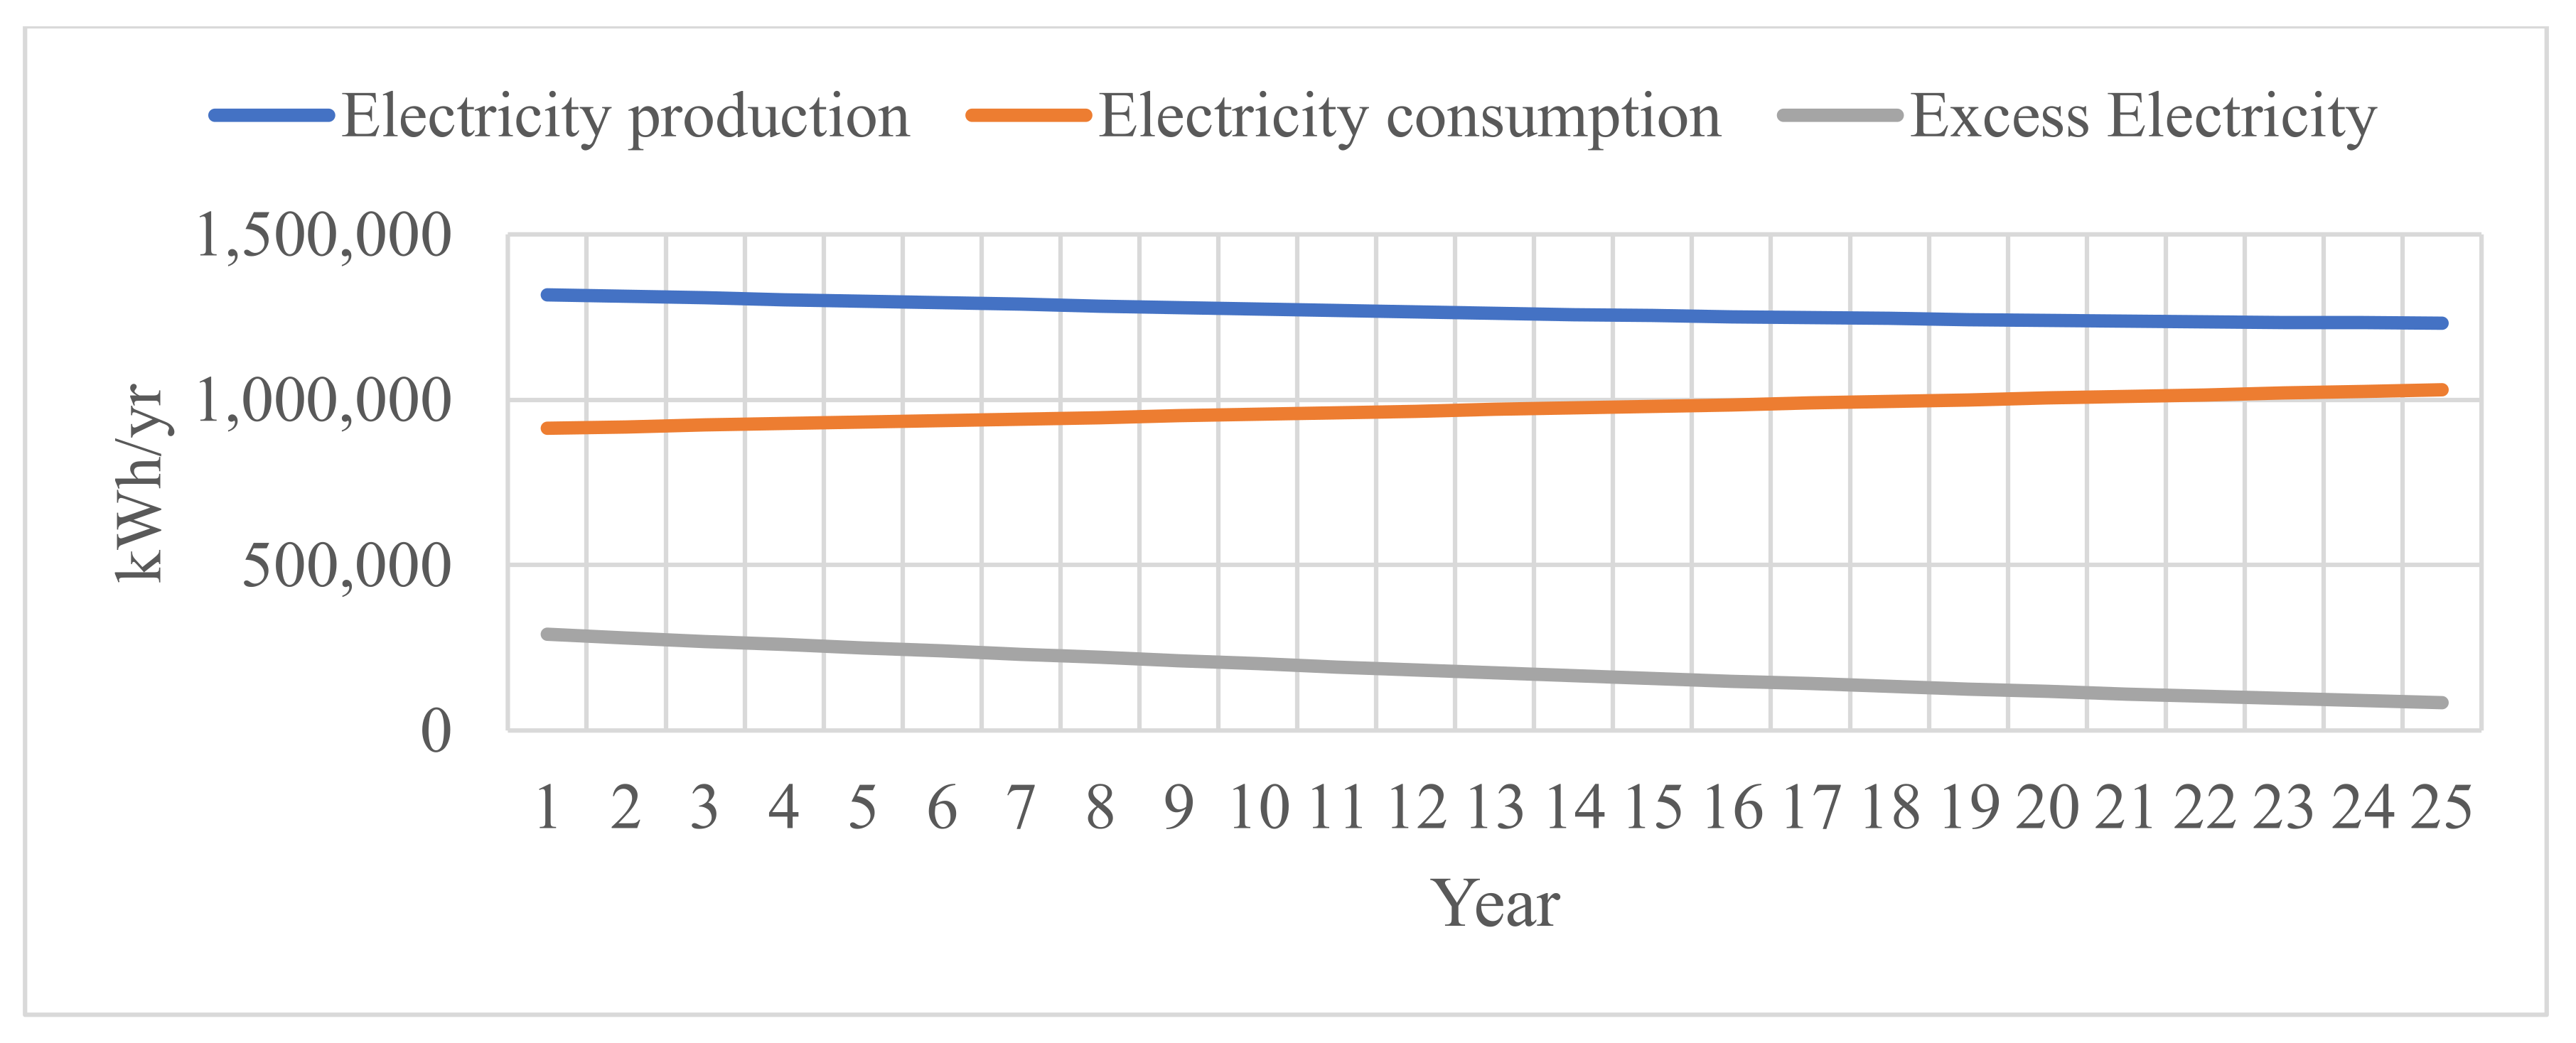
3.3. Multiyear Analysis

The single year simulation was to decide the most preferred hybrid system combination from a number of options. It ignores the possibility of annual load growth, the degradation of system components and fluctuations in diesel price over the full system lifespan, hence, necessitating a multiyear simulation of the hybrid systems, which factors in all these and presents a more realistic performance of the hybrid energy systems. Rerunning the system 4 configuration by enabling the multiyear analysis function gives the results shown in Figure 7 and Figure 8.
From Figure 7, the preferred system configurations are PV/DG/battery, PV/WT/DG/battery, and WT/DG/battery, in descending order. Based on the results of the multiyear analysis, the preferred system 4 configuration, PV/DG/battery, comprises of 750 kWp PV array, 460 kW diesel generator and 3000 kWh of battery storage (30 units of 100 kWh BESS) operating with a load following (LF) generator dispatch strategy. The overall renewable fraction of the system is 87.6% and the annual electricity production, consumption and resulting excess energy of the system is shown in Figure 8.
Considering the multiyear simulation is adjusted for a 0.5% annual load growth from the second year, the electricity consumption of the system is seen to increase on an annual basis from the second year. As expected, also, the electricity production of the system falls over the years due to system components degradation. Despite these constraints, the system sizing allows no capacity shortage, leading to unmet electrical load over the full 25-year period. Excess electricity is also observed to exist, and an approach to dealing with the excess electricity generated by the system would be to ramp up the battery bank capacity to store more of the excess electricity generated. The Li-ion battery component contributes the most to the overall system cost and, as such, increasing battery storage capacity would, consequently, increase the hybrid system’s cost of energy from the obtained value of USD 0.339/kWh. A second alternative is a microgrid proposition, which would entail channelling the excess electricity into powering a neighbouring community in the Machinga district, as conventional grid presence is predominantly unavailable in the region.

3.3.1. Solar PV and Diesel Generator Performance

The initial renewable fraction of the system in the first year of operation of the system is 92.1%, however, in subsequent years, due to degradation and reduced performance of the renewables component, the monthly reliance on diesel generator in serving load increases and, at the 25th year, the renewable fraction of the system is 82.6%. The reduction in performance and output capacity of the solar PV component results in an increased dependence on the diesel generator (DG) in subsequent years. This, therefore, makes the fuel consumption rate of a diesel generator an important consideration. The fuel consumption rate of the diesel generator used in the simulation was calculated using Equation (3), and the resulting values of coefficients a and b, as obtained from HOMER, are 9.09 L/hr. and 0.236 L/hr./kW.
The use of the diesel generator is also observed to be higher in the rainy months (November to April) than in the dry season months, due to an increase in cloudiness capable of affecting PV component yield. The power dispatch mechanism adopted for the system adequately controls the electricity supply from system components and, over the full 25-year lifespan of the system, no unmet load conditions were observed, even on the potentially low PV yield days.

3.3.2. Battery Component Performance

The hybrid system requires 30 units of 100 kWh battery giving an overall bank capacity of 3000 kWh an autonomy of 23 h. The minimum state of charge of the battery is 20% and, as such, the battery bank overall usable nominal capacity is 2400 kWh.

3.4. Sensitivity Analysis

The hybrid system operation and efficiency are dependent on diesel, renewables availability and load growth. The price of diesel determines its usage which, in turn, affects the system operation. Similarly, the availability of wind and solar resources and load growth affects the power output of the hybrid system.

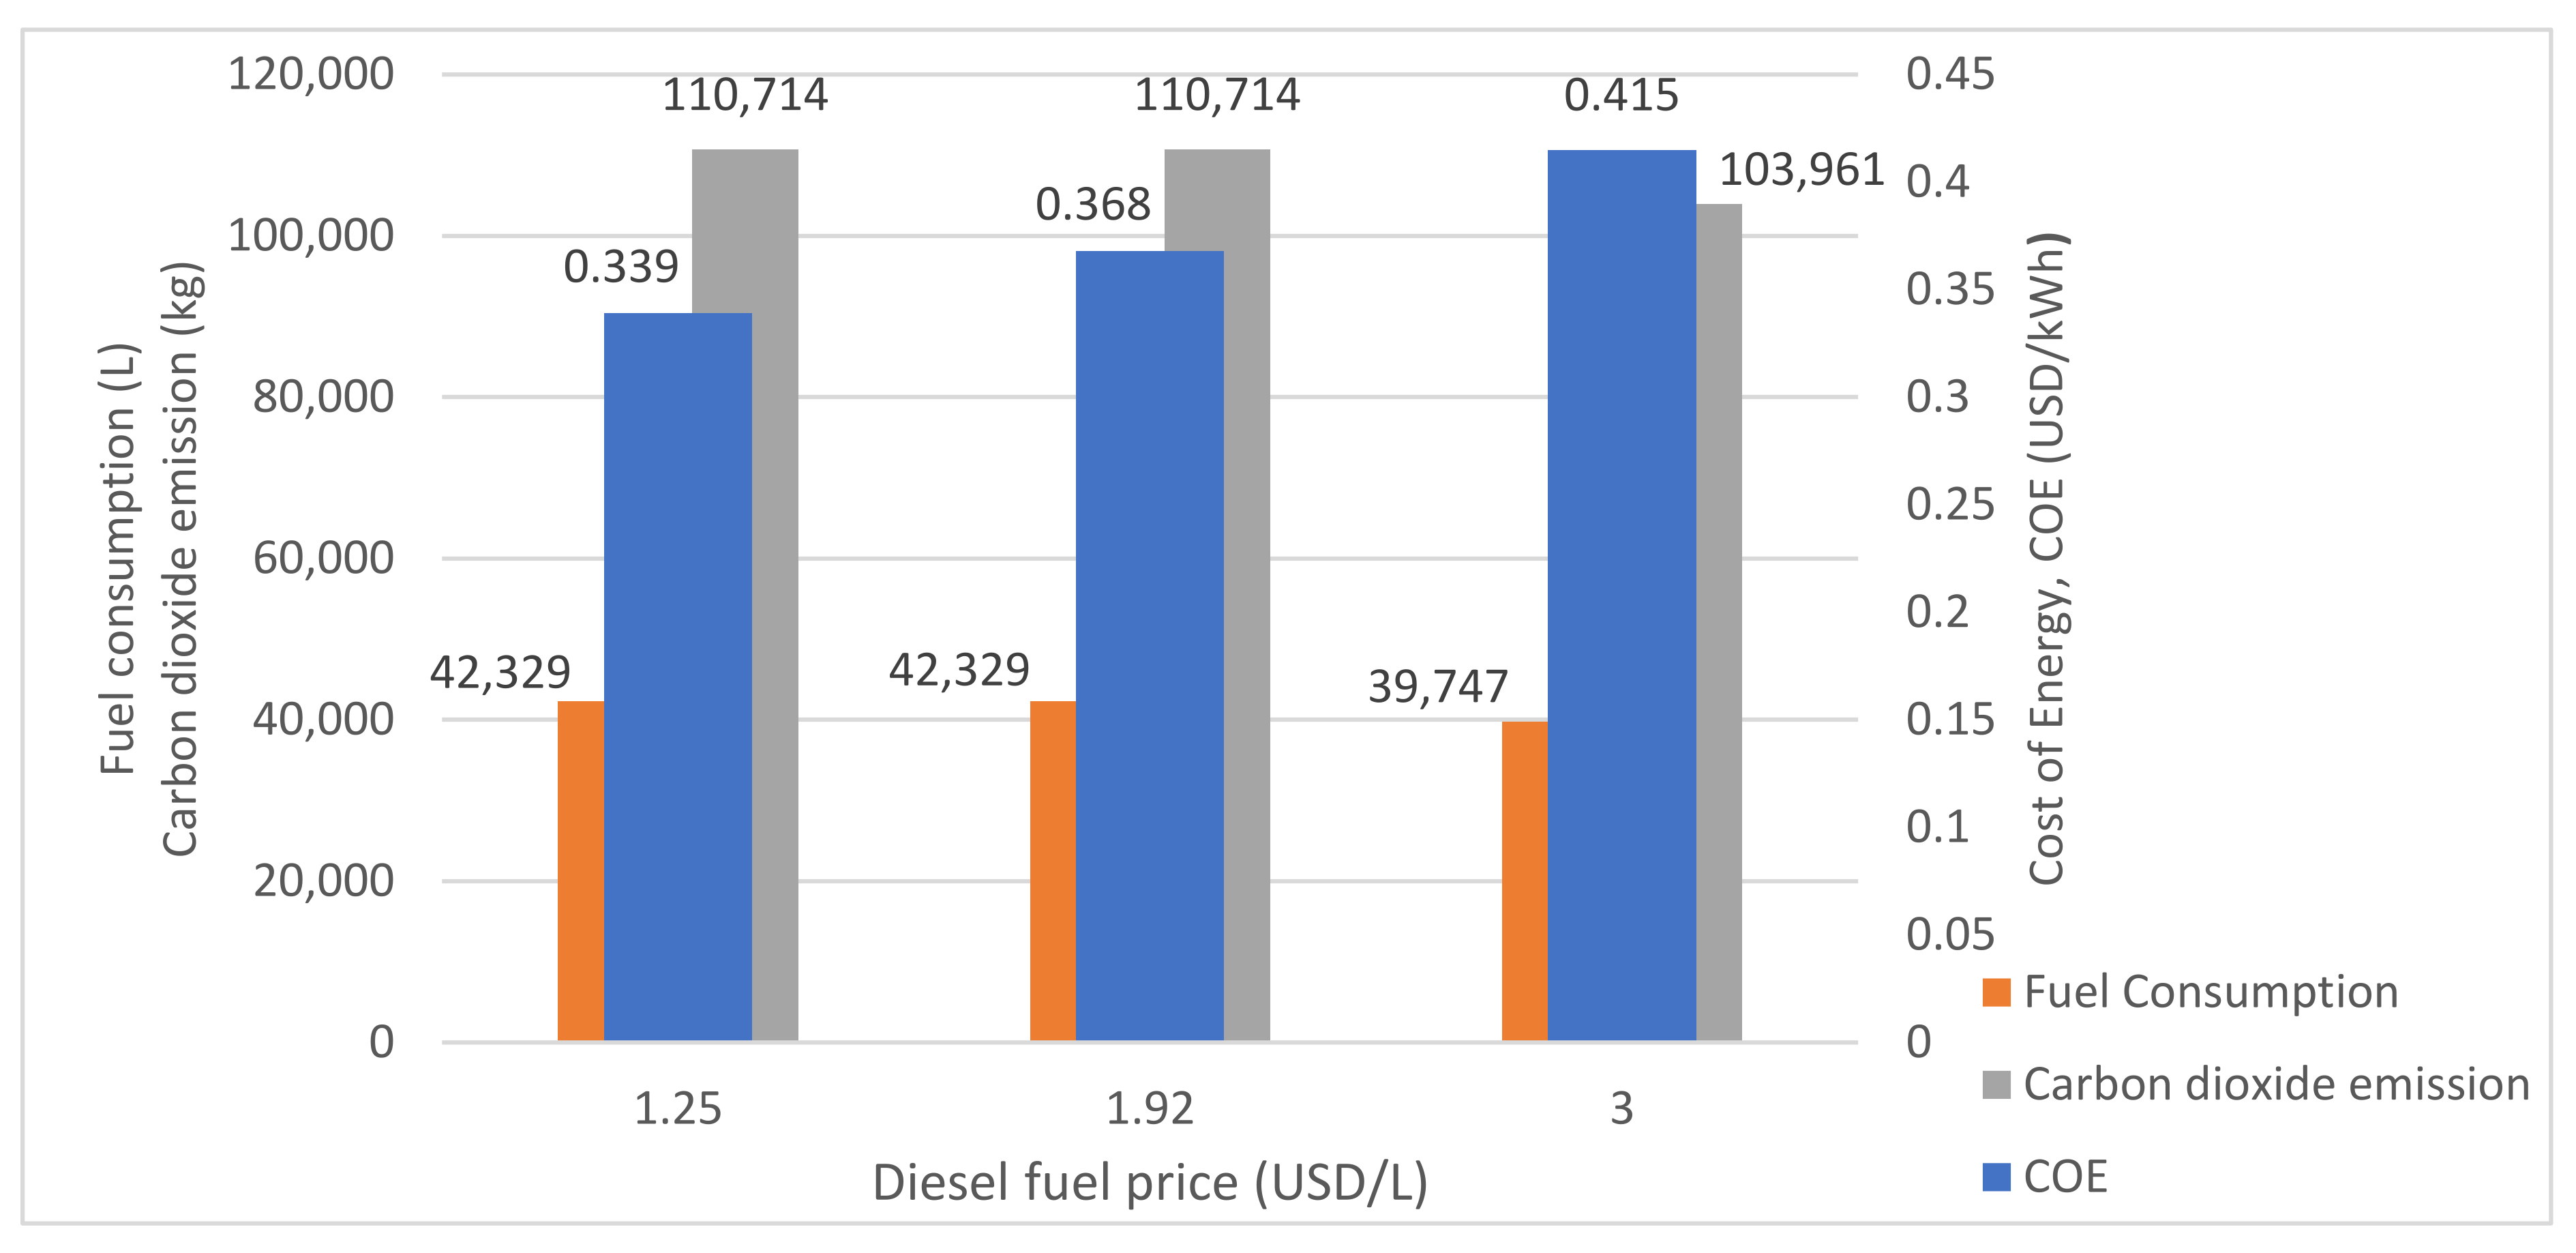
3.4.1. Impact of Increase in Diesel Price

It is assumed that the diesel price would be volatile over the 25-year life span of the system; this necessitates the need to perform a sensitivity analysis on diesel price. As the price of diesel rises from USD 1.25/L to USD 3/L, there is a corresponding increase in the PV/DG/battery system’s cost of energy, from USD 0.339 to USD 0.415. Consequently, the carbon emissions and fuel consumption of the energy system also decrease. The resulting changes in the base diesel price, from USD 1.25/L to USD 3/L, on system cost of energy, carbon emissions and fuel consumption is displayed in Figure 9
The decline in fuel consumption and emissions is due to a reduction in the hours of operation of the generator because of an increased dependence on the renewable resources to meet electrical load with the rising cost of the fossil fuel. This is possible because, with an increase in diesel price, the utilization of system component is restructured by the inbuilt HOMER optimizer function to prioritize dependence on renewables and battery storage, and minimize the hours of operation of the diesel generator.

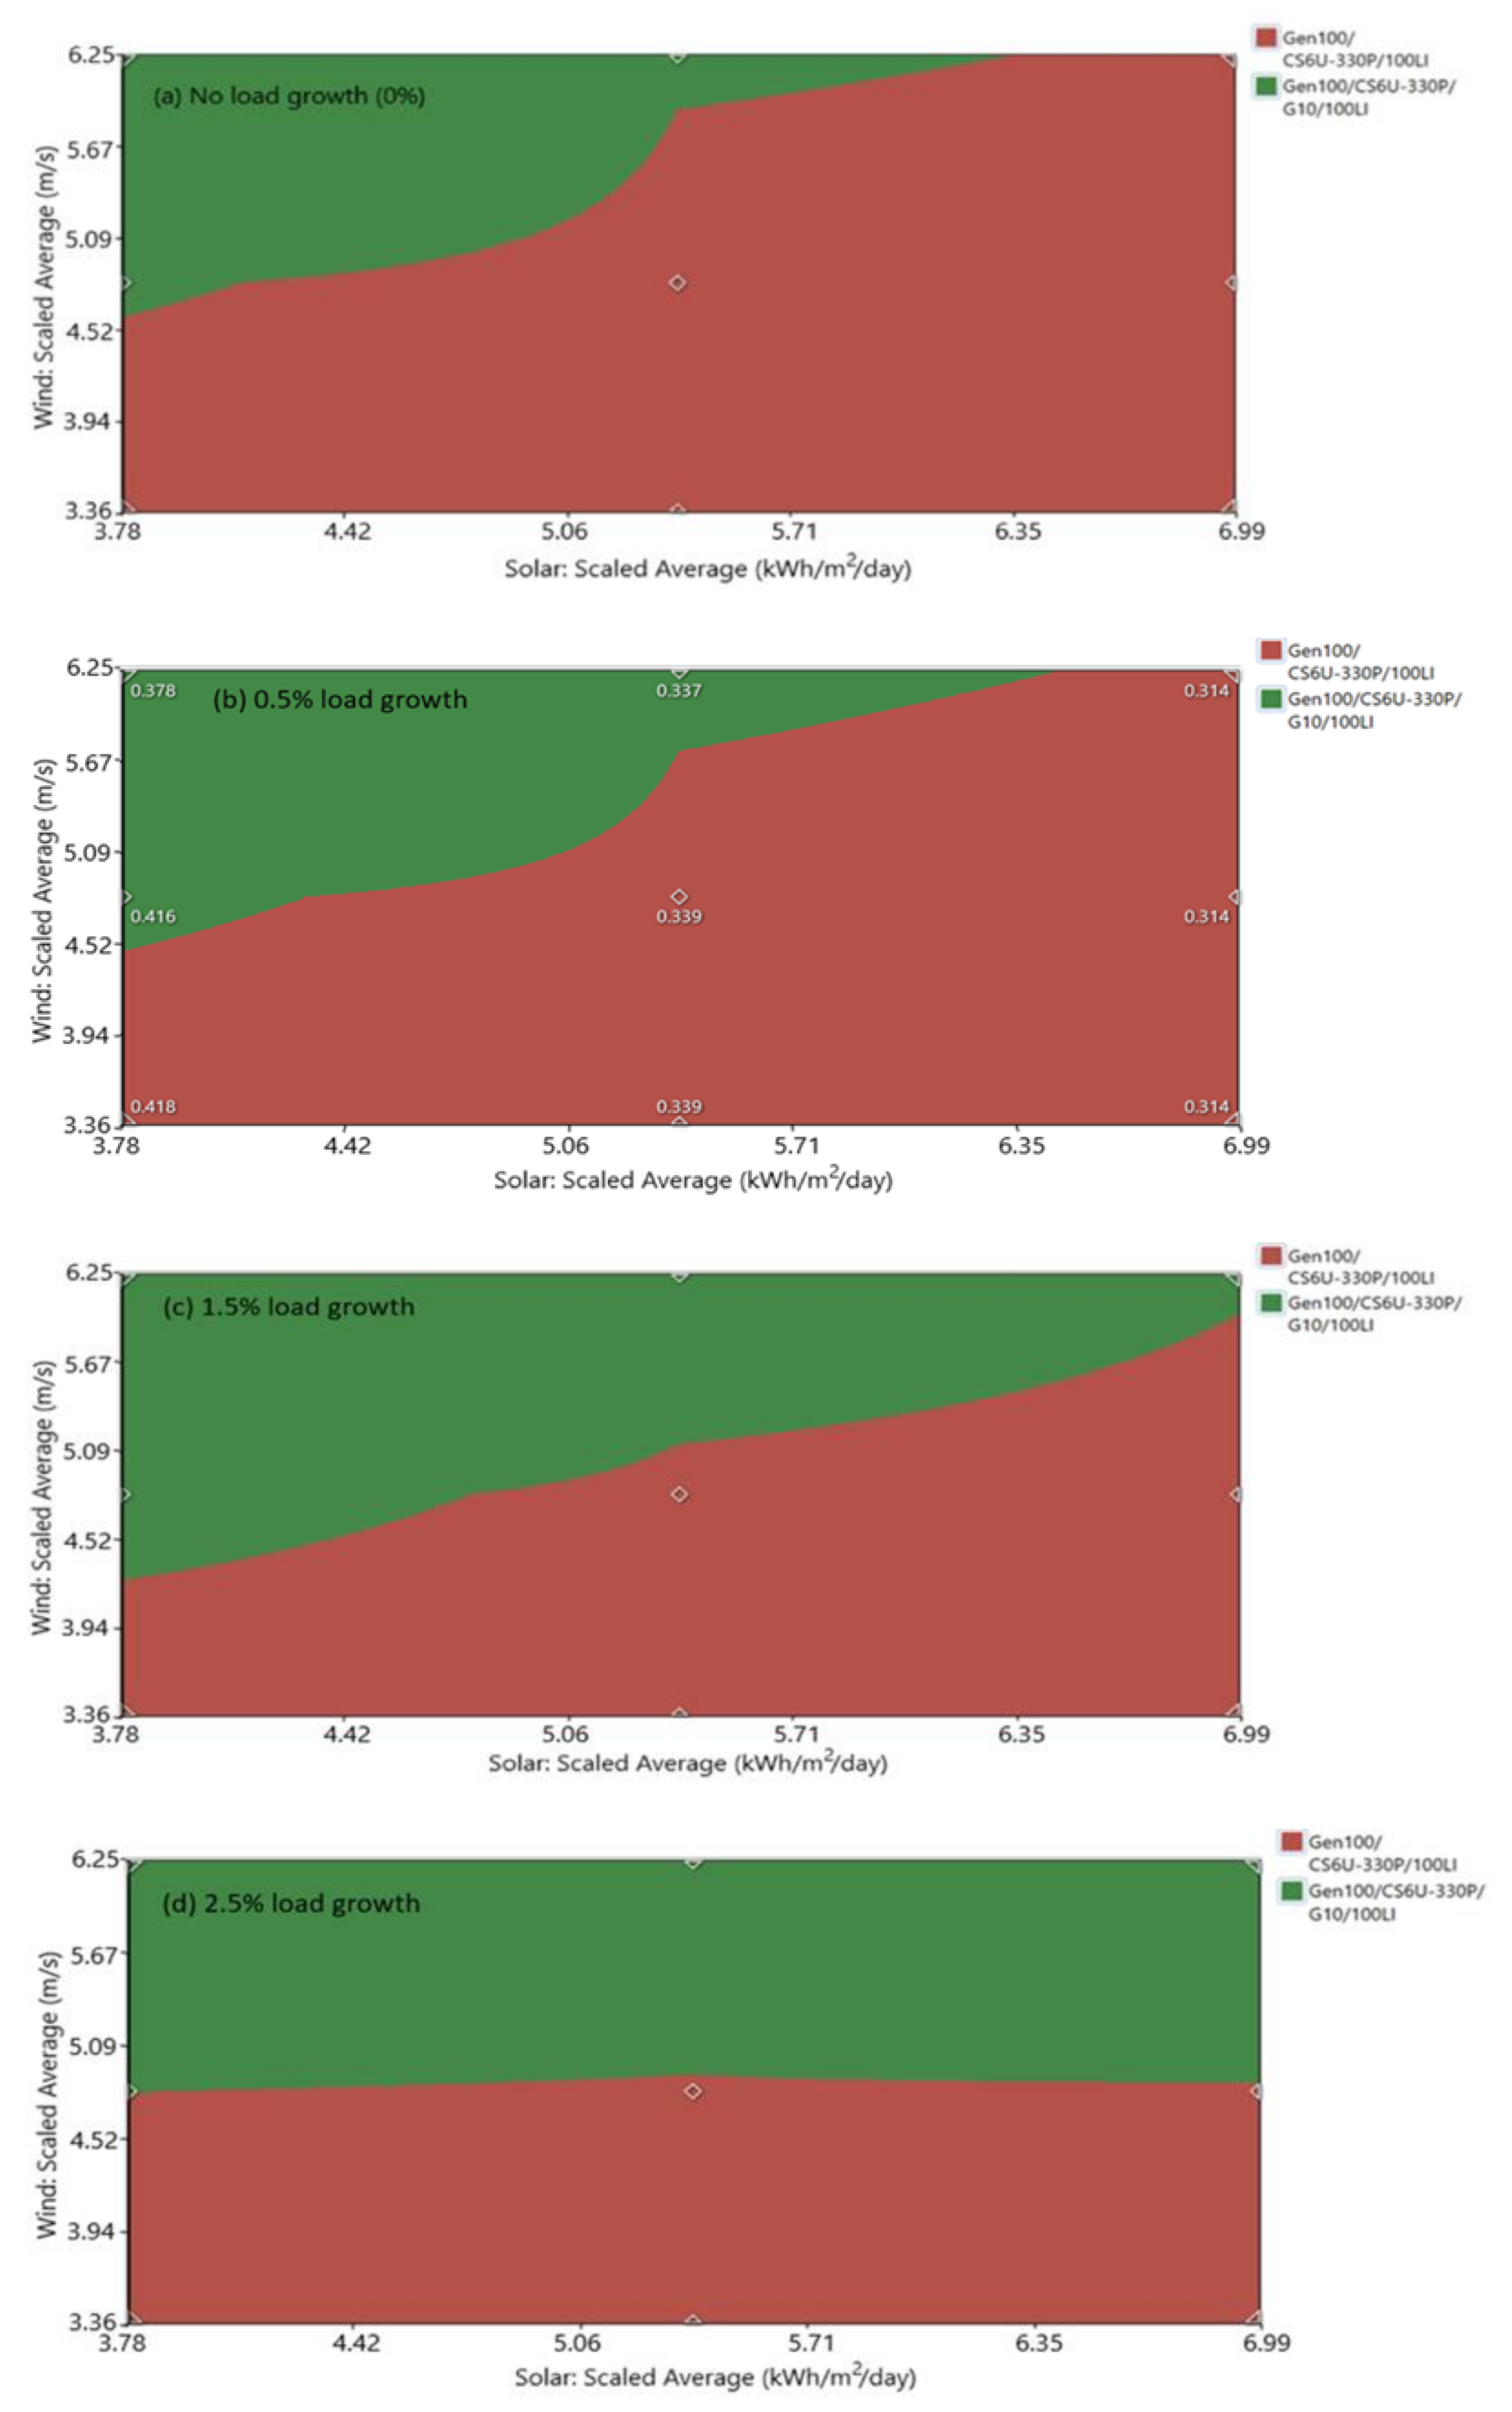
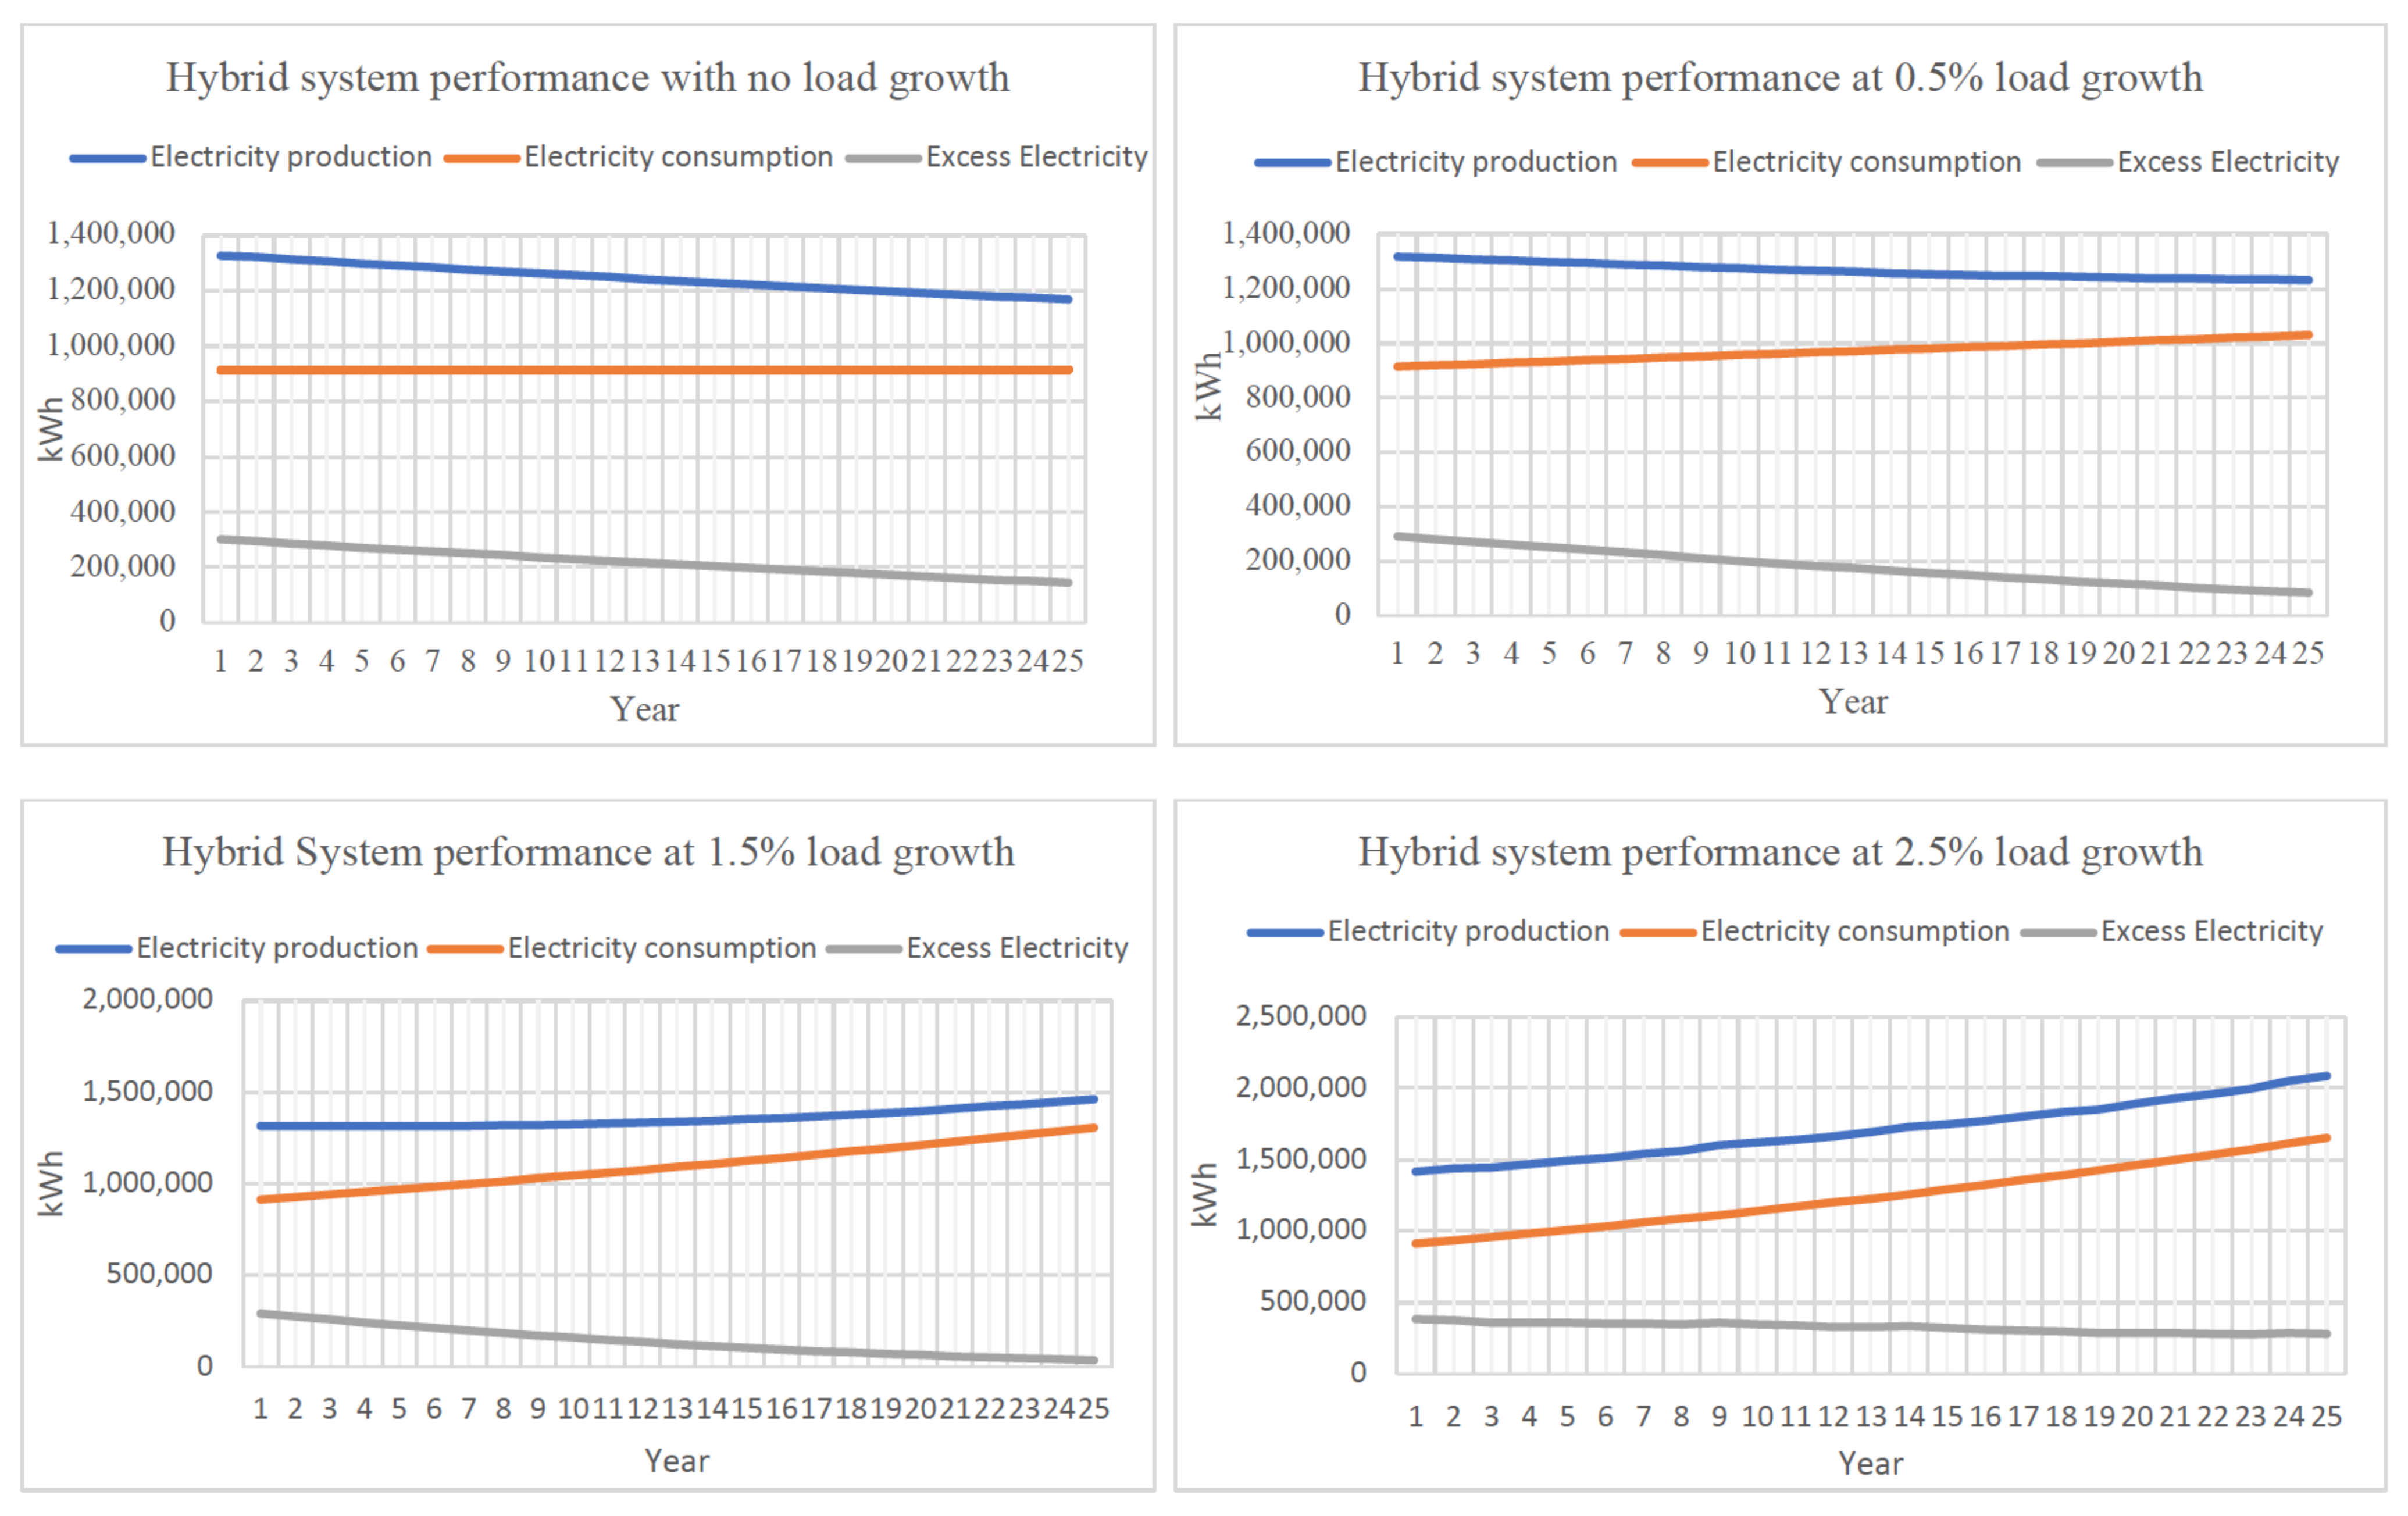
3.4.2. The Impact of Varying Renewables Resources and Load Growth

The impact of 0%, 1.5%, 2.5% annual load growth percentages on the optimal system type and performance is also studied. Figure 10 is an optimal system type plot, and the essence of the optimal system plot is that it provides a visual representation of changes in the choice of the most preferred system configuration, if any, as the renewables energy resources level and load growth vary.
From the multiyear simulation, the optimal system configuration is the PV/DG/battery system but, depending on the average mean value of renewables and load growth, the choice of an optimal system shuffles between the top two system configurations; the PV/DG/battery system represented by the red area and the PV/WT/DG/battery system represented by green area on the system type plot. From Figure 10, it is observed that, at wind speeds higher than the average 4.81 m/s in Machinga Boma, the optimal system choice is predominantly a PV/WT/DG/battery system and, below which, the optimal system type is a PV/DG/battery system. The nonlinear relationship between wind speed and power output shows that an increase in wind speed results in an increase in power generated by a wind turbine. This relationship forms the basis for the inclusion of the wind energy/wind turbine into the energy mix of the hybrid system at higher wind speeds. In addition, it is observed from the plot that, as load growth percentage increases, the inclusion of wind energy into the energy mix increases.
Despite the observed changes in the optimal system type resulting from the changes in renewables availability and load growth, another key observation is that, at the base renewables level (5.38 kWh/m2/day and 4.81 m/s), the PV/DG/battery remains the preferred system across all load growths. An increase in annual load growth percentage implies an increase in the annual electricity consumption. An investigation of the PV/DG/battery system performance is also performed by subjecting the system to a rise in annual load growth value. Imposing an increasing annual load growth percentage on the PV/DG/battery system increases the average hours of operation of the diesel generator, due to the restructuring of the utilization of system components to accommodate the growth in load. This effect is more observable at 1.5% and 2.5% load growths, as the annual electricity production is seen to increase to meet the rising consumption in Figure 11.
The overall effect of an increased dependence on diesel generators is a decrease in the renewables fraction, which translates to an increase in diesel consumption and increased carbon emissions.

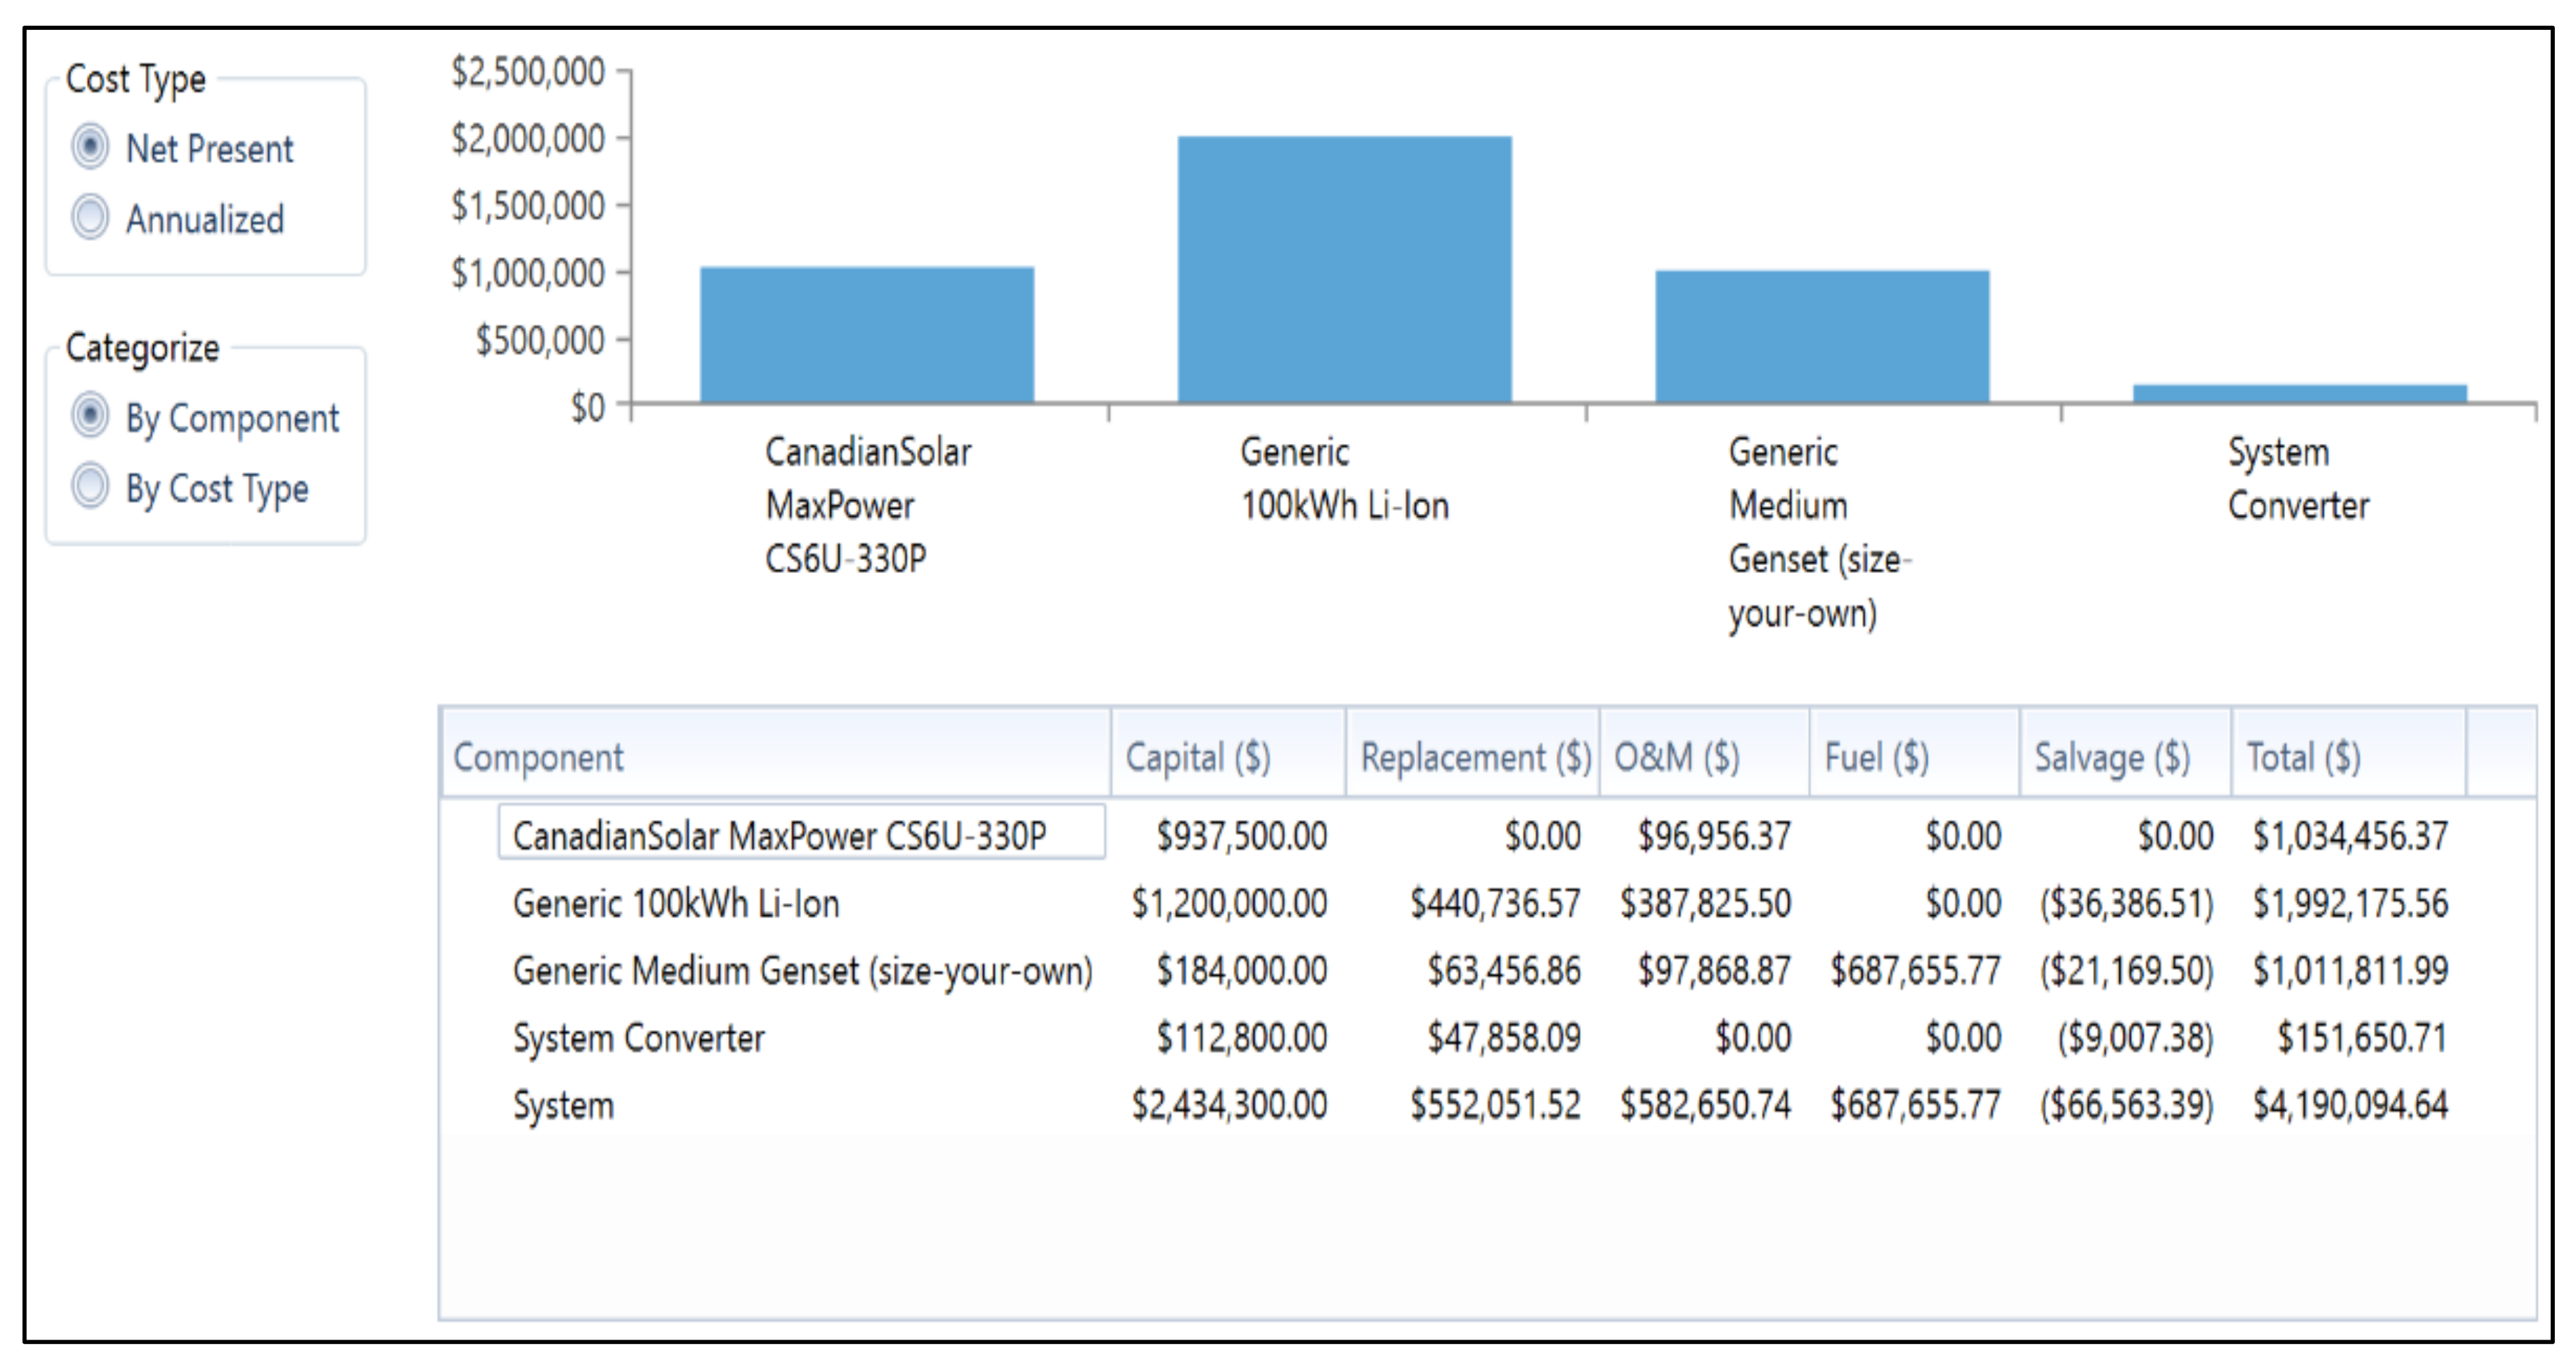
3.5. Cost Summary of the Optimal Hybrid Energy System

Costing plays a key role in the implementation of a system and, as such, this section presents the costing summary of the hybrid energy system. The overall COE of the system is USD 0.339/kWh, 4.6% higher than the COE obtained in the single year analysis. This increase in the cost of energy can be attributed to a number of factors, such as an increase in load consumption and diesel usage over the system lifespan. Figure 12 displays the cost summary of the hybrid energy system and, based on that, the Li-ion component of the system contributes the most to the overall NPC of the hybrid system.
Comparing the performances and costs of similar hybrid energy systems in literature is somewhat difficult, as the design capacities vary. Nonetheless, the COE obtained in this paper agrees with the COE from other literature. Olatomiwa et al. [9], studied the performance of seven hybrid system configurations for application in selected remote areas in Nigeria, and concluded the solar PV/diesel generator/battery storage system simulated at USD 1.1 diesel price with a resulting USD 0.547 offered the least expensive solution. Adaramola et al. [27] reported a COE between USD 0.364 and USD 0.387 at USD 1.5/L diesel price for a decentralised hybrid solar PV/diesel/battery system, for application in northern Nigeria. Zalengara [14], while assessing the feasibility of integrating solar, wind, and diesel technology to power Likoma island in Malawi, reported the possibility of attaining hybrid energy solutions with generation costs or COE ranging between USD 0.35 to USD 0.83, depending on the prevailing economic conditions and discount rates applied.

3.6. Carbon Dioxide Emission of Hybrid System

The hybrid energy system is inclusive of a diesel generator. The fuel (diesel) properties (as provided by HOMER) used for the simulation has a density of 820 kg/m3, 88% carbon content and 0.4% sulfur content. As a means of comparing the environmental impact of the hybrid energy system in terms of CO2 emissions, the system is compared with a base system (system 5) comprising of a diesel generator only, simulated under the same conditions as the hybrid system.
The mean CO2 emissions from the base system is 1,134,805 kg, and that from the hybrid energy system is 110,704 kg. Overall, the emission from the hybrid energy system is only about 10% of that from the diesel only system. The guiding design assumption presumes the current electricity demand of Machinga Boma is being supplied by privately owned diesel generators, a common characteristic of unelectrified rural communities in sub-Saharan Africa. To present a basis for the comparison of the PV/DG/battery system to the diesel only system, an assumption could be to let the diesel only system stand in place of all independently owned diesel/petrol generators in the community. In this case, the implementation of the PV/DG/battery system with an 87.6% renewable fraction in place of a diesel only system translates to an annual emissions savings equivalent to 1,024,101 kg of CO2. This implies that the hybrid energy system is a more environmentally benign system in comparison to the diesel only system. In addition, considering the hybrid involves fewer hours of operation in comparison to the diesel only system, the fuel consumption of the hybrid system is also significantly lower.

4. Conclusions

The research was undertaken primarily to propose viable solutions to the evident electricity supply crisis in sub-Saharan Africa, with a primary focus on proposing sustainable energy system configurations for electrifying remote areas in Malawi, while also bearing in mind the focus of the government of Malawi to diversify its energy mix and reduce the country’s reliance on hydropower, which is subject to droughts and accounts for over 95% of the country’s energy mix. With the assumption of a volatile fuel price, the intermittency of renewable energy resources, and the possibility of load growth factored into the design constraints and sensitivity analysis, the preferred hybrid system, comprising of solar PV, diesel generator, and battery storage, is found to substantially meet the electrical load. In comparison with a diesel generator only system, the hybrid system is significantly more environmentally benign, producing CO2 emissions of only 10% of the average CO2 emissions from the diesel only system. The environmental impact of the system is an essential consideration, especially as the Malawian energy policy goal centres on reducing the dependence on traditional biomass and traditional fuels which pose several issues.
The resulting excess electricity from the hybrid system, also, can either be used to power neighboring communities in the Machinga district, thus serving as a microgrid, or be stored in batteries by ramping up the system battery bank capacity so that the stored energy can be dispatched on demand. Considering cost plays a significant role in energy systems investment, a ramp up in battery storage could significantly increase the system COE. Based on the cost simulation result, the lithium-ion battery component accounts for 49% of the total system initial capital cost. Nonetheless, the COE obtained in this paper agrees with the COE obtained from a simulation of similar system configurations from other literature. Olatomiwa et al. [9] studied the performance of seven hybrid system configurations for application in selected remote areas in Nigeria and concluded the solar PV/diesel generator/battery storage system simulated at USD 1.1 diesel price with a resulting USD 0.547, offered the least expensive solution. Adaramola et al. [27] reported a COE between USD 0.364 and USD 0.387, at a USD 1.5/L diesel price, for a decentralised hybrid solar PV/diesel/battery system for application in northern Nigeria. Zalengara [14], while assessing the feasibility of integrating solar, wind, and diesel technology to power Likoma island in Malawi, reported the possibility of attaining hybrid energy solutions with generation costs or COE ranging between USD 0.35 and USD 0.83, depending on the prevailing economic conditions and discount rates applied. Solar PV, diesel generator and battery configuration is a common solution for remote communities, with an average COE of USD 0.355, according to Rehman [28]; the obtained COE from the techno-economic simulation in this paper is USD 0.339 COE. While the USD 0.339 is in line with other literature, the electricity tariffs in Malawi for residential and nonresidential use are USD 0.13/kWh and USD 0.16/kWh, respectively [29]. A comparison of the current electricity tariff structure in Malawi, with the hybrid energy system COE of USD 0.339/kWh, shows the hybrid energy system offers a higher price per kWh of electricity, possibly due to the inclusion of a diesel generator and battery storage in the configuration. While technically feasible, the high hybrid system COE may pose a constraint on the rate of acceptance of the system, due to the familiarity of a lower cost per kWh (tariff structure) in Malawi.

Author Contributions

Conceptualisation, J.O.E. and M.C.P.; methodology, J.O.E.; software, J.O.E.; validation, J.O.E.; formal analysis, J.O.E.; investigation, J.O.E.; resources, J.O.E. and M.C.P.; data curation, J.O.E.; writing—original draft preparation, J.O.E.; writing—review and editing, J.O.E. and M.C.P.; visualization, J.O.E.; supervision, M.C.P. Both authors have read and agreed to the published version of the manuscript.

Funding

This research received no external funding.

Institutional Review Board Statement

Not applicable.

Informed Consent Statement

Not applicable. The energy demand profile for locals generated were based on assumptions guided by literature with no direct human interaction.

Conflicts of Interest

The authors declare no conflict of interest.

Abbreviations

ACAlternating Current
BESSBattery Energy Storage System
CCCycle Charging
CCPPCombine Cycle Power Plant
DCDirect Current
DGDiesel Generator
ESCOMElectricity Supply Corporation of Malawi
ESSEnergy Storage System
GHIGlobal Horizontal Irradiance
GWGigawatt
HAWTHorizontal Axis Wind Turbine
HOMERHybrid Optimization Model for Energy Renewables
kWhKilowatt Hour
kWpKilowatt Peak
LCOELevelized Cost of Electricity
LFLoad Following
NASANational Aeronautics and Space Administration
NPCNet Present Cost
NRELNational Renewable Energy Laboratory
PSPPico Solar Products
PVPhotovoltaic
SHSSolar Home System
SSASub-Saharan Africa
STCStandard Test Condition
STPStandard Temperature and Pressure
VAWTVertical Axis Wind Turbine
WTWind Turbine
apTemperature Coefficient of Power
aFuel Curve Intercept
bFuel Curve Slope
FdDiesel Generator Fuel Consumption
fDerating Factor
GtIncident Solar Radiation on Solar Panels
Gt,STCIncident Solar Radiation on Panels at STC
PPower Output from Solar Panels
PWTActual Output Wind Turbine Power
PWT,STPOutput Wind Turbine Power at STP
PdPower Output of Diesel Generator
p Actual Air Density
p 0 Air Density at STP
TcTemperature of Solar Panel Cell in Current Time Step
Tc,STCTemperature of Solar Panel Cell at STC
TdRated Diesel Generator Capacity
YPower Output of Solar Panels at STC

References

  1. International Energy Agency. SDG 7: Data and Projections 2019. Available online: https://www.iea.org/reports/sdg7-data-and-projections/access530to-electricity (accessed on 1 June 2020).
  2. Suberu, M.Y.; Mustafa, M.W.; Bashir, N.; Muhamed, N.A.; Mokthar, A.S. Power sector renewable energy integration for expanding access to electricity in sub-Saharan Africa. Renew. Sustain. Energ Rev. 2013, 25, 630–642. [Google Scholar] [CrossRef]
  3. Zalengera, C.; Blanchard, R.E.; Eames, P.C.; Juma, A.M.; Chitawo, M.L.; Gondwe, K.T. Overview of the Malawi energy situation and a PESTLE analysis for sustainable development of renewable energy. Renew. Sustain. Energ Rev. 2014, 38, 335–347. [Google Scholar] [CrossRef] [Green Version]
  4. National Statistics Office of Malawi. Population and Housing Census Preliminary Report. Government of Malawi, 2018. Available online: http://www.nsomalawi.mw/ (accessed on 5 June 2020).
  5. Eales, A.; Unyolo, B. Renewable Energy Mini-Grids in Malawi: Status, Opportunities and Barriers. University of Strathclyde, Glasgow (UK), 2018. Available online: https://pureportal.strath.ac.uk/en/publications/renewable-energy-mini-grids-in-malawi-status-barriers-and-opportu (accessed on 22 June 2020).
  6. Government of Malawi. Draft National Energy Policy. Ministry of Natural Resources, Energy and Mining: Malawi, 2016. Available online: http://conrema.org/downloads/ (accessed on 29 May 2020).
  7. Pillot, B.; Muselli, M.; Poggi, P.; Haurant, P.; Harad, I. Solar energy potential atlas for planning energy systems off-grid electrification in the Republic of Djibouti. Energy Convers. Manag. 2014, 69, 131–147. [Google Scholar] [CrossRef] [Green Version]
  8. Kenfack, J. Micro hydro-PV hybrid system: Sizing a small hydro PV hybrid system for rural electrification in developing countries. Renew. Energy 2009, 34, 2259–2263. [Google Scholar] [CrossRef]
  9. Olatomiwa, L.; Mekhilef, S.; Huda, A.S.N.; Ohunakin, O.S. Economic evaluation of hybrid energy systems for rural electrification in six geo-political zones of Nigeria. Renew. Energy 2015, 83, 435–446. [Google Scholar] [CrossRef]
  10. Adaramola, M.; Agelin-Chaab, M.; Paul, S. Analysis of hybrid energy systems for application in southern Ghana. Energy Convers. Manag. 2014, 88, 84–295. [Google Scholar] [CrossRef]
  11. Baghdadi, F.; Mohammedi, K.; Diaf, S.; Behar, O. Feasibility study and energy conversion analysis of stand-alone hybrid renewable energy system. Energy Convers. Manag. 2015, 105, 471–479. [Google Scholar] [CrossRef]
  12. Kusakana, K. Optimization of the daily operation of a hydrokinetic diesel hybrid system with pumped hydro storage. Energy Convers. Manag. 2015, 106, 901–910. [Google Scholar] [CrossRef]
  13. Eales, A.; Frame, D.; Dauenhauser, P.; Kambombo, B.; Kamanga, P. Electricity access options appraisal in Malawi: Dedza district case study. In Proceedings of the 2017 IEEE PES Power Africa, Accra, Ghana, 27–30 June 2017; pp. 343–429. [Google Scholar] [CrossRef] [Green Version]
  14. Zalengara, C.; Blanchard, R.; Eames, P. Investigating the feasibility of solar photovoltaic and wind electricity integration for Likoma Island in Malawi: Techno-economic analysis applying the Hybrid Optimization Model for Electric Renewables (HOMER). In Proceedings of the World Renewable Energy congress XIII, Kingston, UK, 3–8 August 2014. [Google Scholar]
  15. HOMER ENERGY LLC. HOMER Pro: Product Information. Available online: https://www.homerenergy.com/products/pro/index.html (accessed on 13 July 2020).
  16. Nacer, T.; Hamidat, A.; Nadjemi, O.; Bey, M. Feasibility study of grid connected photovoltaic system in family farms for electricity generation in rural areas. Renew. Energy 2016, 96, 305–318. [Google Scholar] [CrossRef]
  17. HOMER Energy LLC. HOMER Pro 3.13 Manual: How HOMER Calculates Wind Turbine Power Output. Available online: https://www.homerenergy.com/prod (accessed on 21 July 2020).
  18. Maleki, A.; Askarzadeh, A. Optimal sizing of a PV/wind/diesel system with battery storage for electrification to an off-grid remote region: A case tudy of Rafsanjan, Iran. Sustain. Energy Technol. Assess. 2014, 7, 147–153. [Google Scholar] [CrossRef]
  19. Oladigbolu, O.; Ramli, M.; Al-Turki, Y. Techno-economic and sensitivity analyses for an optimal hybrid power system which is adaptable and effective for rural electrification: A case study of Nigeria. Sustainability 2019, 11, 4959. [Google Scholar] [CrossRef] [Green Version]
  20. National Statistical Office. Malawi Demographic and Health Survey 2015–2016; Government of Malawi: Zomba, Malawi, 2017. Available online: https://dhsprogram.com/publications/publication-fr319-dhs-final-reports.cfm (accessed on 6 June 2020).
  21. International Energy Agency. Rural Electrification with PV Hybrid Systems; International Energy Agency: Paris, France, 2013; Available online: https://iea-pvps.org/key-topics/iea-pvps-task-9-rural-electrification-with-pv-hybrid-systems-t9-11-07-2013-updated-02-2014/ (accessed on 1 July 2020).
  22. GIZ. What Size Shall It Be: A Guide to Mini-Grid Sizing and Demand Forecasting. Available online: https://www.giz.de/en/downloads/Sizing_handbook_150dpi_for_web.pdf (accessed on 1 July 2020).
  23. Gamula, G.; Hui, L.; Peng, W. An overview of the energy sector in Malawi. Energy Power Eng. Sci. 2013, 5, 8–17. [Google Scholar] [CrossRef] [Green Version]
  24. NASA. Prediction of Worldwide Energy Resources: Data Access. Available online: https://power.larc.nasa.gov/data-access-viewer/ (accessed on 16 June 2020).
  25. Malawi Energy Regulatory Authority. Legislation: Review of Prices of Petrol, Diesel and Paraffin. Available online: https://mera.mw/ (accessed on 3 August 2020).
  26. Dhimish, M.; Alrashidi, A. Photovoltaic degradation rate affected by different weather conditions: A case study based on PV systems in the UK and Australia. Electronics 2020, 9, 650. [Google Scholar] [CrossRef] [Green Version]
  27. Adaramola, M.S.; Paul, S.S.; Oyewola, O.M. Assessment of decentralized hybrid PV solar-diesel power system for applications in Northern part of Nigeria. Energy Sustain. Dev. 2013, 9, 72–82. [Google Scholar] [CrossRef]
  28. Rehman, S. Hybrid power systems—Sizes, efficiencies, and economics. Energy Explor. Exploit. 2020, 39, 3–43. [Google Scholar] [CrossRef]
  29. Electricity Supply Corporation of Malawi. Customer Information: Current Tariffs. Electricity Supply Corporation of Malawi. Available online: http://www.escom.mw/current-tariffs.php (accessed on 3 August 2020).
Figure 1. Current and planned grid network of Malawi [5].
Energies 14 06330 g001
Figure 2. Monthly Solar irradiation and clearness index.
Energies 14 06330 g002
Figure 3. Monthly temperature data.
Energies 14 06330 g003
Figure 4. Monthly wind speed.
Energies 14 06330 g004
Figure 5. Proposed hybrid energy system schematics.
Energies 14 06330 g005
Figure 6. Estimated community load profile.
Energies 14 06330 g006
Figure 7. Optimal system configurations from multiyear analysis.
Energies 14 06330 g007
Figure 8. Annual electricity production of PV/DG/Battery.
Energies 14 06330 g008
Figure 9. Impact of diesel price on COE, fuel usage and carbon dioxide emission.
Energies 14 06330 g009
Figure 10. Optimal system type plots.
Energies 14 06330 g010
Figure 11. Hybrid system performance at varying load growths.
Energies 14 06330 g011
Figure 12. Cost summary of hybrid energy system.
Energies 14 06330 g012
Table 1. Electrification rate of selected sub-Saharan African countries. Adapted from [1].
20002005201020152018
DR Congo6.7%7.6%8.8%8.8%8.7%
Chad2%3.5%3.7%7.7%9.2%
Burundi4%4.7%5.3%9.1%10.6%
Niger7%7.8%8.6%10.7%12.6%
Malawi5%7.4%8.7%10.8%14.6%
Ghana45%51.5%64.9%75.8%84.3%
South Africa77.3%78%84.4%91.8%94.9%
Table 2. Summary of the technical specifications of hybrid system components.
ComponentParameterDesign Specification
Solar PV panelRated capacity (peak power)330 Wp
Derating factor88%
Efficiency at STC16.97%
Temperature coefficient−0.41
Manufacturer/typeCanadian solar/Flat plate
Wind turbineRated capacity10 kW
Hub height50 m
Diesel generatorRated capacity460 kW
Minimum load ratio25%
Lifetime15,000 h
BatteryNominal capacity100 kWh
Nominal capacity167 Ah
Nominal coltage600 V
Minimum state of charge20%
Round trip efficiency90%
Converter/InverterEfficiency95%
Table 3. Household load estimation.
Total Number of Households = 400
ApplianceQtyPower
(W)
Power Per Household
(W)
Total Household Power
(kW)
Time
(h)
Hours/Day
Light bulbs7201405606:00–07:00
18:00–22:00
5
Sound system150502017:00–23:006
Television180803217:00–22:005
Electric fan2801606418:00–06:00
12:00–14:00
14
Other load 1001004018:00–20:00
06:00–09:00
5
Total 530212
Table 4. Summary of single year system analysis.
Parameter/ComponentUnitSystem 1System 2System 3System 4System 5
PV PanelkW1546016707680
Diesel generatorkW000460460
Wind turbineunit015000
ConverterkW6735044263760
Batteryunit479043280
Dispatch strategy CCCCCCLFCC
Cost of energy$/kWh0.4481.410.4430.3240.789
Renewable fraction%10010010091.30
Fuel consumptionL/yr00023,457364,208
Publisher’s Note: MDPI stays neutral with regard to jurisdictional claims in published maps and institutional affiliations.

