Article

Combustion Behavior and Kinetics Analysis of Isothermal Oxidized Oils from Fengcheng Extra-Heavy Oil

1
School of Petroleum Engineering, China University of Petroleum (East China), Qingdao 266580, China
2
State Key Laboratory of Oil and Gas Reservoir Geology and Exploitation, Southwest Petroleum University, Chengdu 610500, China
3
Department of Petroleum Engineering, Kazan Federal University, Kazan 420008, Russia
*
Authors to whom correspondence should be addressed.
Energies 2021, 14(19), 6294; https://doi.org/10.3390/en14196294
Submission received: 10 August 2021 / Revised: 24 September 2021 / Accepted: 29 September 2021 / Published: 2 October 2021

Abstract

:
The low-temperature oxidation (LTO) of heavy oil is of great significance for the combustion front stability, which directly influences the efficiency and safety of in-situ combustion (ISC). To provide feasible heating by artificial ignition before the implementation of ISC in the Xinjiang Fengcheng (FC) oilfields, this paper investigates the oxidation behavior of FC extra-heavy oil and its isothermal oxidized oils. Firstly, FC extra-heavy oil was subjected to isothermal oxidation experiments conducted utilizing an oxidation reactor, and the physical properties of the gaseous products and oxidized oils were analyzed. The combustion behavior of the FC extra-heavy oil and oxidized oils was then studied by non-isothermal thermogravimetry and differential scanning calorimetry. Subsequently, the Friedman and Ozawa–Flynn–Wall methods were adopted to perform kinetic analysis. Oxygen consumption was always greater than the production of CO and CO2, so oxygen addition reactions were the main pathway in heavy oil LTO. H/C decreased to 8.31% from 20.94% when the oxidation temperature rose from 50 °C to 150 °C, which deepened the oxidation degree. The density and viscosity of 200 °C to 350 °C oxidized oils increased at a slower rate, which may be related to the LTO heat effect. The change law of temperature interval, peak temperature, and mass loss of the oxidized oils had a good correlation with the static oxidation temperature. Compared with other oxidized oils, the peak heat flow and enthalpy of 350 °C oxidized oil increased significantly with high-temperature combustion, and were 42.4 mW/mg and 17.77 kJ/mol, respectively. The activation energy of 350 °C oxidized oil began to decrease obviously around a conversion rate of 0.4, which indicates that it was beneficial to coke deposition with stronger activity. Finally, we came up with LTO reaction mechanisms and put forward a reasonable preheating temperature for the application of ISC in FC oilfields.

Graphical Abstract

1. Introduction

Heavy oil is crude oil with a viscosity of >50 mPa·s, or after degassing a viscosity of >100 mPa·s under oil layer conditions. Heavy oil has high asphaltenes and resins. According to the API Gravity index, crude oil can be divided into four categories: light oil, medium oil, heavy oil, and extra-heavy oil.
Among the crude oil resources discovered throughout the world, heavy oil reserves account for more than 2/3, and thermal enhanced oil recovery technologies are still the main method of heavy oil recovery [1,2,3]. Compared with heavy oil recovery methods such as cyclic steam stimulation, steam flooding, and steam-assisted gravity drainage, in-situ combustion (ISC) technology has the advantages of low cost, and high oil displacement capacity [4,5]. In recent years, the ISC method has been considered as an alternative technology to enhance heavy oil recovery and has aroused more experts’ and scholars’ widespread interest and investigation [6,7,8].
By continuously injecting air into the oil layer, the oxidation reactions between oil and oxygen can generate heat and a large amount of evolved gas, so that the multiple driving forces drive the heated crude oil to the production well. The temperature of the combustion zone can reach 300–700 °C. The remaining coke is used as fuel to maintain stable combustion in the ISC. Compared with steam injection, ISC generates heat in the heavy oil reservoirs, so the thermal efficiency is high [9,10,11]. Based on previous research, it is generally considered that the heavy oil ISC process could be categorized into three regions, termed as low-temperature oxidation (LTO), fuel deposition (FD), and high-temperature combustion (HTC) stage [12,13,14]. During the LTO process, a series of complex reactions are generally assumed to occur simultaneously, and hydroperoxides (immediate short-living compounds) formed by free radical chain mechanisms are unstable and react almost instantly. The LTO products (ketones, aldehydes, carboxylic acids, etc.) are the precursors of coke generated in the FD, and the quantity and reactivity of coke will affect the combustion front stability during the ISC [15,16,17,18].
To promote and ensure the successful application of ISC technology in heavy oilfields, a better understanding of the LTO reaction mechanism is fundamental and crucial. Therefore, many kinds of research regarding oil LTO characteristics have been implemented using a series of precise and efficient thermal analyzers [19,20,21,22]. Liu et al. indicated that oxygen addition reactions of saturates, aromatics, and resins could promote the polycondensation reactions between oxygenated derivatives and change the following cracking reactions, which caused special characteristics during their co-oxidation [23]. Wang et al. conducted pyrolysis and oxidation experiments of typical light and heavy oil at a heating rate of 10 °C/min through thermogravimetric analysis/differential scanning calorimetry (DSC). The resulting profiles showed that the LTO thermal effect mechanism can be applied for heavy oils, and HTO for heavy oils can be more significant in comparison with that for light oils during the air injection; before the field implementation of an air injection project, proper reservoir temperature screening is needed for enhanced oil recovery [24]. To further understand the LTO reaction pathways of heavy oil, Zhao et al. investigated alterations of gaseous product compositions and oxidized oil properties caused by LTO. The results indicate that LTO reactions were carried out at lower levels as the oxidation temperatures lowered, which was demonstrated by a lower H/C and higher content of high molecules with polycyclic aromatic hydrocarbons [25]. Zhao et al. characterized the compositional changes of the heavy oil due to LTO through gas chromatograph–mass spectroscopy and negative ion electrospray Fourier transform-ion cyclotron resonance mass spectrometry; the results showed that the condensation of aromatics, as well as aromatization and condensation of other compounds, were intensified below 200 °C, and that chain saturated aliphatic, monocyclic, bicyclic, and tricyclic naphthenic acids were the main acidic components in the oxidized oils [26]. For heavy oils with different physical properties, many peers have studied their combustion exothermic behavior by different testing instruments and methods, especially in the LTO reaction stage. To better guide the application of ISC technology and improve the development efficiency of the heavy oilfield, research on the mechanism of LTO of heavy oil under static isothermal conditions is still necessary.
In addition, our recent works explored and compared the combustion behavior of oxidized coke and pyrolyzed coke, especially their heat release and combustion reactivity during the ISC process [27]; research results verified that the combustion reactivity of coke can be improved by preheating the reservoir to a preset temperature. A large number of studies have been carried out on the LTO reaction of heavy oil so far; however, disputes remain due to the various crude oil properties, experimental methods, and laboratory apparatus, etc., involved. In addition, the FC extra-heavy oil reservoir has a lower temperature of 18.8 °C and pressure of 2.98 MPa, which requires artificial ignition to trigger the HTC reaction. Therefore, to ensure the successful application of ISC technology and effectively enhance heavy oil recovery, a deeper understanding of LTO reaction mechanisms of heavy oil is urgent, as well as selection of a reasonable preheating temperature.
Through the above-mentioned extensive literature research, we found that regardless of their exothermic characteristics or combustion reactivity, there is little comparative research on extra-heavy oil and its isothermal oxidized oils. Therefore, it is necessary to investigate the oxidation exothermic behavior of various oxidized oils formed by static isothermal LTO, including the physical properties of gaseous products and oxidized oils, combustion exothermal effects, kinetics analysis, etc. In this work, firstly, a high-temperature and high-pressure rheometer, density meter, elemental analyzer, and gas chromatography (GC) were used to test and analyze the viscosity, density, non-metal elements, and distribution of carbon hydrocarbons of each oil sample, and the composition of gaseous products. Following this, non-isothermal thermogravimetry (TG) and DSC experiments identified the rate of mass loss, enthalpy, etc., of all samples at each reaction stage. Finally, the combustion kinetics parameter was determined by the classical model-free models—Friedman and Ozawa−Flynn−Wall (OFW). Derived from this work, the reasonable preheating temperature for FC heavy oilfields was accurately confirmed, which could provide theoretical guidance for the application of ISC technology in FC oilfields.

2. Experimental

2.1. Materials

The extra-heavy crude oil sample was collected from the Fengcheng (FC), Xinjiang Oilfield in China, and its basic physical parameters are listed in Table 1. Researchers divided the different chemical compounds in crude oil into saturate, aromatic, resin, and asphaltene (SARA) fractions. SARA fractions were separated based on the industry standard of China Petroleum NB/SH/T 0509-2010—more experimental details for different tests have been given in our previous works [14,27,28].

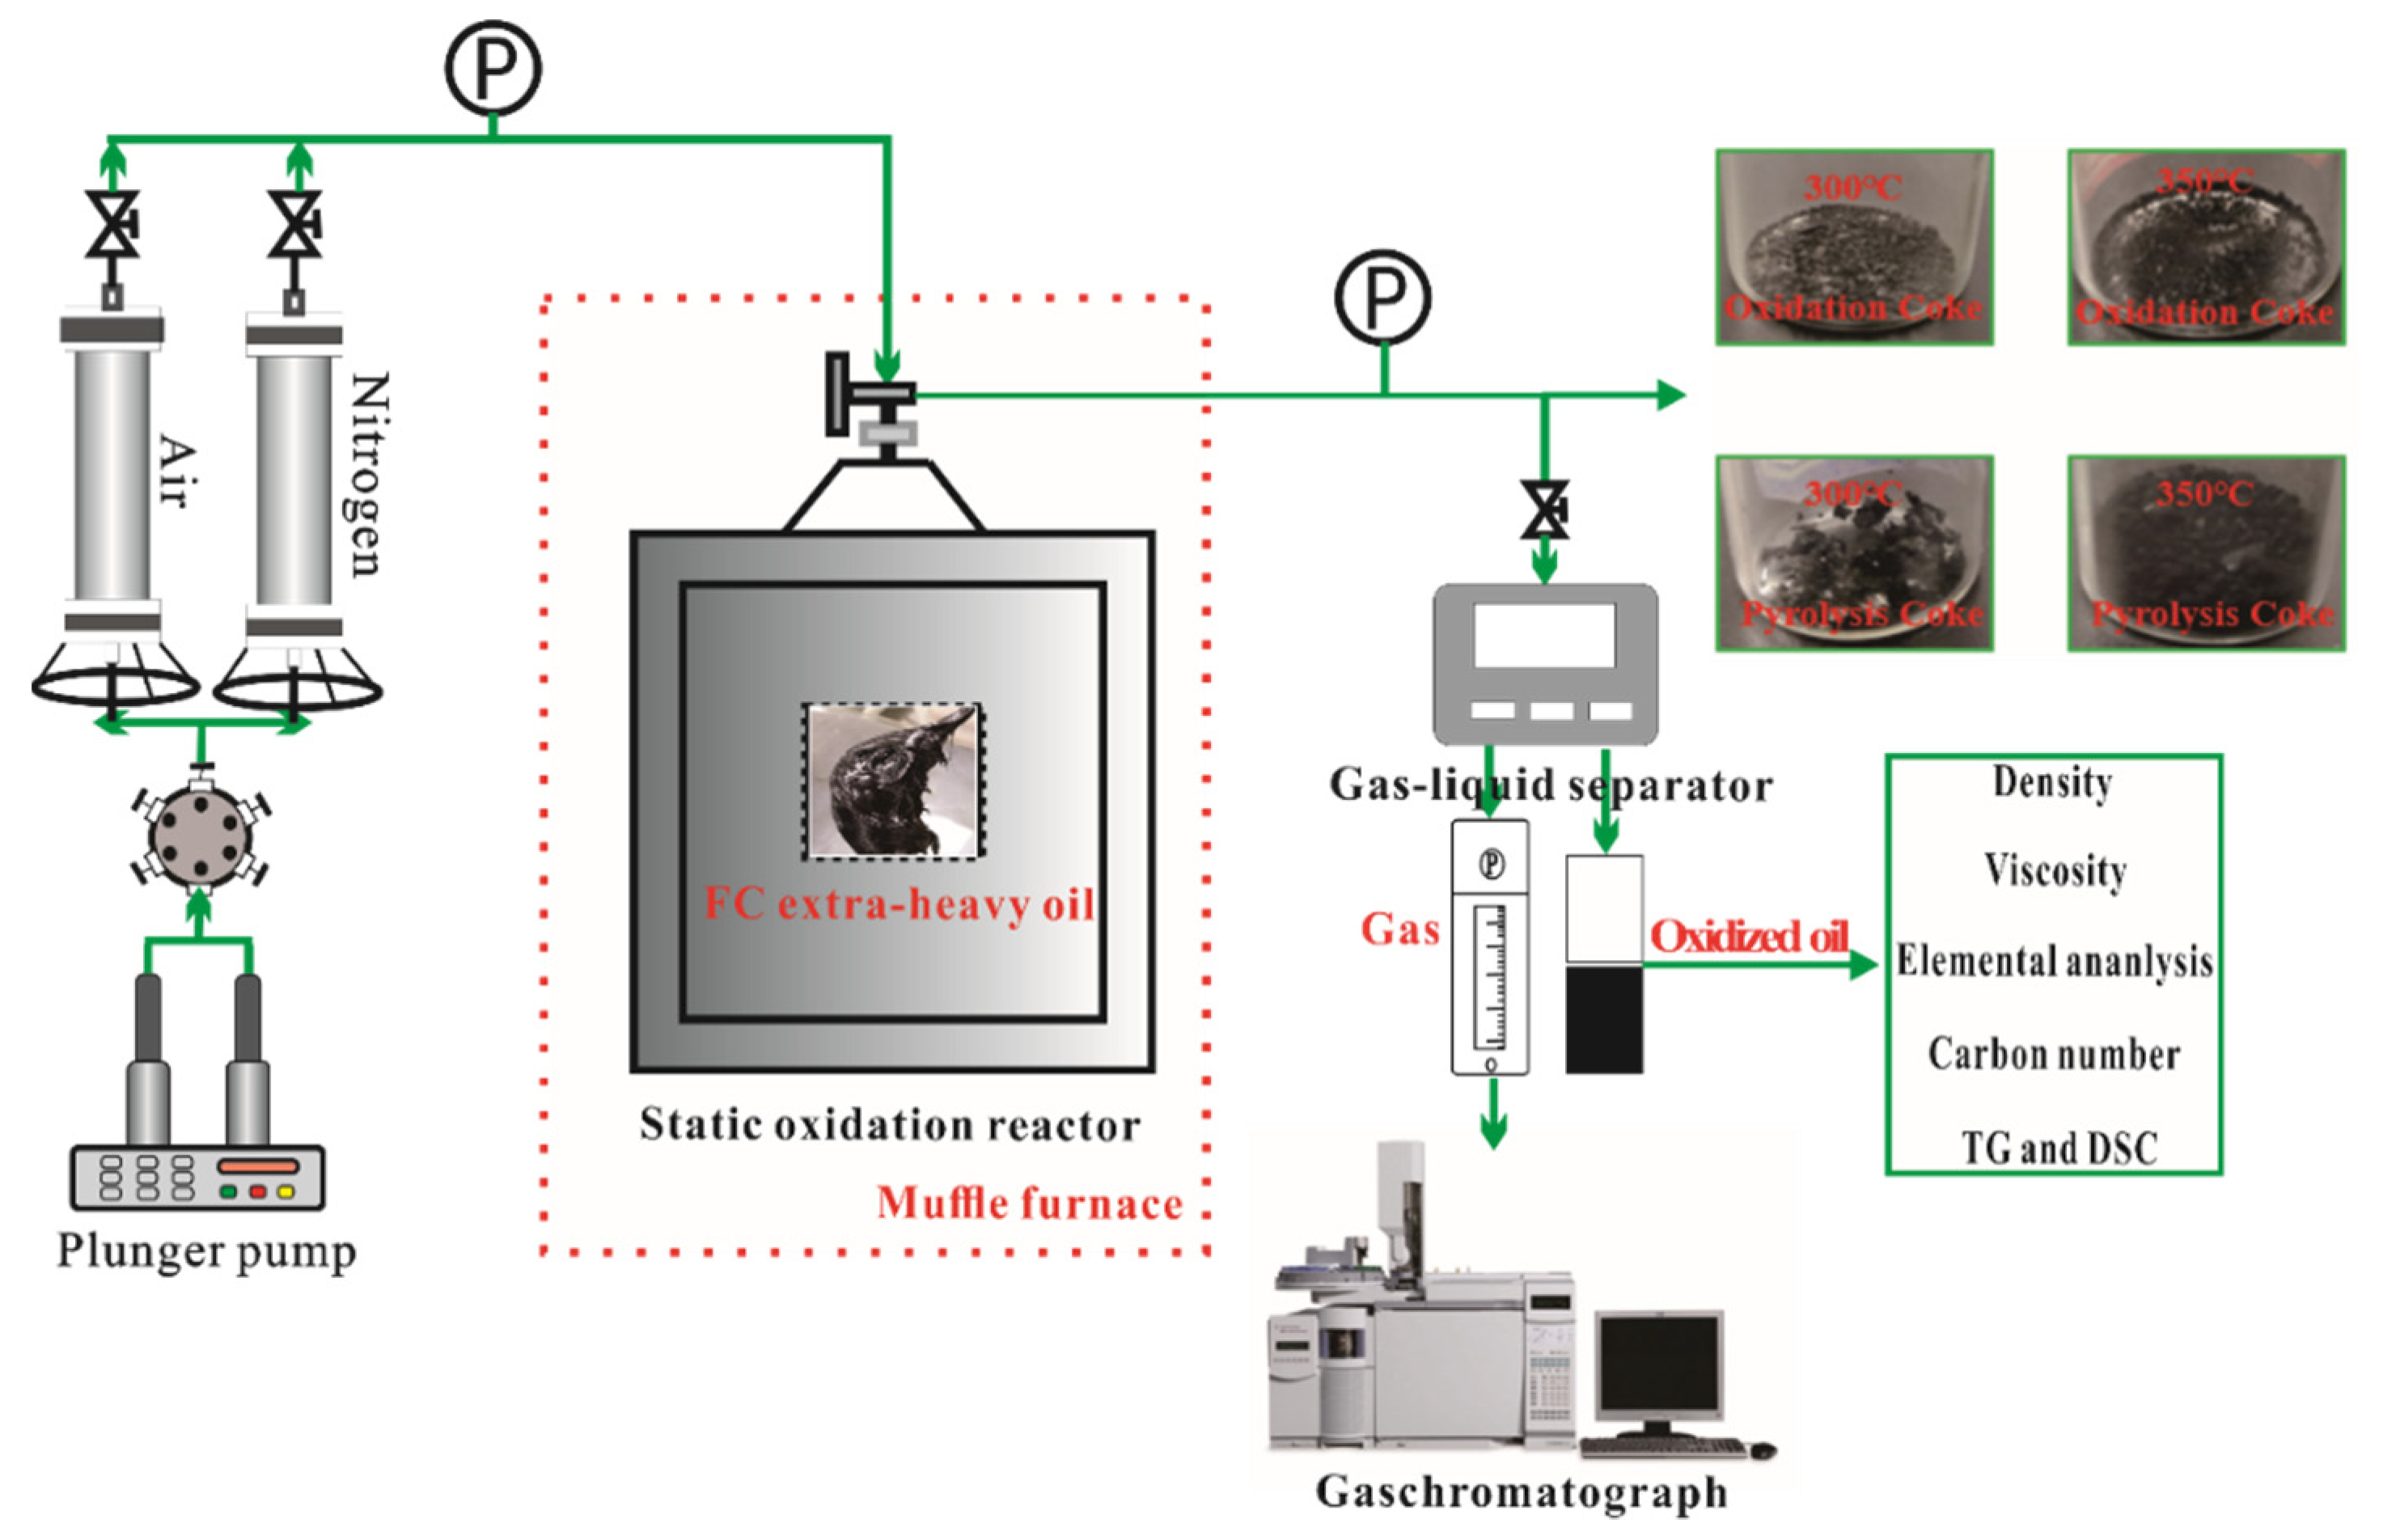
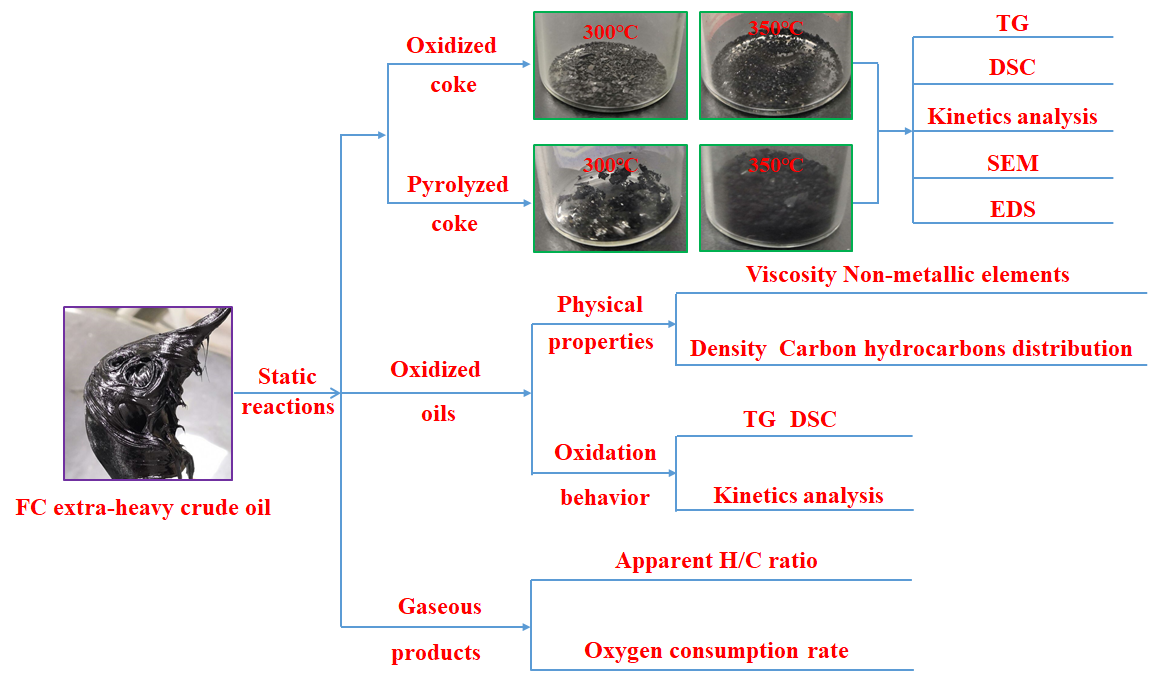
2.2. Static Isothermal Oxidation Experiments and Physical Property Analysis

A simplified schematic of the static isothermal oxidation experimental setup is shown in Figure 1. Firstly, 20 mL of dehydrated FC extra-heavy oil samples were placed into an oxidation reactor.; then, static isothermal oxidation experiments were carried out for 3 days in a muffle furnace at specific temperatures (50, 100, 150, 200, 250, 300, and 350 °C) and a constant pressure of 2.98 MPa (the original pressure of the FC oilfields). After isothermal oxidation reactions of FC extra-heavy oil at various experiment temperatures, oxidized oils and gaseous products were collected [25,27].
Through high-temperature and high-pressure rheometry (Anton Paar MCR302, 25–100 °C, 50 s−1), density metering (DMA48), and elemental analysis (Elementar Vario EL III), the viscosity, density, and non-metal elements of FC extra-heavy oil and its oxidized oils were tested, respectively. Before the experiment, the heavy oil was mixed with an equal volume of CS2 solvent to increase its fluidity. A packed column, hydrogen flame ionization detector was used, with a nitrogen carrier gas (99.999%) and and a flow ratio of hydrogen to air of 1:10. The split mode of the sampling system is an effective way to introduce a small amount of sample into the chromatographic column without causing column overload; the split ratio was 1:80. Both the front inlet temperature and the front detector temperature were 330 °C. The oven temperature was kept at 40 °C for 10 min and then rose to 320 °C at 5 °C/min. Using the TEST-CS method, micro syringe was used to draw 0.4–0.6 μL of oil samples or gaseous products into the chromatograph. Each run was implemented twice to ensure repeatability in this section [29,30,31].

2.3. TG and DSC Analysis

In this research, the combustion exothermic behavior of the FC extra-heavy oil and its isothermal oxidized oils was investigated through NETZSCH TG209F3 and DSC214. To guarantee the accuracy and repeatability of the experimental data, each TG and DSC test system was calibrated before each experiment according to the method reported by previous researchers [32,33,34]. Five milligrams (5 mg) of oil samples were used as the reactant. Each sample was heated from 30 to 700 °C at multiple heating rates of 5, 10, and 15 °C/min for the TG experiments. The DSC tests were kept at 30 to 600 °C at an average heating rate of 10 °C/min. The flow rates of the purge gas (high purity air) and protection gas (high purity nitrogen) were 50 mL/min and 20 mL/min, respectively, throughout all tests [27]. Each experiment was performed at least twice to guarantee reproducibility, and the error of mass loss and temperature did not exceed ±0.5 wt% and ±1 °C, respectively.

2.4. Kinetics Theory

During the combustion kinetics analysis process, two classical isoconversional kinetics models, i.e., the Friedman and Ozawa−Flynn−Wall (OFW) methods, were chosen to calculate kinetics parameters [35,36,37]. Compared with the conventional Arrhenius model, these model-free kinetics models allow for evaluation of the kinetic parameters without ascertaining the reaction model, to avoid the common compensation effect. In addition, these isoconversional kinetics models are beneficial for revealing complex oxidation reaction mechanisms due to the dependence of activation energy on the conversion degree [20,22,27,38].
The basic Friedman equation is written as follows:
ln [ β d α d T ] = ln [ A f ( α ) ] E R T
And the OFW model can be simplified as follows:
lg β = lg A E R g ( α ) 5.331 1.052 E R T
In the above isoconversional kinetics model, where α is the conversion rate, E is the activation energy, A is the frequency factor, T is the absolute temperature, β is the heating rate, R is the universal gas constant, f ( α ) is the activation energy distribution curve, and g ( α ) is the constant. Through ln ( β d α d T ) versus 1 / T , and ln β versus 1 / T , the slope and intercept from the kinetics fitting lines of the each oil sample were obtained, and the activation energy and Arrhenius constant could be calculated, respectively.

3. Results

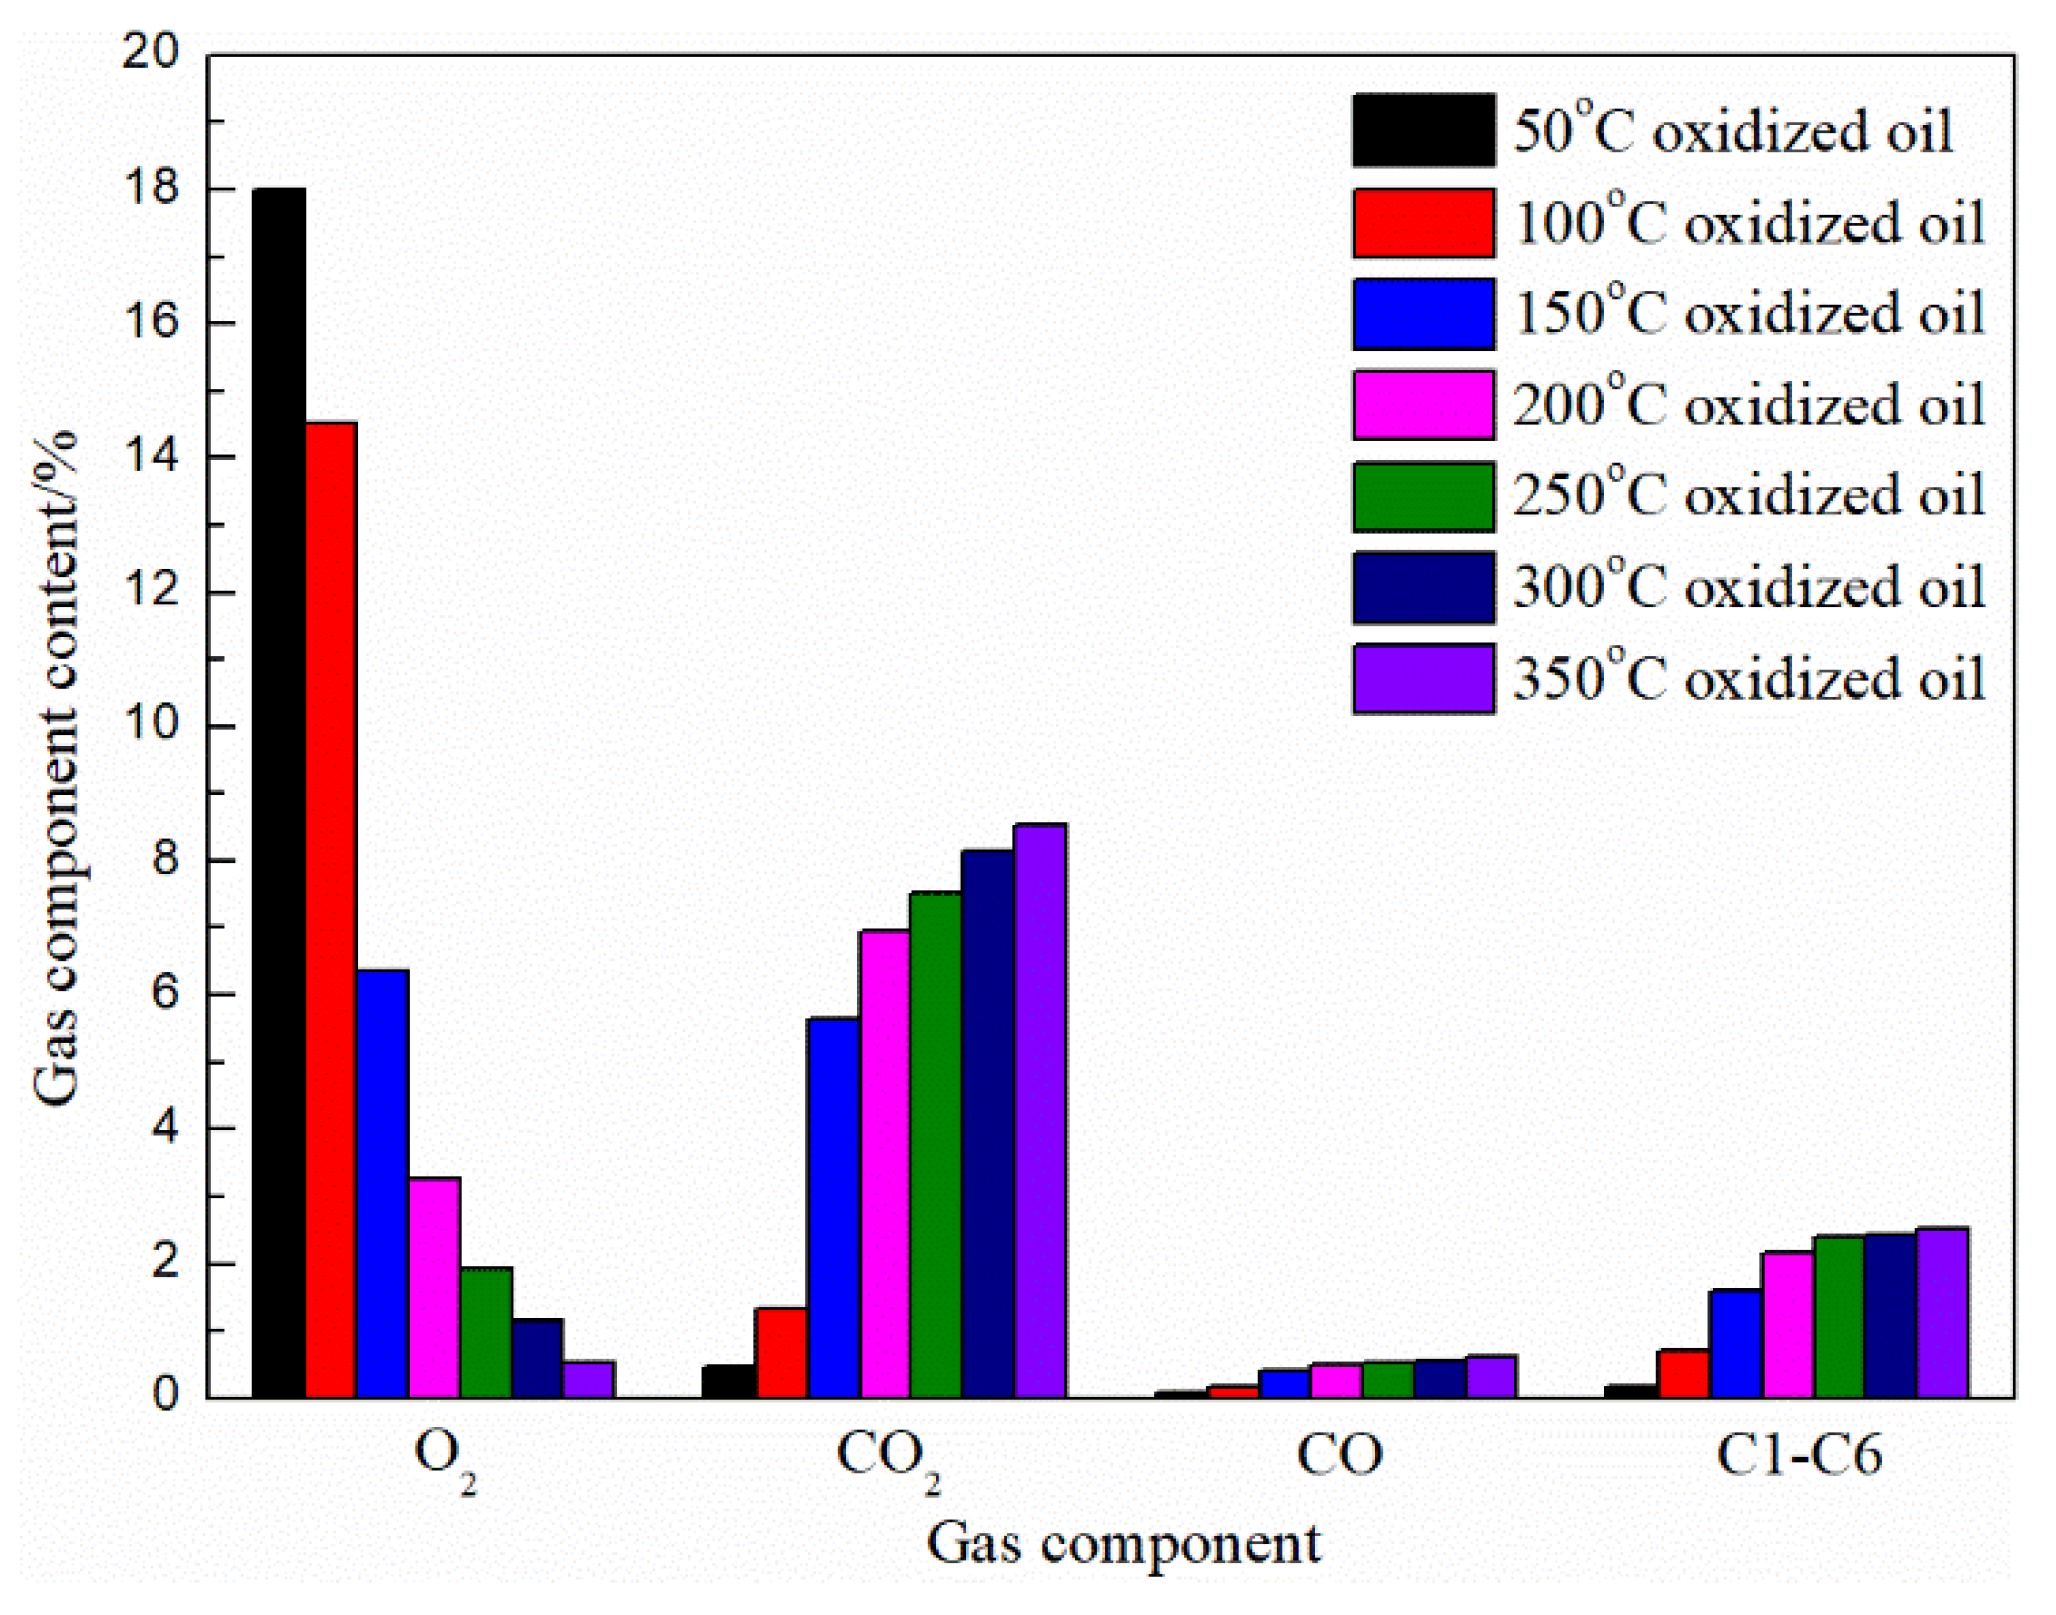
3.1. Analysis of the Gaseous Products

Based on the GC test results of the gaseous products, the apparent H/C ratio, oxygen consumption rate (OCR), CO/CO2 value (R), and other parameters were calculated.
Apparent H/C ratio value:
H / C = 4 [ v 0 ( γ i / v i ) CO 2 0.5 CO γ 0 ] / [ CO + CO 2 ]
Oxygen consumption rate:
OCR ( % / d ) = ( 21 γ 0 ) / 3 d
CO/CO2:
R = CO / CO 2
Where CO is thevolume fraction of CO in gaseous products, CO2- is the volume fraction of CO2 in gaseous products, γ i is thevolume fraction of O2 in injected air, γ 0 is the volume fraction of O2 in gaseous products, v i is the volume fraction of N2 in injected air, and v 0 is thevolume fraction of N2 in gaseous products.
Our previous research shows that the oxidation characteristics of SARA fractions and their interactions should not be ignored while investigating the oxidation and exothermic behavior of crude oil [9,14]. Compared to other fractions, saturate structure is relatively stable, and its composition and properties hardly change during LTO. Aromatic LTO is closely related to the length and number of side chains and aromatic rings. In the early stage of oxidation, the aromatization of alkane chains in aromatics is the main factor which promotes the increase of aromatics content. As the degree of reaction deepens, a large number of aromatics are oxidized or condensed, which improves molecular polarity and promotes the gradual transformation of aromatics into resins. The oxidation behavior of resins is characterized by fracturing and isomerization during early LTO, resulting in more long-chain alkane chains; cyclization and aromatization reactions follow. Condensation is the main reaction pathway for resins, and the pattern changes from light resins to heavy resins and then to asphaltenes. Compared with condensation to produce high polycondensation aromatics, the oxidation of asphaltenes is mainly caused by associations between polar molecules. The average molecular weight of asphaltenes increases with the association reaction, which is generally manifested as a condensation reaction of thick cyclic aromatic hydrocarbons [20,26,39,40,41].
Previous research into oxidation characteristics and interactions of SARA components was conducive to an in-depth understanding of the oxidation reaction mechanism of crude oil. During the FC extra-heavy oil oxidation, a series of complicated reactions such as distillation volatilization, free radical production, oxygen addition, cracking, and polycondensation, etc., are carried out at the same time. This section mainly studies the effect of static oxidation temperature on the components of gas products. The GC test experiment was performed, and the parameters such as H/C and oxygen consumption rate were calculated. The test results are shown in Table 2.
Table 2 lists the GC test results of gaseous products from the FC extra-heavy oil isothermal oxidation experiment. The relative percentage of O2 kept decreasing with the static oxidation temperature, and the volatilization of light components resulting in C1–C6 increased. The amount of CO2 in the produced gas was as follows: 8.26% (350 °C) > 7.68% (300 °C) > 6.91% (250 °C) > 6.13% (200 °C) > 4.66% (150 °C) > 1.32% (100 °C) > 0.46% (50 °C). LTO reactions of heavy oil were weak at 50 °C conditions. When the temperature rose to 150 °C, the oxygen consumption rate increased from 0.91%/day to 4.38%/day, and the amount of CO2 generated increased from 0.46% to 4.66%. There were multiple reaction pathways between oxygen molecules and crude oil in the LTO stage: Firstly, the active aliphatic compounds and oxygen molecules underwent free radical reactions to generate alkyl radicals and hydroxyl radicals. Alkyl radicals are likely to further react with oxygen molecules to generate peroxyalkyl radicals. Then, peroxyalkyl radical and aliphatic compound oxidation reactions occur, mainly producing hydroperoxides. In the late stage of LTO, isomerization and polycondensation reactions of hydroperoxides are dominant and produce some oxygen-containing compounds such as alcohols, aldehydes, and carboxylic acids et al. And these oxygenated derivatives can continue to undergo decarbonylation and decarboxylation reactions, generating a certain amount of CO2, CO, and H2O [26,27].
Figure 2 shows the composition changes of gaseous products at different static oxidation temperatures. The level of oxygen consumption was always greater than the sum of CO and CO2 in collected gas, which indicates that the oxygen addition reaction was the main pathway in heavy oil LTO. During LTO, oxygen atoms tend to attack active hydrogen in strong polar macromolecules such as resins and asphaltenes, and generate a large amount of oxygen-containing derivatives, which will increase the number of oxidation reactions and gain a lower H/C. As the temperature rose to 150 °C, H/C decreased from 20.94% to 8.31%, which means that the increase of static oxidation temperature was beneficial to deepen the degree of FC extra-heavy oil LTO reactions.

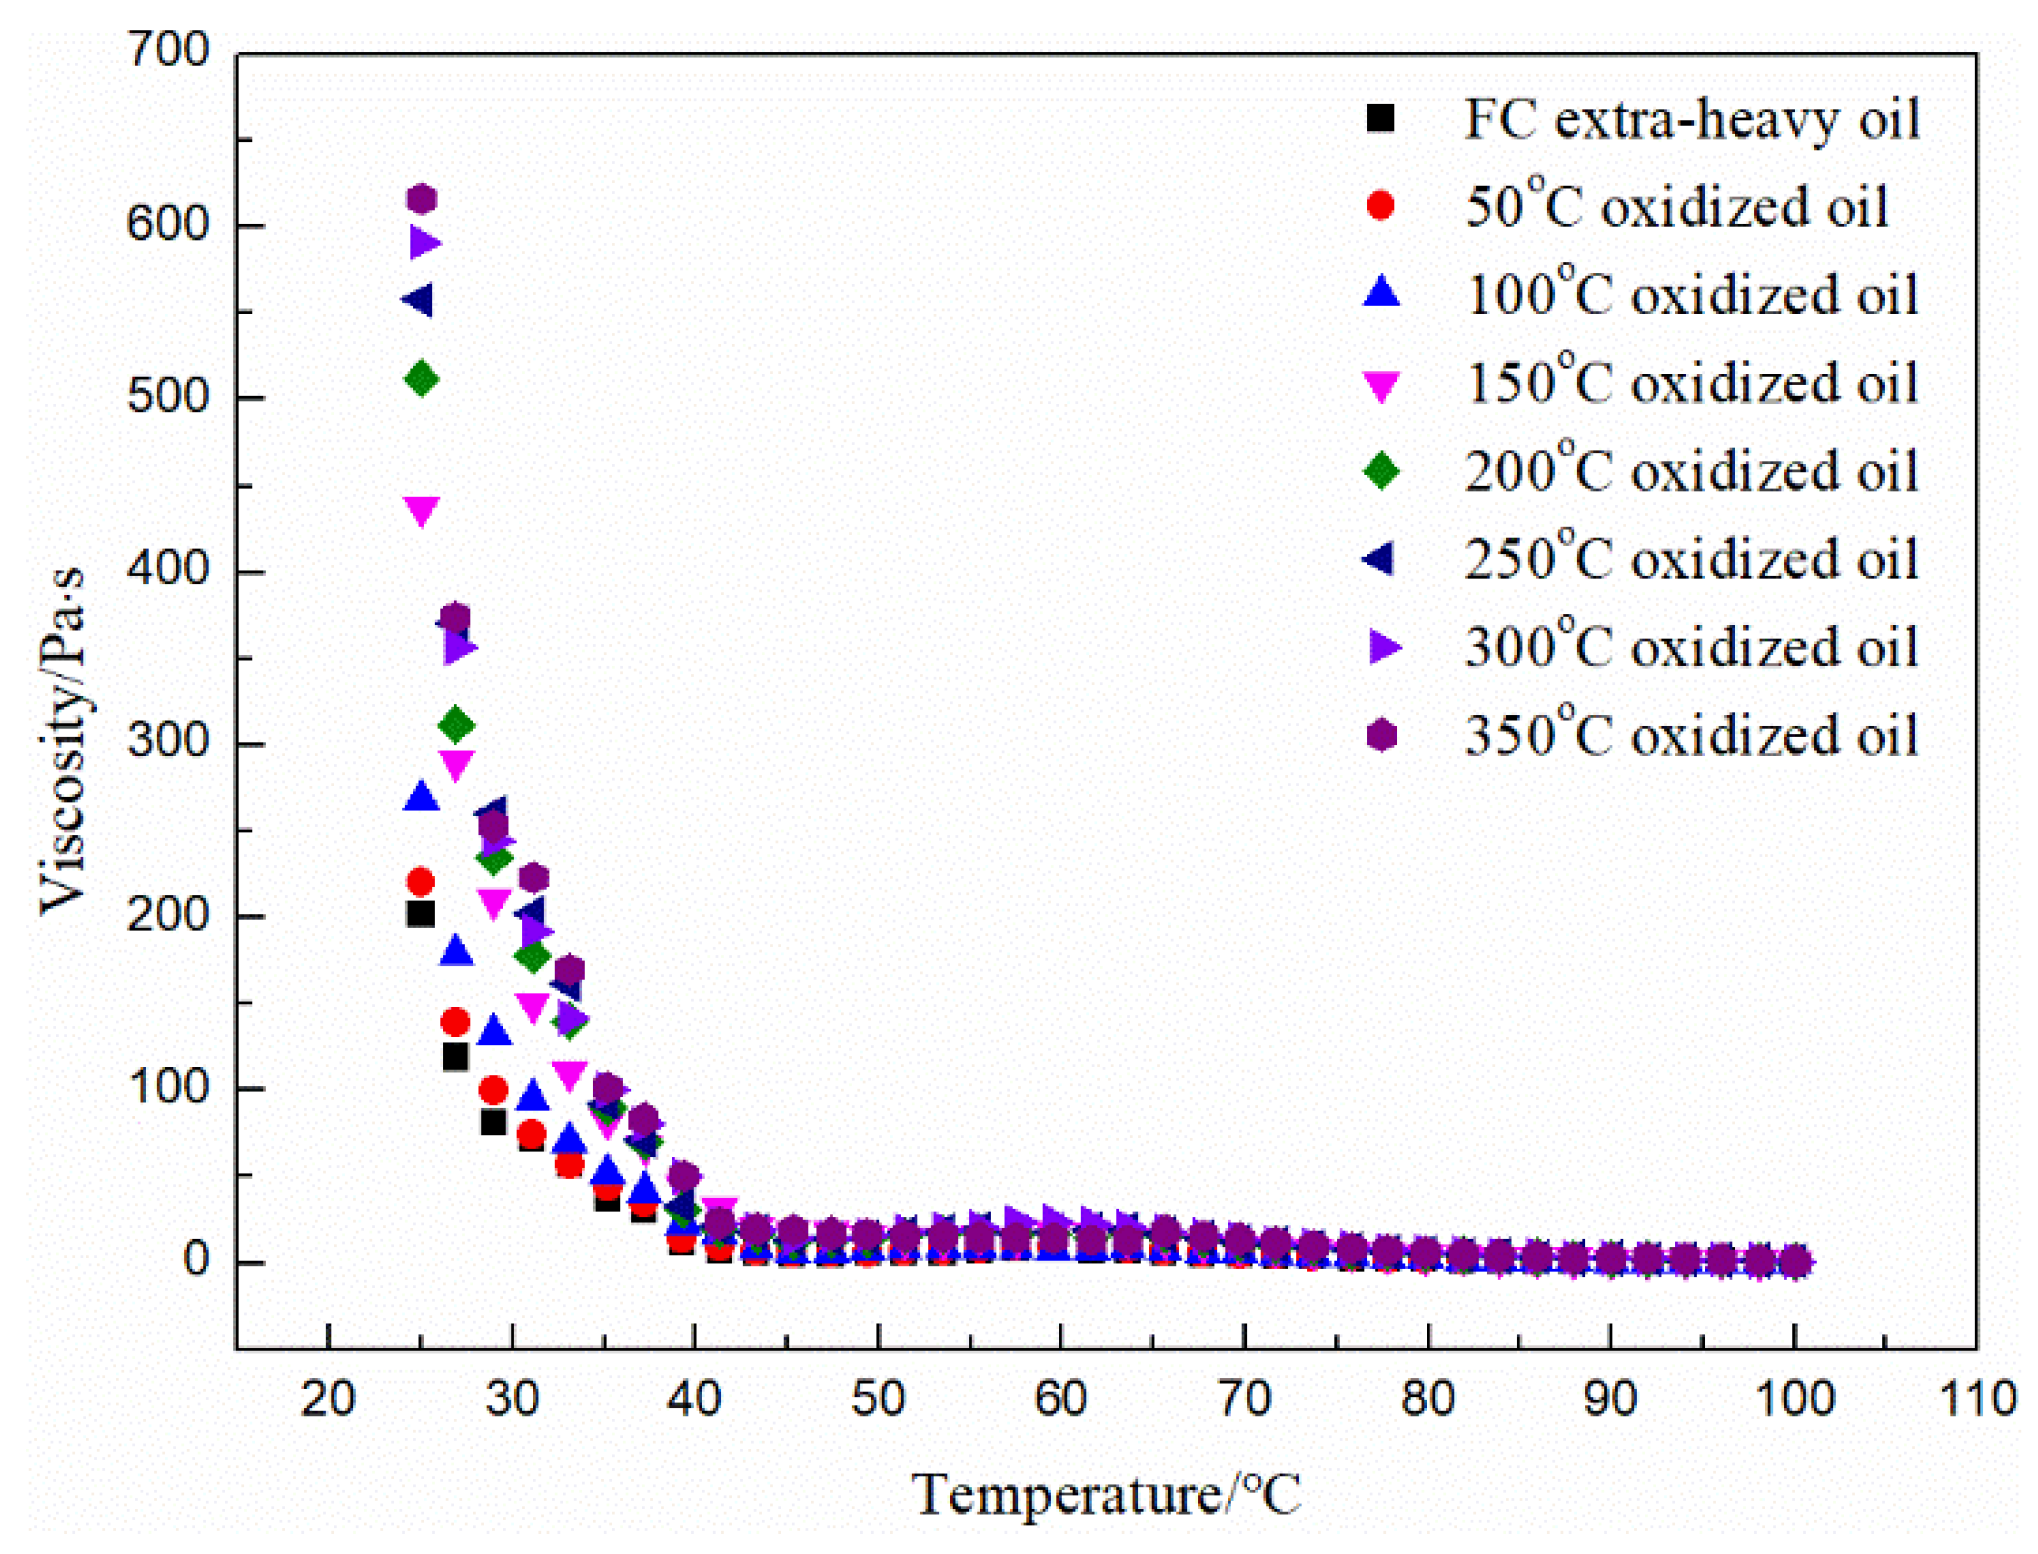
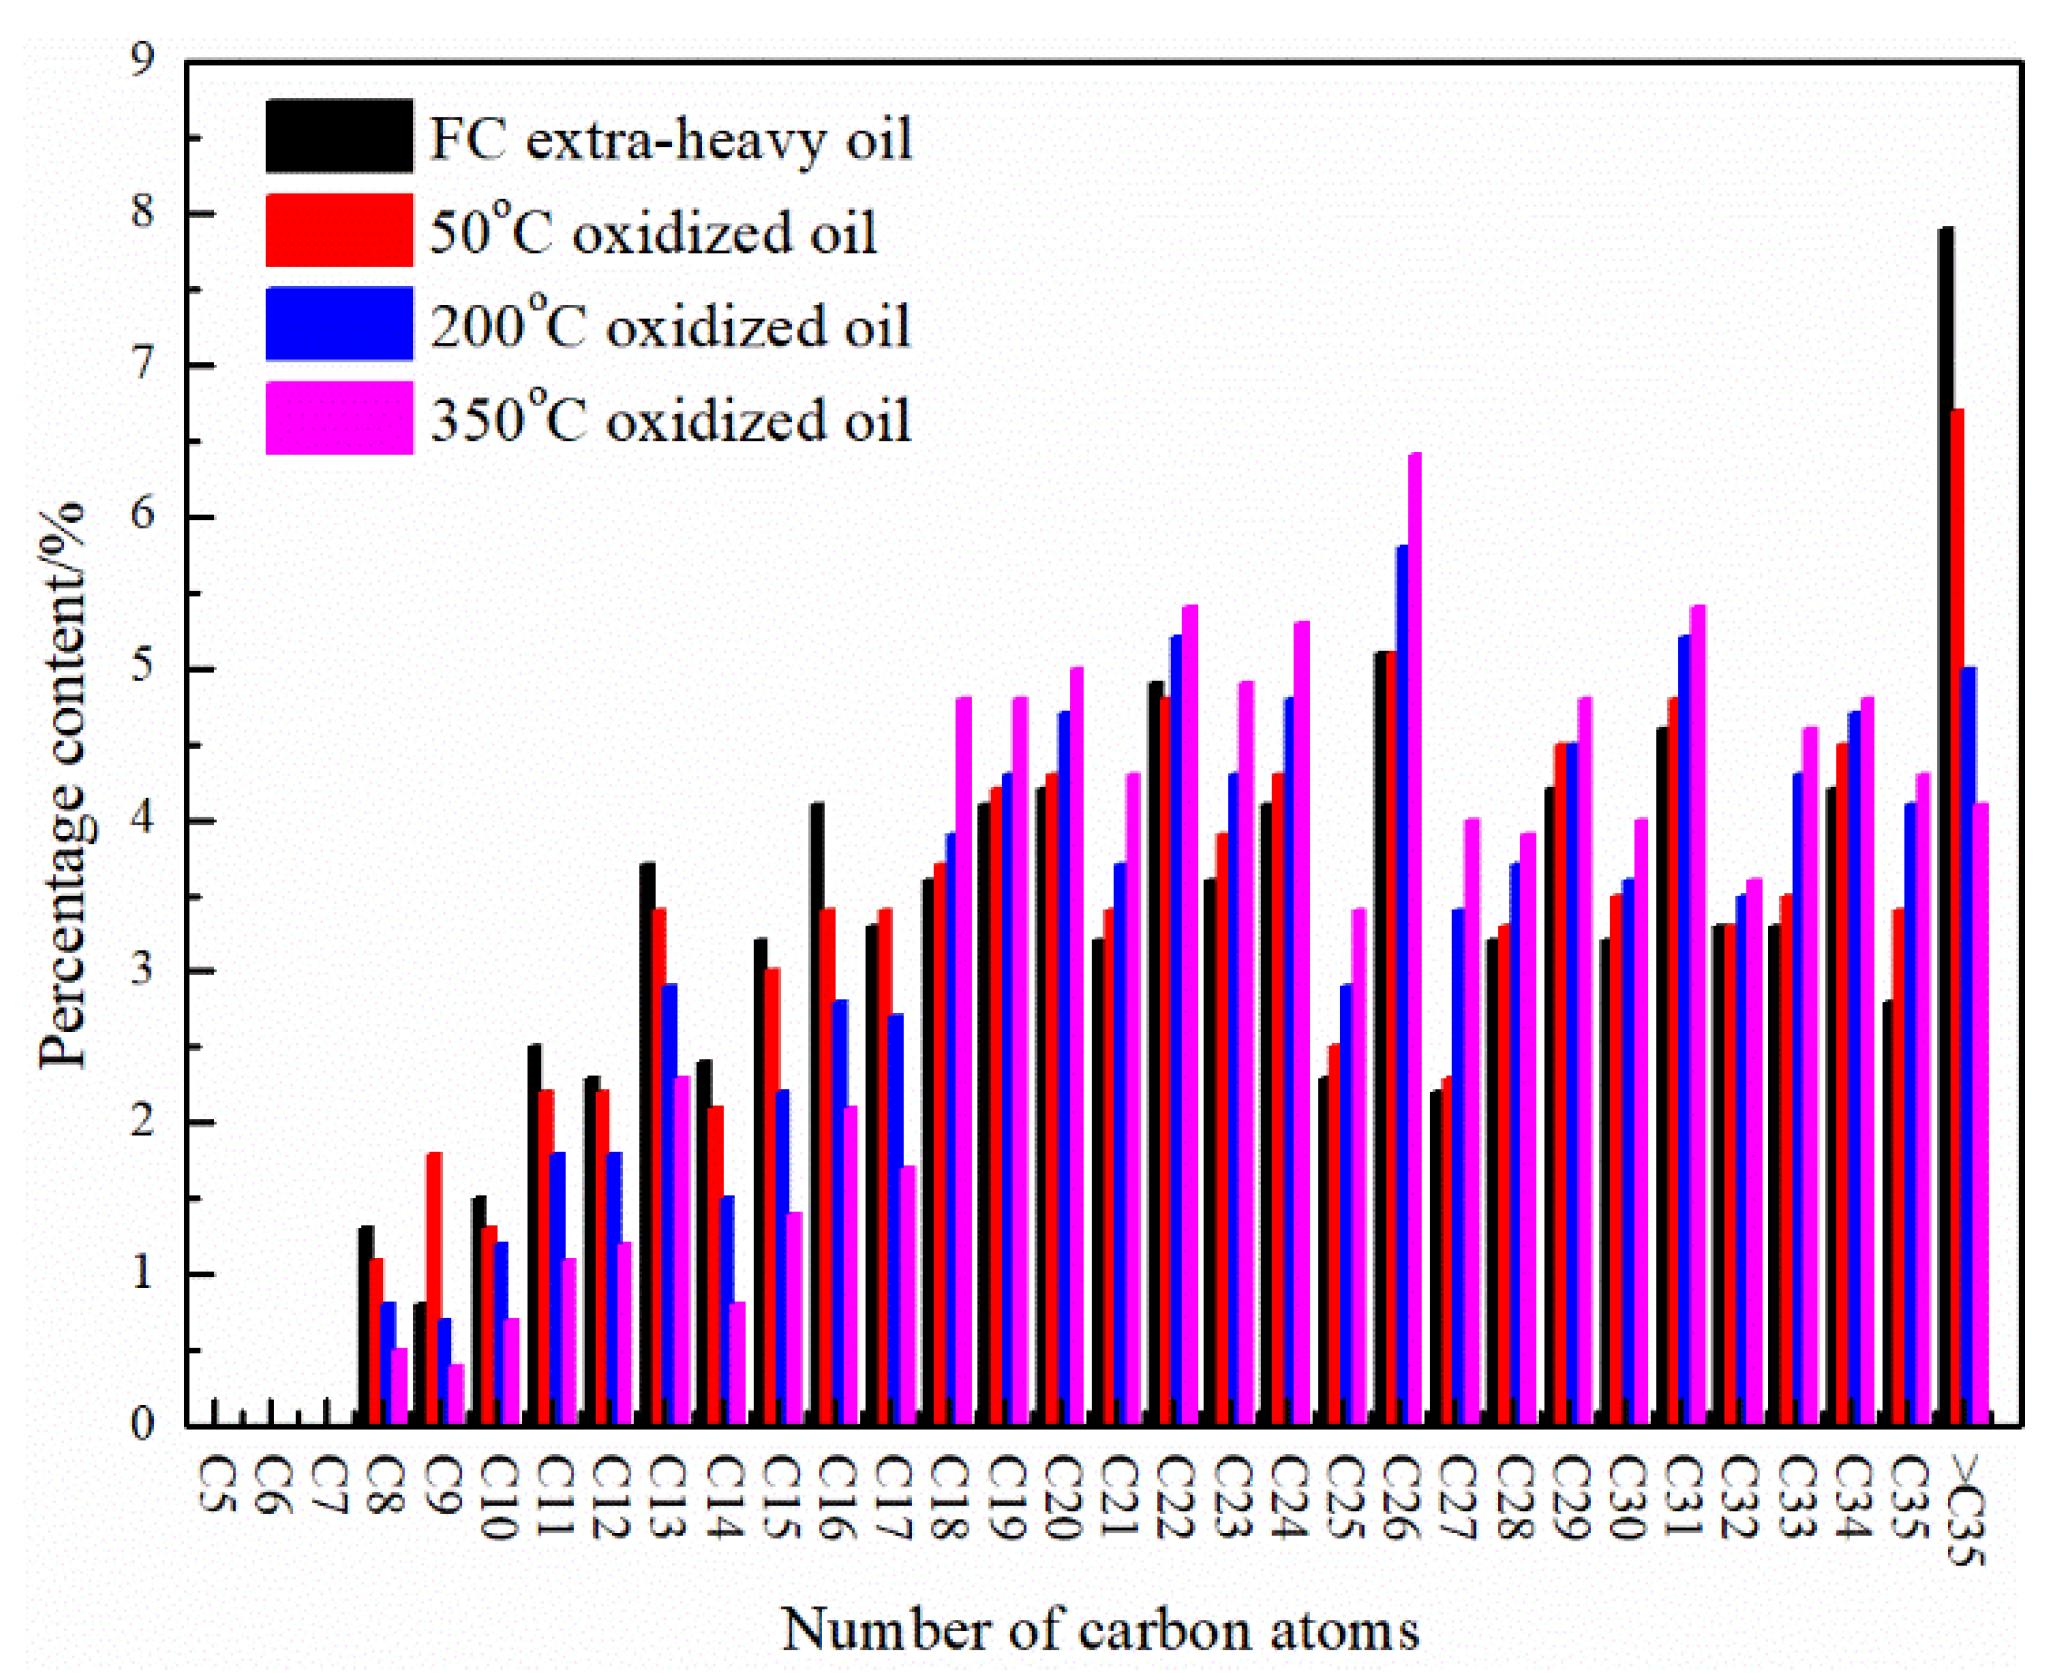
3.2. Basic Property Analysis of the Oxidized Oils

After the static isothermal oxidation experiment of the FC extra-heavy oil, the basic physical properties of oxidized oils were characterized, mainly including density, viscosity, carbon hydrocarbon distribution, non-metallic elements, etc. By analyzing the physical properties of the oxidized oil, it is helpful to understand the LTO reaction mechanism of FC extra-heavy oil.
Figure 3 shows the viscosity–temperature curves of FC extra-heavy oil and oxidized oils, and Table 3 lists the density and viscosity values of FC extra-heavy oil and its oxidized oils. On the whole, the viscosity and density of oxidized oil continued to rise with the increase of static oxidation temperature. When the temperature was higher than 150 °C, the viscosity and density increases in the oxidized oil started to slow down gradually. However, this cannot be ignored, because the LTO heat effect of heavy oil can trigger the decomposition of some oxygen-containing derivatives. Therefore, when the oxidation temperature was greater than 150 °C, there was a slower rate of increase in the density and viscosity of the oxidized oil.
Figure 4 shows the test results for the non-metallic element content of isothermal oxidized oils. Compared with other elements, the O content fluctuated greatly with the increase in static oxidation temperature, and it continued to rise. This once again shows the dominance of the oxygen addition reaction in LTO. In addition, due to the dehydrogenation aromatization, decarboxylation, and decarbonylation reactions during the LTO process, the content of H elements in the oxidized oil showed a declining trend.
Figure 5 compares the hydrocarbon distribution of FC extra-heavy oil, and the 50 °C, 200 °C, and 350 °C oxidized oils. Before the oxidation reaction, the relative percentage of intermediate components (C7–C17) in crude oil was 26.0%, while the relative percentage of heavy components (>C17) was as high as 74.0%. After being oxidized at 50 °C for 3 days, the relative percentage of intermediate fractions decreased to 23.9%, the content of heavy compounds of oxidized oil increased, and its relative content increased to 76.1%. This is because the early oxidation reaction is always accompanied by the oxygenation reaction of the active components in the heavy oil. The oxygen molecules and the active aliphatic fractions undergo an oxygen addition reaction, which will produce more hydroperoxide of molecular weight. Therefore, the relative percentage of the C7–C17 in the oxidized oil was reduced, while the relative percentage of most of the heavy components increased compared to before the oxidation reaction. In addition, it can be seen from the alkane distribution diagrams of oxidized oil at 200 °C and 350 °C that the content of heavy components in oxidized oil increased continuously, and that the alkane distribution shifted to the right. This shows that the oxygen addition reaction and the polycondensation reaction dominated during the LTO reaction, and the increase of the static oxidation temperature increased the heavy components with large molecular weights.
It can be seen from the physical property test results of the gaseous products and oxidized oils, that the heavy oil LTO mainly involved the following processes: Firstly, the branch chains of the alkane and aromatic hydrocarbons in the crude oil were broken under the collision of oxygen atoms. Subsequently, a dehydrogenation and oxygenation reaction occurred on the broken carbon chain. The dehydrogenation and oxygenation reactions refer to the process in which oxygen atoms in the air replace the hydrogen atoms in the alkane molecule through effective collisions to form covalent bonds with carbon atoms, which will generate more oxygen-containing derivatives with large molecular weights. The relative percentage of O in the oxidized oil increased and the C and H decreased.

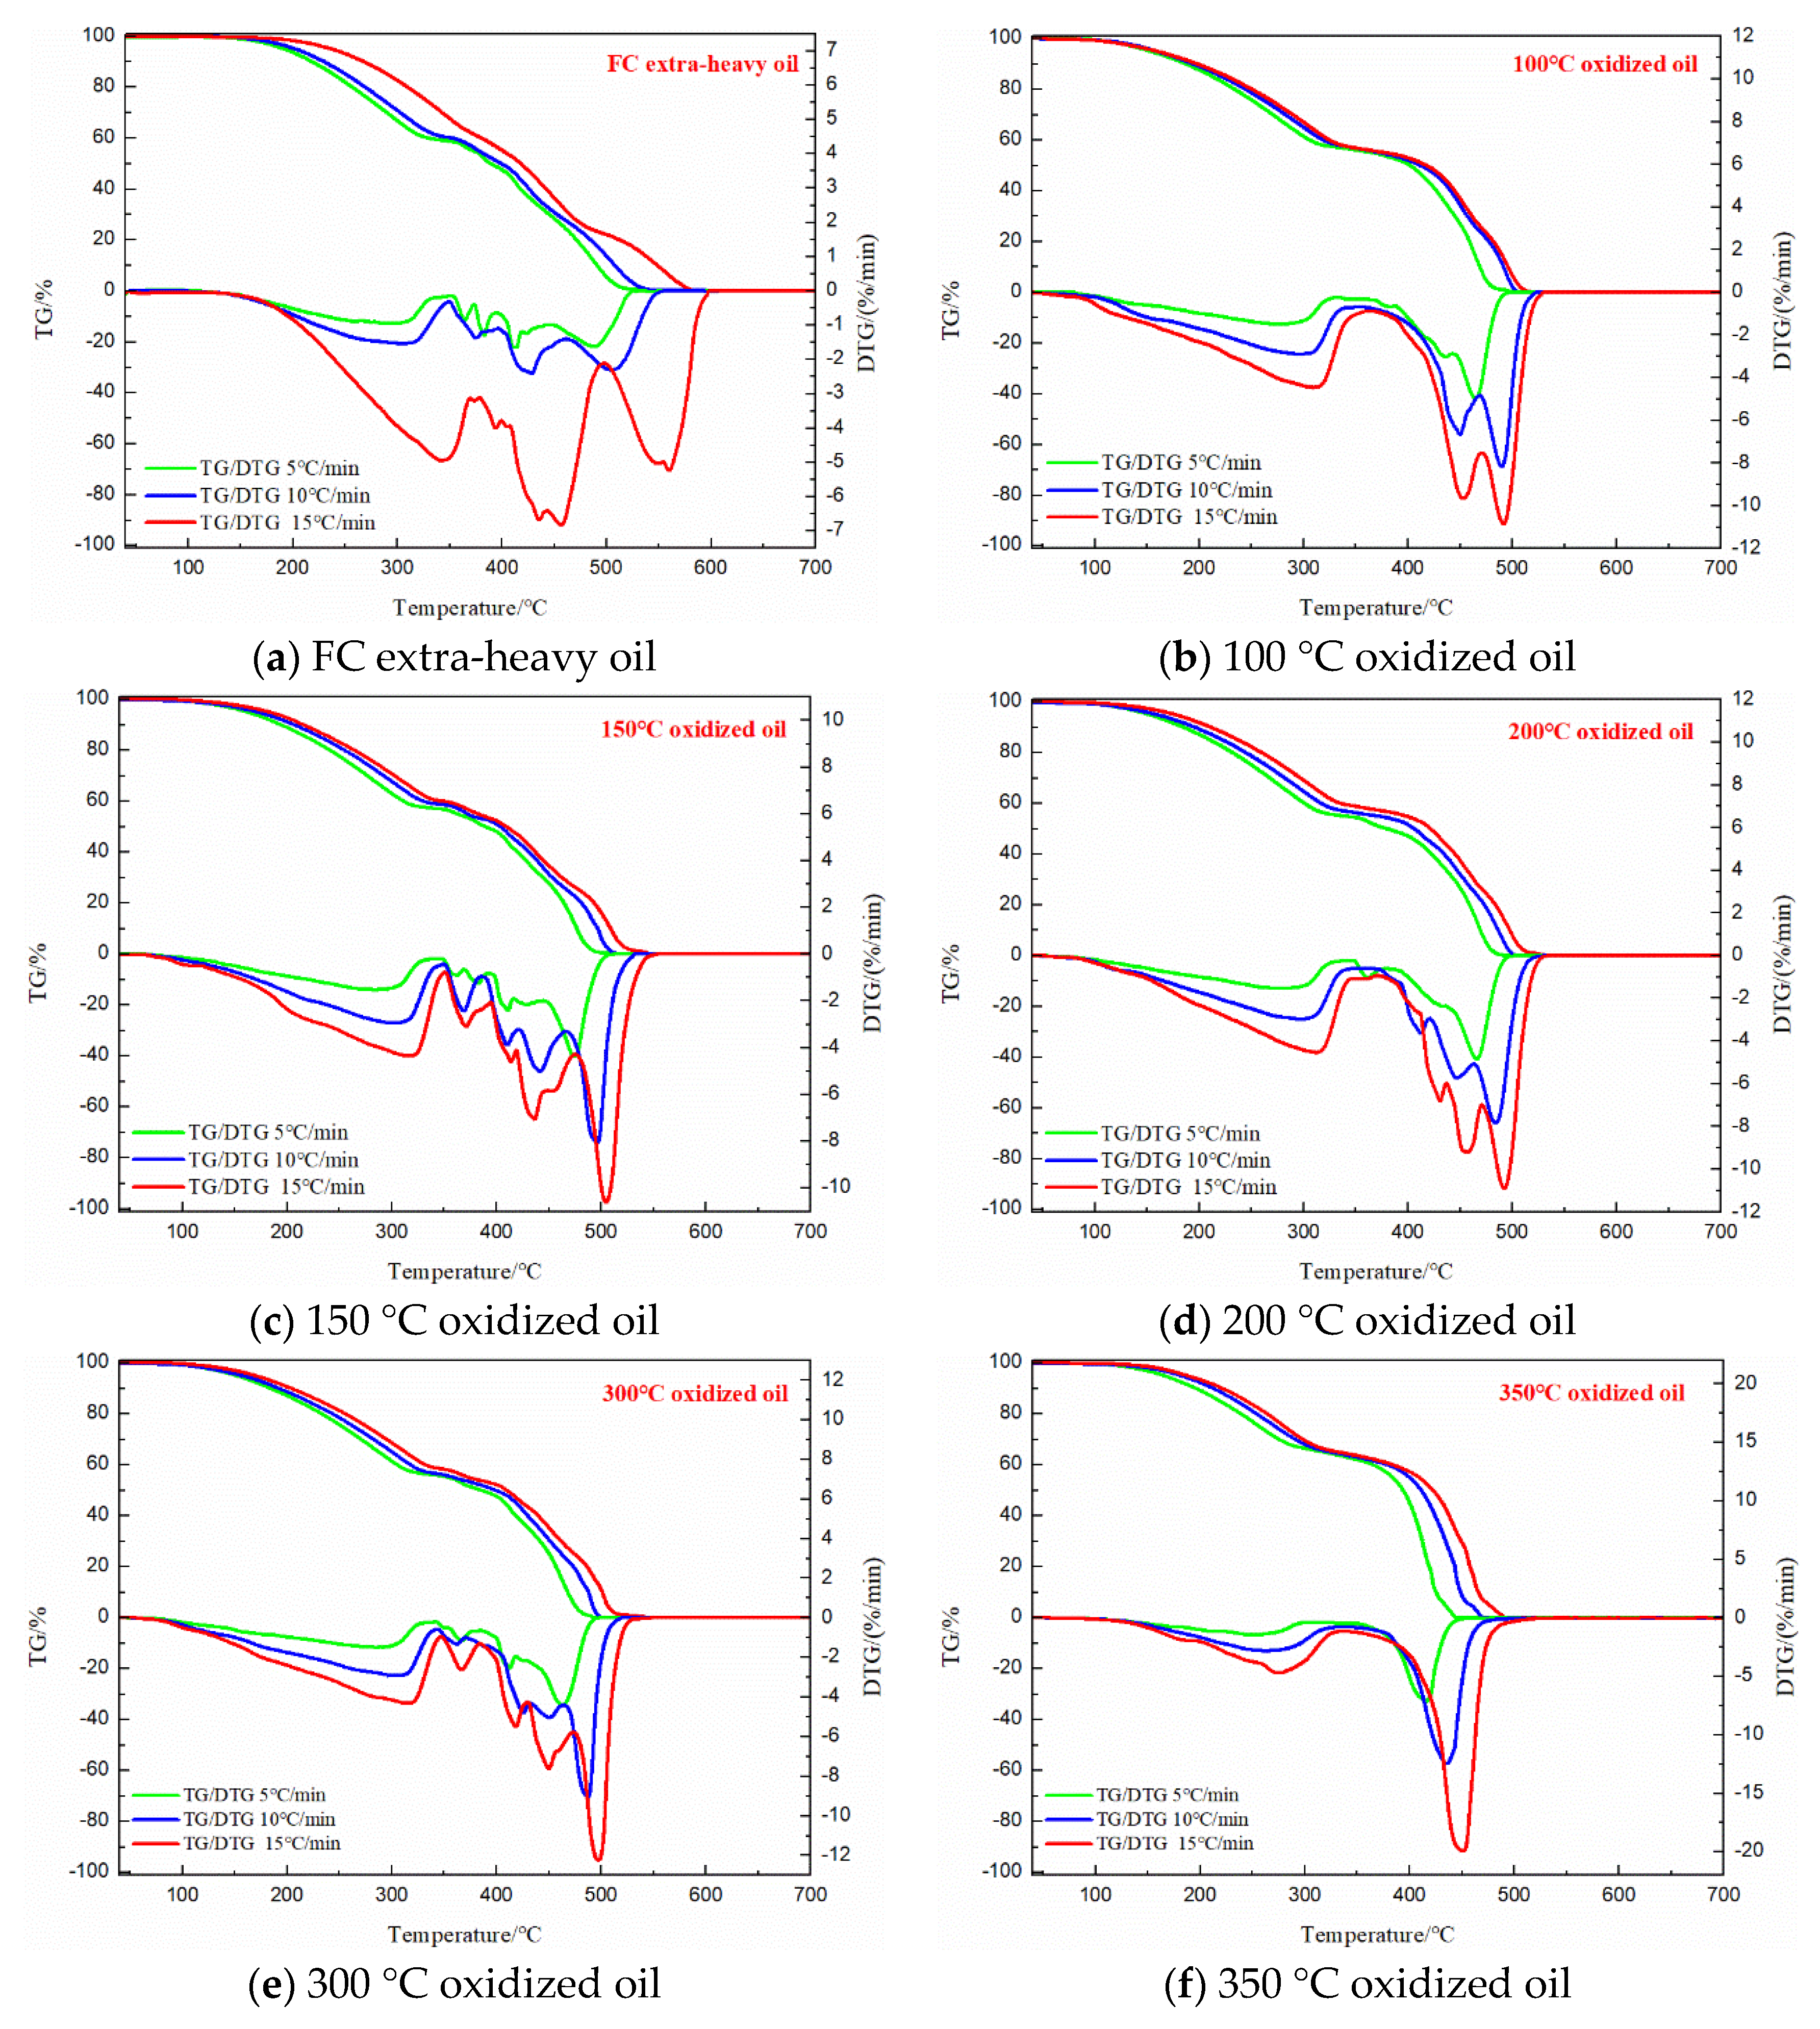
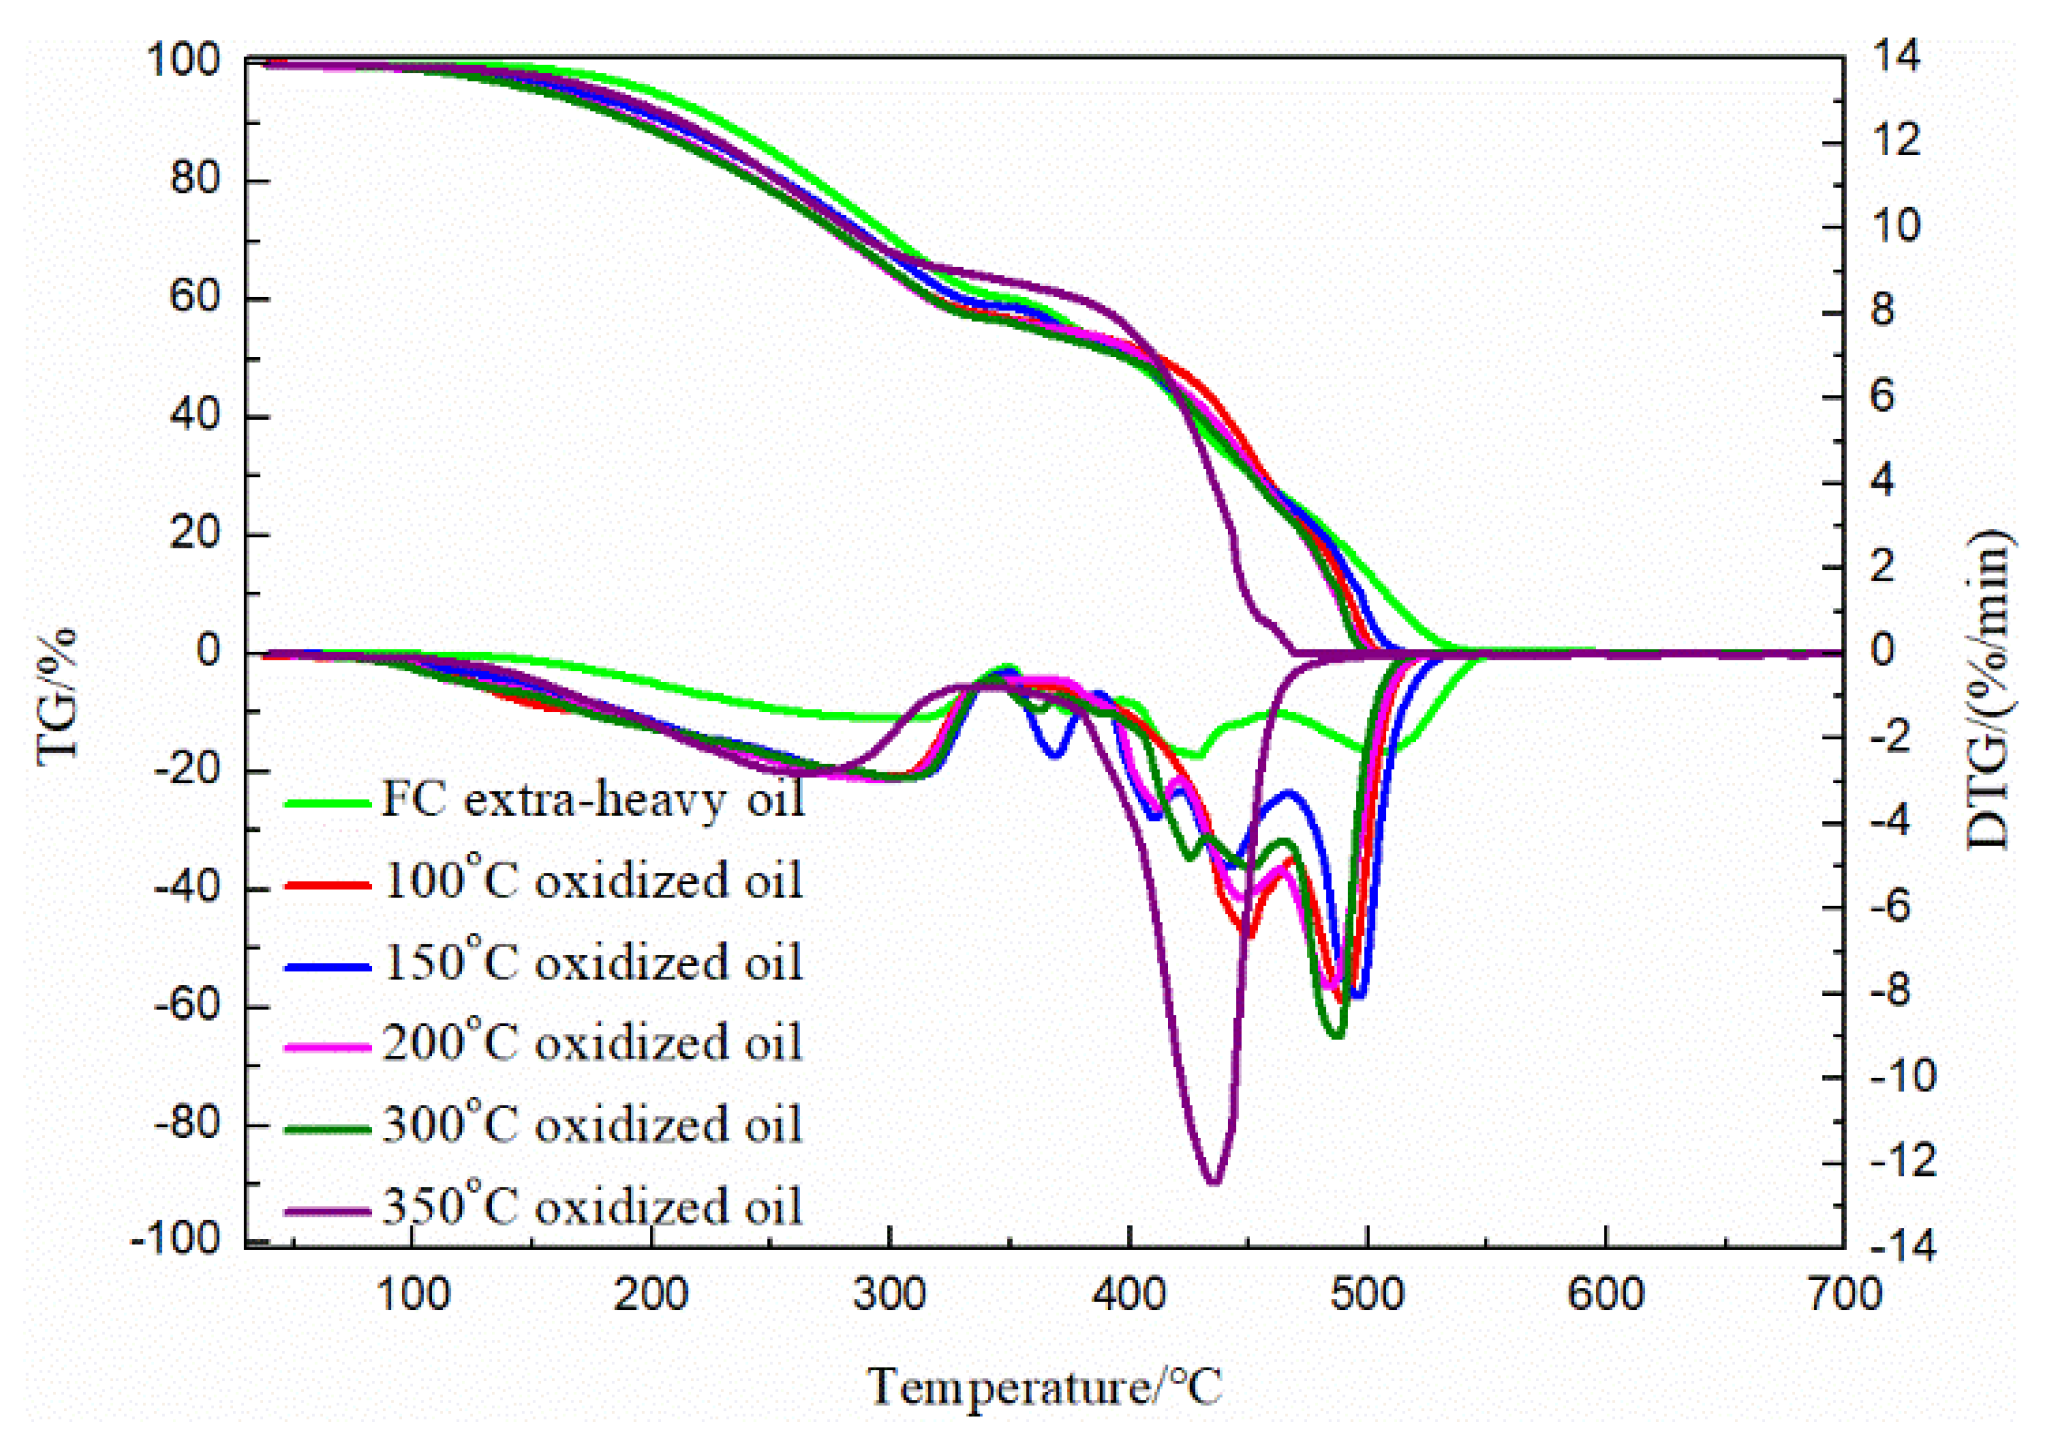
3.3. TG Analysis of the FC Extra-Heavy Oil and Oxidized Oils

Figure 6 shows the non-isothermal TG/DTG curves of FC extra-heavy oil and its isothermal oxidized oils. The reaction regions and other parameters of each oil sample are identified in Table 4. On the whole, the reaction regions, and peak temperatures of all samples increased with the heating rate. The faster the temperature rose, the shorter the time it took to reach the target temperature, and he ambient temperature could induce more active components in a short period of time to undergo oxidation reactions, including oxygenation and dehydrogenation aromatization, etc. The higher heating rate resulted in a faster mass loss in the LTO; however, the oxidation time of each area can be reduced due to the acceleration of the heating rate, so the mass loss of the oxidized oil in the LTO at different heating rates is almost the same [15,42]. In addition, it is worth noting that at the HTC stage, the mass loss of each oil sample decreased as the heating rate increased. This shows that the heating rate had an impact on the deposition of coke during the heavy oil oxidation reactions. The increase in heating rate shortened the heating duration of the oxidation reactions, causing some oxygen-containing components to be too late in forming the reactive coke, thereby affecting the activity and quantity of coke. Compared with FC extra-heavy oil and other oxidized oils, only 350 °C oxidized oil showed clear LTO and HTC areas, a nd the DTG peak in the HTC stage was much more pronounced—indicating that the rate of mass loss of 350 °C oxidized oil at HTC was much higher than that of other oxidized oils.
The TG/DTG curves of the FC extra-heavy oil and oxidized oils at 10 °C/min are shown in Figure 7. Except for 350 °C oxidized oil, other oxidized oils have almost similar mass loss values in the LTO and FD stages. The mass loss of all oxidized oil in the HTC is greater than that of FC extra-heavy oil. As the static isothermal oxidation temperatures increased, the mass loss of oxidized oils in the HTC stage increased. Under the condition of a heating rate of 5 °C/min, the mass loss of all samples in the HTC were, in turn, 28.6% (FC extra-heavy oil), < 30.6% (100 °C oxidized oil), < 32.2% (150 °C oxidized oil), < 34.1% (200 °C oxidized oil), < 40.2% (300 °C oxidized oil), and < 65.6% (350 °C oxidized oil). This shows that the FC extra-heavy oil undergoing LTO reactions was more conducive to the deposition of coke, which is of great significance for maintaining the stability and continuous advancement of the combustion front. Additionally, the DTG curves of heavy oil and other oxidized oils all show three continuous reaction zones, namely, LTO, FD, and HTC. Firstly, there was no mass loss of heavy oil over 550 °C. Compared with FC extra-heavy oil, when the temperature rose to about 520 °C, the mass loss of all oxidized oil was close to 100%. This indicates that the oxidized oils undergo oxidation reactions again, and that the oxidation temperature range becomes smaller. At the same time, the oxidation reaction termination temperature of 350 °C oxidized oil was much lower than that of other oxidized oils, and the mass loss rate rapidly accelerated in the region of 400–500 °C. This shows that after the LTO reaction of heavy oil occurring at 350 °C, the oxidation reaction activity is enhanced, especially during the HTC stage. In addition, the DTG peak temperatures of the five oxidized oils in the LTO stage was basically the same over the interval temperature range. This shows that the LTO reaction pathways are the same when the heavy oil that has experienced the oxidation reaction in the lower temperature condition undergoes the LTO reactions again. Finally, the rate of mass loss of FC extra-heavy oil in each oxidation reaction zone was lower than that of oxidized oils, which may be related to the intermolecular force of the heavy oil itself and the interactions between its SARA fractions. When the LTO reactions of heavy oil occur, these interactions may be destroyed as the temperature rises, so the thermal stability of the heavy oil worsens [23,25].

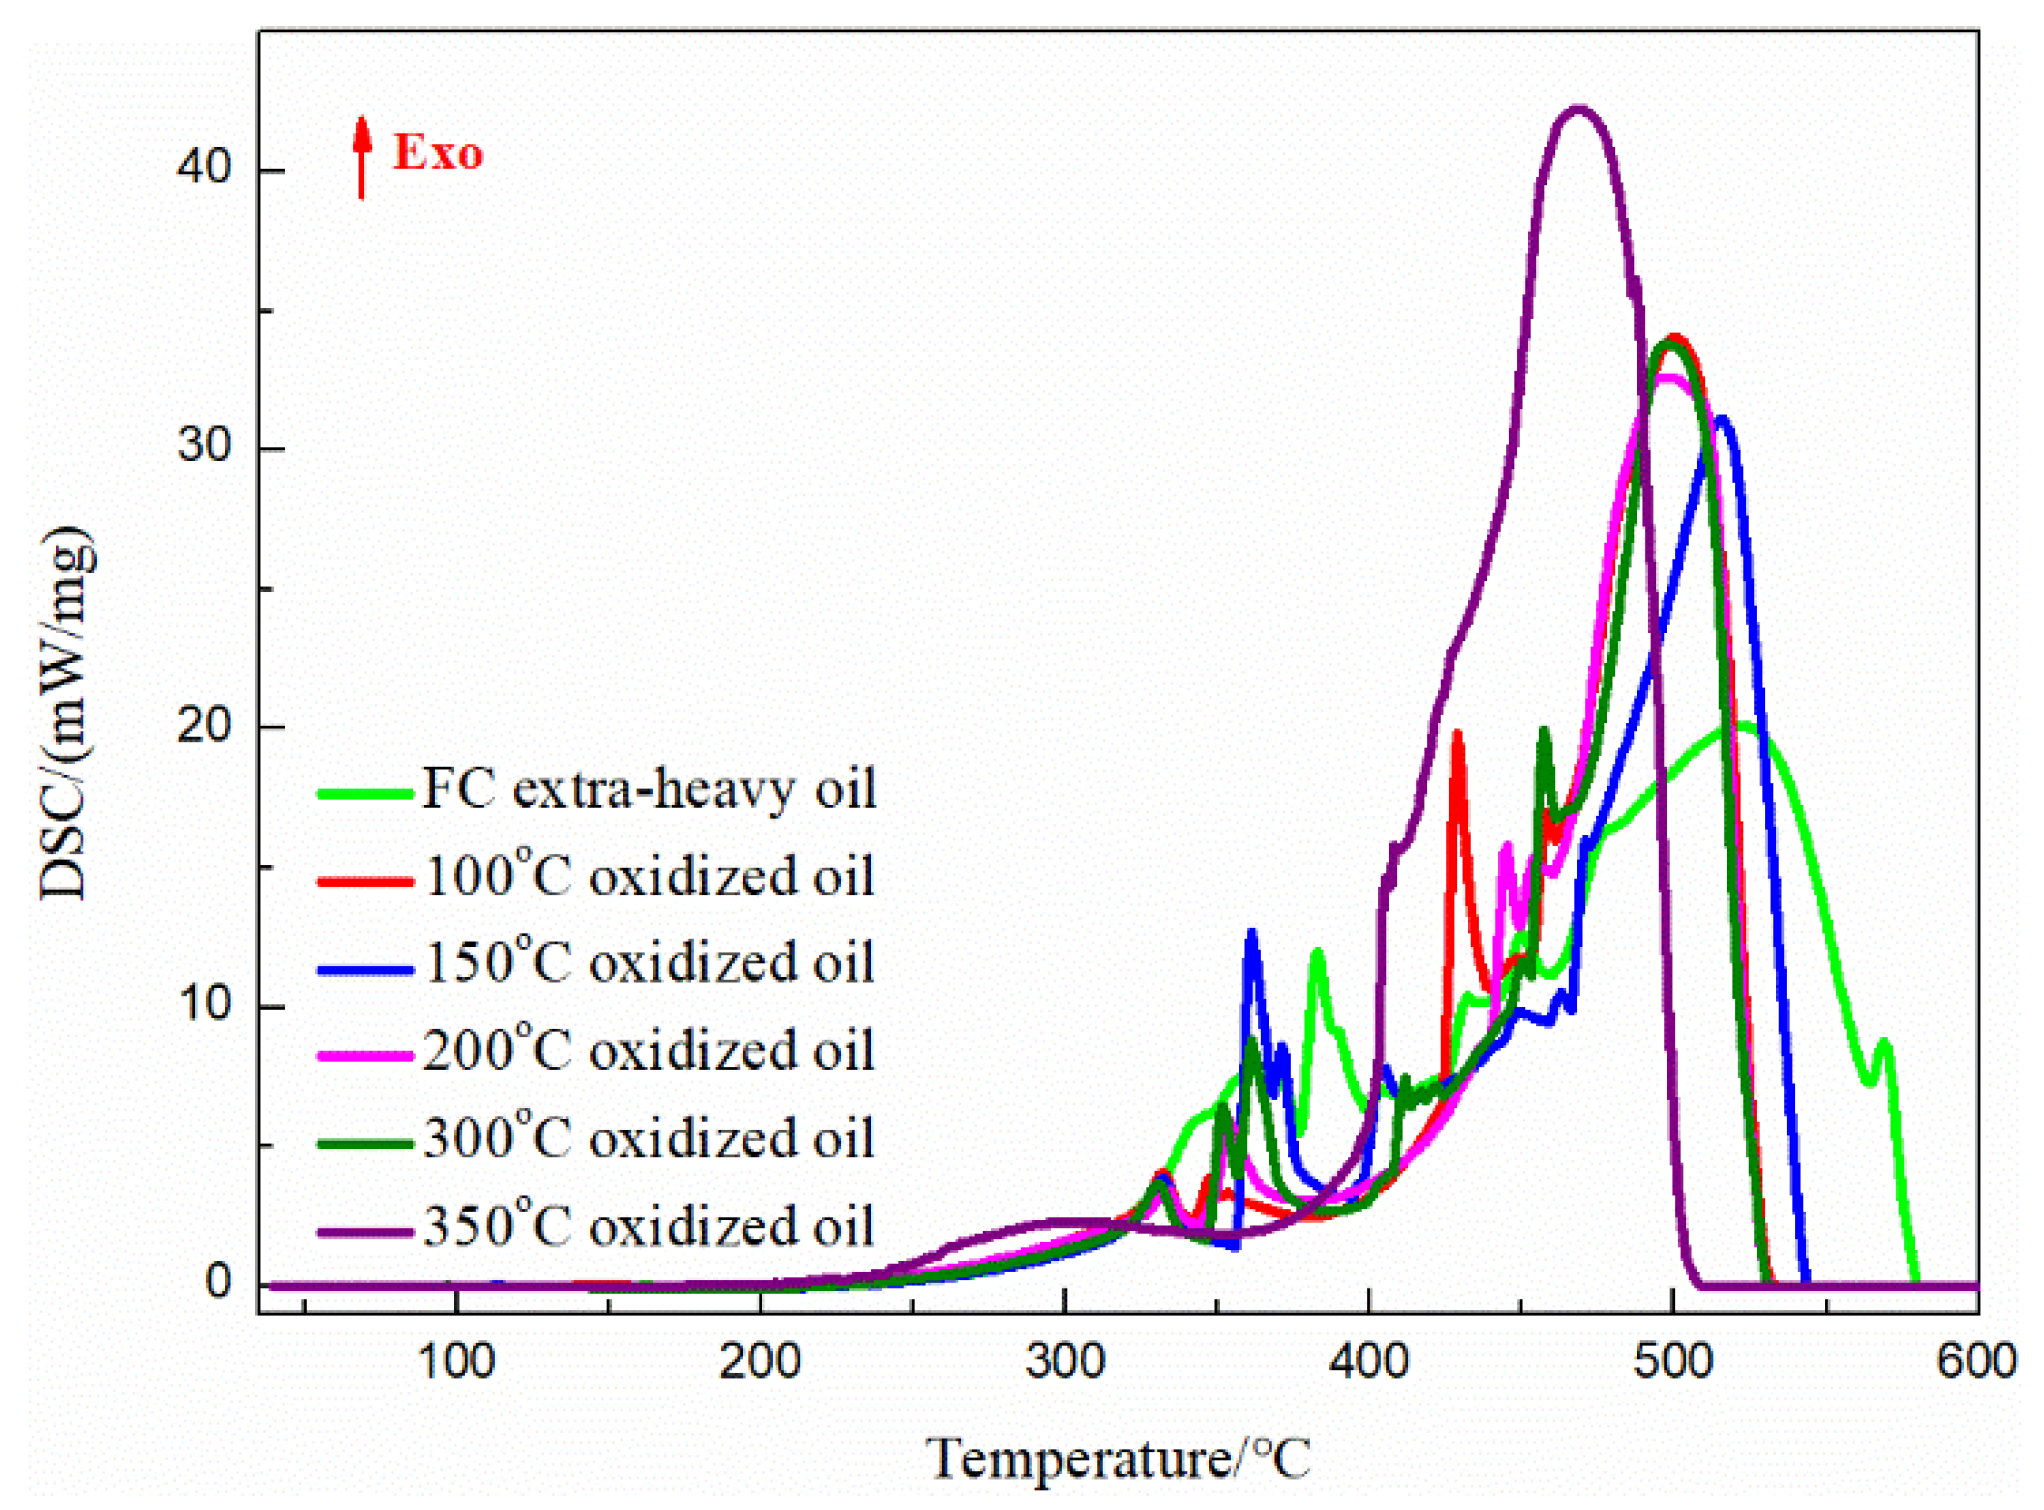
3.4. DSC Analysis of the FC Extra-Heavy Oil and Oxidized Oils

To visually compare the differences between the oxidative exothermal behavior of FC extra-heavy oil and oxidized oils, DSC tests under a single heating rate of 10 °C/min were carried out. The DSC curves of the FC extra-heavy oil and oxidized oils are shown in Figure 8. To better understand the exothermic behavior of all oil samples, the oxidation reaction region was divided into an LTO interval and an HTC stage in the DSC curves. The characteristic parameters obtained from the DSC curves of FC extra-heavy oil and oxidized oils are listed in Table 5. Compared to FC extra-heavy oil, the termination temperatures of each oxidized oil were lower than 550 °C, especially in the 350 °C oxidized oil. This may mean that the 350 °C oxidized oil has better combustion performance during the HTC stage.
The temperature region and peak temperature of oxidized oils at the LTO and HTC stages gradually decrease with static oxidation temperature. The peak heat flows of FC extra-heavy oil and its oxidized oils in the LTO stage show a downward trend as a whole. The peak heat flow and enthalpy of the FC extra-heavy oil in the LTO zone were 11.7 mW/mg and 3.54 kJ/mol, respectively, which was greater than that of all the oxidized oils—indicating that compared to oxidized oils, the LTO heat effect of FC extra-heavy oil is clear. The enthalpy values of all oxidized oils in the LTO region were approximately equal, which may be related to the static isothermal oxidation reaction under various temperatures. As the static oxidation temperature increased to 350 °C, the peak heat flow and enthalpy of oxidized oil in the LTO and HTC stages changed dramatically. 350 °C oxidized oil had the lowest LTO peak heat flow and enthalpy, which were 2.3 mW/mg and 1.35 kJ/mol, respectively. On the contrary, 350 °C oxidized oil showed greater exothermic performance during the HTC stage, and its peak heat flow and enthalpy were 42.4 mW/mg and 17.77 kJ/mol, respectively. This indicates that the increase in static oxidation temperature was conducive to the generation of coke that can serve as a fuel, with good reactivity. Isomerization and decomposition reactions occurred under higher temperature conditions to form coke required for HTC. Therefore, the higher the initial temperature, the more obvious the exothermic effect of the oxidized oil in the HTC stage. This is in good agreement with the conclusions drawn from the previous section on the physical properties of the oxidized oil and the thermogravimetric experiment.

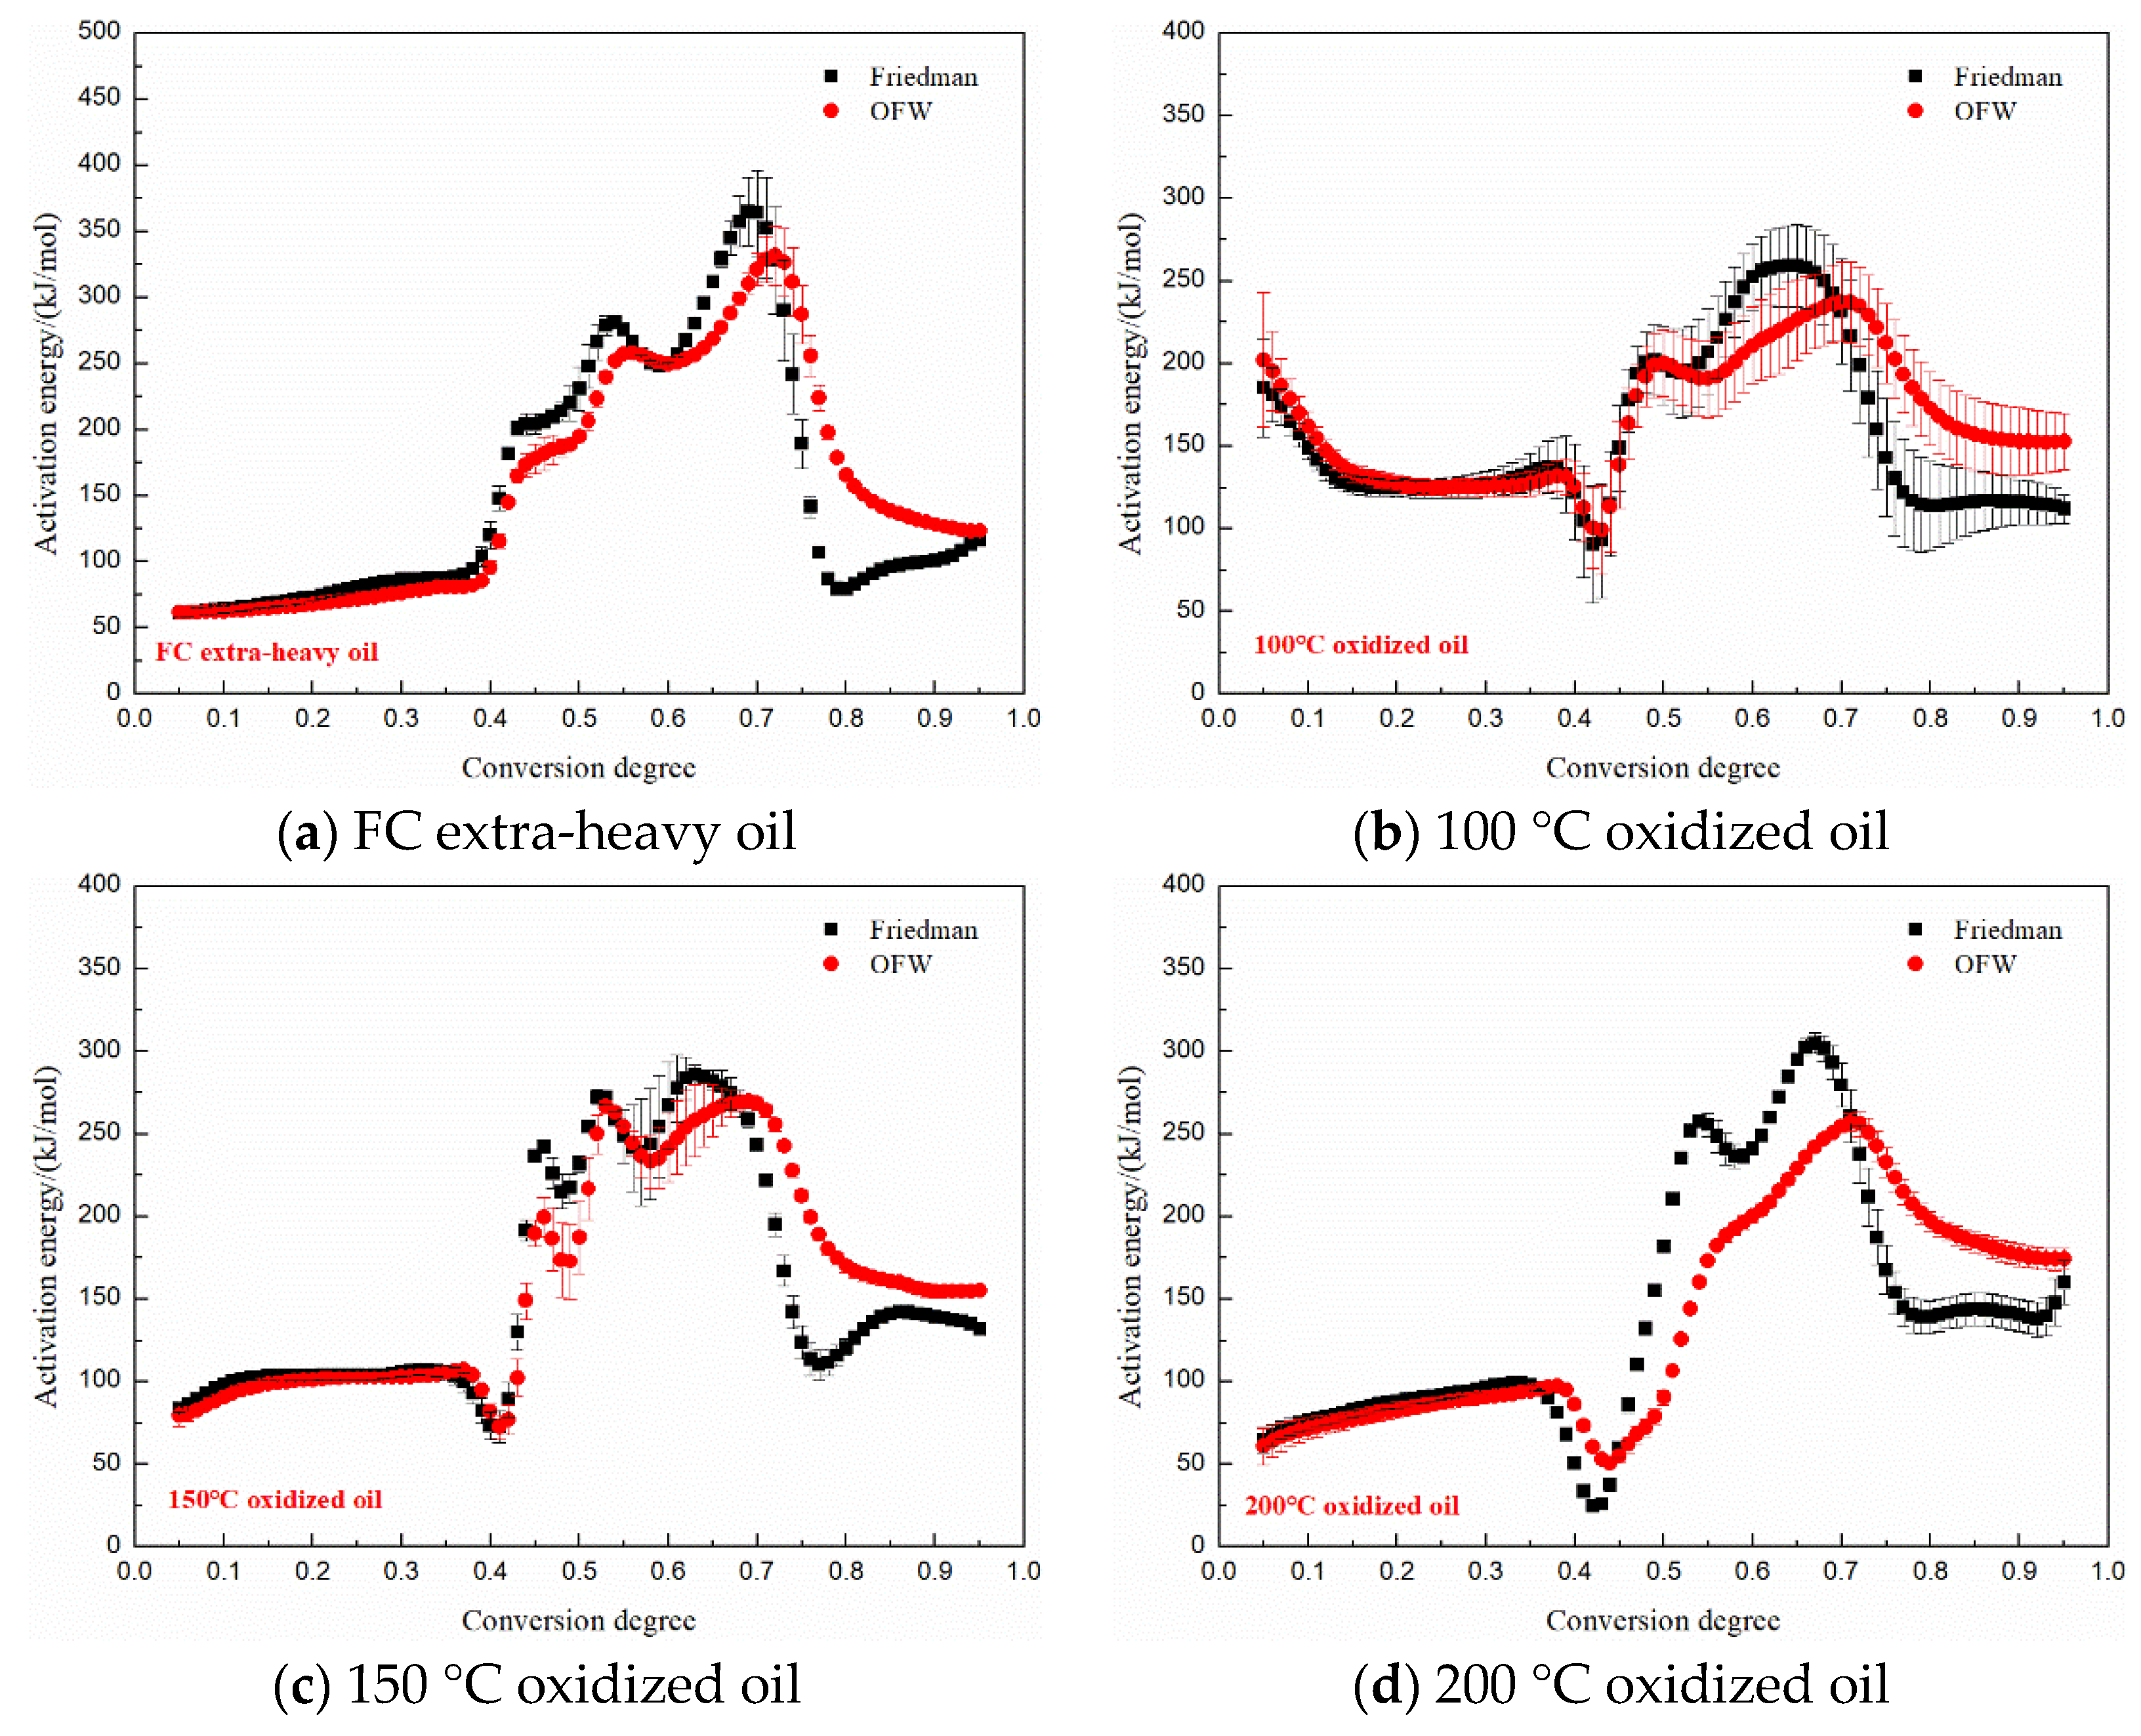
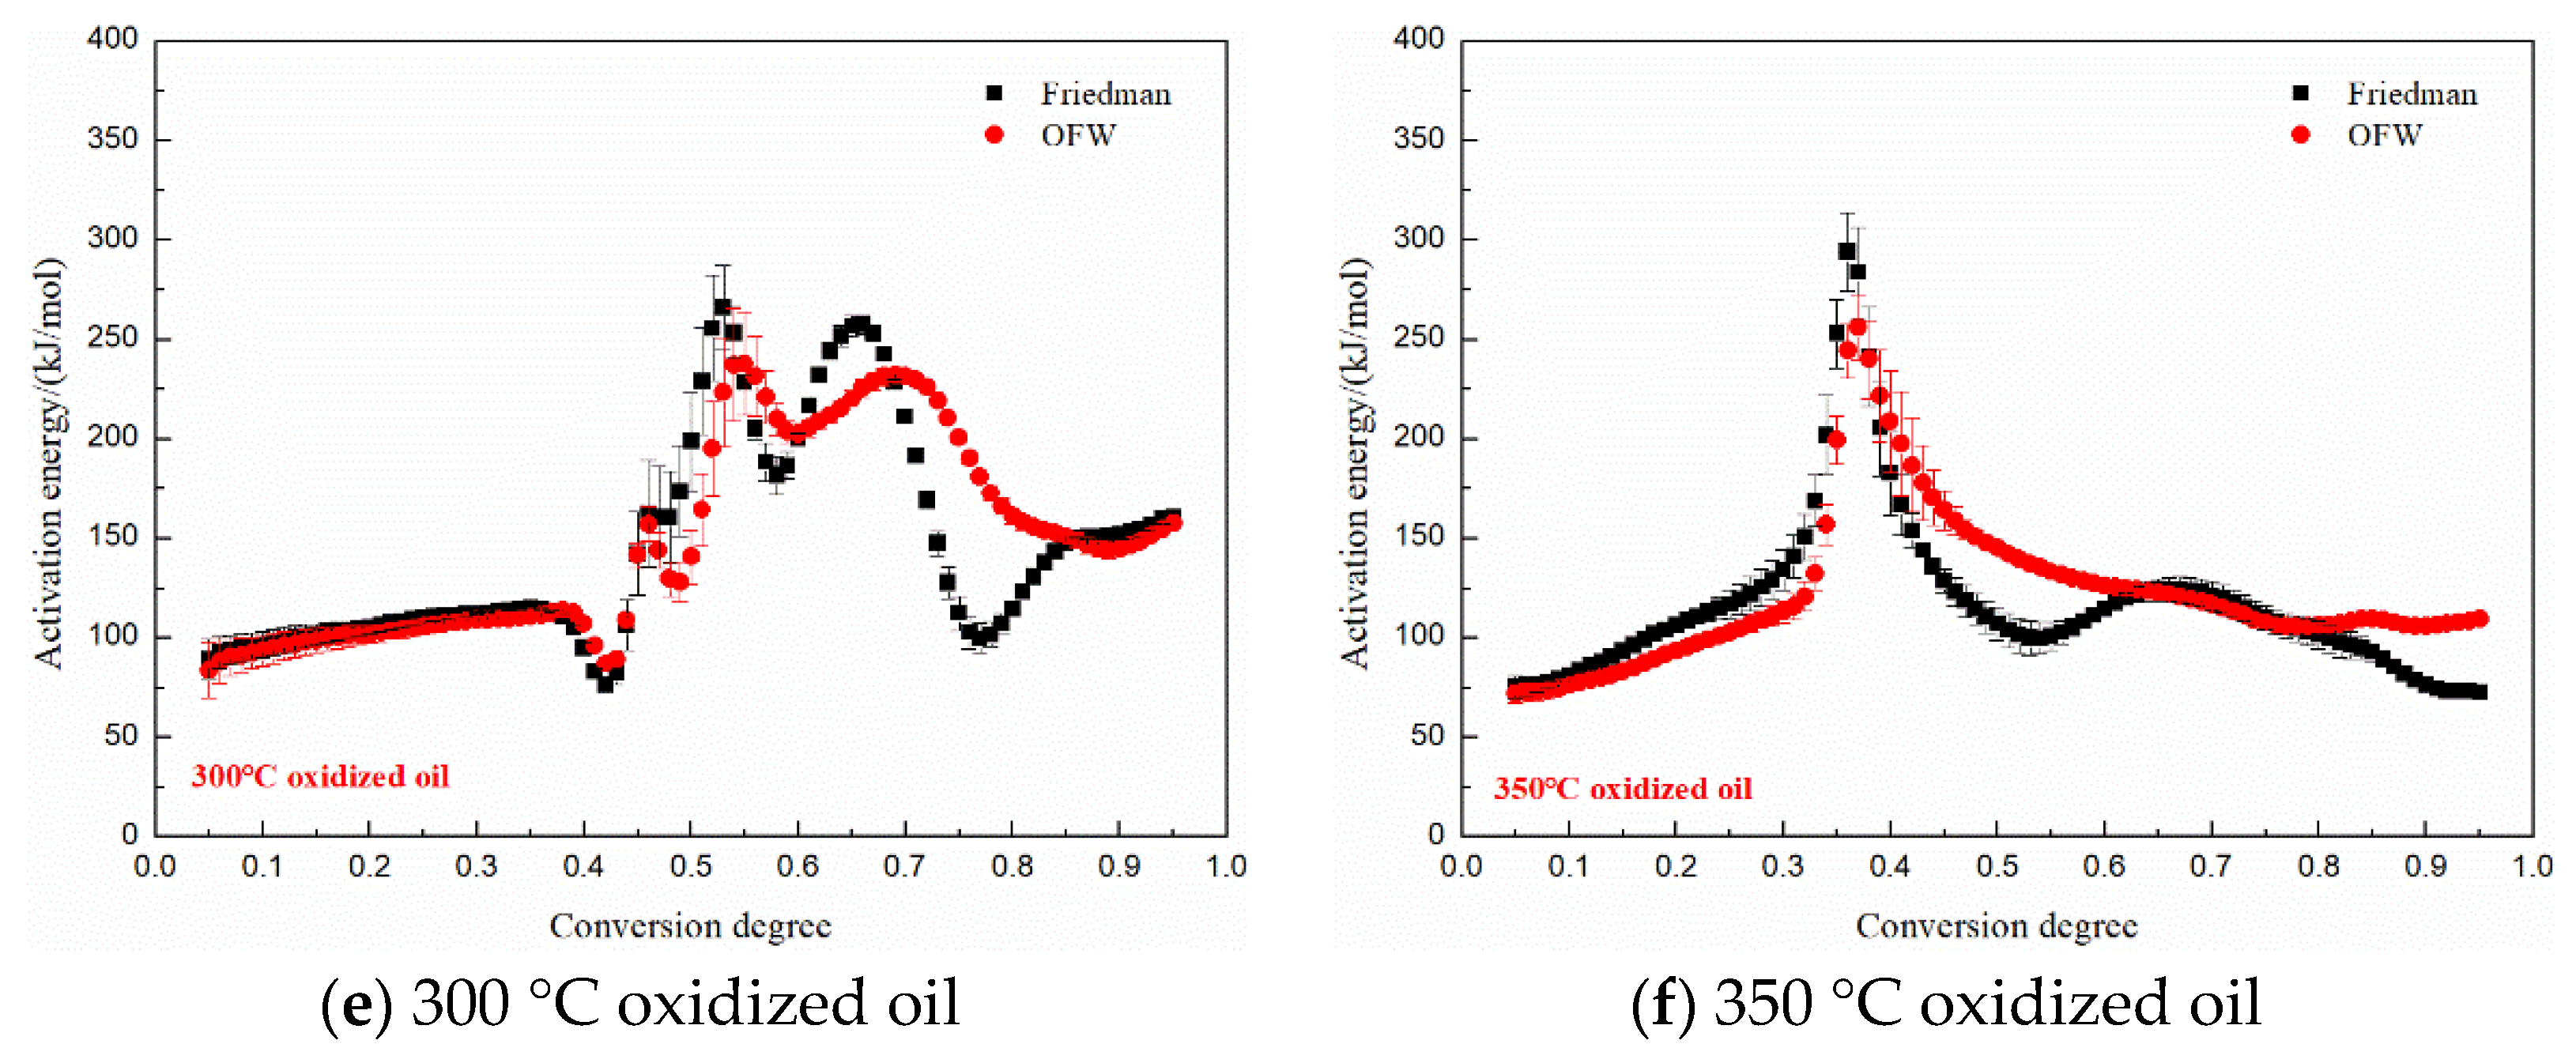
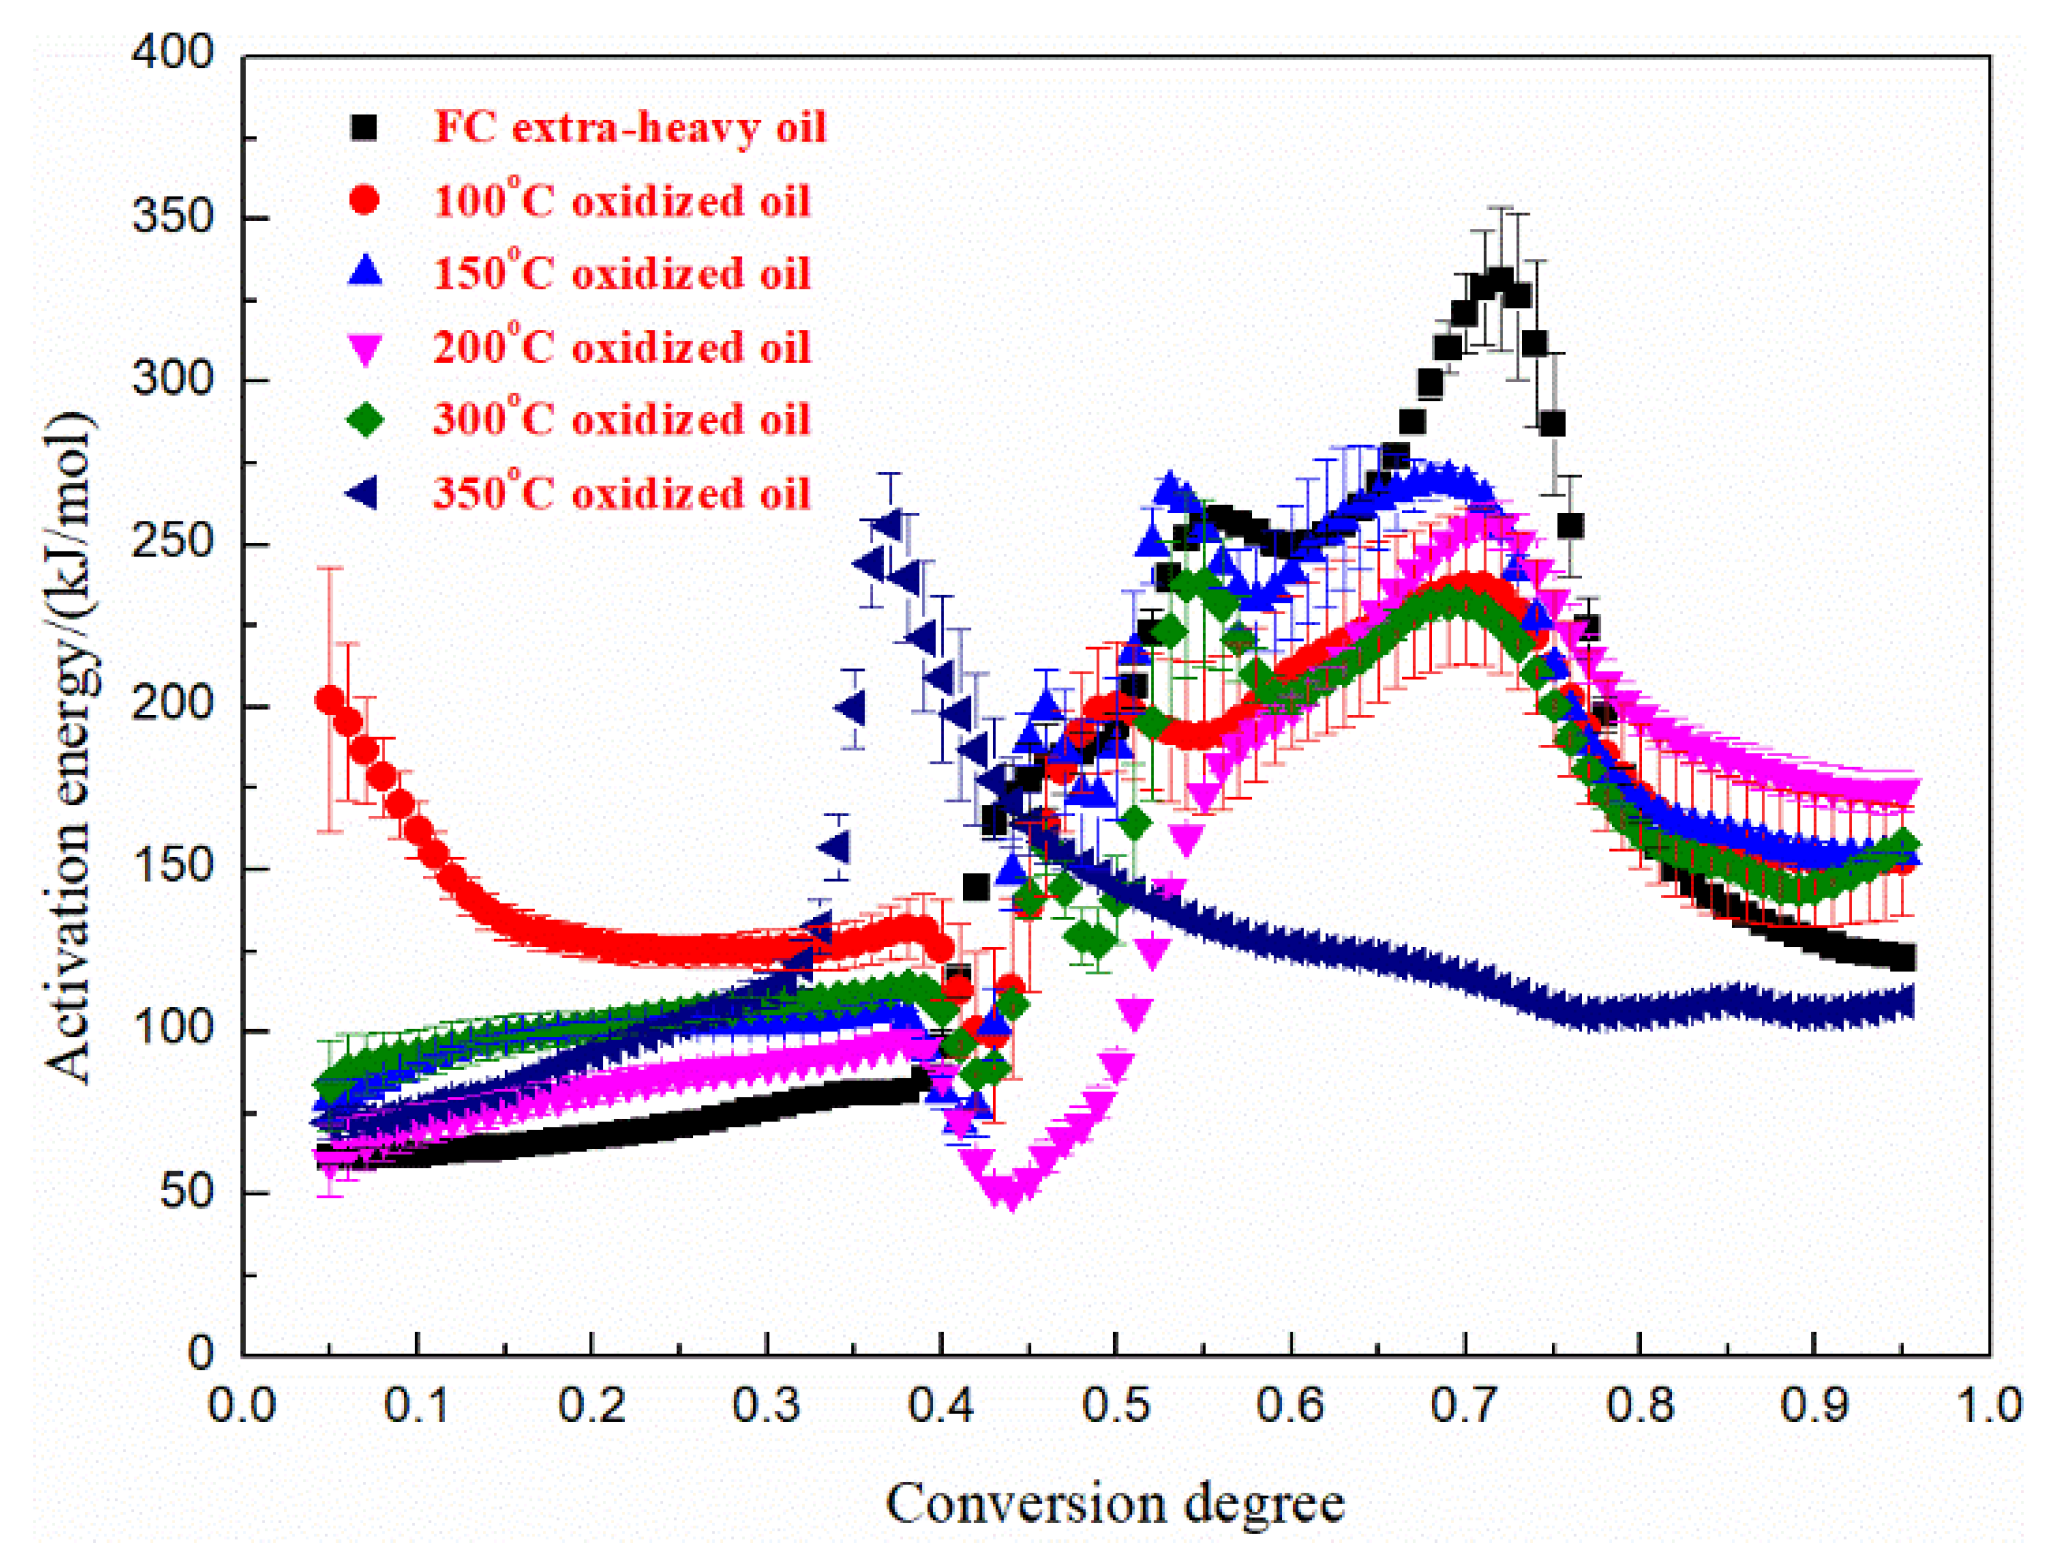
3.5. Kinetics Analysis

Figure 9 shows the activation energy curves of FC extra-heavy oil and oxidized oils. The basic theories of the Friedman and OFW models are different, but the values of activation energy with conversion degrees for these two isoconversional kinetics models were close, indicating the excellent reliability of the kinetic parameters.
As the conversion rate increased to 0.4, the activation energy of the 100 °C oxidized oil tended to decrease, which shows that the increase of temperature can promote the oxygenation reaction of some components. Between the conversion rate 0.4–0.6, the activation energy appeared to decrease first and then increase sharply. After LTO for a period of time, more reactive hydroperoxides were accumulated, and these substances underwent further oxidation reactions to form oxygen-containing derivatives such as ketones, aldehydes, and acids, etc., requiring less energy at this stage. The oxygen-containing derivatives then generated coke and H2O, etc., by dehydrogenation aromatization, decomposition, and polycondensation reactions, which required more energy to trigger. Compared with the LTO and FD activation energies, the HTC interval exhibited higher activation energy, which may be related to the reactivity and quality of the coke. Above the conversion degree of 0.65, the activation energy gradually decreased. This is because as the HTC reaction progressed, part of the coke had already been burned, so the energy needed to trigger the combustion reaction became less. The changing trends in activation energy and conversion rate of oxidized oil at 150, 200, and 300 °C was similar to that of oxidized oil at 100 °C, which is consistent with its mass loss and oxidation heat effect.
Figure 10 compares the relationship curve of activation energy versus conversion rate calculated by the Friedman method for FC extra-heavy oil and oxidized oils. Before the conversion rate of 0.4, the activation energy of all oxidized oil was greater than that of FC extra-heavy oil. And after the conversion rate of 0.6, the activation energy of FC extra-heavy oil in the HTC stage was greater than that of oxidized oils. Compared with FC heavy oil, oxidized oils required more energy in the LTO stage, which is related to their LTO derivatives with stable structures and larger molecular weights. As oxidized oils more easily generate coke and have better combustion activity; therefore, the activation energy of the HTC stage was lower than that of FC heavy oil. The activation energy of 350 °C oxidized oil began to decrease at around 0.4, which indicated that after the LTO reaction of heavy oil at 350 °C, it was more conducive to depositing more active coke. This provides theoretical support for preheating the FC oilfields before ignition in FC extra-heavy oil.

4. Conclusions

In this work, FC extra-heavy oil was oxidized at various static oxidation temperatures. The physical properties of the gaseous products and oxidized oils were first analyzed to investigate the effects of oxidation temperature on FC extra-heavy oil LTO. The combustion behaviors of the FC extra-heavy oil and oxidized oils were then studied by non-isothermal TG and DSC. Subsequently, the combustion kinetics of various oxidized oils were analyzed to identify their oxidative exothermic reactivity. The main conclusions are as follows:
(1) Oxygen consumption was always greater than the production of CO and CO2, so the oxygen addition reaction is the main pathway in heavy oil LTO. H/C decreased with rises in the oxidation temperature, which deepened the oxidation degree. The density and viscosity of 200 to 350 °C oxidized oils increased at a slower rate, which may be related to the heavy oil LTO heat effect.
(2) The change law of temperature interval, peak temperature, and mass loss of the oxidized oils had a good correlation with the static oxidation temperature. The 350 °C oxidized oil DTG peak during the HTC stage was much more pronounced, and the rate of mass loss at HTC was higher than that of other oxidized oils.
(3) Compared with other oxidized oils, the combustion exothermic effects of 350 °C oxidized oil increased significantly in the HTC region; the peak heat flow and enthalpy were 42.4 mW/mg and 17.77 kJ/mol, respectively. The activation energy of 350 °C oxidized oil began to decrease obviously around the conversion rate of 0.4, which indicates that it was beneficial to depositing coke with stronger activity.
(4) The FC heavy oilfields had a lower temperature and pressure (18.8 °C, 2.98 MPa), which required artificial ignition to trigger the HTC reactions. Combined with the exothermic effect and combustion activity of isothermally oxidized oils, preheating FC oilfields to 350 °C is a feasible method to ensure the successful application of ISC technology and to effectively improve FC extra-heavy oil recovery.

Author Contributions

L.W. completed the investigation; L.W., W.P. and J.W. designed the research; L.W. and T.W. completed the experiments; L.W. and J.W. in charge of writing. All authors have read and agreed to the published version of the manuscript.

Funding

This research was funded by the Opening Fund of Shandong Key Laboratory of Oilfield Chemistry and the Fundamental Research Funds for the Central Universities No. 19CX05006A, and the APC was funded by the Ministry of Science and Higher Education of the Russian Federation under agreement No. 075-15-2020-931 within the framework of the development program for a world-class Research Center “Efficient development of the global liquid hydrocarbon reserves”.

Acknowledgments

L. Wang, J. Wang and T. Wang acknowledge financial support from the Opening Fund of Shandong Key Laboratory of Oilfield Chemistry and the Fundamental Research Funds for the Central Universities No. 19CX05006A as well. The authors also thank the anonymous reviewers for their valuable comments. And W. Pu acknowledge financial support from the Ministry of Science and Higher Education of the Russian Federation under agreement No. 075-15-2020-931 within the framework of the development program for a world-class Research Center “Efficient development of the global liquid hydrocarbon reserves”.

Conflicts of Interest

The authors declare no conflict of interest.

References

  1. Chow, D.L.; Nasr, T.N.; Chow, R.S.; Sawatzky, R.P. Recovery Techniques for Canada’s Heavy Oil and Bitumen Resources. J. Can. Pet. Technol. 2009, 47, 12–17. [Google Scholar]
  2. Marsh, R.; Hein, F. Canada’s Extra-Heavy (Bitumen) and Heavy Oil Resources, Reserves and Development. J. Can. Pet. Technol. 2008, 47, 7–11. [Google Scholar]
  3. Hein, F.J. Geology of Bitumen and Heavy Oil: An Overview. J. Pet. Sci. Eng. 2017, 154, 551–563. [Google Scholar] [CrossRef]
  4. Davudov, D.; Moghanloo, R.G. A Systematic Comparison of various Upgrading Techniques for Heavy Oil. J. Pet. Sci. Eng. 2017, 156, 623–632. [Google Scholar] [CrossRef]
  5. Jiang, Y.W.; Li, Q. Heavy Oil and Bitumen Resources and Development of Liaohe and Xinjiang Oil Fields of China. Bull. Can. Pet. Geol. 2016, 64, 266–277. [Google Scholar] [CrossRef]
  6. Mehrabi-Kalajahi, S.; Varfolomeev, M.A.; Yuan, C.D.; Zinnatullin, A.L.; Rodionov, N.O.; Vagizov, F.G.; Osin, Y.N.; Yakimova, L.S. Improving Heavy Oil Oxidation Performance by Oil-Dispersed CoFe2O4 Nanoparticles in In-Situ Combustion Process for Enhanced Oil Recovery. Fuel 2021, 285, 119216. [Google Scholar] [CrossRef]
  7. Liu, D.; Tang, J.S.; Zheng, R.N.; Song, Q. Influence of Steam on the Coking Characteristics of Heavy Oil during In Situ Combustion. Fuel 2020, 264, 116904. [Google Scholar] [CrossRef]
  8. Yuan, C.D.; Emelianov, D.A.; Varfolomeev, M.A.; Rodionov, N.O.; Suwaid, M.A.; Vakhitov, I.R. Mechanistic and Kinetic Insight into Catalytic Oxidation Process of Heavy Oil in In-Situ Combustion Process using Copper (II) Stearate as Oil Soluble Catalyst. Fuel 2021, 284, 118981. [Google Scholar] [CrossRef]
  9. Pu, W.F.; Wang, L.L.; Peng, X.Q.; Li, N.; Zhao, S. Effects of Aromatics, Resins, and Asphaltenes on Oxidation Behavior and Kinetics of Heavy Crude Oil. Pet. Sci. Technol. 2020, 38, 815–822. [Google Scholar] [CrossRef]
  10. Varfolomeev, M.A.; Galukhin, A.; Nurgaliev, D.K.; Kok, M.V. Thermal Decomposition of Tatarstan Ashal’cha Heavy Crude Oil and its SARA Fractions. Fuel 2016, 186, 122–127. [Google Scholar] [CrossRef]
  11. Li, Y.B.; Chen, Y.F.; Pu, W.F.; Gao, H.; Bai, B.J. Experimental Investigation into the Oxidative Characteristics of Tahe Heavy Crude Oil. Fuel 2017, 209, 194–202. [Google Scholar] [CrossRef]
  12. Ma, J.F.; Liu, J.X.; Jiang, X.M.; Zhang, H. A Two-Dimensional Distributed Activation Energy Model for Pyrolysis of Solid Fuels. Energy 2021, 230, 120860. [Google Scholar] [CrossRef]
  13. Zhao, S.; Pu, W.F.; Varfolomeev, M.A.; Yuan, C.D.; Zhang, J.Z.; Han, X.Q.; Yang, Y.; Peng, X.Q.; Wu, J.X. Comprehensive Investigations into Low Temperature Oxidation of Heavy Crude Oil. J. Pet. Sci. Eng. 2018, 171, 835–842. [Google Scholar] [CrossRef]
  14. Wang, J.X.; Wang, L.L.; Wang, T.F.; Peng, X.Q. Effects of SARA Fractions on Pyrolysis Behavior and Kinetics of Heavy Crude Oil. Pet. Sci. Technol. 2020, 38, 945–954. [Google Scholar] [CrossRef]
  15. Kok, M.V.; Varfolomeev, M.A.; Nurgaliev, D.K. Low-Temperature Oxidation Reactions of Crude Oils using TGA–DSC Techniques. J. Therm. Anal. Calorim. 2020, 141, 775–781. [Google Scholar] [CrossRef]
  16. Zhao, R.B.; Xia, X.T.; Luo, W.W.; Shi, Y.L.; Diao, C.J. Alteration of Heavy Oil Properties under In-Situ Combustion: A Field Study. Energy Fuels 2015, 29, 6839–6848. [Google Scholar] [CrossRef]
  17. Khansari, Z.; Gates, I.D.; Mahinpey, N. Low-Temperature Oxidation of Lloydminster Heavy Oil: Kinetic Study and Product Sequence Estimation. Fuel 2014, 115, 534–538. [Google Scholar] [CrossRef]
  18. Zhao, S.; Pu, W.F.; Varfolomeev, M.A.; Yuan, C.D.; Pan, J.J.; Wang, R.Y.; Chen, L.; Kan, N. Low-Temperature Oxidation of Light and Heavy Oils via Thermal Analysis: Kinetic Analysis and temperature Zone Division. J. Pet. Sci. Eng. 2018, 168, 246–255. [Google Scholar] [CrossRef]
  19. Yuan, C.D.; Emelianov, D.; Varfolomeev, M.A. Oxidation Behaviour and Kinetics of Light, Medium and Heavy Crude Oils Characterized by Thermogravimetry Coupled with Fourier-Transform Infrared Spectroscopy (TG-FTIR). Energy Fuels 2018, 32, 5571–5581. [Google Scholar] [CrossRef]
  20. Zhao, S.; Pu, W.F.; Yuan, C.D.; Peng, X.Q.; Zhang, J.Z.; Wang, L.L.; Emelianov, D.A. Thermal Behavior and Kinetic Triplets of Heavy Crude Oil and its SARA Fractions during Combustion by High Pressure Differential Scanning Calorimetry. Energy Fuels 2019, 33, 3176–3186. [Google Scholar] [CrossRef]
  21. Li, Y.B.; Chen, Y.F.; Pu, W.F.; Dong, H.; Gao, H.; Jin, F.Y.; Wei, B. Low Temperature Oxidation Characteristics Analysis of Ultra-Heavy Oil by Thermal Methods. J. Ind. Eng. Chem. 2017, 48, 249–258. [Google Scholar] [CrossRef]
  22. Pu, W.F.; Zhao, S.; Pan, J.J.; Wang, R.Y.; Chen, L.; Kan, N.; Wang, L.L. Comparative Analysis of Quartz Sand and Detritus Effects on Thermal Behavior and Kinetics of Heavy Crude Oil. Thermochim. Acta 2018, 667, 153–159. [Google Scholar] [CrossRef]
  23. Liu, D.; Song, Q.; Tang, J.S.; Zheng, R.A.; Yao, Q. Interaction between Saturates, Aromatics and Resins during Pyrolysis and Oxidation of Heavy Oi. J. Pet. Sci. Eng. 2017, 154, 543–550. [Google Scholar] [CrossRef]
  24. Wang, Y.Y.; Ren, S.R.; Zhang, L.; Deng, J.Y.; Peng, X.Y.; Cheng, H.Q. New Insights into the Oxidation Behaviors of Crude Oils and Their Exothermic Characteristics: Experimental Study via Simultaneous TGA/DSC. Fuel 2018, 219, 141–150. [Google Scholar] [CrossRef]
  25. Zhao, S.; Pu, W.F.; Varfolomeev, M.A.; Yuan, C.D.; Rodionov, A.A. Integrative Investigation of Low-Temperature Oxidation Characteristics and Mechanisms of Heavy Crude Oil. Ind. Eng. Chem. Res. 2019, 58, 14595–14602. [Google Scholar] [CrossRef]
  26. Zhao, S.; Pu, W.F.; Peng, X.Q.; Zhang, J.Z.; Ren, H. Low-Temperature Oxidation of Heavy Crude Oil Characterized by TG, DSC, GC-MS, and Negative Ion ESI FT-ICR MS. Energy 2021, 214, 119004. [Google Scholar] [CrossRef]
  27. Wang, J.X.; Wang, L.L.; Wang, T.F.; Pu, W.F. Exothermal Property and Kinetics Analysis of Oxidized Coke and Pyrolyzed Coke from Fengcheng Extra-Heavy Oil. Ind. Eng. Chem. Res. 2021, 60, 7014–7023. [Google Scholar] [CrossRef]
  28. Wang, T.F.; Wang, J.X.; Meng, X.B.; Chu, G.Y.; Liu, C. The low Temperature Oxidation Characteristics of SARA Fractions in Air Flooding Process. Pet. Sci. Technol. 2018, 36, 1125–1130. [Google Scholar] [CrossRef]
  29. Pu, W.F.; Yuan, C.D.; Jin, F.Y.; Wang, L.; Qian, Z.; Li, Y.B.; Li, D.; Chen, Y.F. Low-Temperature Oxidation and Characterization of Heavy Oil via Thermal Analysis. Energy Fuels 2015, 29, 1151–1159. [Google Scholar] [CrossRef]
  30. Li, Y.B.; Luo, C.; Lin, X.; Li, K.; Xiao, Z.R.; Wang, Z.Q.; Pu, W.F. Characteristics and Properties of Coke Formed by Low-Temperature Oxidation and Thermal Pyrolysis during in Situ Combustion. Ind. Eng. Chem. Res. 2020, 59, 2171–2180. [Google Scholar] [CrossRef]
  31. Niu, B.; Ren, S.; Liu, Y.; Wang, D.; Tang, L.; Chen, B. Low-Temperature Oxidation of Oil Components in an Air Injection Process for Improved Oil Recovery. Energy Fuels 2011, 25, 4299–4304. [Google Scholar] [CrossRef]
  32. Yuan, C.D.; Varfolomeev, M.A.; Emelianov, D.A.; Eskin, A.A.; Nagrimanov, R.N.; Kok, M.V.; Afanasiev, I.S.; Fedorchenko, G.D.; Kopylova, E.V. Oxidation Behavior of Light Crude Oil and its SARA Fractions Characterized by TG and DSC Techniques: Differences and Connections. Energy Fuels 2018, 32, 801–808. [Google Scholar] [CrossRef]
  33. Li, Y.B.; Gao, H.; Pu, W.F.; Li, L.; Chen, Y.F.; Bai, B.J. Study of the Catalytic Effect of Copper Oxide on the Low-Temperature Oxidation of Tahe Ultra-Heavy Oil. J. Therm. Anal. Calorim. 2019, 135, 3353–3362. [Google Scholar] [CrossRef]
  34. Pu, W.F.; Gong, X.L.; Chen, Y.F.; Liu, X.L.; Hui, J.; Guo, C.; Varfolomeev, M.A. Oxidation Kinetic Evaluation of the Low Temperature Oxidized Products of Tahe Heavy Oil Characterized by the Distributed Activation Energy Model. J. Pet. Sci. Eng. 2019, 181, 106155. [Google Scholar] [CrossRef]
  35. Zhao, R.B.; Wei, Y.G.; Wang, Z.M.; Yang, W.; Yang, H.J.; Liu, S.J. Kinetics of Low-Temperature Oxidation of Light Crude Oil. Energy Fuels 2016, 30, 2647–2654. [Google Scholar] [CrossRef]
  36. Mothé, C.G.; Miranda, I.C.D. Study of Kinetic Parameters of Thermal Decomposition of Bagasse and Sugarcane Straw using Friedman and Ozawa–Flynn–Wall Isoconversional Methods. J. Therm. Anal. Calorim. 2013, 113, 497–505. [Google Scholar] [CrossRef]
  37. Karimian, M.; Schaffie, M.; Fazaelipoor, M.H. Estimation of the Kinetic Triplet for In-Situ Combustion of Crude Oil in the Presence of Limestone Matrix. Fuel 2017, 209, 203–210. [Google Scholar] [CrossRef]
  38. Vyazovkin, S.; Burnham, A.K.; Criado, J.M.; Pérez-Maqueda, L.A.; Popescu, C.; Sbirrazzuoli, N. ICTAC Kinetics Committee Recommendations for Performing Kinetic Computations on Thermal Analysis Data. Thermochim. Acta 2011, 520, 1–19. [Google Scholar] [CrossRef]
  39. Akin, S.; Kok, M.V.; Bagci, S.; Karacan, O. Oxidation of Heavy Oil and Their SARA Fractions: Its Role in Modeling In-Situ Combustion. SPE Reserv. Eng. 2000, 757–768. [Google Scholar] [CrossRef]
  40. Kok, M.V.; Gul, K.G. Thermal Characteristics and Kinetics of Crude Oils and SARA Fractions. Thermochim. Acta 2013, 569, 66–70. [Google Scholar] [CrossRef]
  41. Al-Saffar, H.B.; Hasanin, H.; Price, D.; Hughes, R. Oxidation of a Light Crude Oil and Its SARA Fractions in Consolidated Cores. Energy Fuels 2001, 15, 182–188. [Google Scholar] [CrossRef]
  42. Wang, T.F.; Yang, W.P.; Wang, J.X.; Shem, K.; Deng, Z.Y. Low Temperature Oxidation of Crude Oil: Reaction Progress and Catalytic Mechanism of Metallic Salts. Fuel 2018, 225, 336–342. [Google Scholar] [CrossRef]
Figure 1. Simplified procedure of the isothermal oxidation experimental setup [27].
Energies 14 06294 g001
Figure 2. Changes in gas content of gaseous products.
Energies 14 06294 g002
Figure 3. Viscosity–temperature curves of FC extra-heavy oil and oxidized oils.
Energies 14 06294 g003
Figure 4. The change of non-metallic elements in oxidized oils.
Energies 14 06294 g004
Figure 5. Carbon hydrocarbon distribution of FC extra-heavy oil and oxidized oils.
Energies 14 06294 g005
Figure 6. TG/DTG curves of FC extra-heavy oil and each oxidized oil.
Energies 14 06294 g006
Figure 7. TG/DTG curves of FC extra-heavy oil and oxidized oils at 10 °C/min.
Energies 14 06294 g007
Figure 8. DSC curves of FC extra-heavy oil and oxidized oils at 10 °C/min.
Energies 14 06294 g008
Figure 9. Activation energy versus conversion degree obtained by the Friedman and OFW methods for the FC extra-heavy oil and oxidized oils.
Energies 14 06294 g009aEnergies 14 06294 g009b
Figure 10. Relationship between the activation energy and conversion degree obtained by the Friedman model of FC extra-heavy oil and oxidized oils.
Energies 14 06294 g010
Table 1. Basic properties of the FC extra-heavy oil [27].
Density
(g/cm3, 20 °C)
Viscosity
(mPa·s, 50 °C)
Gravity
(°API) (25 °C)
SARA Fractions (wt%)Elemental Analysis (wt%)
SA1RA2CHONS
0.951761181735.6420.7828.3015.2882.311.93.470.411.64
Notes: S: saturates, A1: aromatics, R: resins, and A2: asphaltenes.
Table 2. The analysis of gaseous products from FC extra-heavy oil isothermal oxidation.
T/°CGas Phase Composition
O2
/%
N2
/%
CO2
/%
CO
/%
C1–C6
/%
H/C
/%
O2/N2CO/CO2OCR
/(%/d)
5018.27 ± 0.2681.05 ± 0.200.46 ± 0.020.07 ± 0.020.15 ± 0.0220.94 ± 0.560.225 ± 0.0040.151 ± 0.037 0.91 ± 0.09
10015.10 ± 0.5782.71 ± 0.531.32 ± 0.020.18 ± 0.000.70 ± 0.0214.63 ± 1.590.183 ± 0.0080.133 ± 0.002 1.97 ± 0.19
1507.86 ± 1.4985.67 ± 0.304.66 ± 0.980.36 ± 0.061.47 ± 0.158.31 ± 1.280.092 ± 0.0180.077 ± 0.005 4.38 ± 0.50
2004.52 ± 1.2586.74 ± 0.356.13 ± 0.840.52 ± 0.012.09 ± 0.077.38 ± 0.620.052 ± 0.0150.087 ± 0.014 5.49 ± 0.42
2502.93 ± 1.0187.21 ± 0.436.91 ± 0.610.55 ± 0.022.40 ± 0.017.03 ± 0.270.034 ± 0.0120.080 ± 0.010 6.02 ± 0.34
3001.85 ± 0.7087.42 ± 0.297.68 ± 0.470.58 ± 0.032.48 ± 0.036.51 ± 0.180.021 ± 0.0080.076 ± 0.009 6.38 ± 0.23
3500.75 ± 0.2287.68 ± 0.148.26 ± 0.280.62 ± 0.012.55 ± 0.046.31 ± 0.210.009 ± 0.0030.075 ± 0.004 6.75 ± 0.07
Table 3. Viscosity and density of FC extra-heavy oil and oxidized oils.
SamplesViscosity/Pa·s (50 °C)Density/g/cm3 (20 °C)
FC extra-heavy oil6.1175 ± 0.00050.9519 ± 0.0002
50 °C oxidized oil7.2155 ± 0.00050.9535 ± 0.0003
100 °C oxidized oil8.4360 ± 0.00100.9557 ± 0.0006
150 °C oxidized oil13.6440 ± 0.00100.9608 ± 0.0003
200 °C oxidized oil15.9715 ± 0.00150.9629 ± 0.0002
250 °C oxidized oil17.1125 ± 0.00250.9641 ± 0.0001
300 °C oxidized oil18.4310 ± 0.00100.9656 ± 0.0001
350 °C oxidized oil19.1060 ± 0.00100.9662 ± 0.0001
Table 4. TG/DTG curve parameters of the FC extra-heavy oil and oxidized oils.
SamplesHeating Rate
(°C /min)
LTOFDHTC
Region
(°C)
Peak Temperature
(°C)
Mass Loss
(%)
Region
(°C)
Peak Temperature
(°C)
Mass Loss
(%)
Region
(°C)
Peak Temperature
(°C)
Mass Loss
(%)
FC extra-heavy oil540–35329541.4353–44741330.0447–52848828.6
1040–34831139.6348–46142833.1461–55750527.3
1540–37934140.1379–49745737.3497–60156022.6
100 °C oxidized oil540–33127542.7331–44343526.7443–50446430.6
1040–35329543.6353–46745031.4467–52448825.0
1540–36231243.9362–47045330.9470–53049225.2
150 °C oxidized oil540–34828443.1348–43841024.7438–51247432.2
1040–35030141.5350–46744133.2467–53349625.3
1540–35232040.2352-47643533.9476-55250525.9
200 °C oxidized oil540-34827845.4348-43536020.4435-50546534.1
1040-35030143.5350–46244730.7462–52548425.8
1540–35931241.7359–47145532.0471–53549126.3
300 °C oxidized oil540–33528943.5335–41741016.3417–49746040.2
1040–34230543.2342–46444932.7464–52148824.1
1540–34731641.6347–47445033.0474–54449725.4
350 °C oxidized oil540–31225334.4///312–47341765.6
1040–33826136.1///338–51143763.9
1540–33527235.2///335–53245164.8
Table 5. DSC parameters of FC extra-heavy oil and oxidized oils at 10 °C/min.
SamplesLTOHTC
Region
(°C)
Peak Temperature
(°C)
Peak Heat Flow
(mW/mg)
Enthalpy
(kJ/mol)
Region
(°C)
Peak Temperature
(°C)
Peak Heat Flow
(mW/mg)
Enthalpy
(kJ/mol)
FC extra-heavy oil40–39938211.73.54399–57952120.113.97
100 °C oxidized oil40–3803323.91.63380–53450134.113.99
150 °C oxidized oil40–39336212.52.17393–54651731.112.94
200 °C oxidized oil40–3803555.91.76380–53449732.613.38
300 °C oxidized oil40–3883628.61.89388–53049433.812.81
350 °C oxidized oil40–3602952.31.35360–51046742.417.77
Publisher’s Note: MDPI stays neutral with regard to jurisdictional claims in published maps and institutional affiliations.

