Article

Implementation of a Photovoltaic Inverter with Modified Automatic Voltage Regulator Control Designed to Mitigate Momentary Voltage Dip

by
Anderson Rodrigo Piccini
1,2,*,
Geraldo Caixeta Guimarães
1,
Arthur Costa de Souza
3 and
Ana Maria Denardi
2
1
Faculty of Electrical Engineering, Federal University of Uberlandia (UFU), Uberlandia 38400-902, MG, Brazil
2
Federal Institute of Education, Science and Technology of Paraná (IFPR), Paranavaí 87703-536, PR, Brazil
3
Federal University of Itajubá (UNIFEI), Campus Itabira, Itabira 35903-087, MG, Brazil
*
Author to whom correspondence should be addressed.
Energies 2021, 14(19), 6244; https://doi.org/10.3390/en14196244
Submission received: 4 August 2021 / Revised: 27 August 2021 / Accepted: 23 September 2021 / Published: 1 October 2021

Abstract

:
The main objective of this research is to propose an active and reactive power injection control in order to mitigate voltage sags. The proposed control strategy works in conjunction with a modified version of an automatic voltage regulator (AVR), where it will act on the active and reactive powers injected by the inverter to reduce the effects of voltage sags. In this way, the control will avoid possible shutdowns and damage to the equipment connected to the grid. The voltage improvement can be perceived for consumers connected to the power system. Modifications in AVR model and parameters are performed to speed up its performance, thus identifying the short-duration voltage variations (SDVV) and, consequently, the control acts to alter the powers, decreasing the active power injection and increasing the reactive power based on inverter capacity during the momentary voltage dip (MVD). Finally, when the fault is cleared, all values return to the pre-fault condition, so that the inverter only operates with active power. A 75 kW three-phase grid-connected photovoltaic system (GCPVS) equipped with the proposed control was inserted in a distribution grid of the city of Palmas, state of Tocantins, Brazil, and all of the computer simulations were performed on the Matlab/Simulink®.

1. Introduction

Over the past two decades, distributed generation (DG) using renewable energy sources, more specifically the generation of photovoltaic energy, has become one of the most promising new technologies. In Brazil, this has been happening since 2012 [1,2,3]. Due to the increasing adoption of this resource, grid-connected photovoltaic systems (GCPVS) are developing at a very fast pace and will soon be a large part of energy generation in some regions [1,4]. In view of this fact, many countries have established new requirements grid code (GCs) for GCPVS to remain connected during some fault. Its disconnection during faults can cause problems related to stability, reliability, and operation of the power system being attended to by the GCPVS [5]. As a result, there is a change in the dynamic behavior and impact in the distribution grid which is being inserted [4,6,7,8].
The new connection requirements highlight that GCPVS avoid a high loss of energy and remains connected on grid in the event of a voltage sag. This capacity is known as the low-voltage ride through (LVRT) capacity. Recent studies have compared the LVRT requirements for photovoltaic plants connected on grid in different GCs in [1,4,9,10]. Some countries have proposed and implemented these connection requirements for the LVRT [1,11,12]. In addition, governments for the purpose of increasing the penetration of GCPVS into the energy matrix of each country introduce some incentive rules and regulations, connecting them to low-voltage and medium-voltage distribution grids such as DG [11,12]. Due to greater use, several studies have shown great interest in the operation of the distribution grid with better participation of DG in the energy matrix. Furthermore, when it comes to this participation in the voltage control in steady state, benefits can be observed such as the increase of the hosting capacity, the reduction in the voltage drop, and the load loss [11].
According to the version of IEEE 1547–2003, at the point of interconnection, DG (including solar photovoltaic generators) cannot actively participate in voltage regulation, controlling the reactive power on grid [12]. From the update and approval of IEEE 1547–2018, the distributed generators can actively participate in grid voltage support, thereby providing reactive power compensation [13].
In the technical literature, it is possible to find several researches integrating the photovoltaic system to the distribution grid. At the same time, researchers discuss methods for the management and control of active and reactive power. It is worth mentioning that the control of reactive power is one of the important requirements for the stability of the distribution grid. Therefore, in reference [14], the authors proposed a photovoltaic inverter with the capacity to supply active power and compensate reactive power simultaneously, modifying the phase angle of the output voltage.
A method of reactive power control is discussed by [15], which has as a characteristic the efficient use of reactive power management when connected to a critical bus in the distribution grid. The method increases voltage regulation and improves the reverse flow of energy of a distribution system with high penetration of RE sources, while it efficiently uses the reactive power capacity of the photovoltaic inverter.
In [16] a plan is presented for reactive energy compensation in the transmission and distribution buses with the help of distributed generation and without the use of additional reactive power compensators. Reference [17] presented a new method to improve active power control, reactive power compensation, and power quality improvement of a GCPVS using a DC-DC converter cascade and a PWM (pulse width modulation) inverter.
To solve the problems of overvoltage on the DC bus and overcurrent on the AC side caused by voltage sags, some authors [1,18] discussed a control strategy to improve the LVRT operating capacity for single-stage photovoltaic plants based on Malaysian standards. This control also proposes to solve the problems that cause disconnection or damage to the inverter and only reactive power injection during symmetrical and asymmetric faults. In another paper presented by [19], the author describes an LVRT control strategy for low-voltage three-phase GCPVS. This strategy uses, as a base, the inverter ability to remain connected during a voltage sag. During asymmetric faults, the inverter injects reactive power and the control prevents the maximum power point tracking (MPPT), but guarantees a smooth transition between the two methods, both with and without MPPT. In addition, reference [19], highlights Brayton–Moser’s mixed potential theory and injects only reactive power during faults.
In [12], the authors proposes a mathematical methodology to derive the active and reactive power capacity curve of a photovoltaic system. Their technique manages the injection of reactive power into a grid at maximum power for various environmental conditions. As a result, it was possible to determine reactive power limits for single-phase and three-phase systems connected to the 33-bus IEEE distribution grid.
The authors [4], suggest a theoretical solution method and a calculation model for analyzing PV power fault transient and steady current by taking into account the DC bus voltage fluctuation and the influence of unloading circuit during LVRT. They used an inverter, with a DC/DC and DC/AC converter, and its behavior was analyzed during symmetrical and asymmetrical faults.
It was discussed in [10] a solution for asymmetric faults considering the LVRT control, makes a comparison of several heuristic algorithms and uses an adaptive differential evolution (ADE) algorithm to reliably obtain the voltage controller parameters, during both the transient and steady-state process.
Finally, to demonstrate the relevance of the subject, which deals with reactive compensation and voltage controls in the distribution network, reference [20] presents an important paper titled “Review of Voltage and Reactive Power Control Algorithms in Electric Distribution Networks”. They provide a bibliographical overview of the mathematical methods used for the optimal choice and positioning of reactive power compensation elements. Furthermore, the authors present the advantages and disadvantages of all methods they have researched.
Although the previous methods can provide reactive power control, they have the disadvantages of several additional components that incur extra costs and do not address the problem of identifying the best balance point between powers during the voltage sags. Therefore, when researching three-phase GCPVS applications in DG, few papers have sufficiently explored the LVRT strategy to deal with the fault and none of them used the technique proposed in this research. Besides, when it comes to GCPVS to contribute during voltage sags while providing voltage level support, it can simultaneously inject active and reactive power without sacrificing the total active power injection. It is worth noting that this issue has not yet been explored in the literature. Therefore, the main objective of this research is to propose an active and reactive power injection control during voltage sags, which was implemented in a 75 kW three-phase GCPVS so as to mitigate disturbance and contribute to ancillary services on grid.
An improvement in the control of active power injection while the reactive power is injected to help sustaining the voltage in the point of common coupling (PCC) during the short-duration voltage variation (SDVV), more specifically, the momentary voltage dip (MVD). Thus, the control of active power injection works in conjunction with the automatic voltage regulator (AVR) in a modified version. The modifications in AVR model and parameters are implemented for faster dynamics, therefore identifying the MVD and, consequently, the control acts altering the powers so that to decrease the active power injection and increase the reactive power based on the inverter total capacity. Consequently, the control will avoid possible shutdowns and damage to equipment connected on grid and improvement will also be observed in the consumers’ bus voltage levels.
To achieve these objectives, the 75 kW GCPVS, with the proposed control, was implemented on Matlab/Simulink®. Such power system comprises part of a real distribution grid in the city of Palmas, which belongs to Tocantins state, in the northern region of Brazil.
It was possible to notice that the references [4,14,15,16,17], which relate the reactive compensation provided by GCPVS, are associated with voltage regulation in a steady-state and not in a transient state, as they solve voltage drop but not voltage sag problems. In addition, the papers prioritize the two-stage PV system (DC-DC converter and DC-AC converter) and not a single stage one (only DC-AC converter) which offers lower operating losses.
Regarding the papers [1,4,18,19], they recommend a control which works only with reactive power injection during LVRT operation condition (that is, during voltage sags for symmetrical and asymmetrical faults). Therefore, the PV system is subject to overvoltage on the DC bus. On the other hand, this paper proposes a control which is able to inject active and reactive power during LVRT, so the DC bus overvoltage problem is mitigated for active power injection. It is worth noting that the active power will decrease with the intensity of the voltage sags.
It is highlighted that the inverter MPPT is disabled during voltage sags (LVRT operation) in work [19]. Conversely, the control proposed in this paper keeps the MPPT always in activity, since the active power continues in operation.
Reference [12] needs to derive the active and reactive power curves to perform the reactive compensation, however, this strategy demands a high processing capacity, thus increasing the simulation time. In turn, the control here proposed generates the reactive power reference in a more simplified way (that is, by the difference between the total (apparent) power and the active power). In addition, the employed simulation data come from a real distribution grid.
In [10], the authors worked only with asymmetrical faults with an adaptive differential evolution (ADE) algorithm. This paper, however, proposes a novel method for controlling the active and reactive powers, which has not been used in any technical research, since the AVR is used manage the inverter capacity, by reducing active power to make space for reactive power injection when needed. Such technique was not mentioned in the paper review [20].
In relation to the other methods aforementioned, this proposed seeks to optimize the best distribution of active and reactive power injection at the time of the voltage sag. To do so, the inverter active power is decrease so as to increase the injection of reactive power during the MVD. Such procedure, improves the voltage levels for consumers in the local distribution grid. Finally, when the fault ceases, the GCPVS turns to inject only the active power on grid, as shown in Figure 1.
This paper consists of six sections. First, in the introduction, the main methods in the technical literature related to the subject are presented. The second section is used to model the GCPVS including controlling the inverter. The third section deals with the proposed control for the injection of active and reactive powers. In the fourth section, the distribution grid used for the simulations is presented. The performance evaluation of the proposed SDVV/MVD control is carried out in the fifth section. The last section covers the final considerations on the results of this work.

2. Proposed Model of the Three-Phase Grid-Connected Photovoltaic System

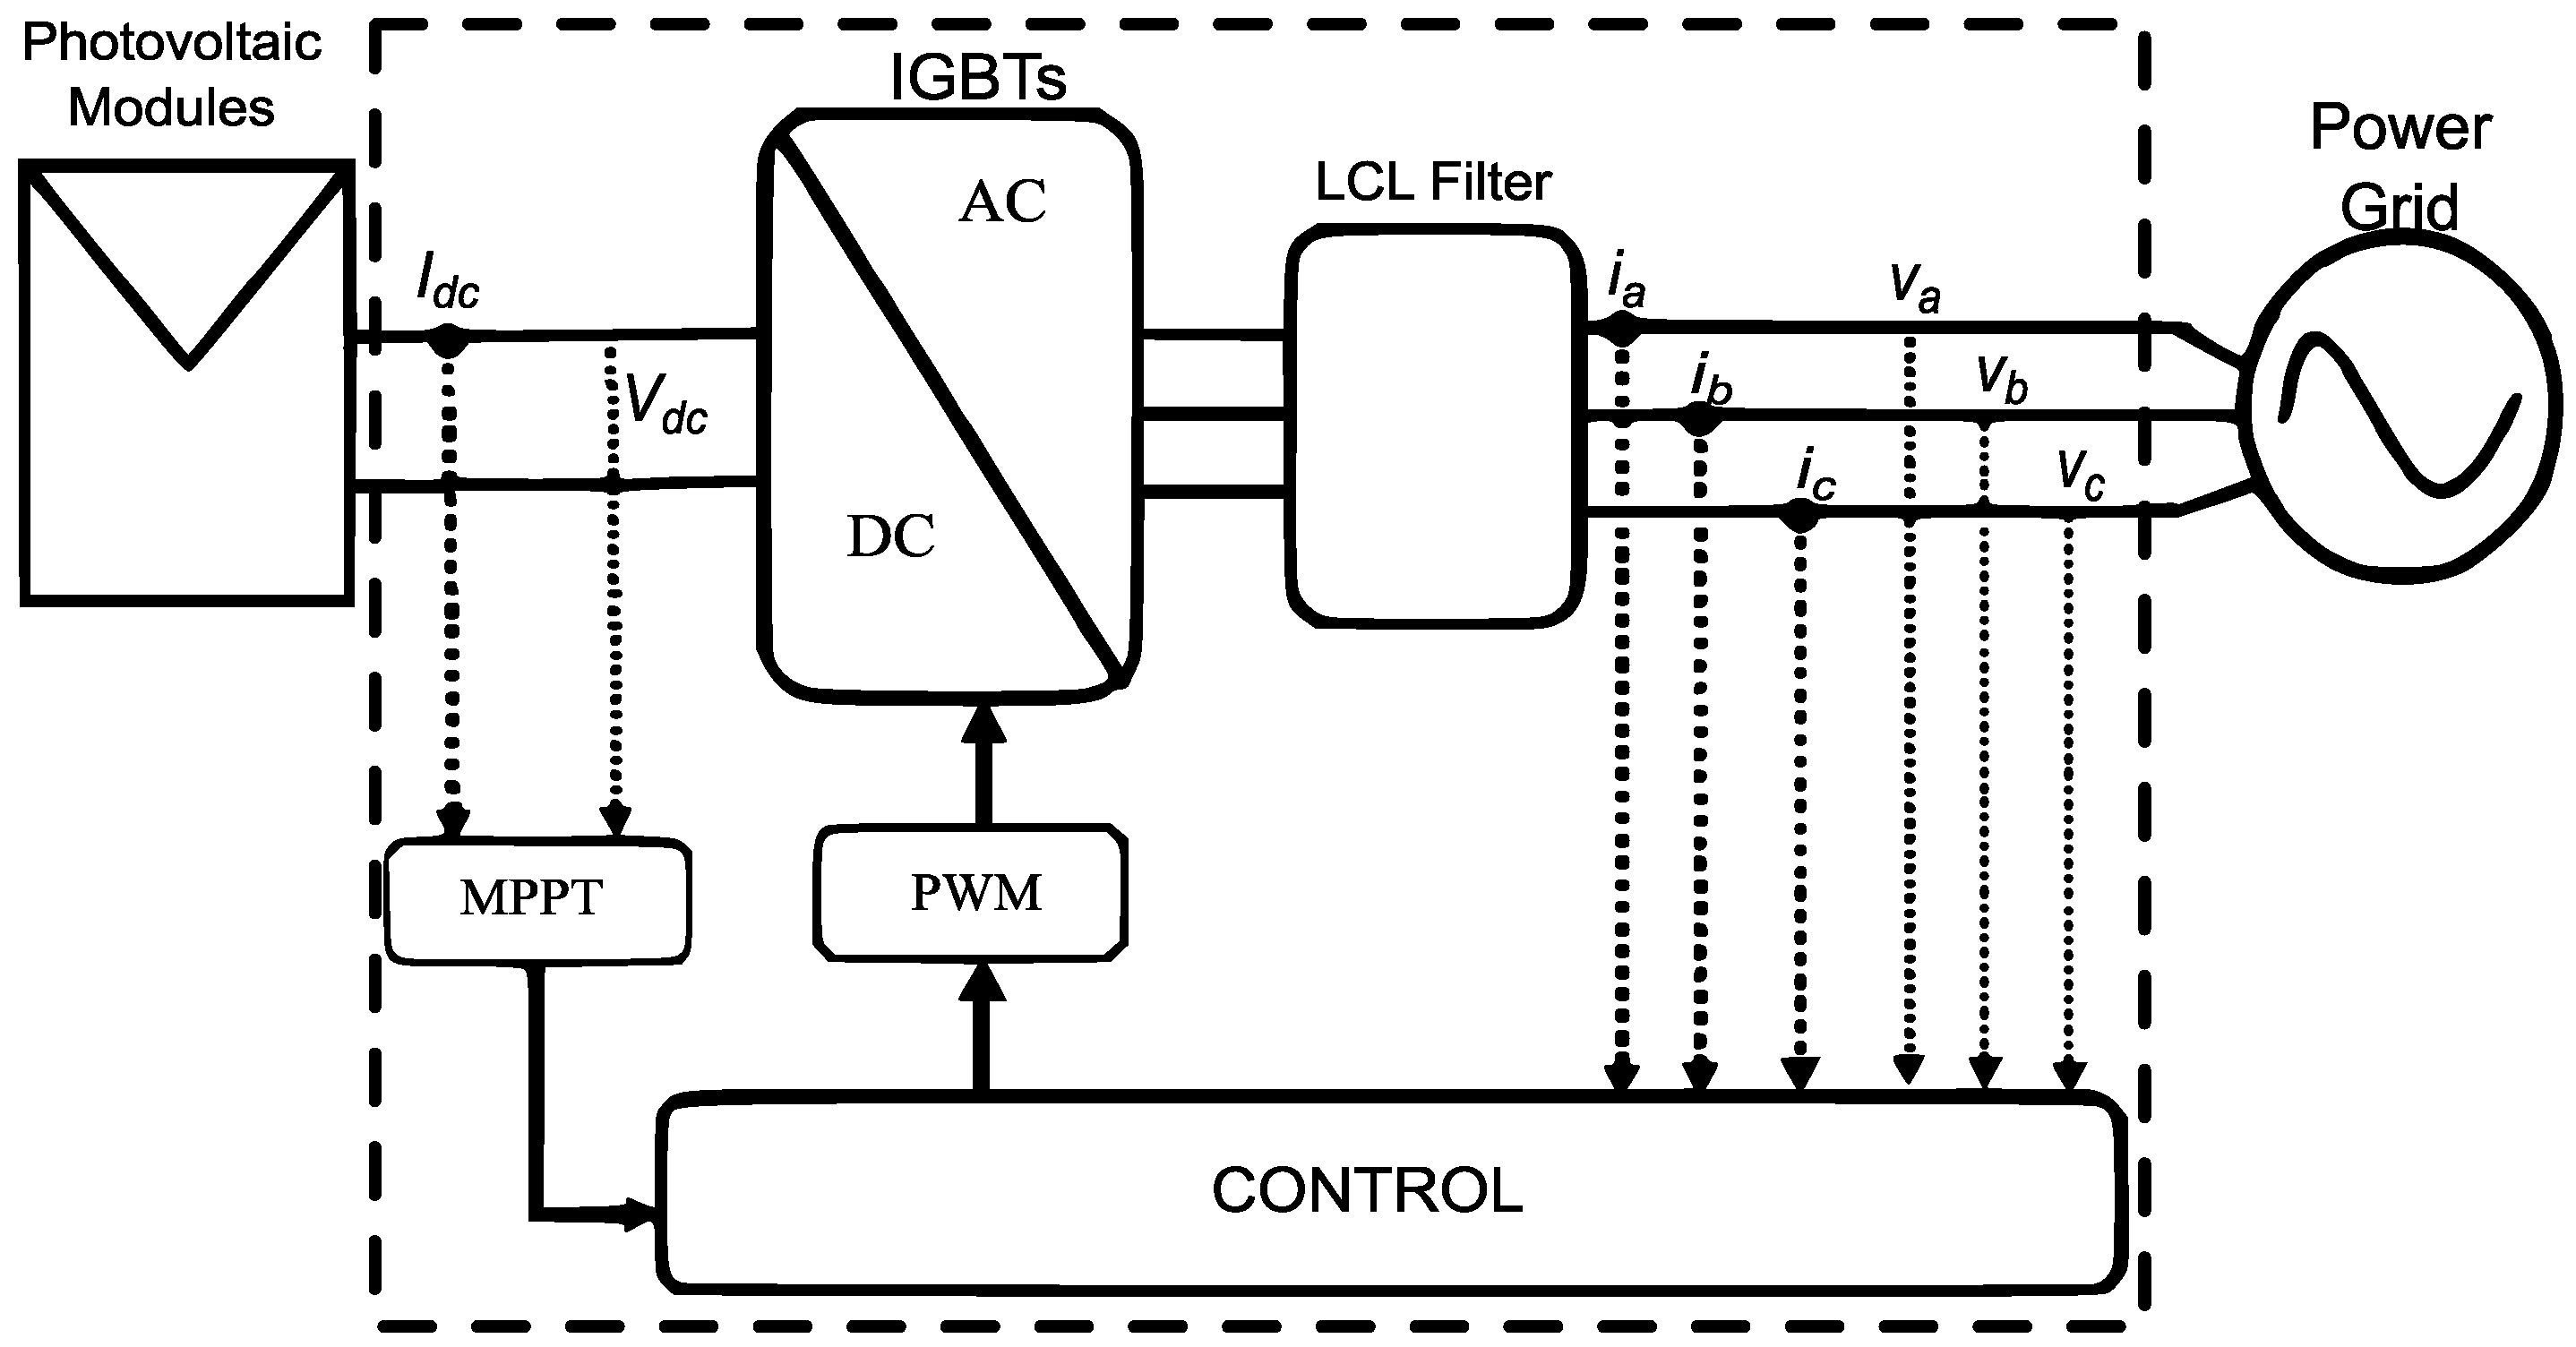
In terms of configuration for this study, unlike what is usually carried out, a GCPVS without the use of the boost converter was modeled. This converter has the function of boosting/adjusting the voltage from the PV array to the inverter. One of the advantages of dispensing with the use of the boost is the production savings for the inverter and one less switching control to the DC bus voltage.
The schematic diagram in Figure 2 shows the GCPVS under study, different from the one proposed by [4,21]. This model is also known as a single-stage converter. The GCPVS has the following characteristics: a 75 kW PV array (with 21 modules in series and 9 strings in parallel) combined with the MPPT technique applied directly to the inverter, and a three-phase inverter (full-bridge) with its controls, and through LCL filters (inductive-inductive-capacitive), that makes the connection to the three-phase low-voltage distribution grid.
The characteristics of the PV array respects what was presented by the authors [22], but sized for the climatic conditions of Brazil.

Inverter Control

In this study, the inverter with VSI topology (voltage source inverter) is used to perform the energy conversion and for the purpose of control optimization. The control structure of the inverter meets all the specifications of national and international technical standards. It is especially compatible with the technical standards required by ANEEL (“Agência Nacional de Energia Elétrica”—National Electrical Energy Agency), specifically by guidelines of PRODIST (“Procedimentos de Distribuição”—Distribution Procedures) for SIN (“Sistema Interligado Nacional”—National Interconnected System). These are regulatory standards in Brazil [23].
For the control of MPPT, the method used in this proposal is the Perturb and Observe (P&O) technique. This method was used due to its reliability, practicality, and ability to deliver maximum active power to the power grid [1,24]. In addition, the P&O algorithm was applied with regulation integrated to the inverter. The MPPT has a switching frequency of 8 kHz linked to the inverter keys. It should be noted that the voltage on the DC bus corresponds to 875.7 V, while on the AC power grid side, it corresponds to a phase voltage of 220 V at 60 Hz.
The switching frequency used for the inverter was PWM (Pulse Width Modulation) at 8 kHz.
At the inverter output, a LCL filter was used for each phase, where these third-order coupling filters are responsible for filtering and connecting the inverter to the power grid [25,26].
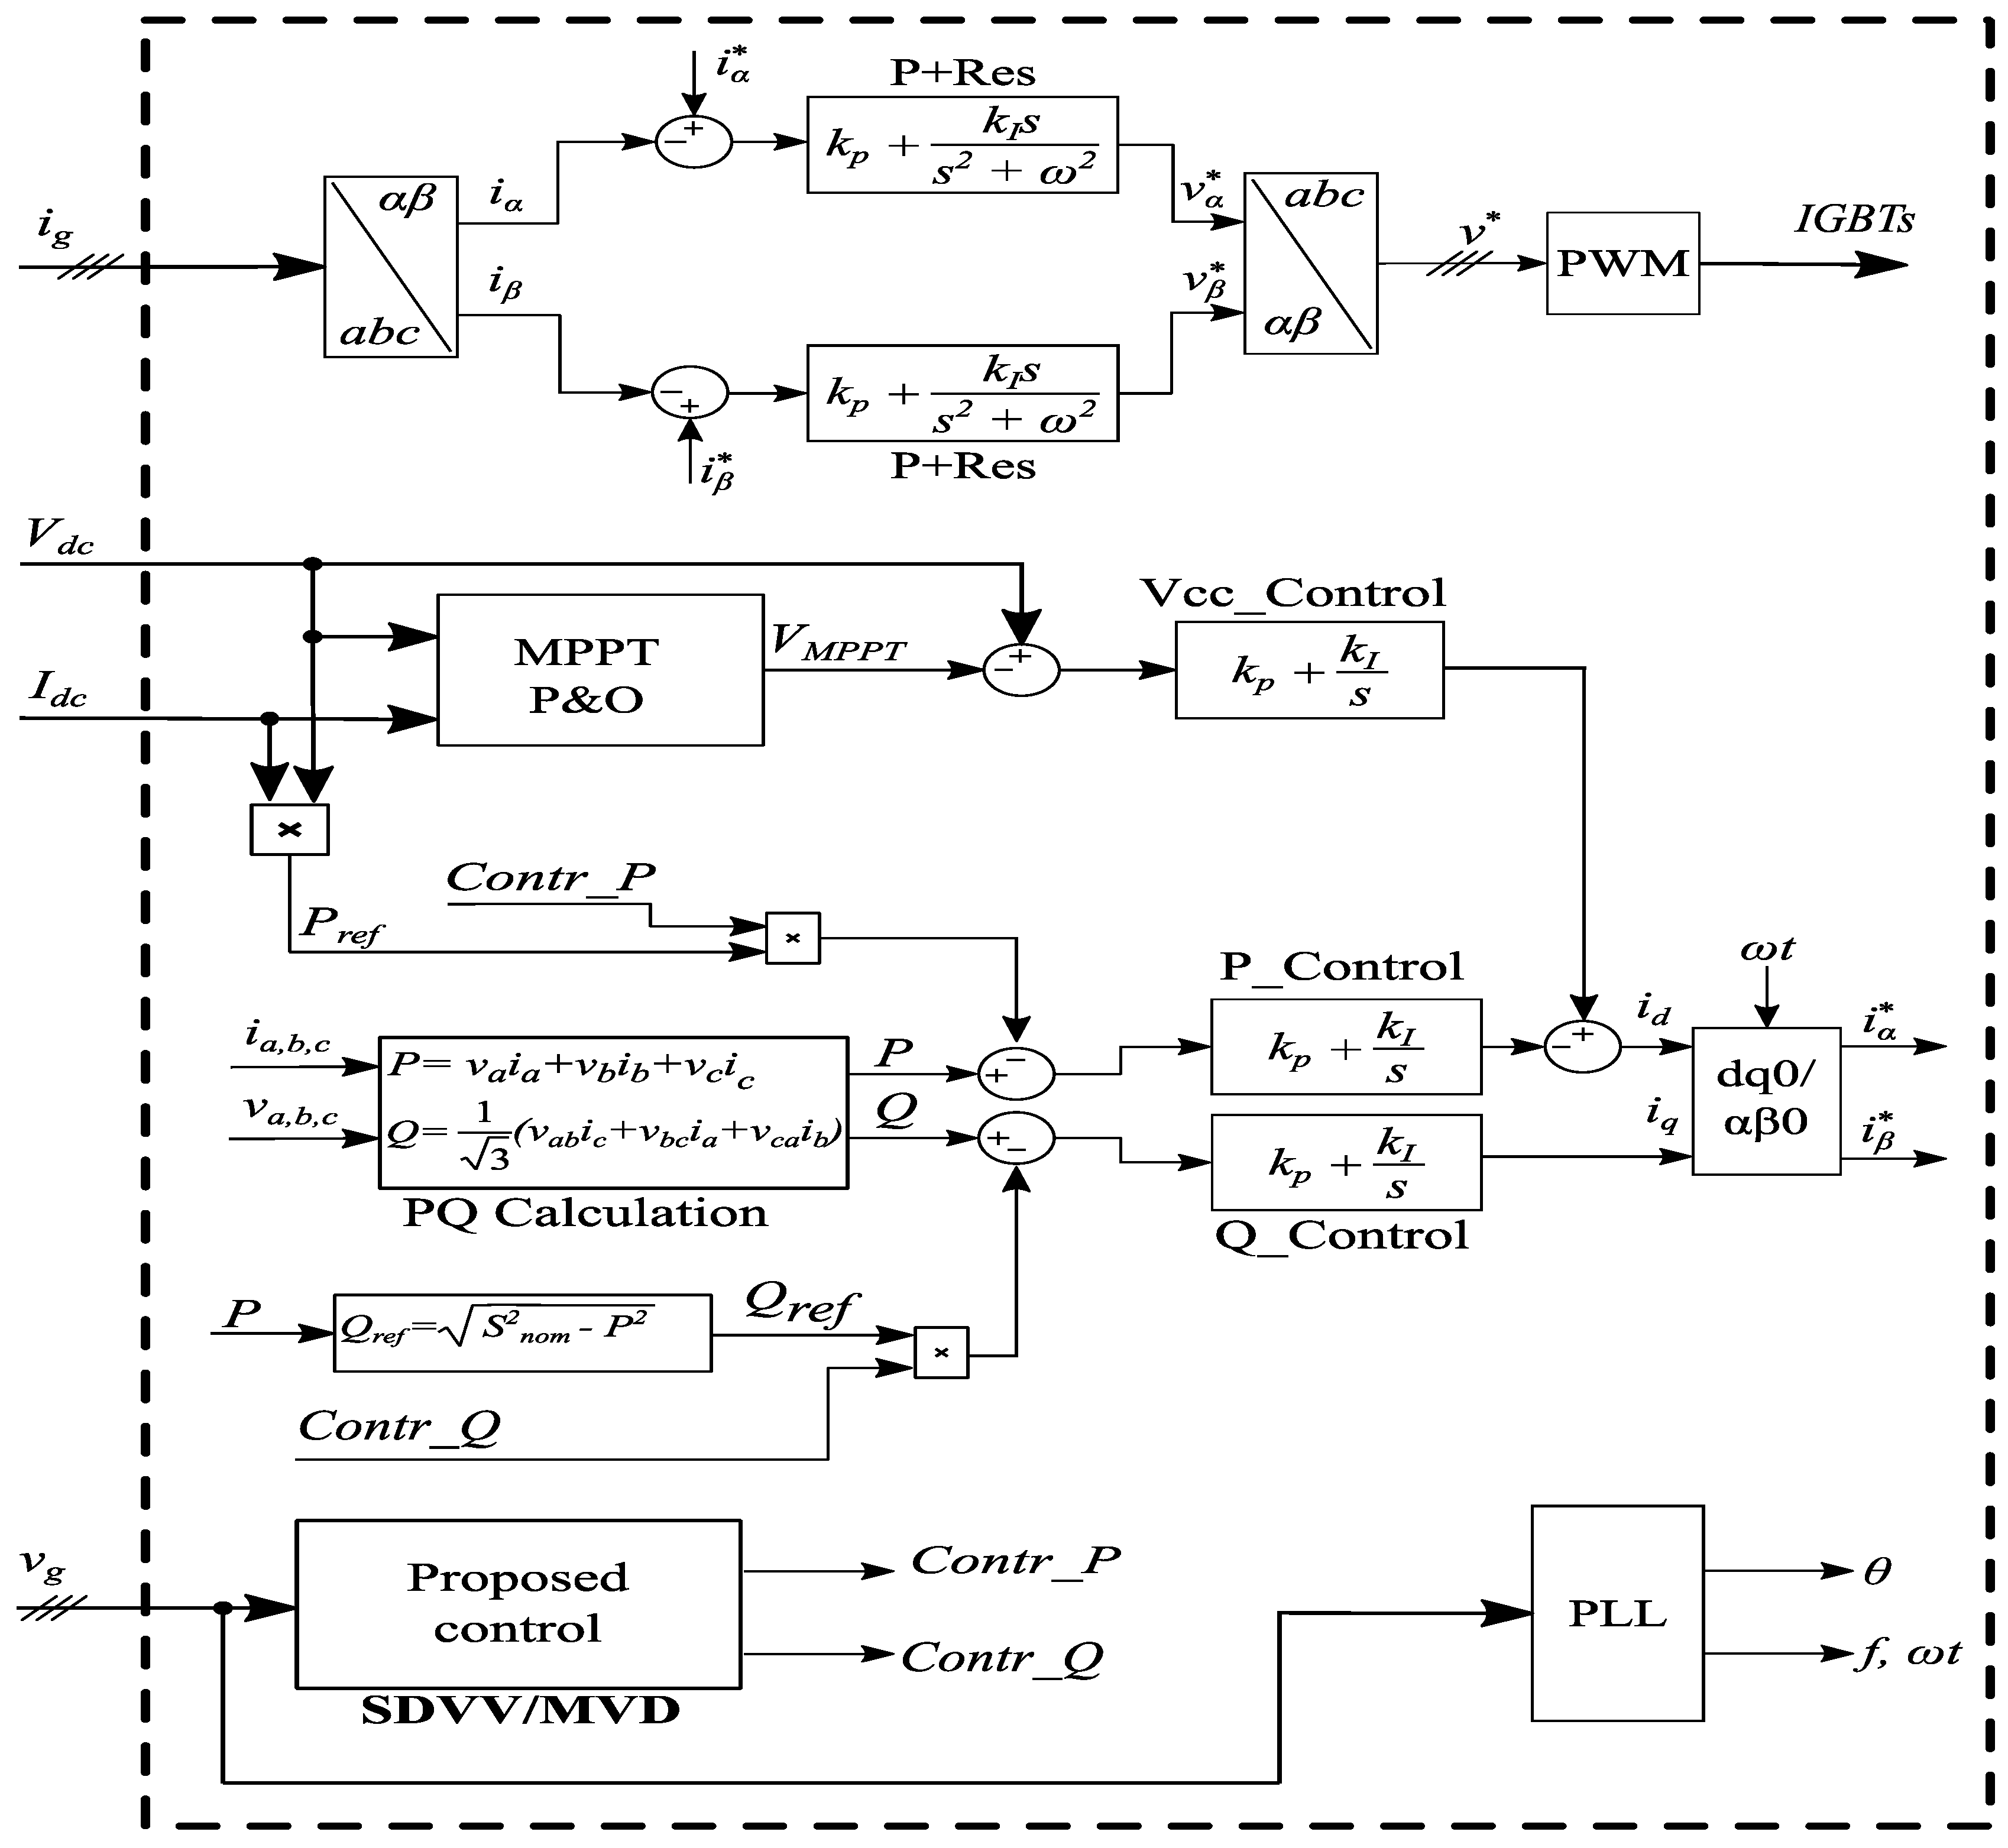
In the block diagram of Figure 3, the inverter was displayed with the proposed control to the injection of the active and reactive power at the moment of the voltage sag. In addition, it has a current control loop, a voltage and active power control loop, another loop for reactive power and a synchronous reference PLL (Phase Locked Loop).
Still in this work, for the current control loop, the damped resonant proportional controller (P + Res) was used, according to in Equation (1), which operates in the stationary frame of reference (αβ0), also was presented in [26,27,28]. The output of this control goes to the PWM controller and the IGBT’s switches.
C ( P + R e s ) a m o r t . = 2   P + [ 200 754 s s 2 + 754 s + 10 2 ]   R e s
The voltage control loop of the DC bus uses control technique with PI controller, similarly expressed by the transfer function in Equation (2) [26]. Next to it, the inverter power control uses the theory of instantaneous powers, as well as reinforces the “PQ calculation” block [28].
C v = 0.09041 ( s + 93.2 s )
As shown in Figure 3, the instantaneous values for P and Q, which are the output powers of the inverter and supplied to the power grid, are important for the control. Then, the instantaneous active power P is subtracted from the product between the reference power (real active power produced by the PV array) and the control for the active power (generated by the proposed), where P-(Pref x Cont_P). The other signal refers to the instantaneous reactive power Q, and it is subtracted from the product between the reference reactive power (this being the idle capacity of the inverter) and the control for reactive power (generated by the proposed), where Q-(Qref x Cont_Q). Note that within Equation (3) we obtained Qref, (the reactive power reference) and Snom (the nominal apparent power of the inverter).
Q r e f = S n o m 2 P 2
It is worth noting that the proposed enhancement is proportional and based in Equation (3).
Then, the resulting P and Q powers will be handled by PI controllers (where Kp = 0.003 and Ki = 0.3). These values for each of the powers were presented in [28]. In the sequence, the active portion adds the variable resulting from the control of the DC voltage, to generate the reference current id. It aims to control and perform the voltage regulation on the DC bus and to manage the injection of active power into the power grid.
The reactive power, after PI control, will correspond to the reference current iq which is controlled to manage the injection of reactive power, in order to keep the power management in the inverter always at 1 p.u. (per unit). It is important to note that, for the sake of obtaining a unit power factor, the product between (Qref x Cont_Q) must be equal to zero during normal inverter operation. After determining the variables id and iq, both are converted to iα and iβ, respectively, and added to the P + Res controls (resonant proportional) [28]. Finally, these are converted to the abc domain to generate the pulses by PWM and sent to the IGBT switches, LCL filter and the power grid.

3. Active and Reactive Power Control Optimization for Momentary Voltage Dip

In this section, the paper will present in a more specific way the proposed control to the injection of active and reactive power during the SDVV/MVD in the distribution grid.

Overview of the Proposed Control for SDVV/MVD

When a fault occurs (short circuit into the power grid), the voltage at the PCC decreases sharply as well as at other points on grid. In this sense, there is the possibility that the voltage level may violate the appropriate limits defined by ANEEL in module 8 of PRODIST for SDVV/MVD. It is worth noting that MVD indicates that the duration of the variation should be greater than, equal to one cycle and less than, or equal to three seconds. The voltage amplitude RMS in relation to the reference voltage must be greater than or equal to 0.1 and less than 0.9 p.u. [29].
If during a fault, the voltage is within the above-mentioned condition, the inverter control will immediately switch from normal operation mode to SDVV operation mode.
This reinforces that the contribution of the research is in the voltage recovery process during the fault time. It consists of injecting amounts of active and reactive power depending on the amplitude of voltage sags as mentioned by Figure 1. This process continues until the grid protection isolates the fault or even before the anti-islanding protection disconnects the inverter from the power grid.
The limits used as reference for the analysis of voltage sags, specifically the momentary voltage dips in this work, are established by ANEEL in module 8 of PRODIST [29], as shown in Table 1.
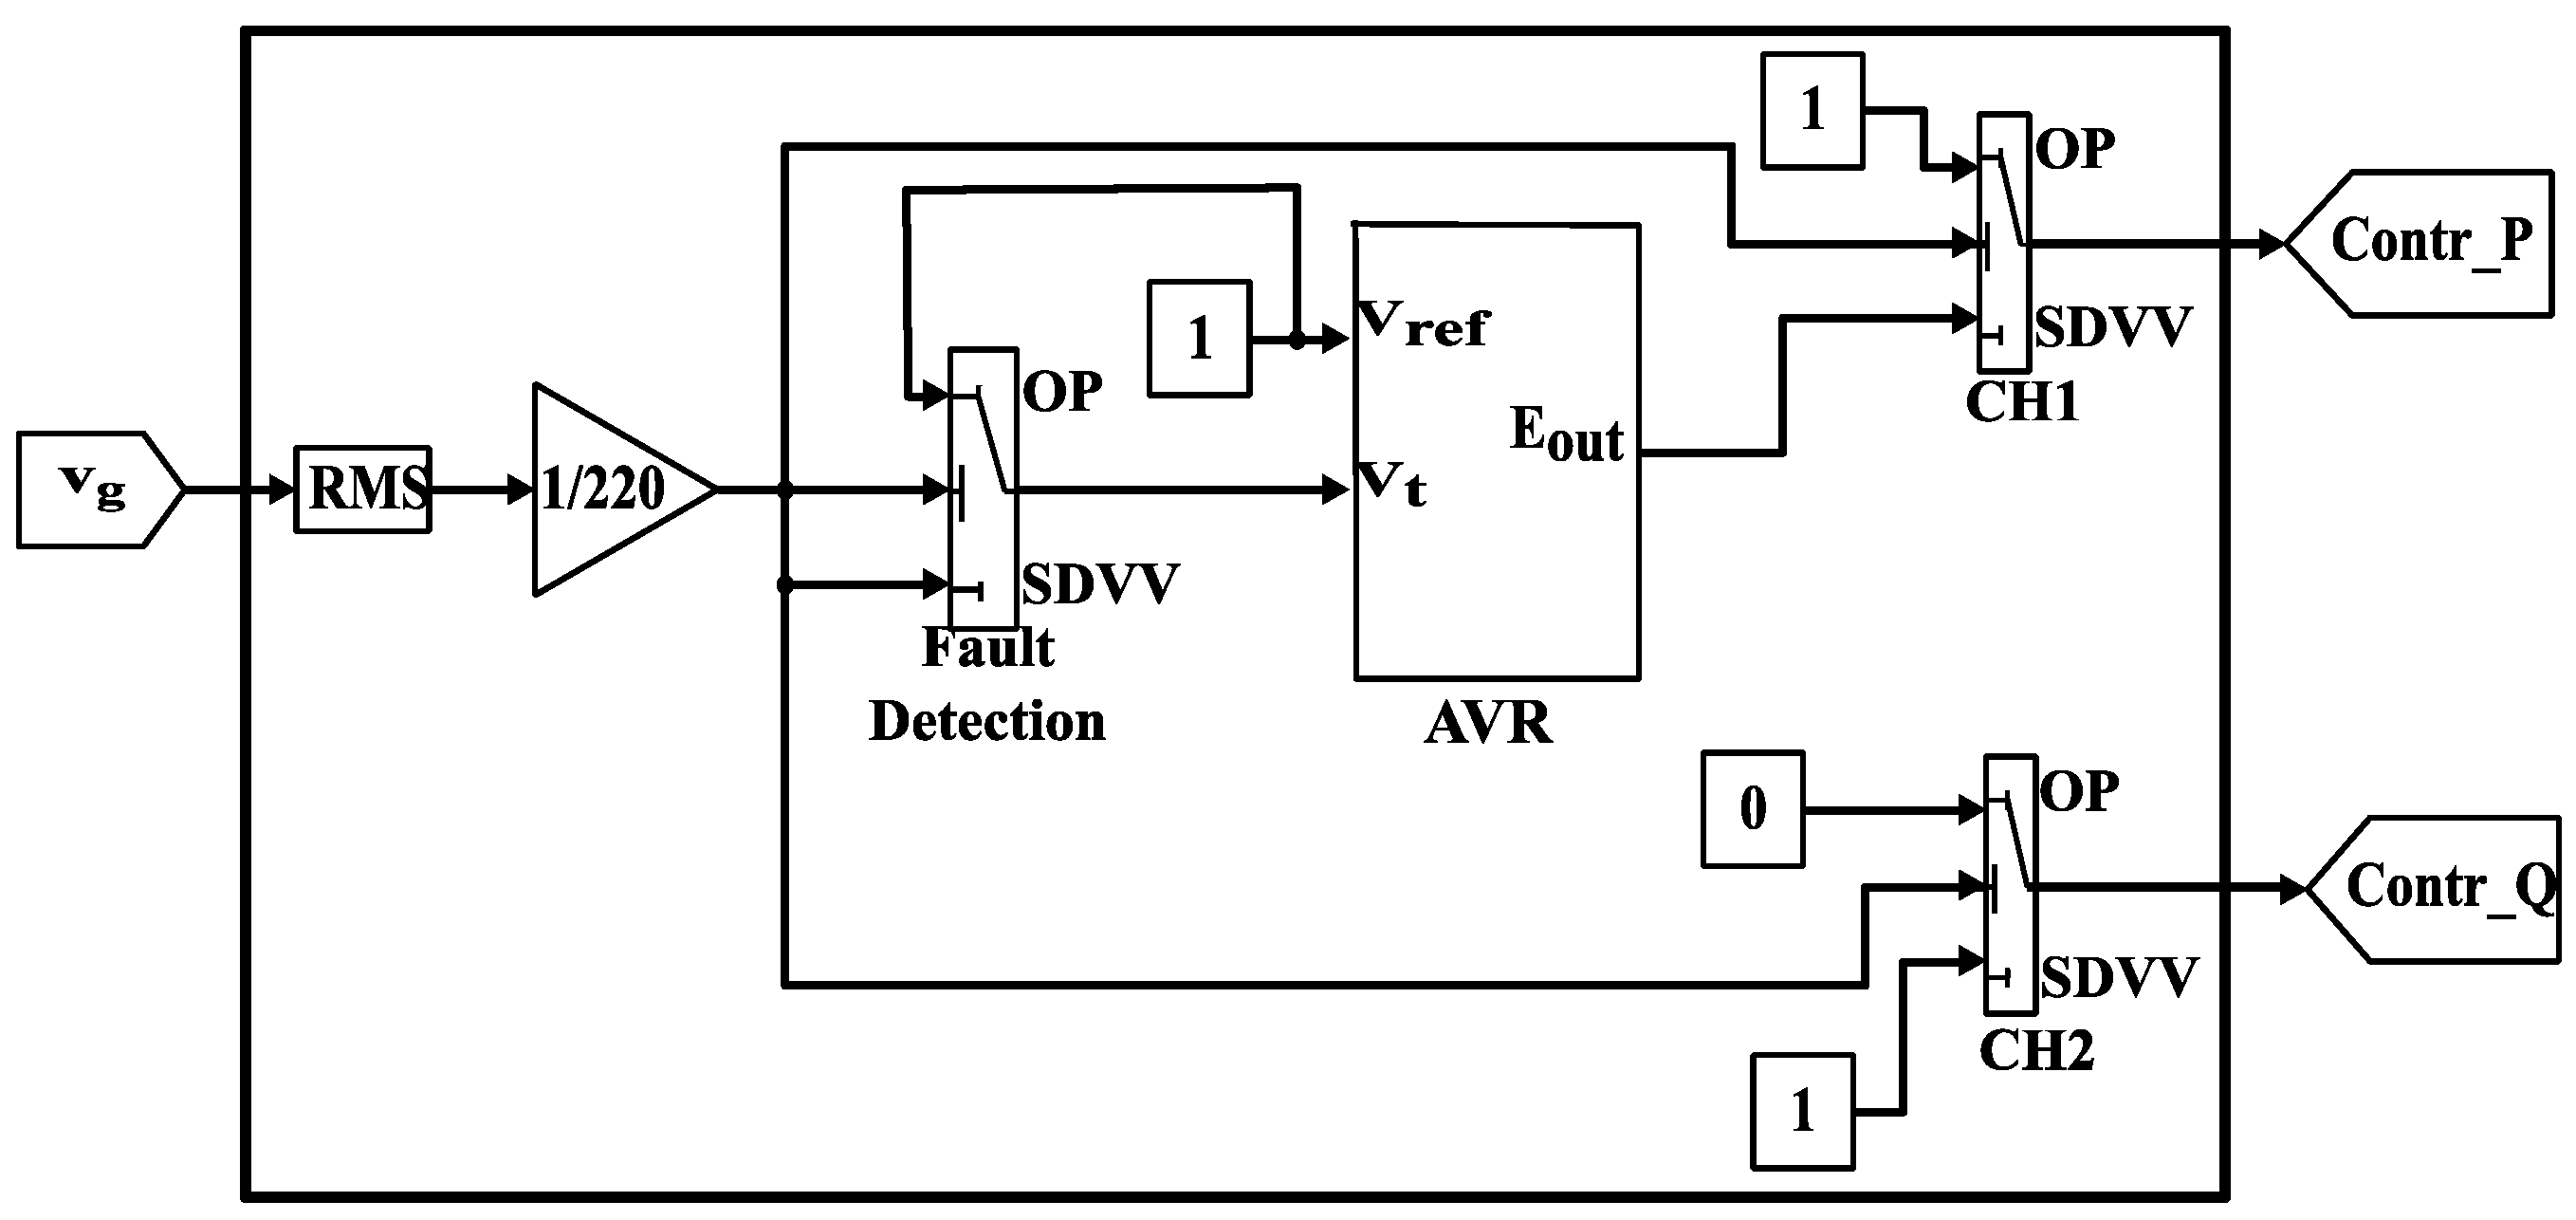
Figure 4 represents the control strategy to minimize the effects of SDVV/MVD. This strategy applies during the voltage sag. To this end, a logic unit to detect voltage sags (fault detection) was added to the control topology. This unit has the characteristic of detecting the voltage variations into the grid and checking if they are within the limits established by Table 1. If the voltages are below 0.9 of the nominal value, the system switches from normal operation (OP) to operating mode in SDVV. In this situation, the control methodology also uses the AVR strategy elaborated by IEEE 421.5–2016 DC1A [30], where Vt is voltage into the grid measured in p.u. and Vref is the reference voltage equal to 1 p.u.
The AVR influence is associated with handing a signal (Eout) that accelerates the active power drop during voltage sag.
In this context, when detecting the voltage sag, if this disturbance exceeds the limit pre-set in the control according to Table 1, the CH1 switch will receive the output signal from the control. This switch has the same condition as the “fault detection” function. If the voltage on the PCC is below 0.9 p.u. the operation will be in SDVV condition. Therefore, the Contr_P output will receive the control signal. In this way, the proposed strategy switches to the SDVV operation mode, which consequently will decrease the injection of active power and increase the injection of reactive power into the power grid, as shown in Figure 1.
The output signal Contr_Q at 1, the condition of the CH2 switch has been established (Vnom < 0.9 p.u.). The control enables the condition to inject the maximum reactive power available by the inverter (idle capacity, since the control reduce the amount of active power injection) into the power grid.
For on power grid fault situation (voltage sag), the variables Contr_P and Contr_Q are integrated with the rest of the control, as shown in Figure 3. In view of these conditions, the control starts to contribute to the reduction of the voltage sag. Thus, it is possible that sensitive loads to SDVV stay connected to the distribution grid.
It is noteworthy that, as long as the voltage is between 0.1 to 0.9 p.u. de Vnom, the output value (control signal-Contr_P) will be multiplied by the reference value (Pref) of the active power provided by the photovoltaic array. Therefore, the more severe the voltage sag, the lower the active power injected by the inverter into the power grid. With this, there will be an idle space in the capacity to manage power in the inverter to inject reactive power into the grid. For this reason, Qref identifies the amount of reactive power that the inverter can supply, thus contributing to alleviating the voltage sag.
It is important to remember that the proposed control defines the reference reactive power Qref respecting in Equation (3) and Figure 3. Otherwise, if there is no voltage sag in the power grid, the value of Qref is multiplied by Contr_Q (Contr_Q = 0), for the purpose of maintaining unity power factor during normal operating mode.
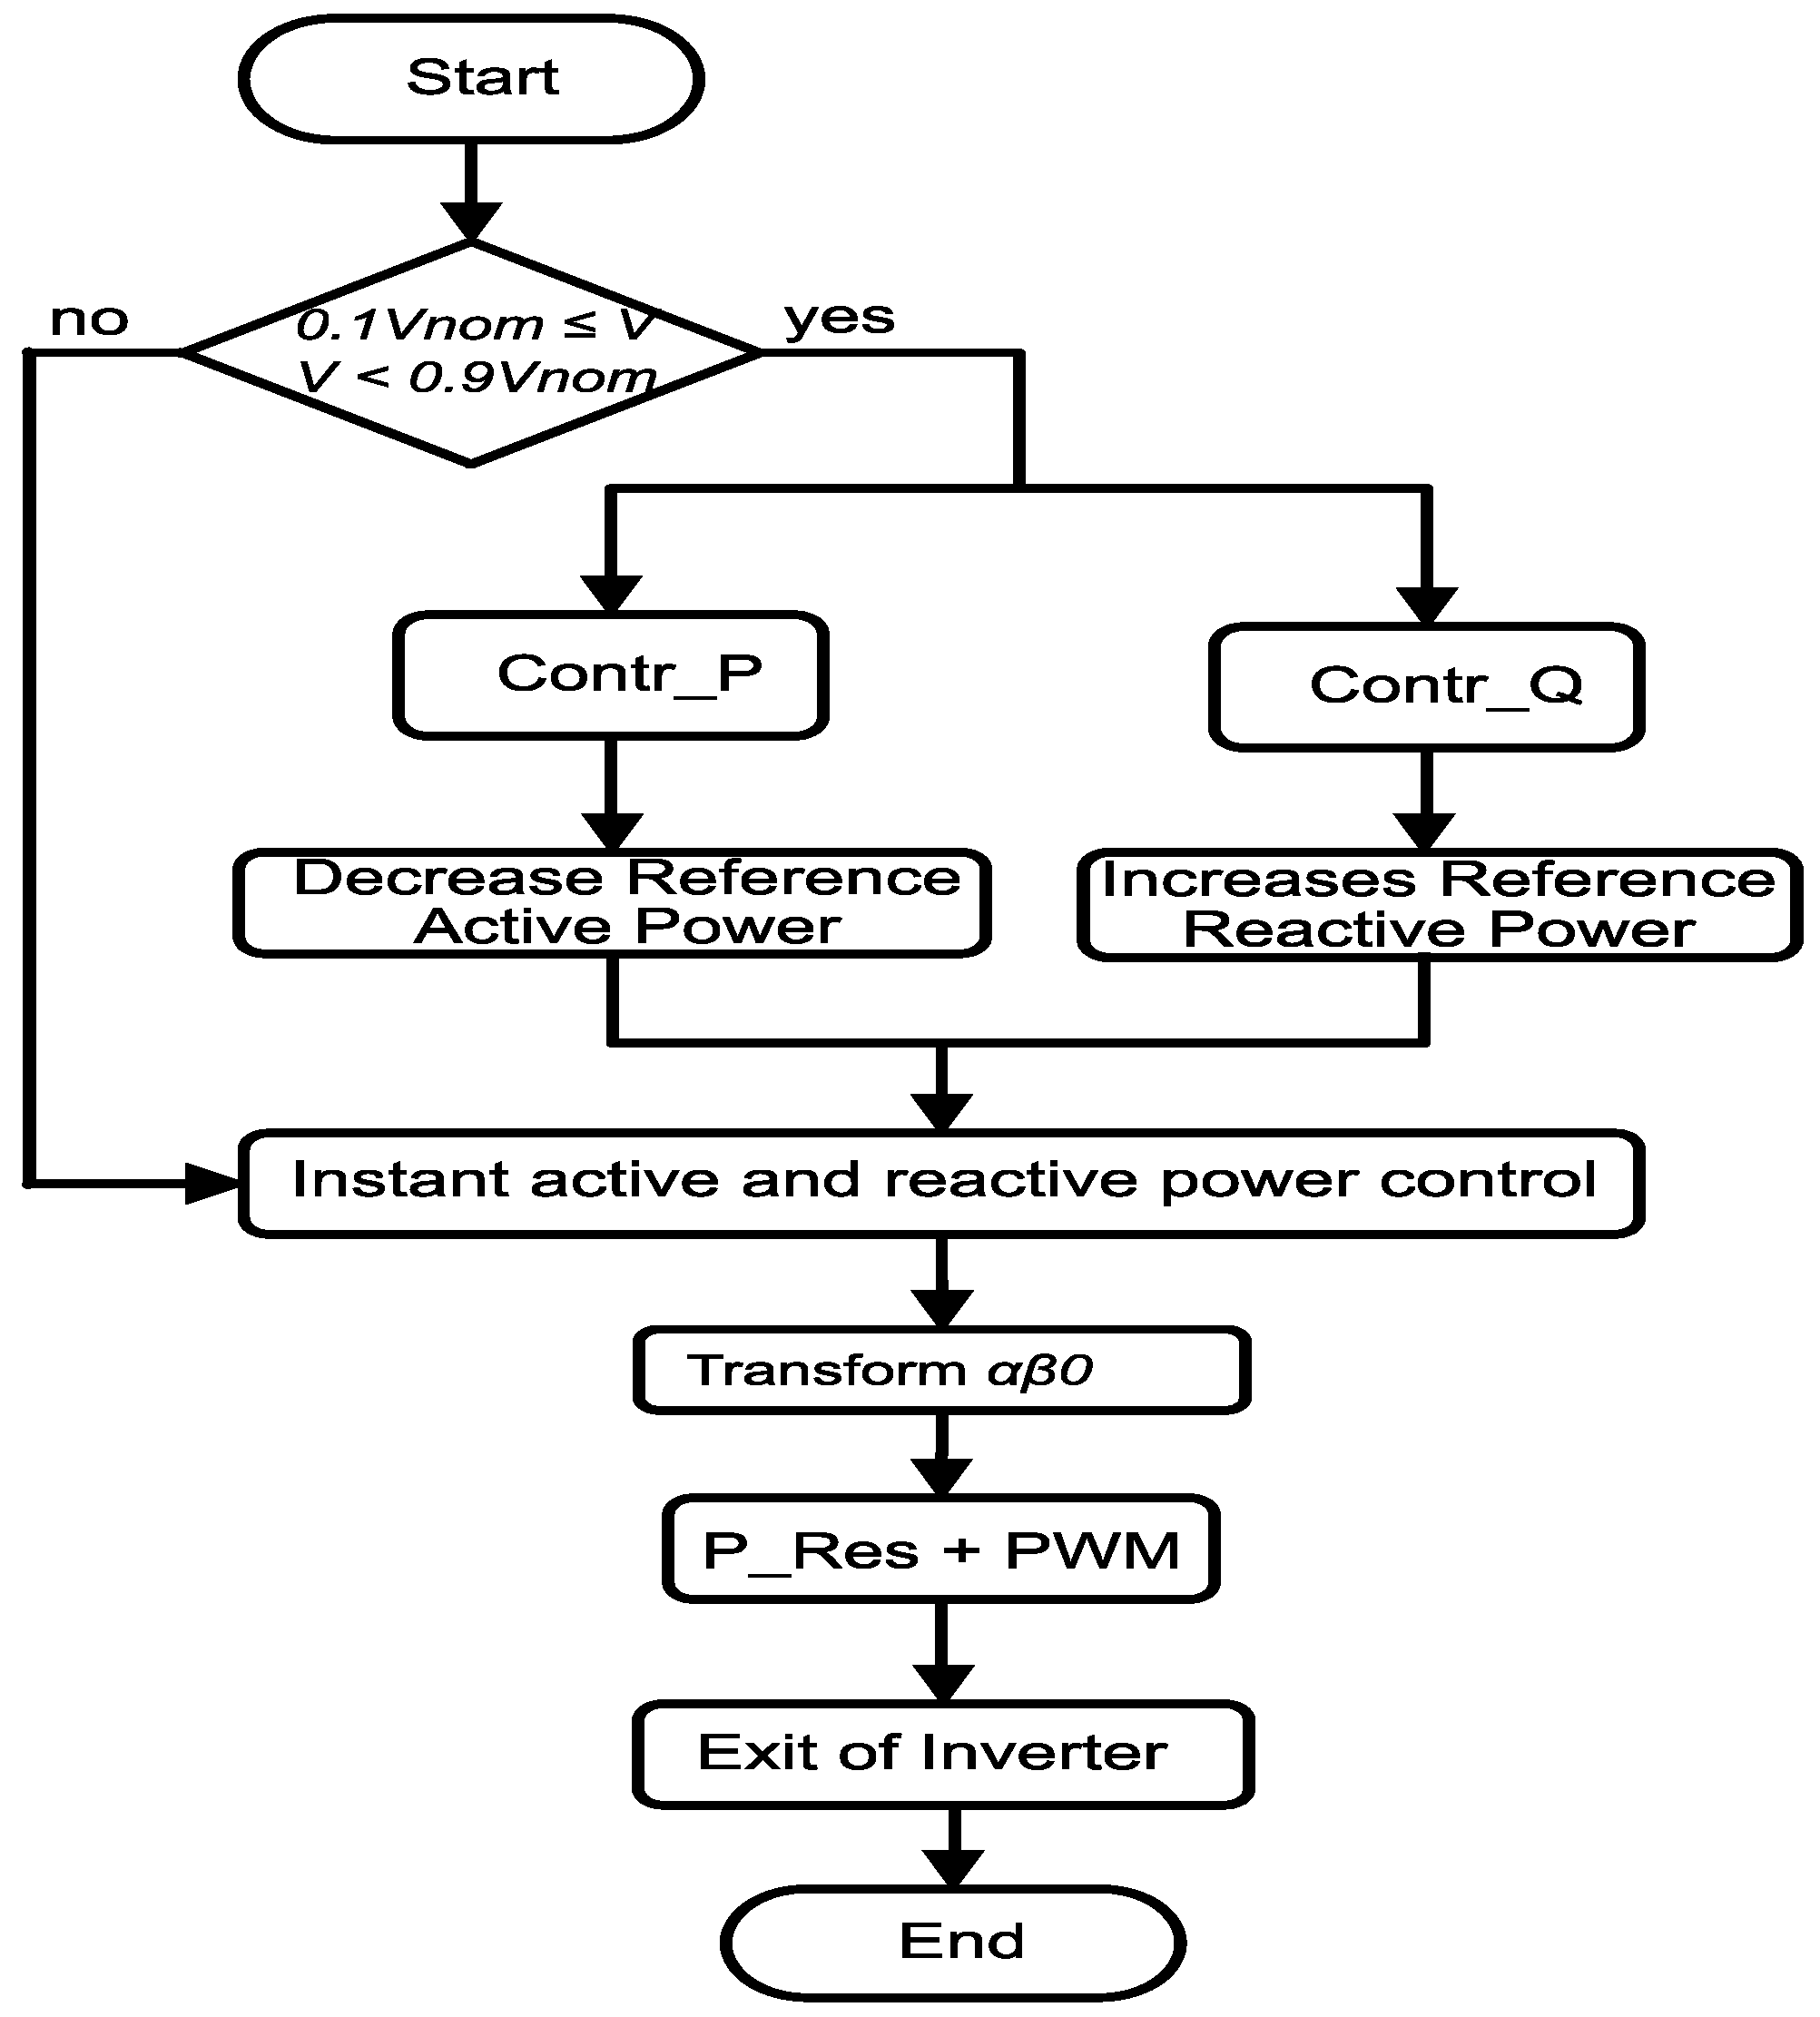
The flowchart of Figure 5 shows the operational strategy of the proposed SDVV/MVD control.
It can be seen in the flowchart that when the voltage sag is detected, the control acts to immediately decrease the active reference power, even if it is actually operating at its maximum active power, (depending on the climatic conditions). Thus, the inverter will have idle space to inject as much reactive power as possible. This action helps to recover the voltage and the dynamics of the power grid during the MVD, respecting the capacity limit of the inverter.

4. Distributed Power Grid

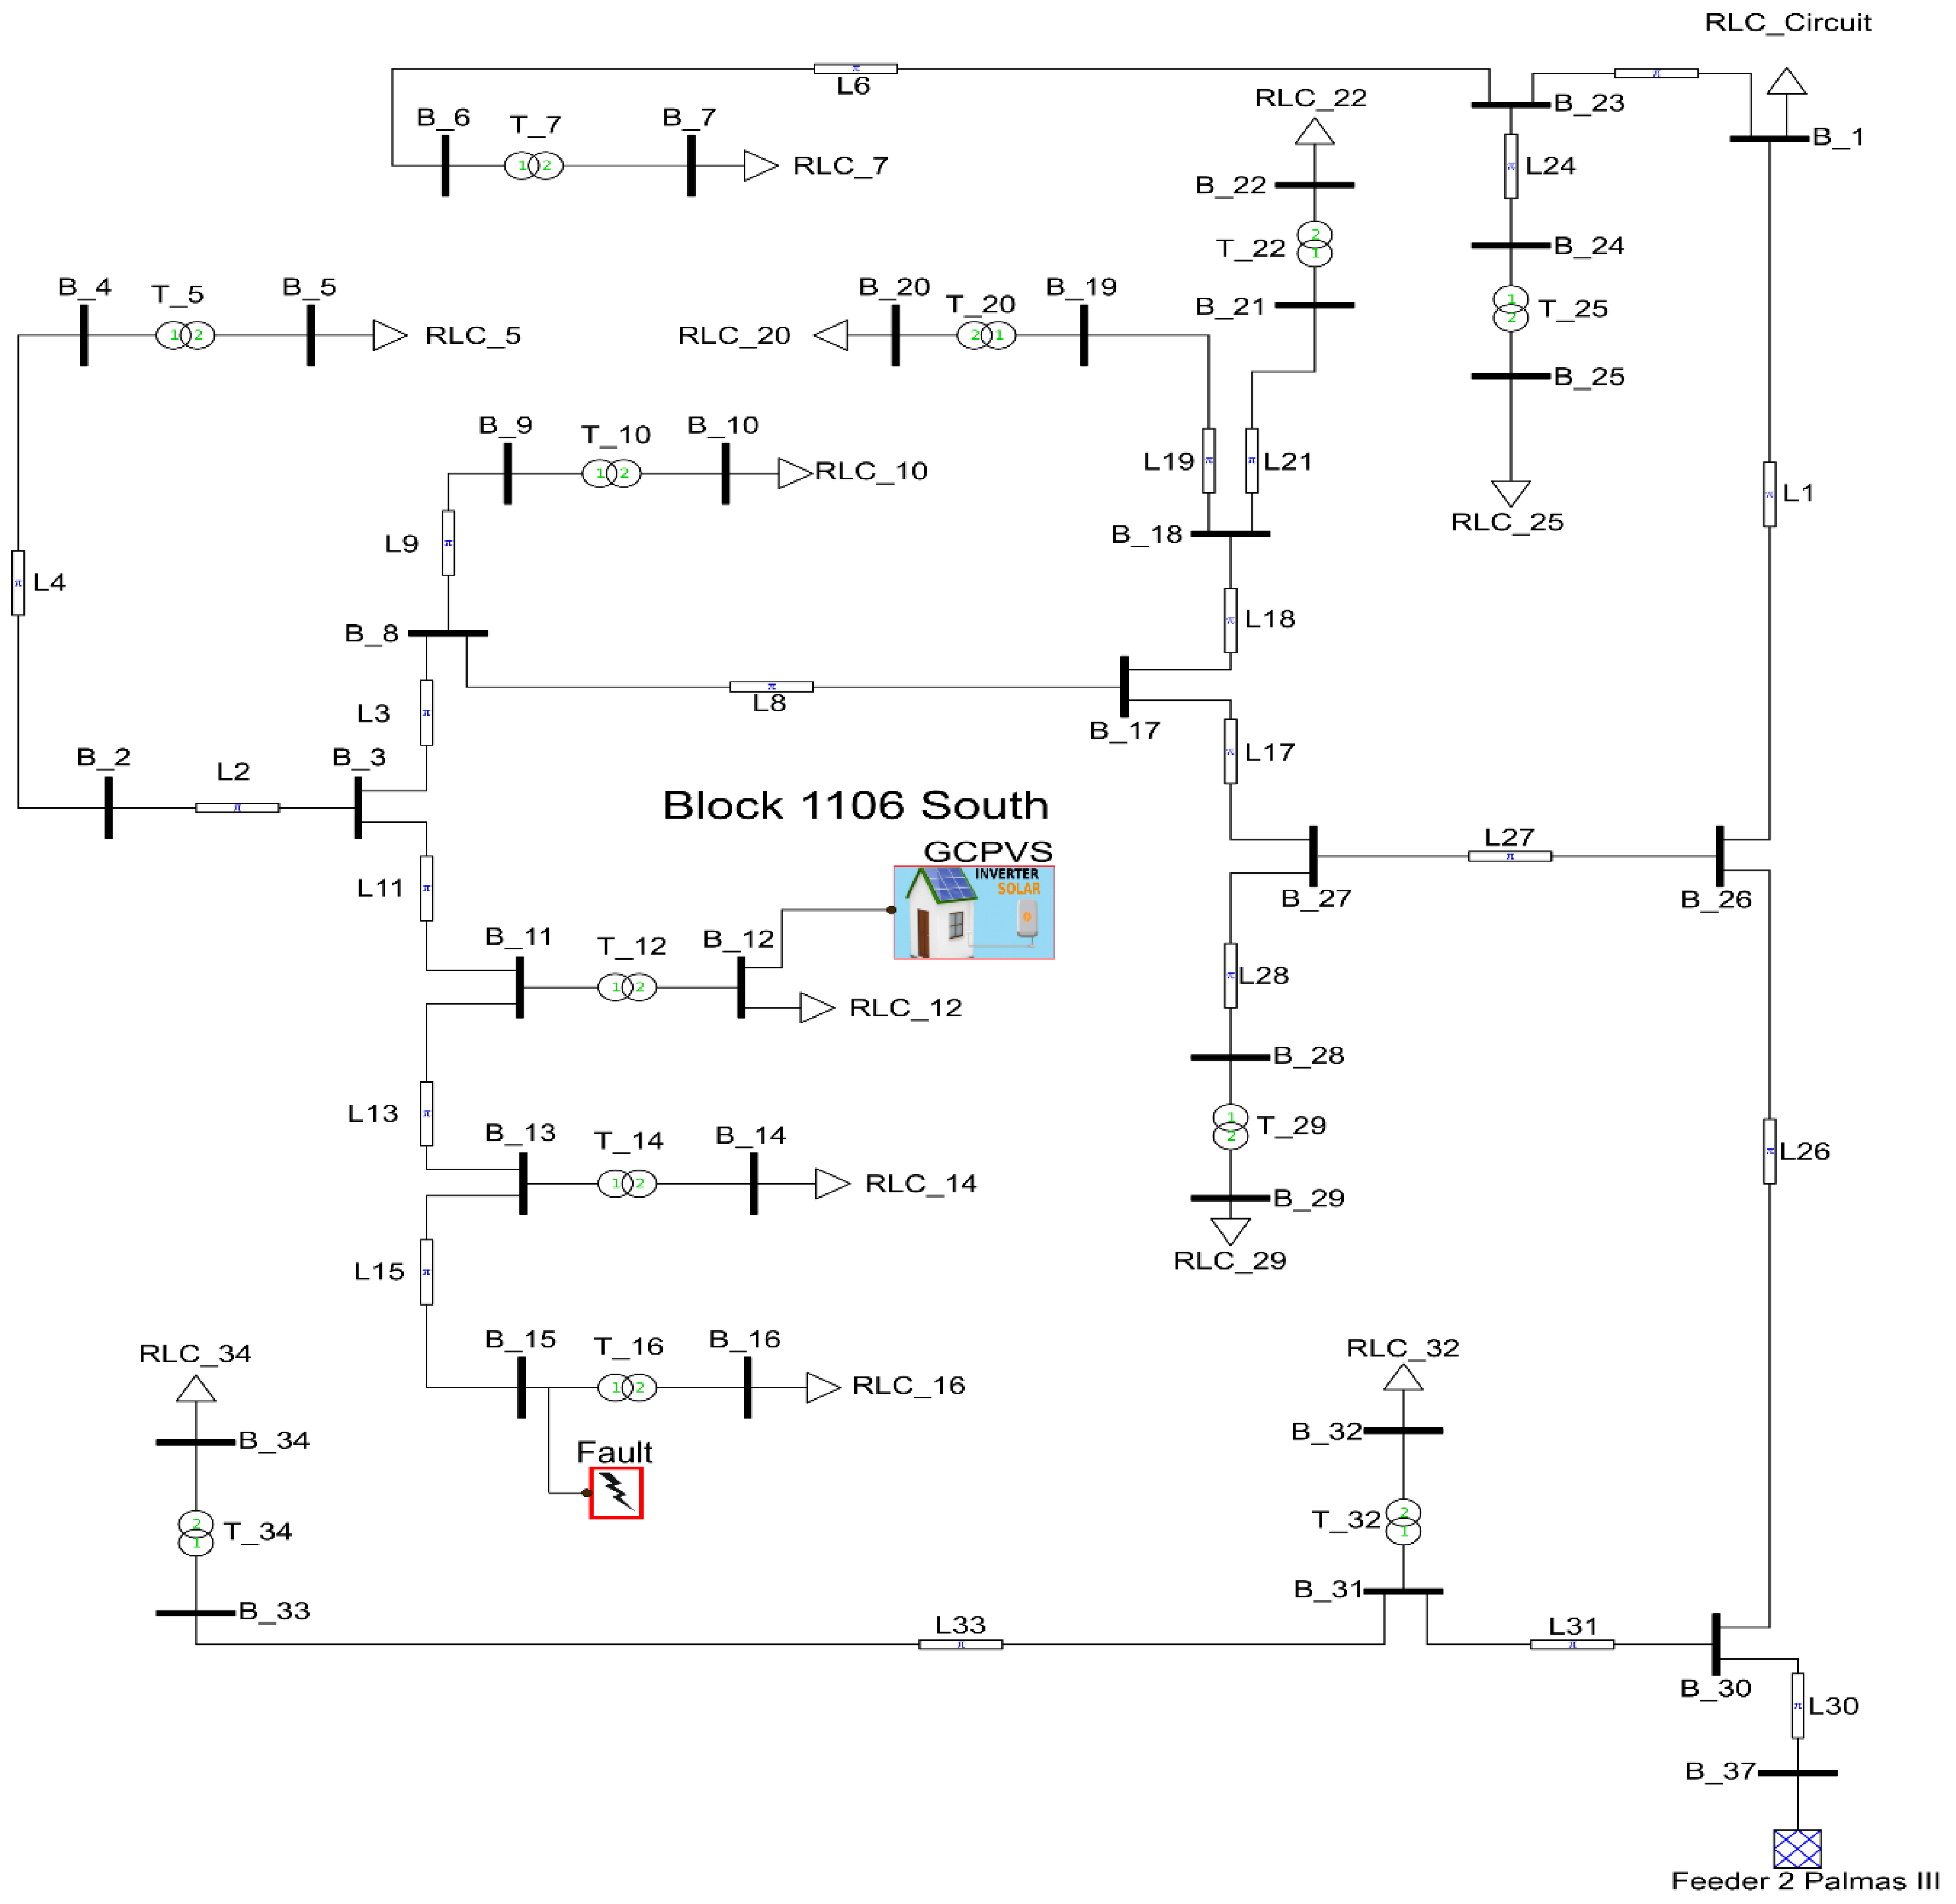
Further details on power grid used for the simulations can be found at [31,32,33]. In fact, it is a real power grid, located in the 1106 South block of Palmas, capital of the state of Tocantins, Brazil. This grid has 1427 consumer units (households, businesses, public agencies, or industries). These consumer units are served by three-phase delta-star distribution transformers, with rated powers of 75 kVA, 112.5 kVA, and 150 kVA, and a voltage ratio of 13.8 kV:380/220 V.
Figure 6 shows the single-line diagram for the location in question. Notice that the primary distribution grid of 13.8 kV feeds the transformers through feeder 2 of the Palmas III substation. In addition, all of the consumer units connected to each secondary transformer and represent as a single load (RLC) were added. In Table 2, Table 3 and Table 4 and [31] there are detailed data relating to the overhead distribution grid, interconnections, transformers, and loads.
Table 2 presents the transformers data, while Table 3 presents the secondary of each transformer and the number of consumer units connected to it. A constant power load (RLC) represents this number. Table 4 refers to data and parameters of the lines between the primary transformers and the substation (radial topology connection model). These data were provided by the local electric power utility for the block 1106 South distribution grid.

5. Results and Discussions of SDVV/MVD Control

In order to carry out tests and simulations, the complete GCPVS model was implemented together with the proposed control for SDVV/MVD on the Matlab/Simulink® computing platform. For the case study, the moment of highest consumption of electricity in the Palmas distribution grid and without the presence of the photovoltaic DG was chosen. Thus, as referred to above, the collected data such as voltages, currents, powers, and power factors are real measurements provided by the local electric power utility.
As already mentioned, the day and time chosen were the ones that represents the highest energy consumption without DG. For this condition, the readings presented the following values: a voltage magnitude of 13.63 kV, and powers of 2.6815 MW, 1.5907 MVAr, and 3.1178 MVA (PF = 0.8601) at the power supply 2 of Palmas III. All of these data, together with the information in Table 2, Table 3 and Table 4, were included in the simulation.
Then, the GCPVS was connected to the T_12 three-phase secondary transformer and the values of voltage, current, and instantaneous power in PCC B_12 were measured.
To meet the SDVV requirements established in Brazilian standards, the proposed control will keep the GCPVS connected. In this way, it continues injecting the available amount of active and reactive power to mitigate a voltage sag, as described in Section 3.
It is worth pointing that ANEEL does not yet allow small photovoltaic systems to remain connected when there is a lack of synchronism with on grid, nor do they contribute with ancillary services to the distribution grid.
From now on, the results of the GCPVS dynamic voltage support for SDVV/MVD will be presented.
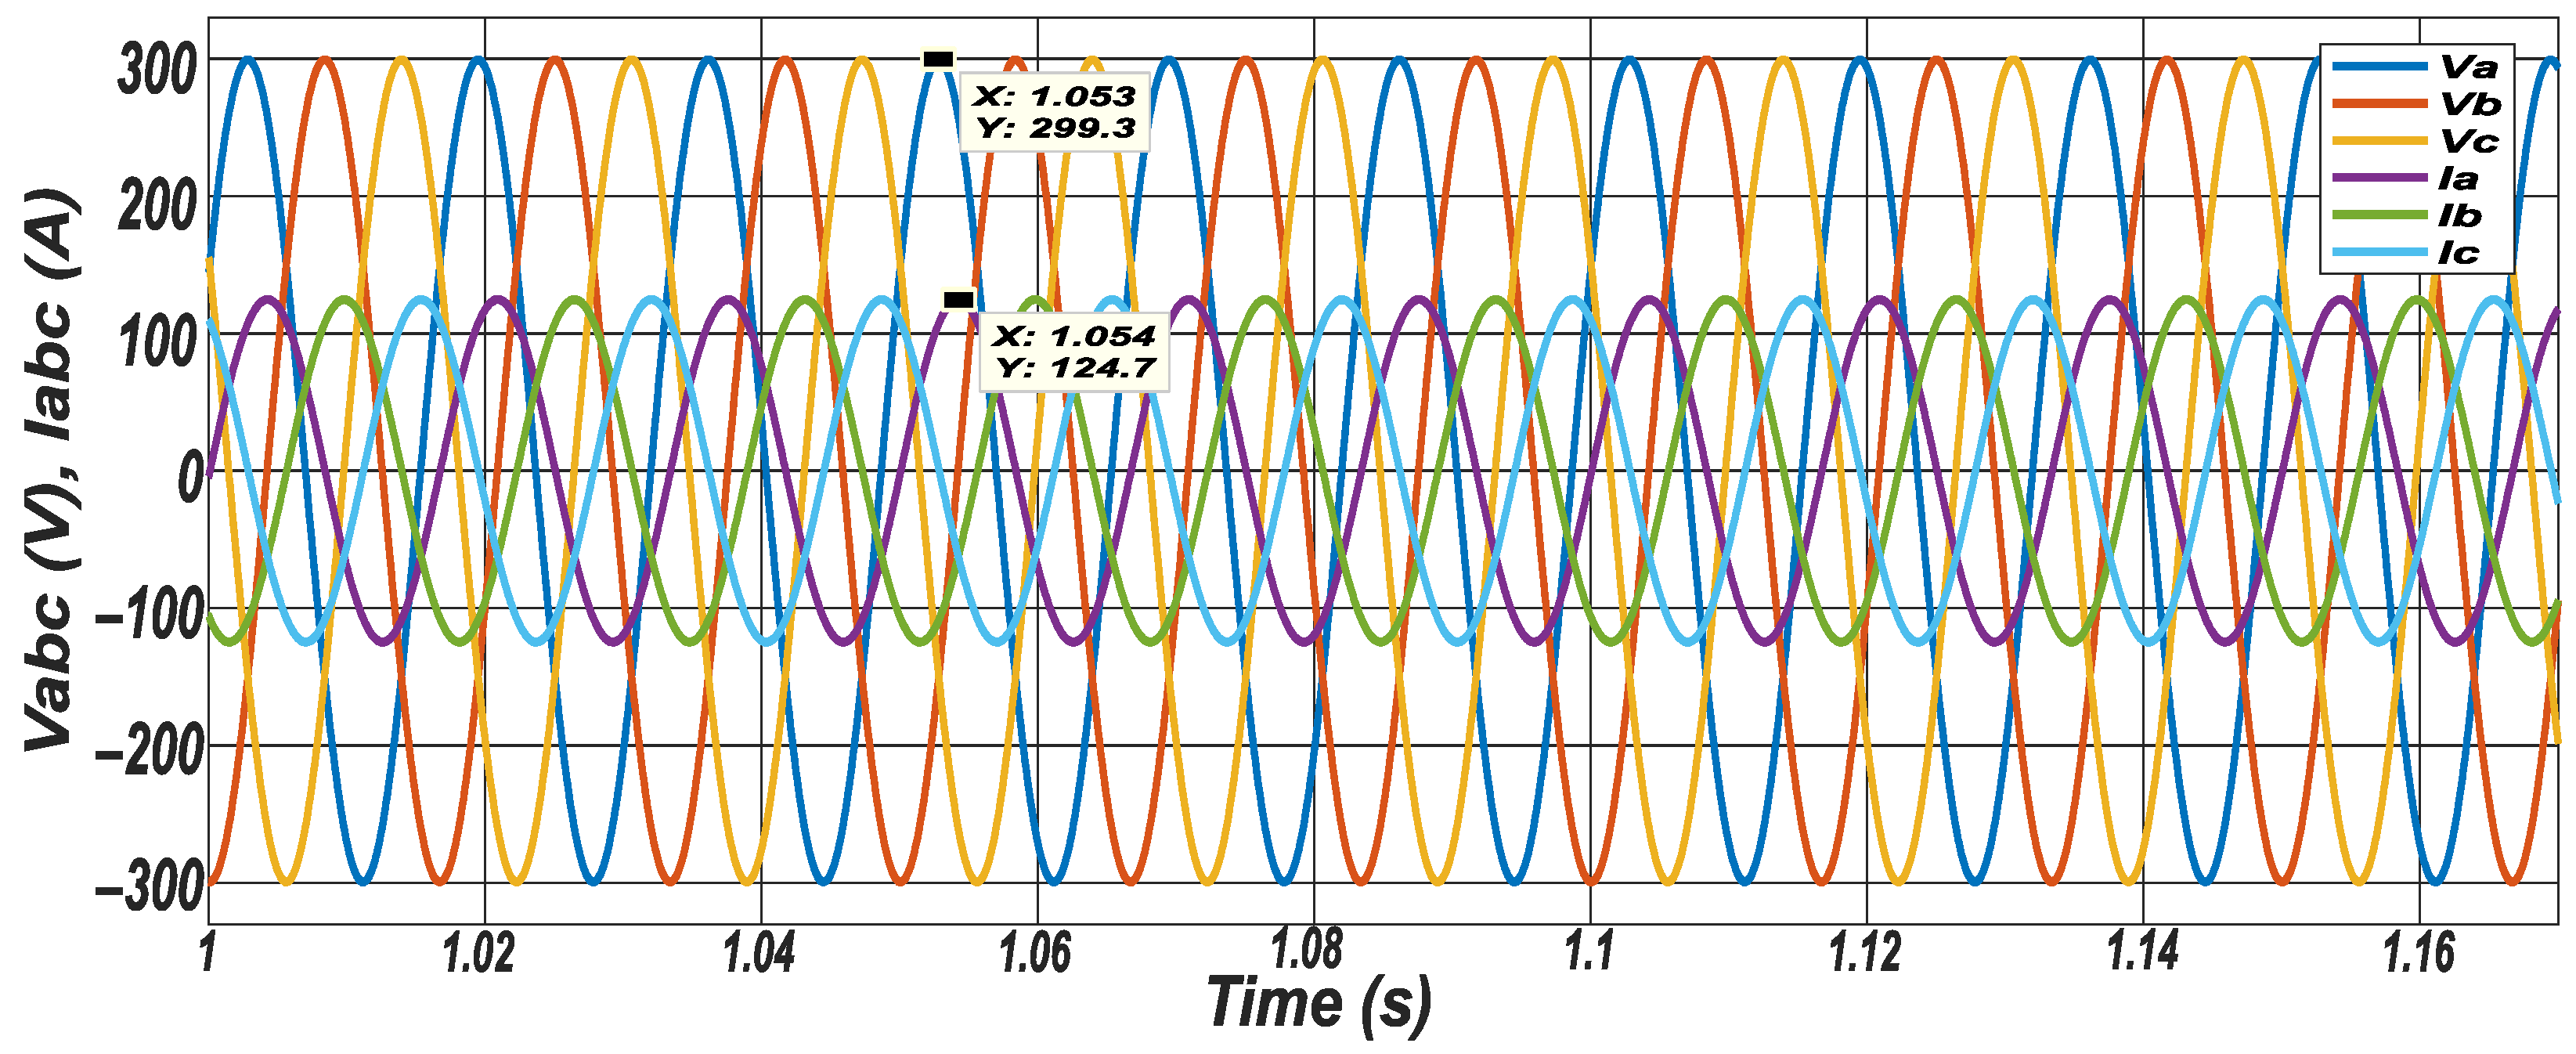
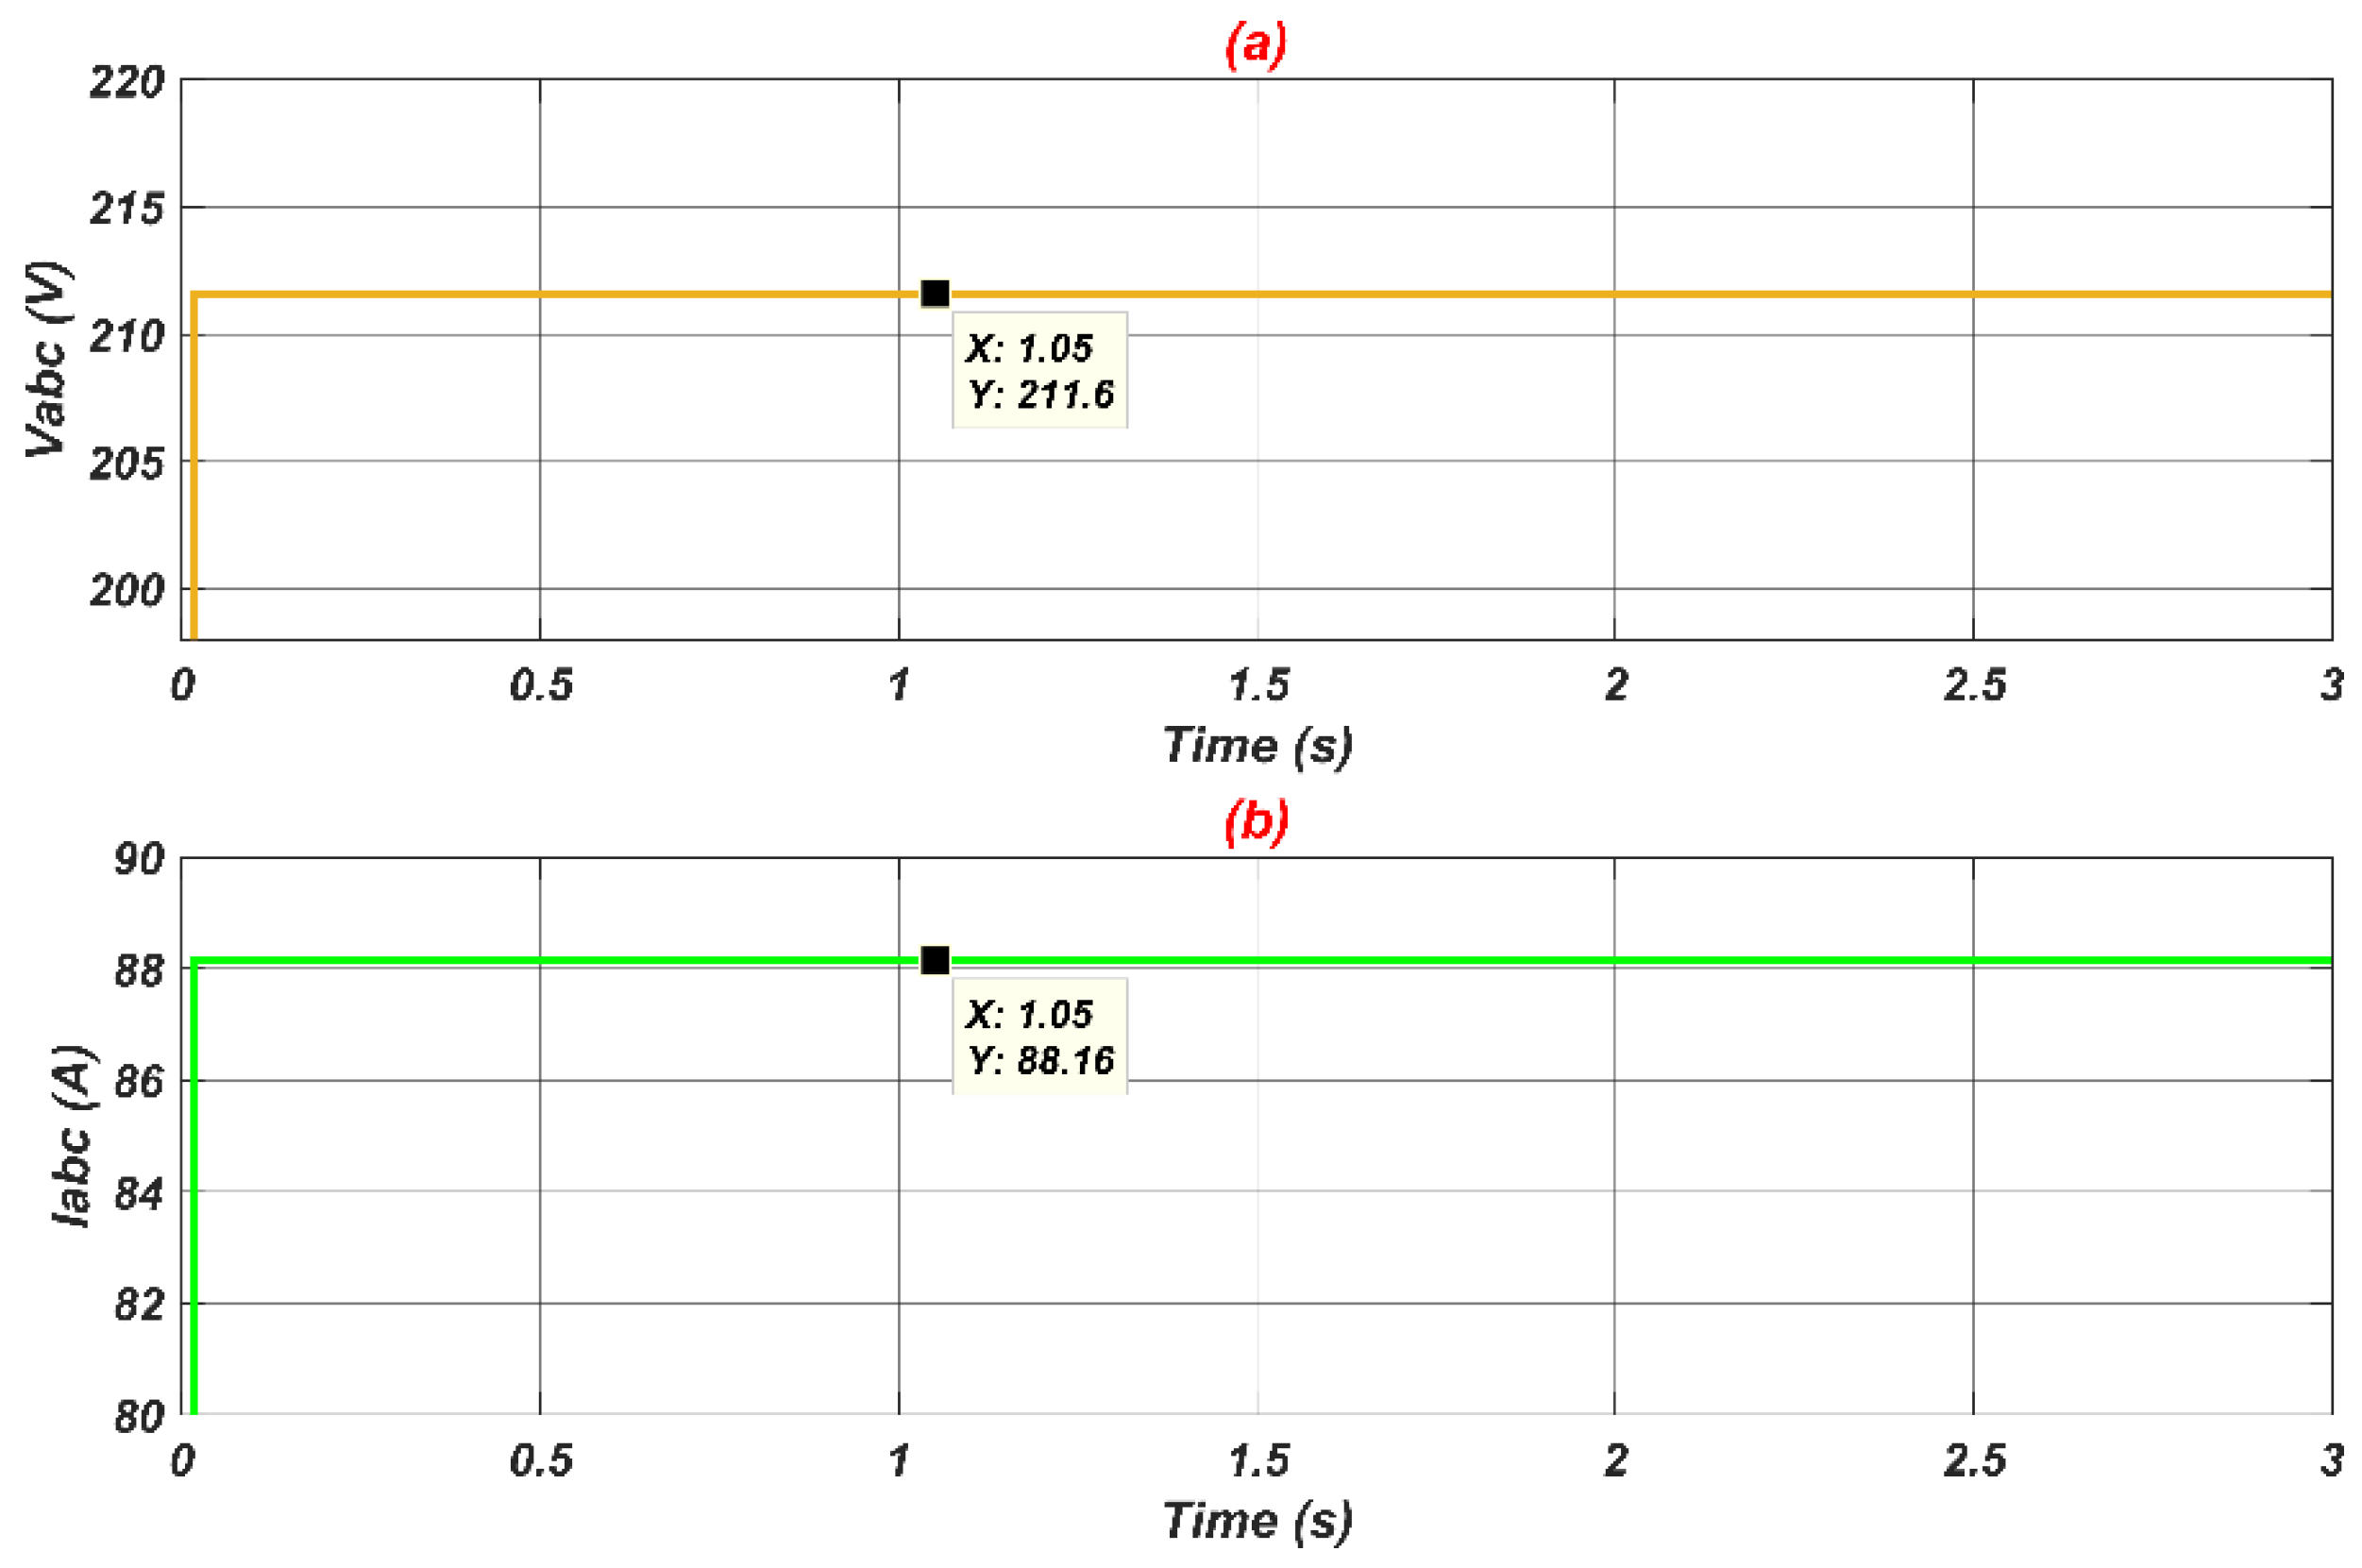
The Figure 7 shows the behavior of the three-phase voltages and currents at the PCC B_12, in relation to phase-ground. Notice that the secondary transformer voltage levels are 211.6 V RMS, which are below nominal voltage 220 V. This occurs due to the substation voltage, which is also below nominal, around 13.63 kV, and such a condition reflects throughout the system.
Figure 8a shows the RMS values corresponding to the voltages and Figure 8b shows the values for the currents. Since the voltages are still higher than 0.9 p.u. of the nominal voltage (Vnom = 220 V), the inverter must remain connected without the injection of any reactive power. In addition, the active power must remain in full generation according to the climatic conditions.
After checking and validating the conditions of the implemented grid without the GCPVS, from now on, one GCPVS (75 kW) was inserted in the simulation with the proposed control. It was inserted at a strategic point that guarantees an irradiance of 1 kW/m² and, consequently, a generation of 75 kW. It is worth mentioning that the chosen location presents a possibility for the expansion of the photovoltaic system, since in this location, there is a municipal school and a public area destined to the free market. Such place is located in parallel to the RLC_12 load, both connected to the PCC B_12 bus, and this is connected to the transformer secondary T_12. In this PCC, the low voltage level corresponds to 380/220 V, where it will be possible to check the instantaneous current, voltage and power values, for the next tests.
A short-circuit was also inserted between the B_15 bus and to the primary transformer T_16. This will be responsible for the faults or voltage sag in the distribution grid. For this first situation, a phase-to-ground short-circuit in phase B was inserted at this location. At the moment of the short-circuit, voltage sag into the grid will be 0.4 s duration, i.e., more than 20 cycles, as determined by ANEEL, in module 8 of PRODIST [29].
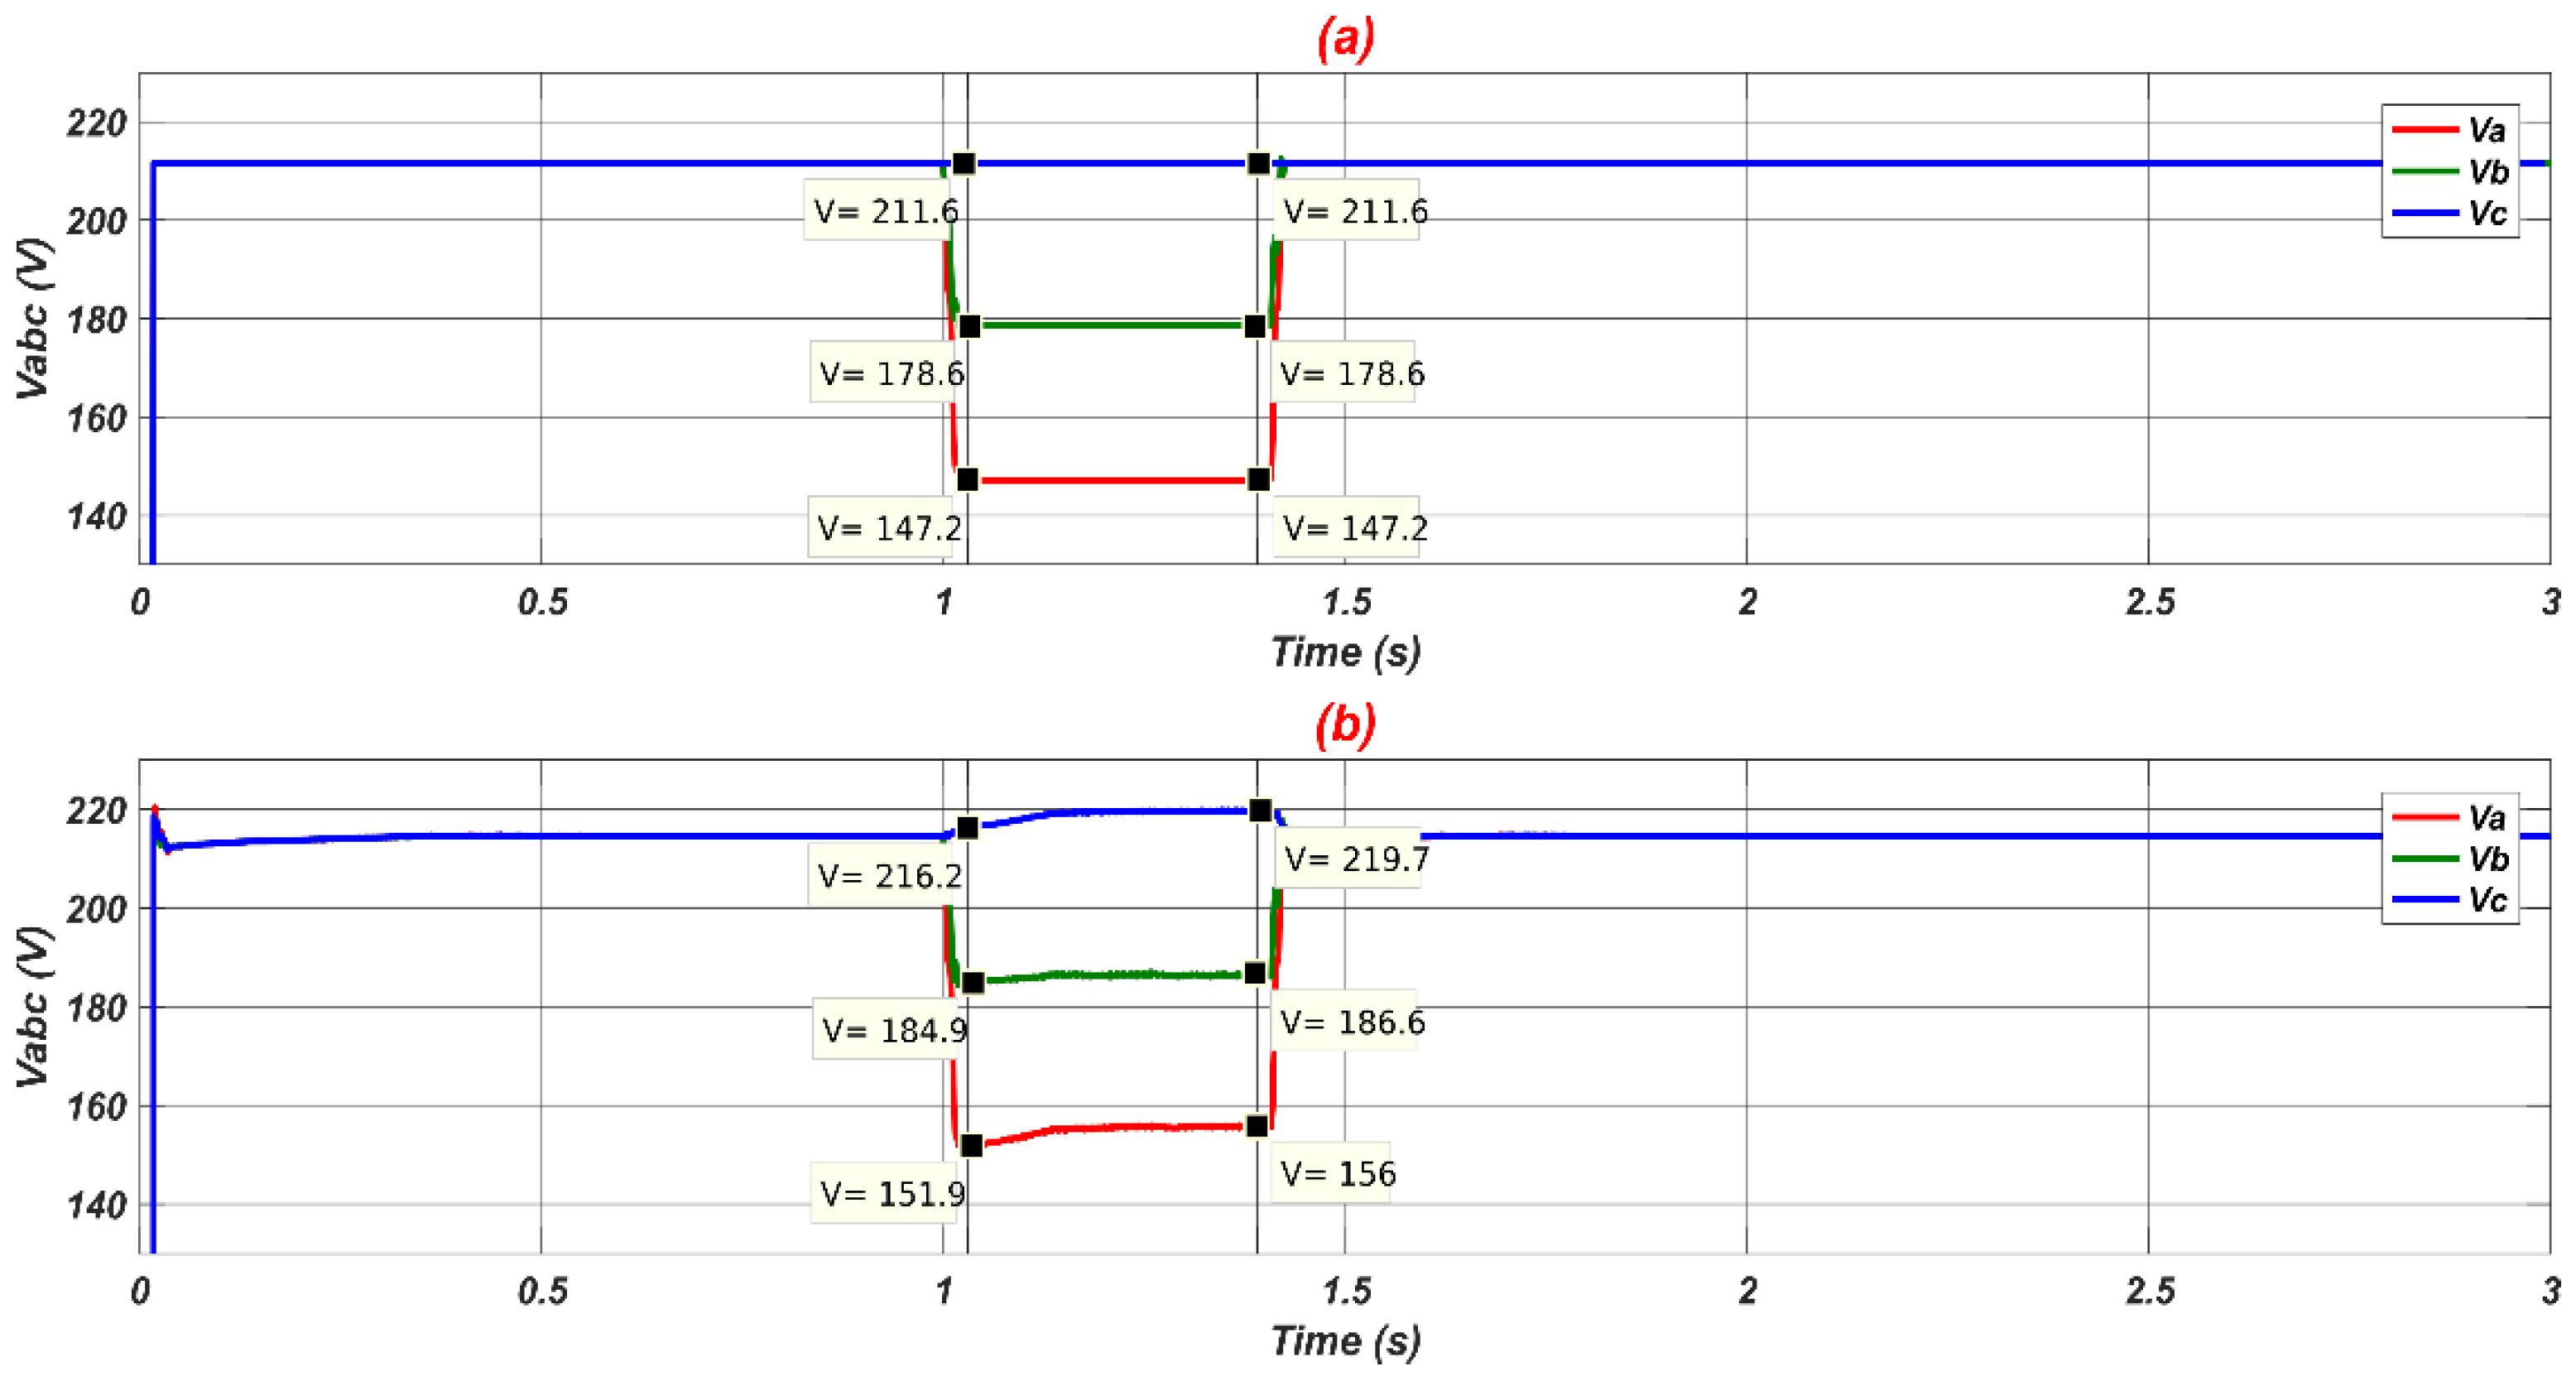
Figure 9a shows the voltages in bus B_12 when there is short-circuit without DG. The fault occurs in the instant of 1 to 1.4 s, with the parameterization of fault resistance (component that causes the short in Simulink) in Ron of 0.001 Ω and ground resistance Rg of 0.001 Ω. This way, it becomes possible to verify that the voltage of phase A drops 33 % of Vnom passing to 147.2 V, while phase B decreases to 178.6 V and, finally, phase C remains at 211.6 V.
With the insertion of the DG combined with the action of the proposed control, Figure 9b shows an improvement in voltage levels, thus, the Va voltage resulted in 156 V, Vb in 186.6 V, and Vc in 219.7 V.
Therefore, taking into account the existence of the load connected to the PCC and that the 75 kW GCPVS (considered to be a microgenerator by ANEEL [34]), the results are quite promising, as expected.
It is worth noting that short-circuit is in phase B, but phase A is the one which suffered the greatest voltage sag at the time of the fault for the situations presented. This happens due to the connections of the transformer, where the primary is in Delta (D1) and the secondary is in grounded star (Yg). There is an inversion in the phases as presented by IEC 60076-1 [35].
Figure 10 shows the three phase voltage waveforms PCC B_12 and points the peak values. The period from 0.8 to 1.6 s was used for a better visualization of the short-circuit effect. Figure 10a is without GCPVS operation and Figure 10b is with GCPVS operation. The GCPVS acts to improve the voltage amplitudes, which can be confirmed by the RMS voltage values in Figure 9.
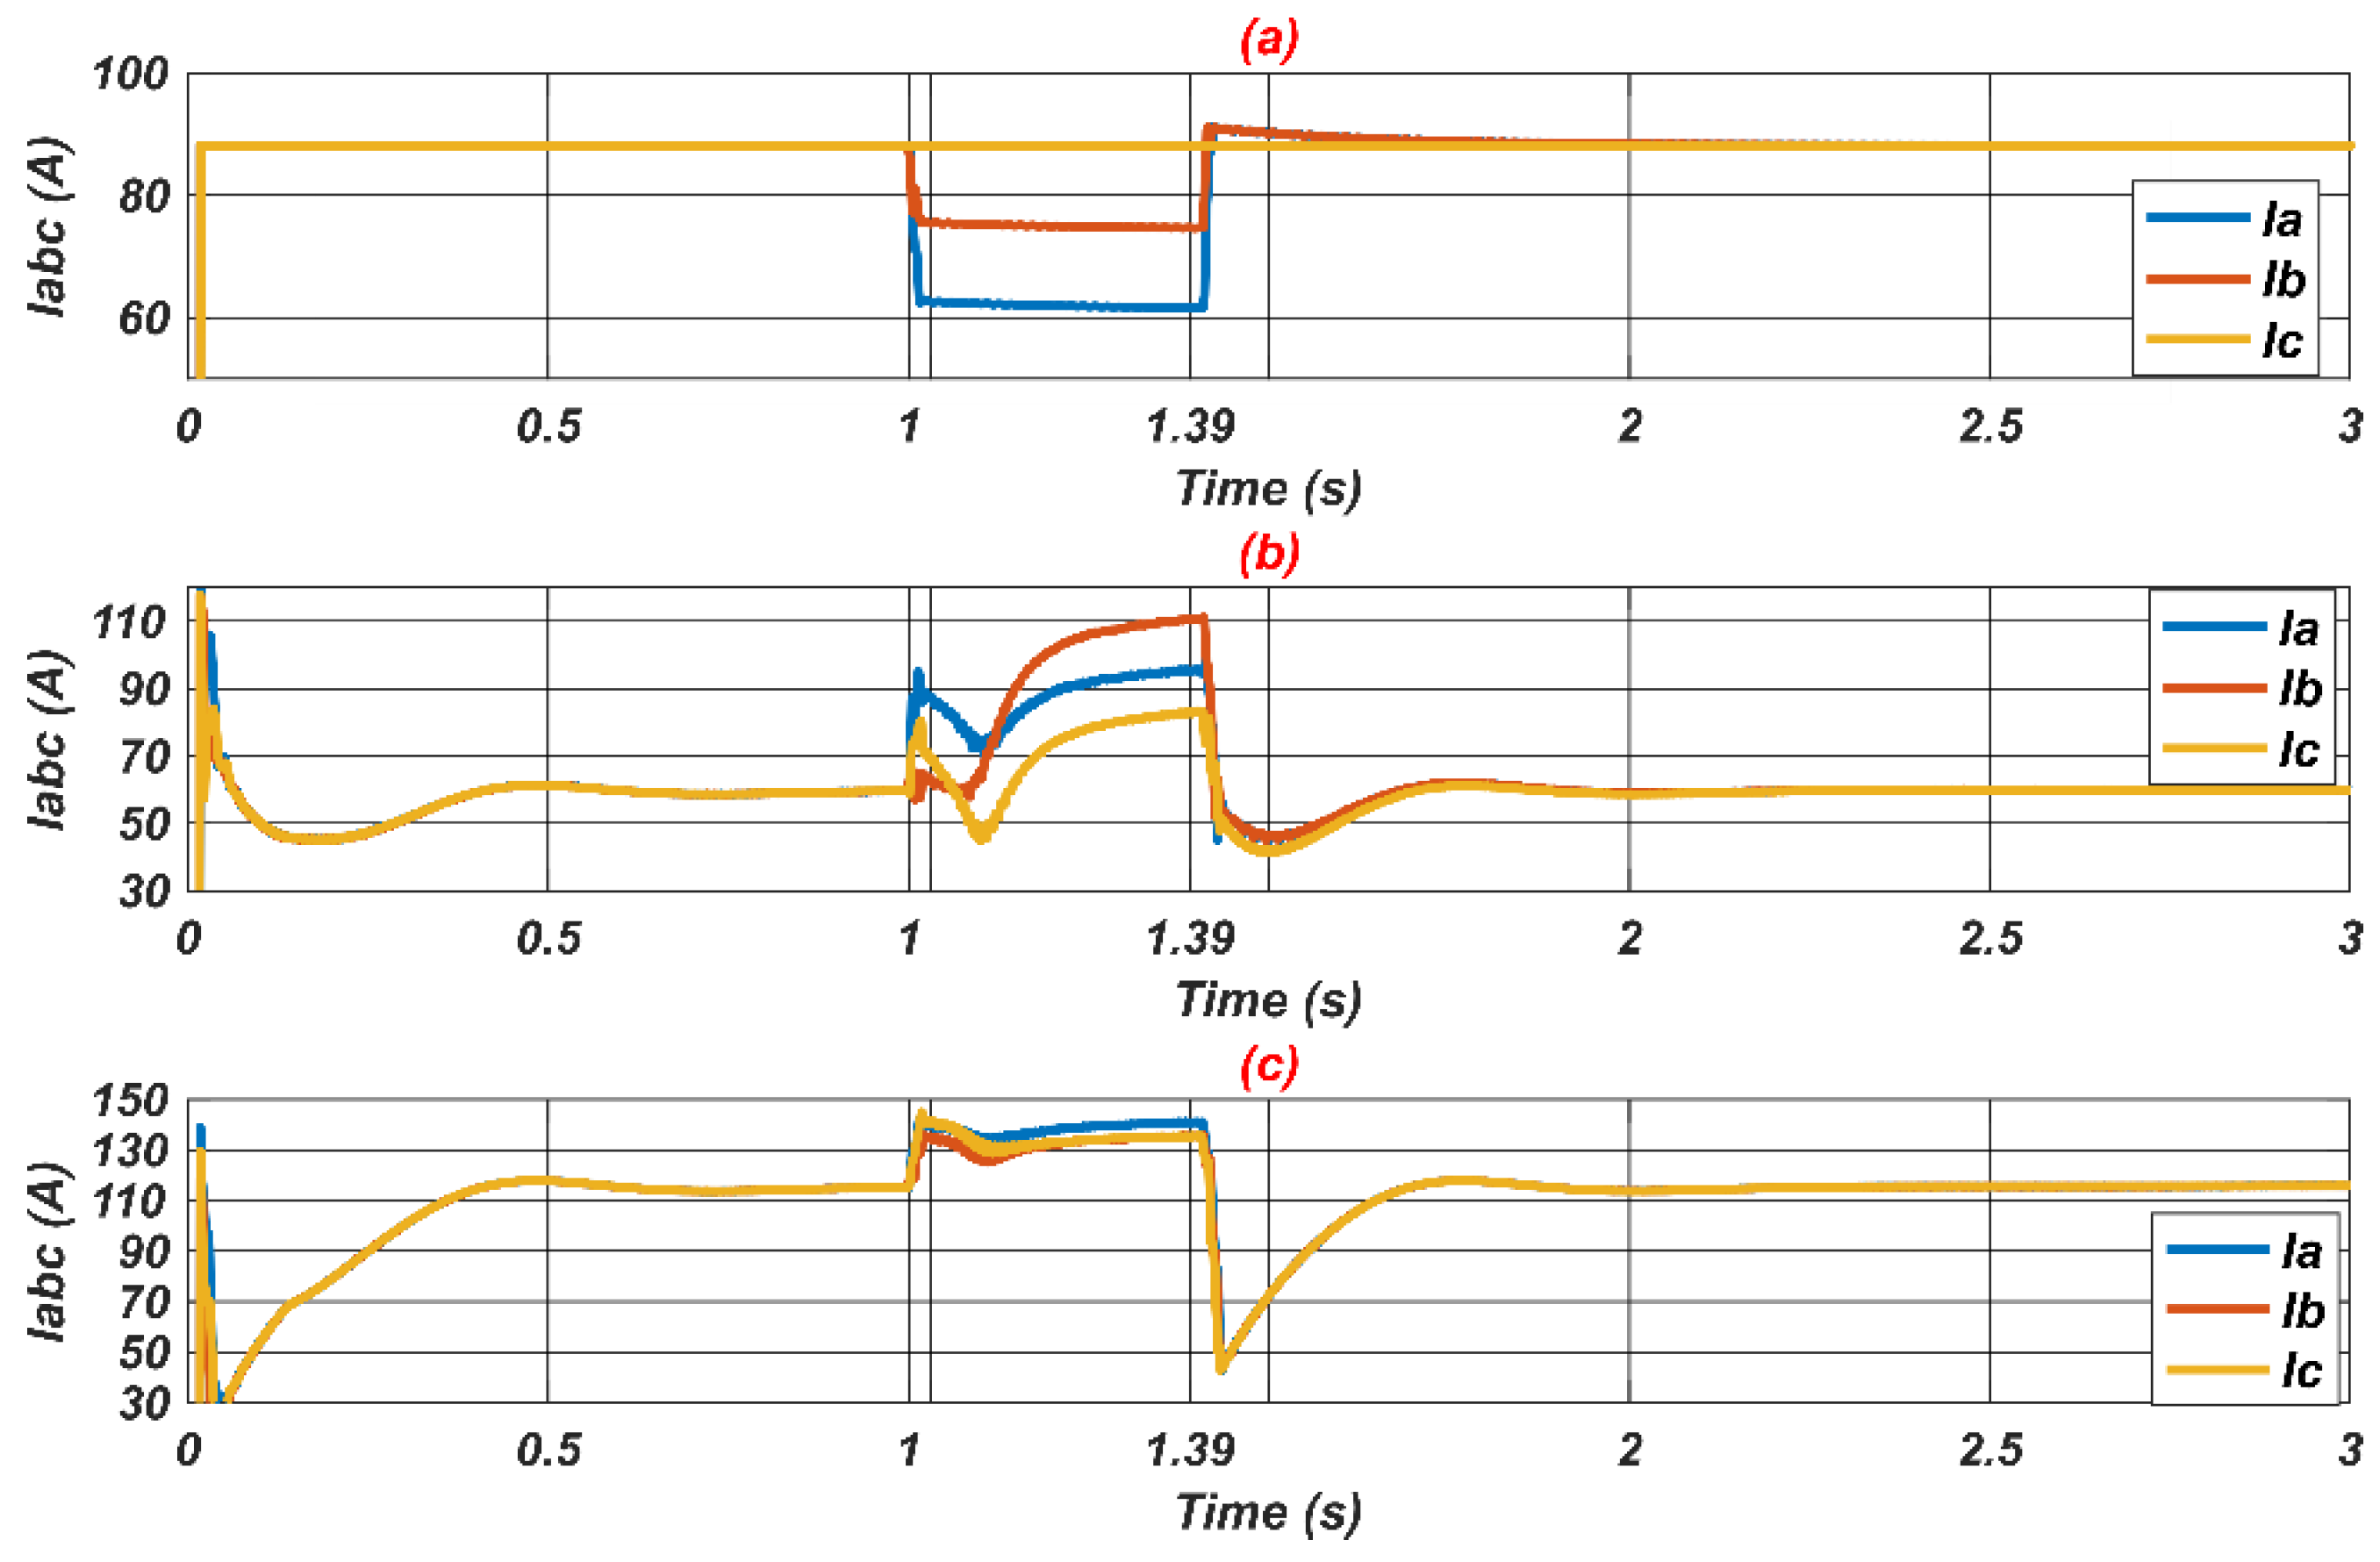
Figure 11 shows the behavior of the currents in B_12 and GCPVS with the fault situation. Table 5 was set up from Figure 11 in order to make possible the visualization of the current levels of the phases for two instants: at time 1.39 s, at the end of the short-circuit period, and at time 2.5 s, after returning to steady state. Figure 11a shows the condition without GCPVS on B_12, while Figure 11b shows the condition with GCPVS on B_12, and finally Figure 11c shows the currents at the GCPVS output, according to the power available from the photovoltaic modules. It is important to remember that the load consumes powers according to Table 3.
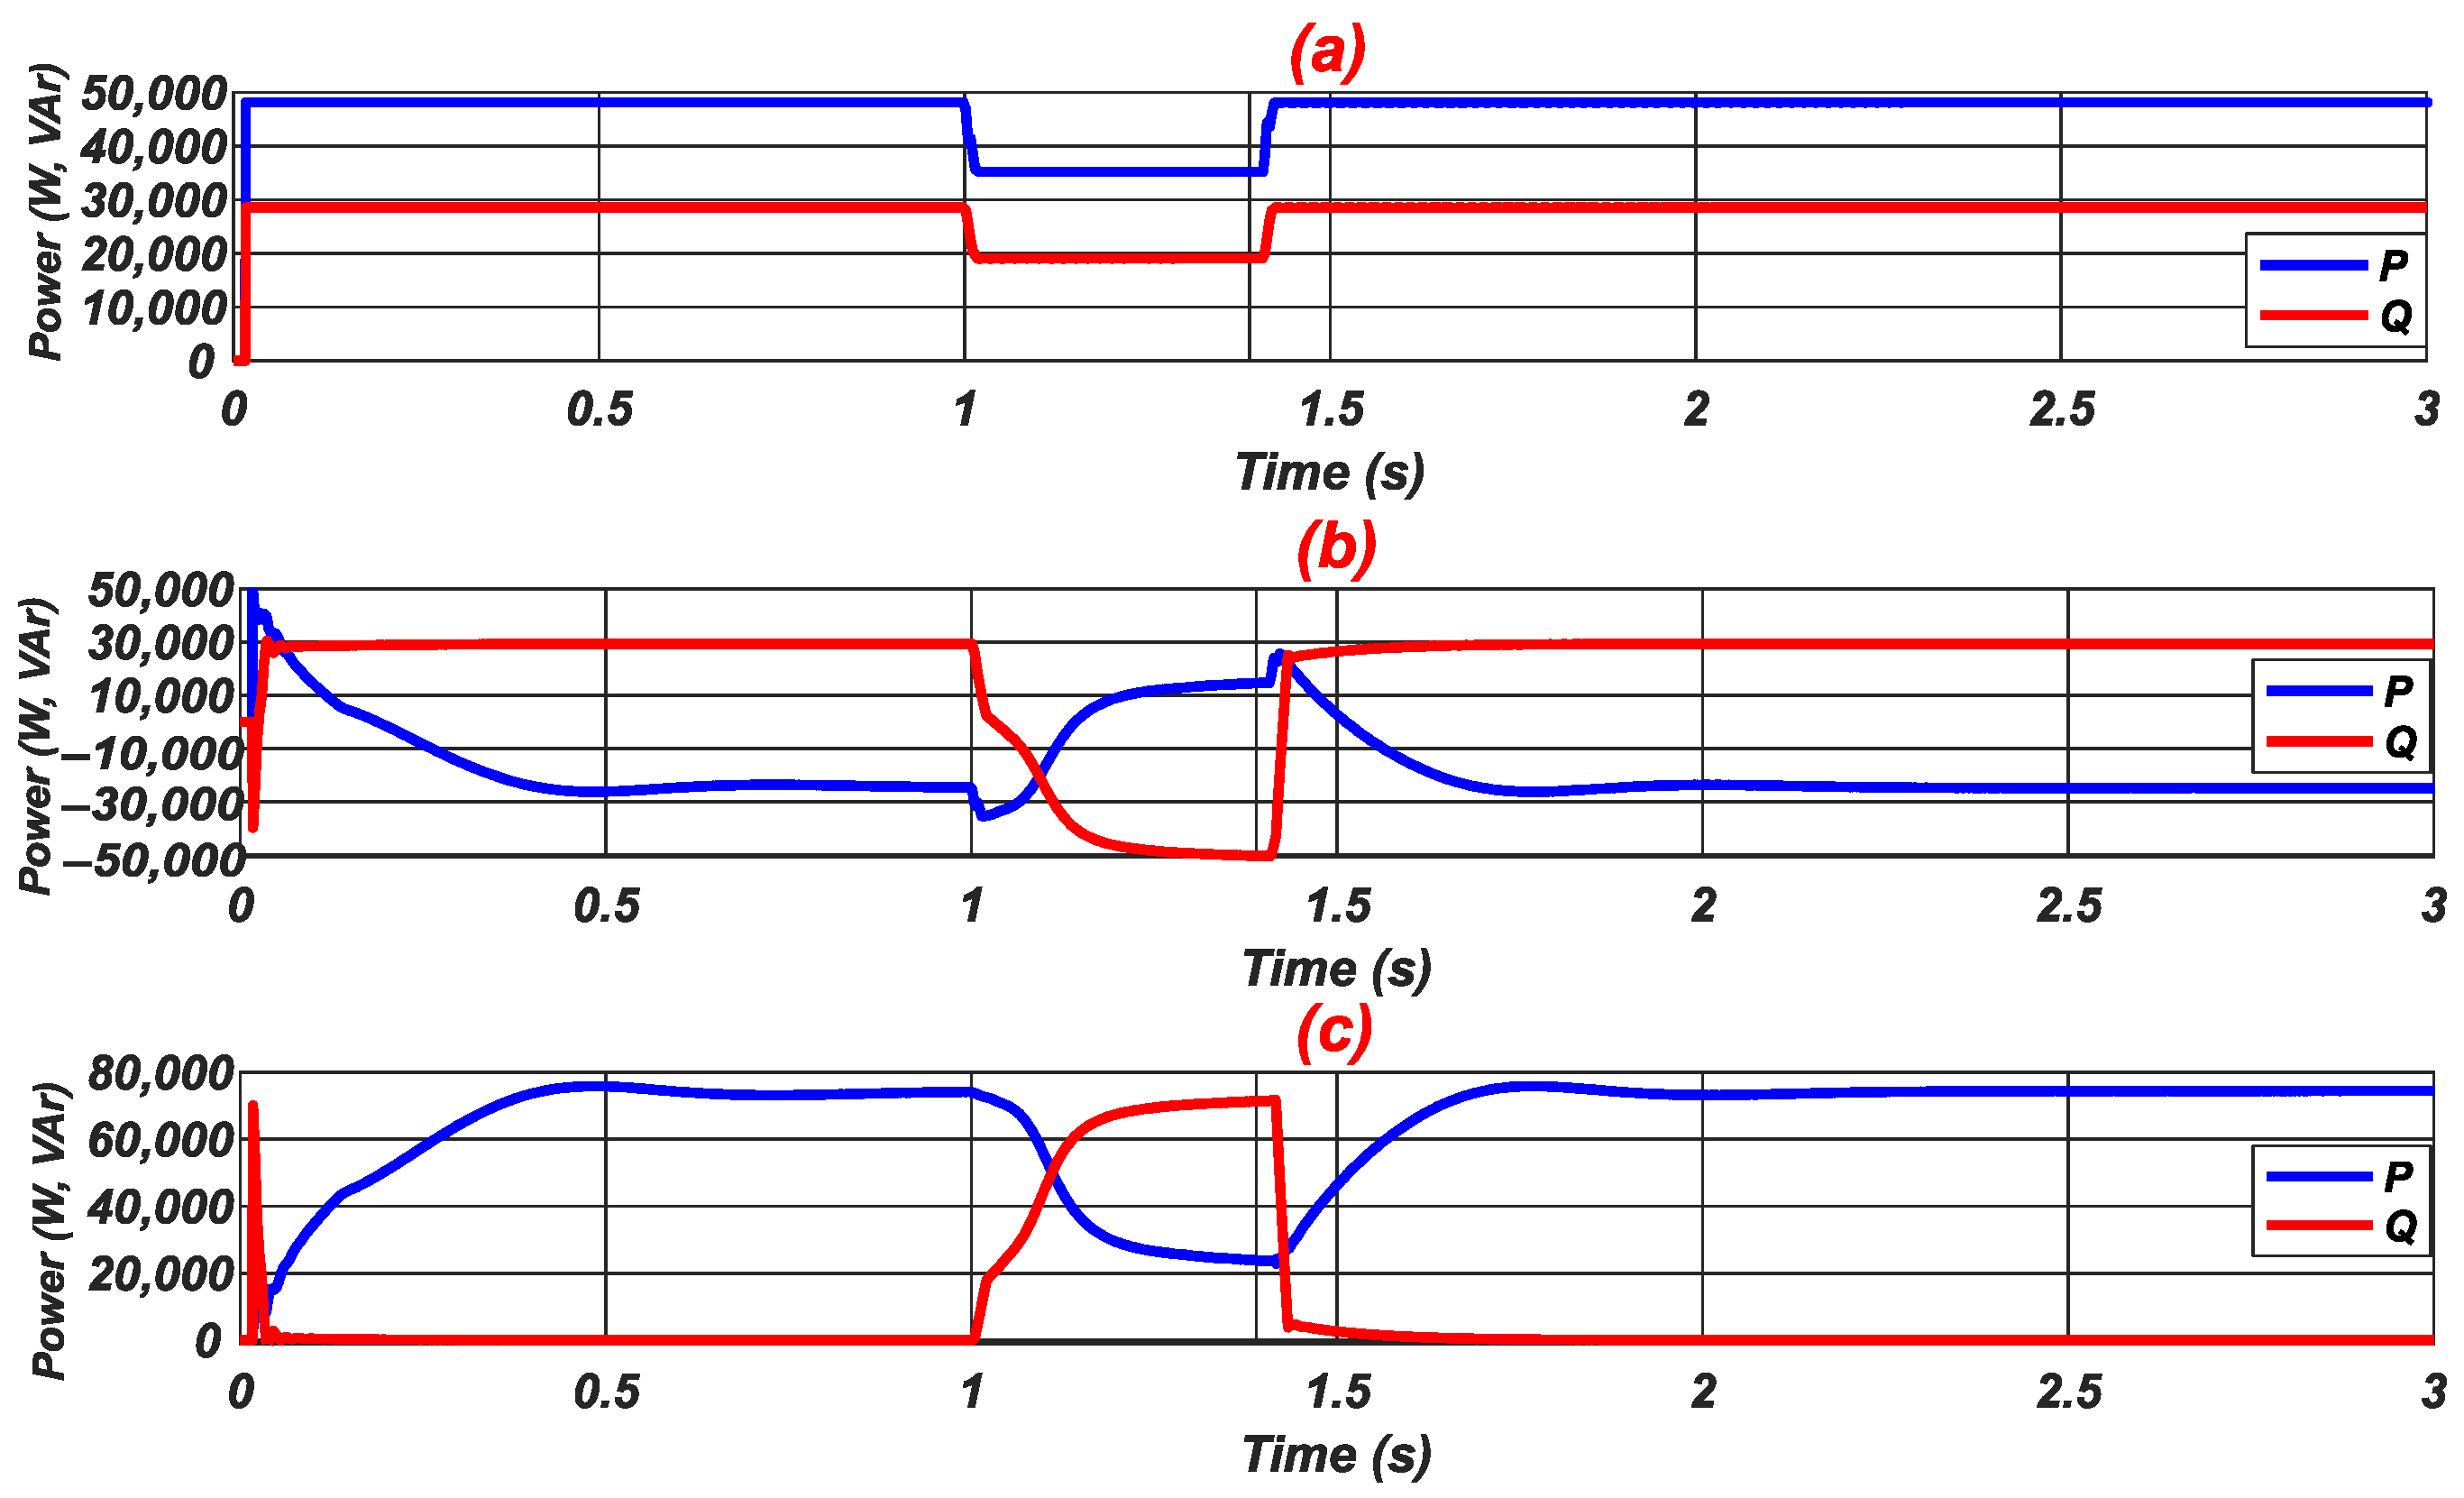
In sequence, Figure 12 shows the behavior of the active and reactive power on B_12 and on the inverter output. Figure 12a shows the grid behavior without GCPVS and that the RLC_12 load absorbs from into the grid, 48.15591 kW of active power and 28.57404 kVAr of reactive power. In Figure 12b the behavior on B_12 is shown with the insertion of the GCPVS, which becomes responsible to supply all the active power required by the load, with the remaining power injected into the distribution grid. The powers reading in Figure 12b configure this action, since its negative signs proves the injection into the grid. When the fault occurs, Figure 12c indicates that the active power decreases to allow the injection of the reactive power to contribute to sustaining the voltage in the PCC. It is possible to observe this performance of the GCPVS, with the proposed control, in Figure 9b and Figure 10b and Figure 11b,c, as previously analyzed. Also in Figure 12c, it is possible to see that approximately 75.6 kW of active power supplied by GCPVS decreases to around 23.85 kW after the fault (69 % drop). Further, in the same figure, the reactive power increases from 0 to 71.35 kVAr, thus helping to raise the voltage level of into the grid and the load. When calculating the apparent power, which corresponded to 75.23 kVA, it is capable of confirming that the rated power of the GCPVS was not exceeded.
Figure 13 shows the behavior of the RMS phase voltages in per unit (p.u.). It is important to mention that all per-unit values will be from now on corresponding to rated RMS phase voltage of 220 volts. Thus, when making a parallel with what was observed in Figure 9, the voltages are at 211.6 V (0.962 p.u.) and still far from 198 V (0.9 p.u., referring to Table 1). In this sense, the proposed control does not act until 1 s. When short-circuit appears, the voltage decreases to 0.81 p.u., below the limit 0.9 p.u. This situation causes the control to enforce a reduction in its output that will multiply the reference power (Pref), as explained in Section 3. This, in turn, will decrease the active power injected by the inverter to manage reactive power and thus contribute to increase the voltage level during the fault. After the fault disappears at time 1.4 s, the GCPVS returns to its normal condition. Figure 9, Figure 10, Figure 11 and Figure 12 also reveal such GCPVS behavior.
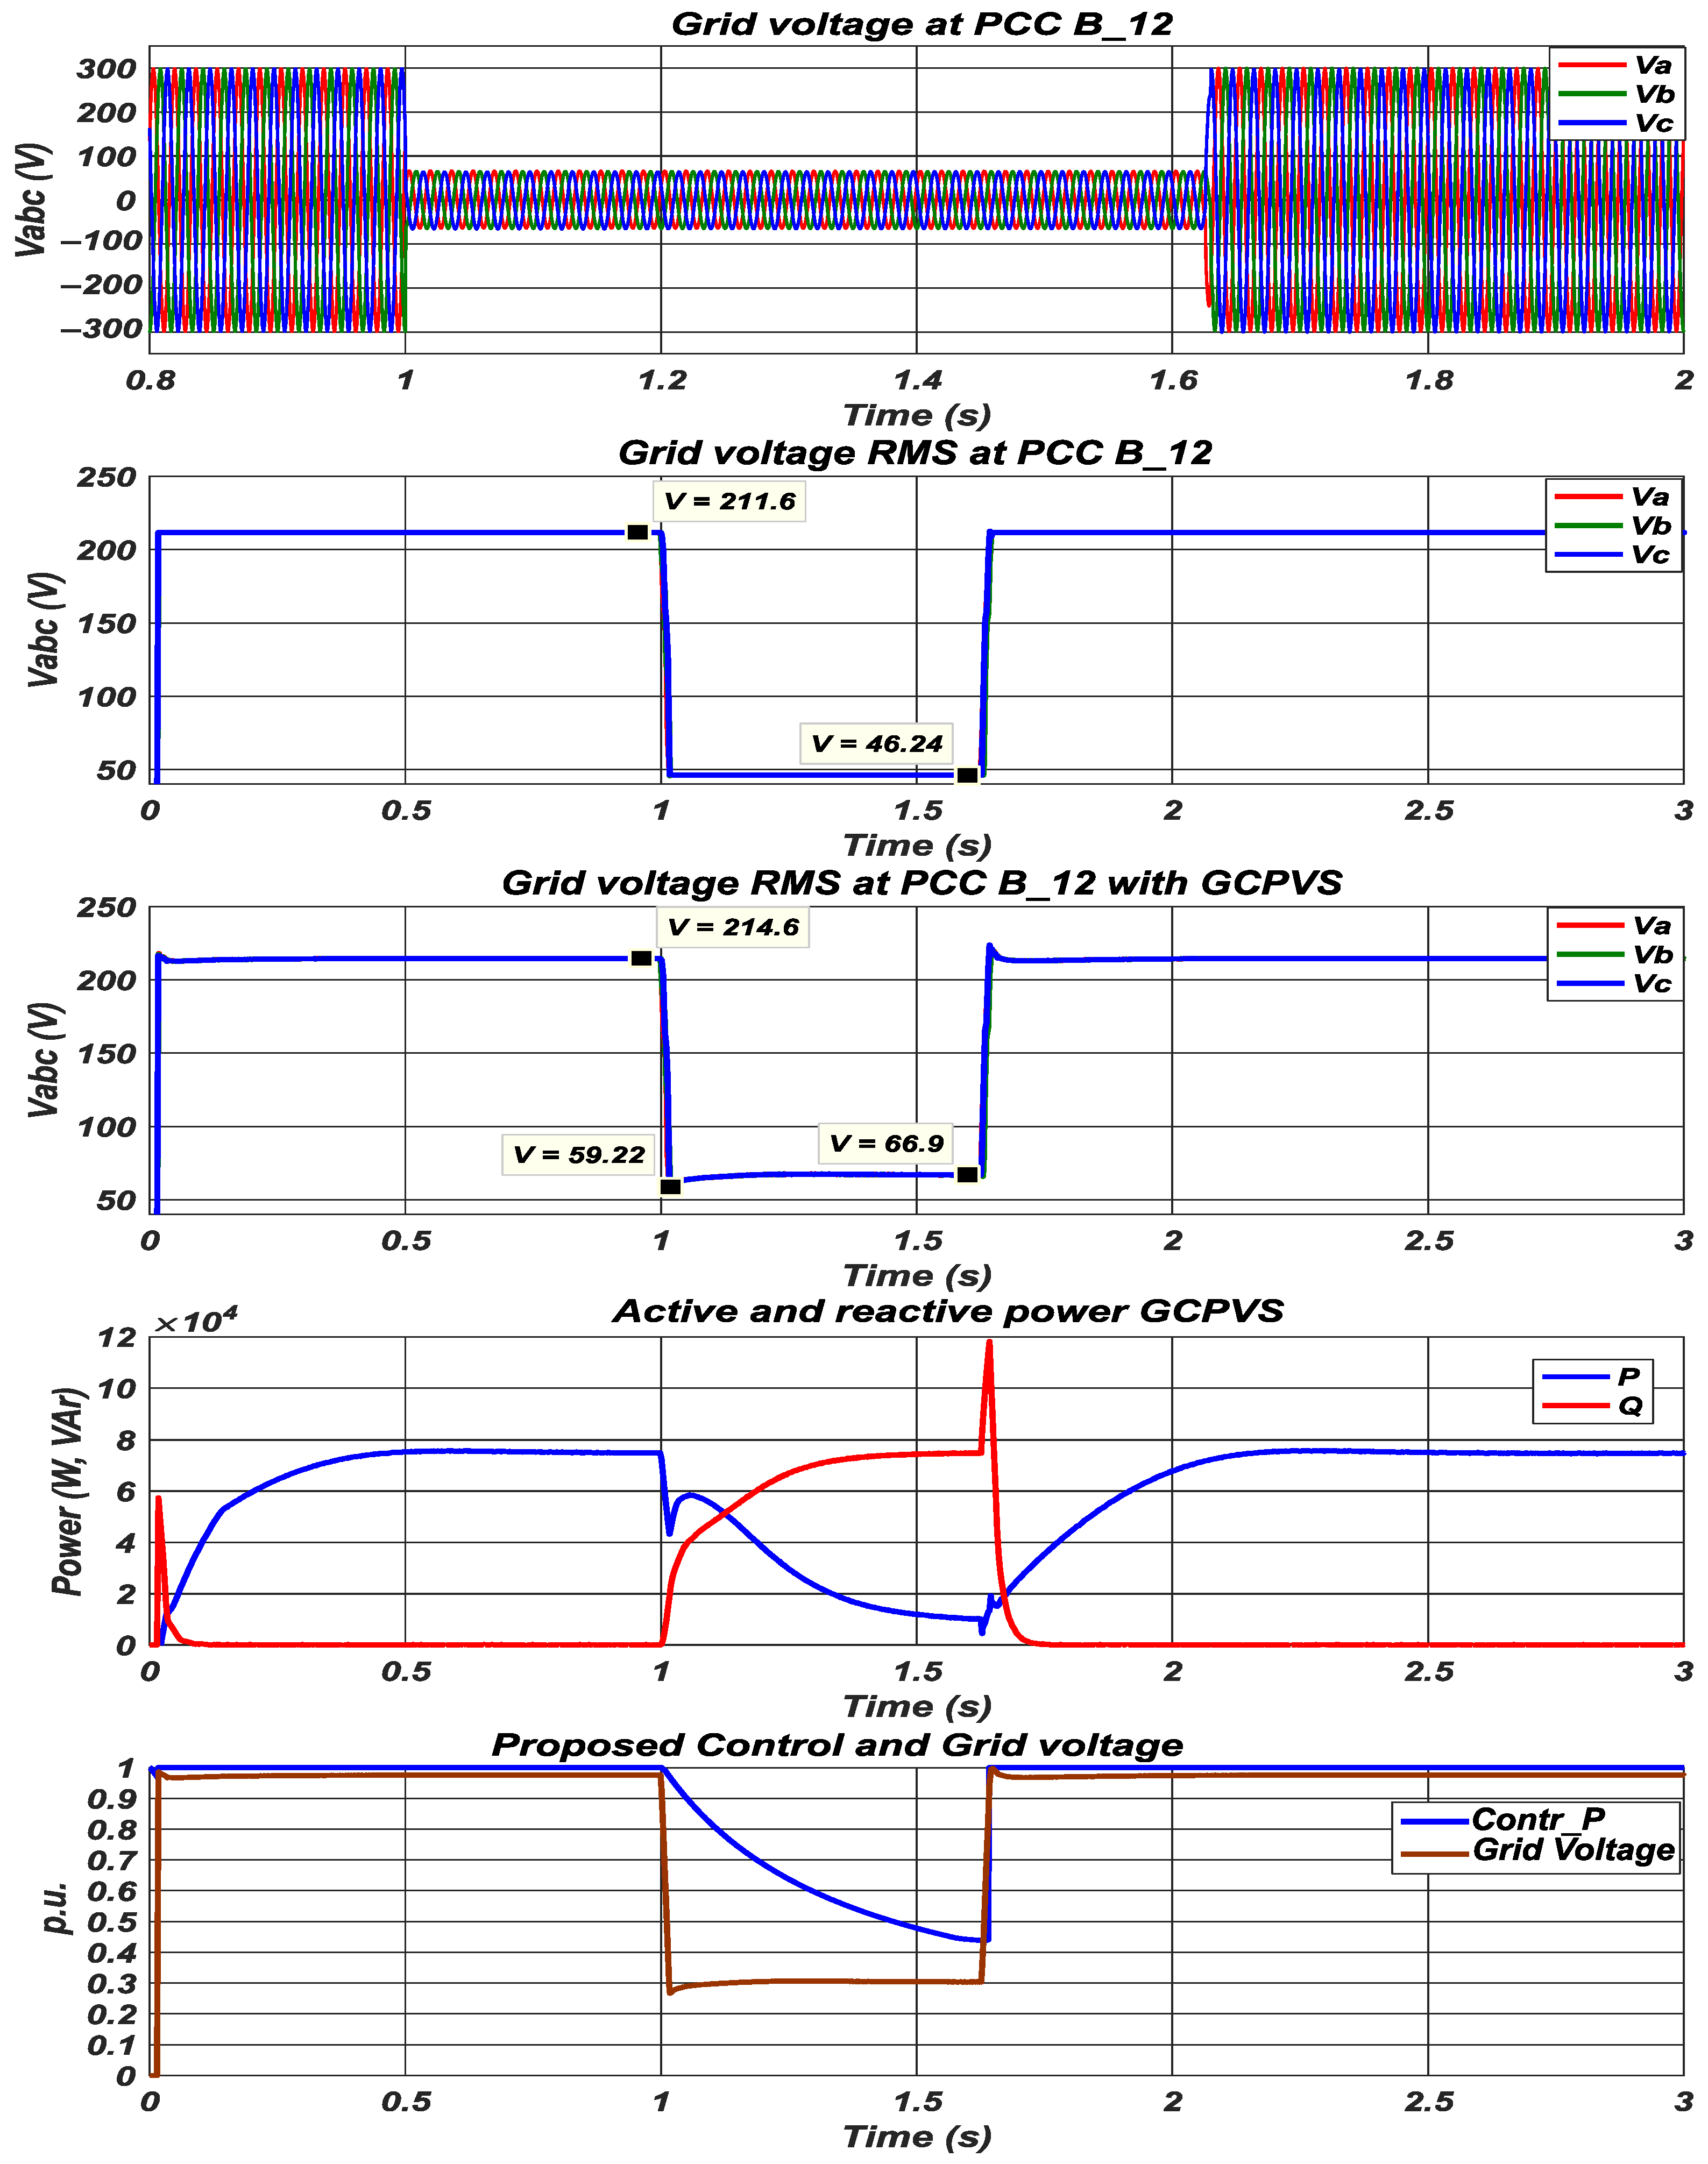
On the sequence, Figure 14, Figure 15, Figure 16 and Figure 17 show the other test results of the proposed control for different voltage sag (or fault) scenarios and different durations. In each figure, there are five graphics to show the behavior of voltages, powers, and the control, which are placed in the same order as the previously analyzed case, Figure 9, Figure 10b, Figure 12c and Figure 13.
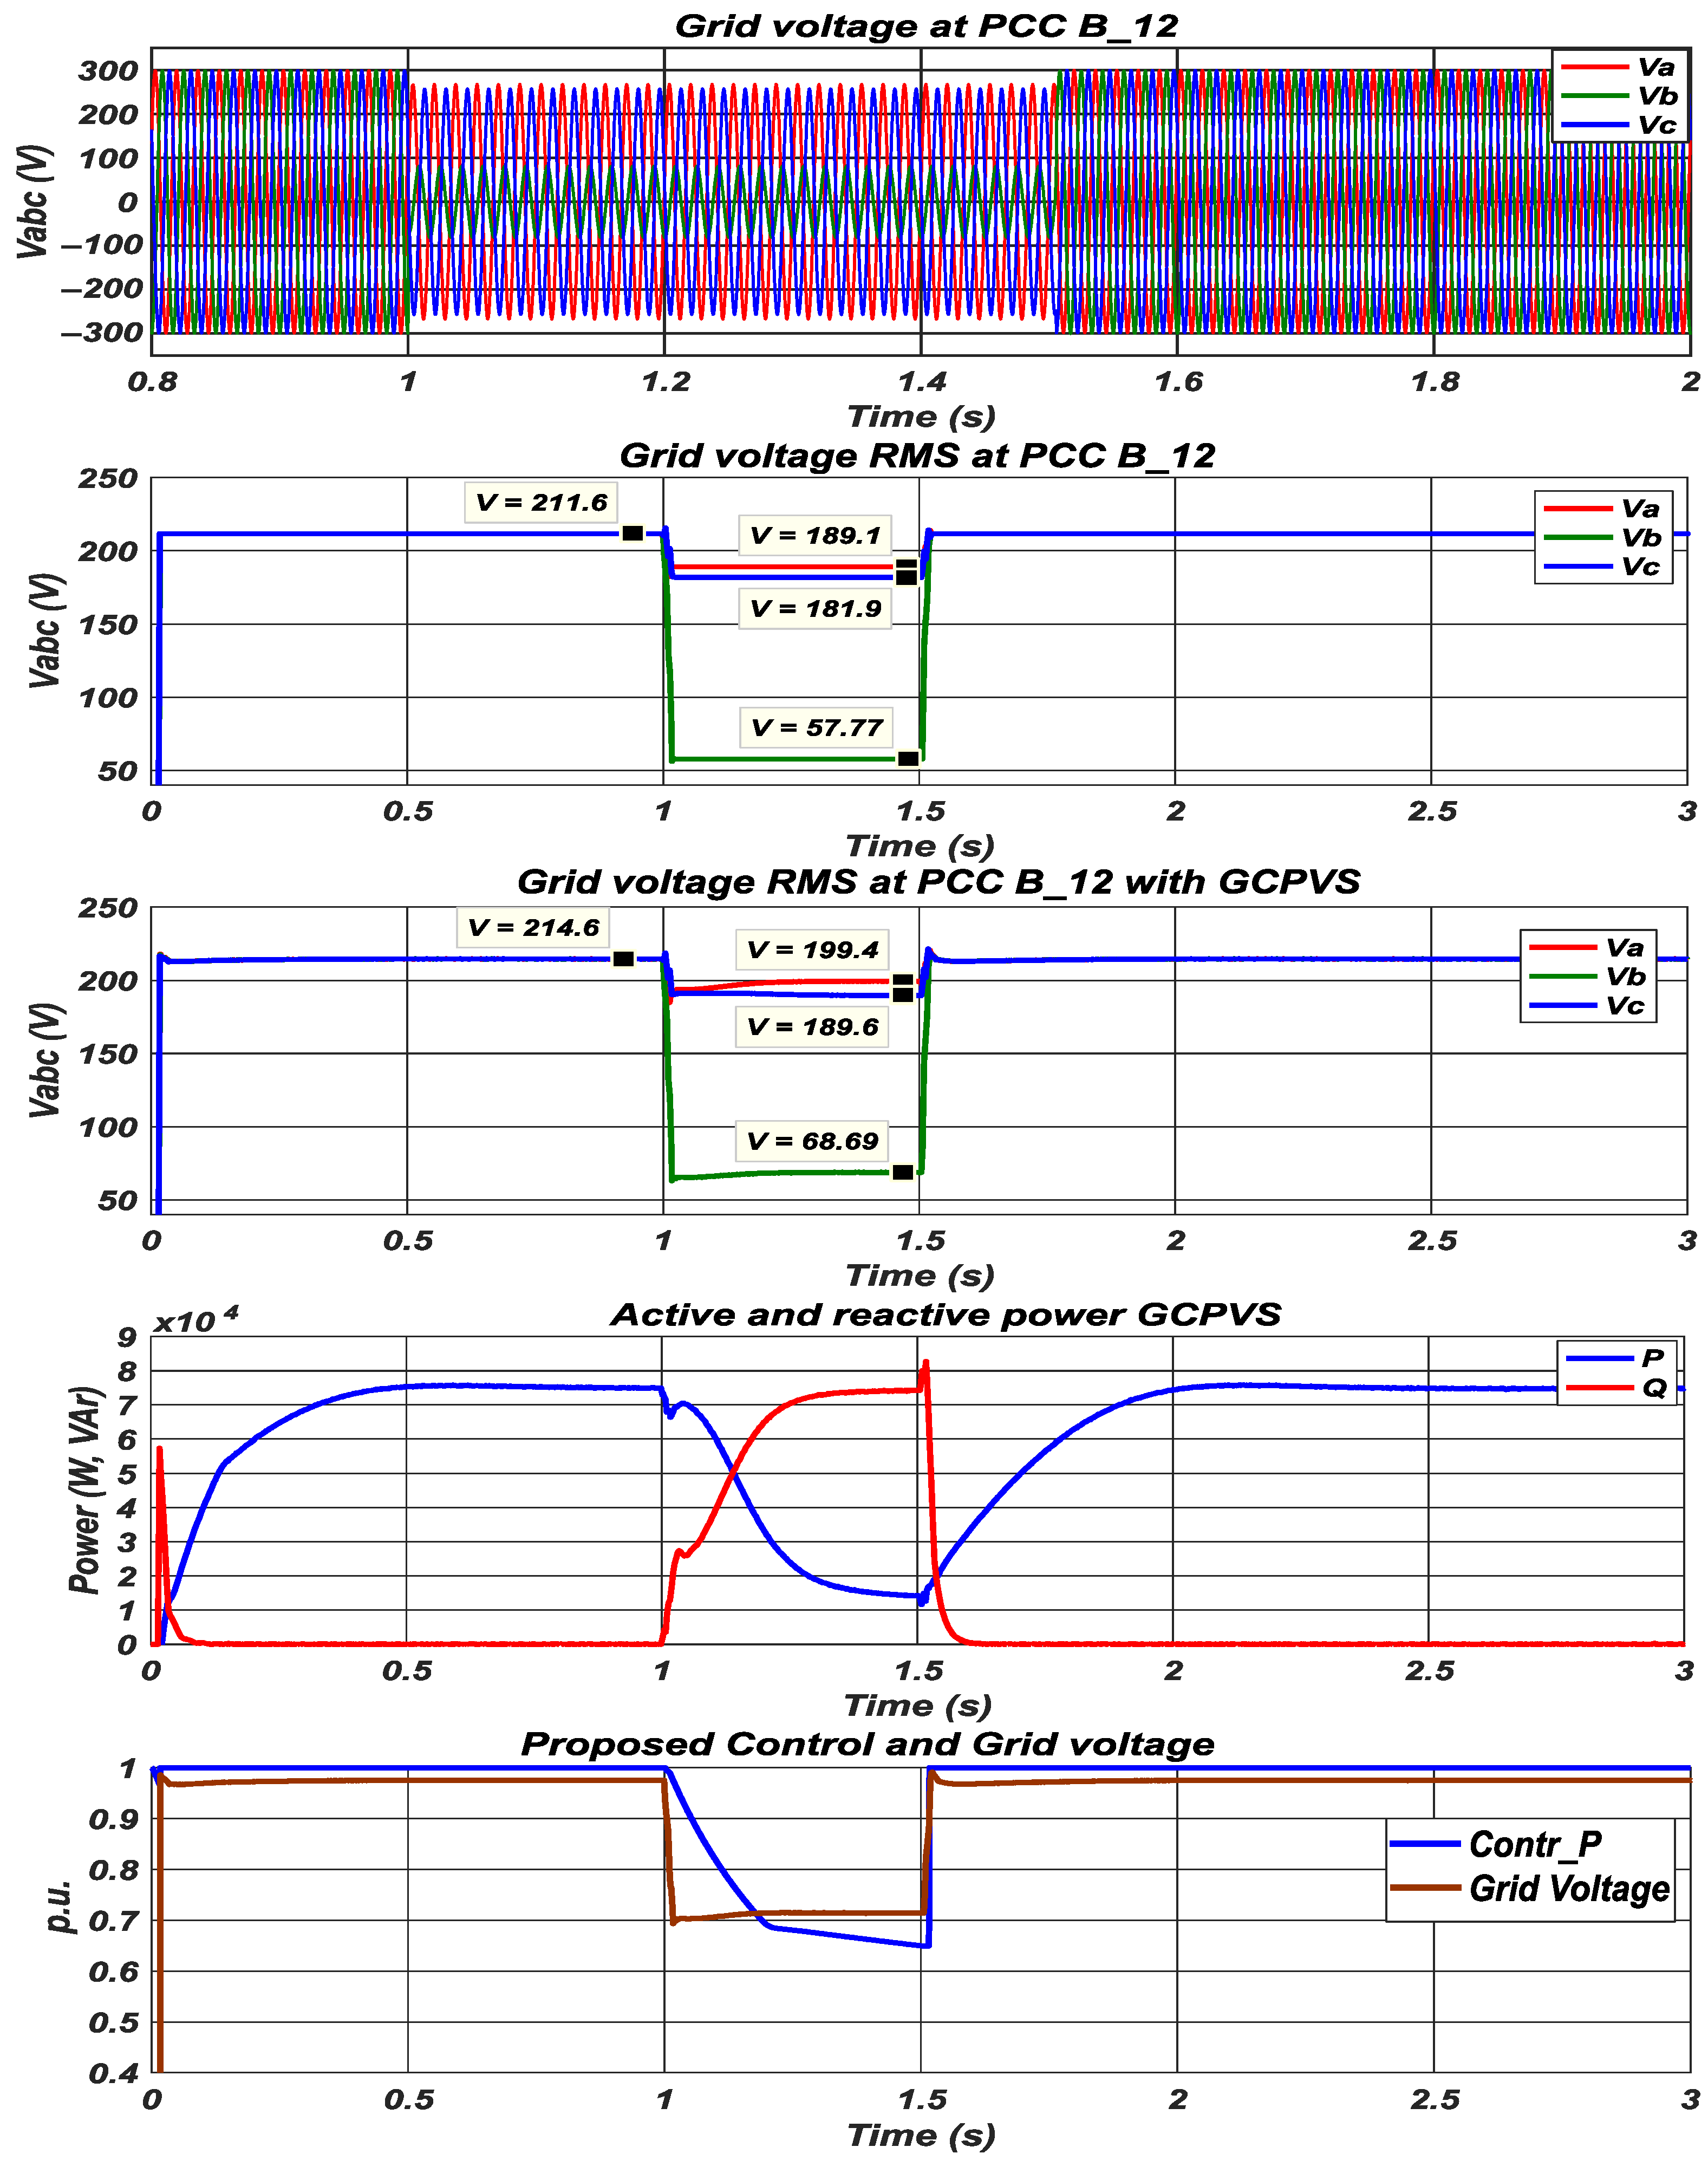
In Figure 14, the disturbance into the grid is caused by a phase-to-phase short-circuit between B_15 and T_16, with duration of 500 ms. Analyzing for the same locations previously proposed. This fault reduces the voltages in the PCC to 189 V in phase A and 181 V in phase C, while for phase B, it reduced to 57 V. For this situation, RMS voltage into the grid had an average drop of 34 % of the rated voltage. Therefore, during the fault period (1–1.5 s), the GCPVS should provide to the grid adequate amounts of reactive and active power during the whole interval to help the voltage recovery. Once the voltage sag is eliminated, all variables return to the pre-fault values.
It is worth remembering that from Figure 9, Figure 10, Figure 11, Figure 12, Figure 13, Figure 14, Figure 15, Figure 16 and Figure 17, the conditions on power grid in the periods of fault are stable. In this way, the GCPVS can withstand the fault and inject the necessary amounts of active and reactive power, even for a prolonged period, without the action of anti-islanding protection.
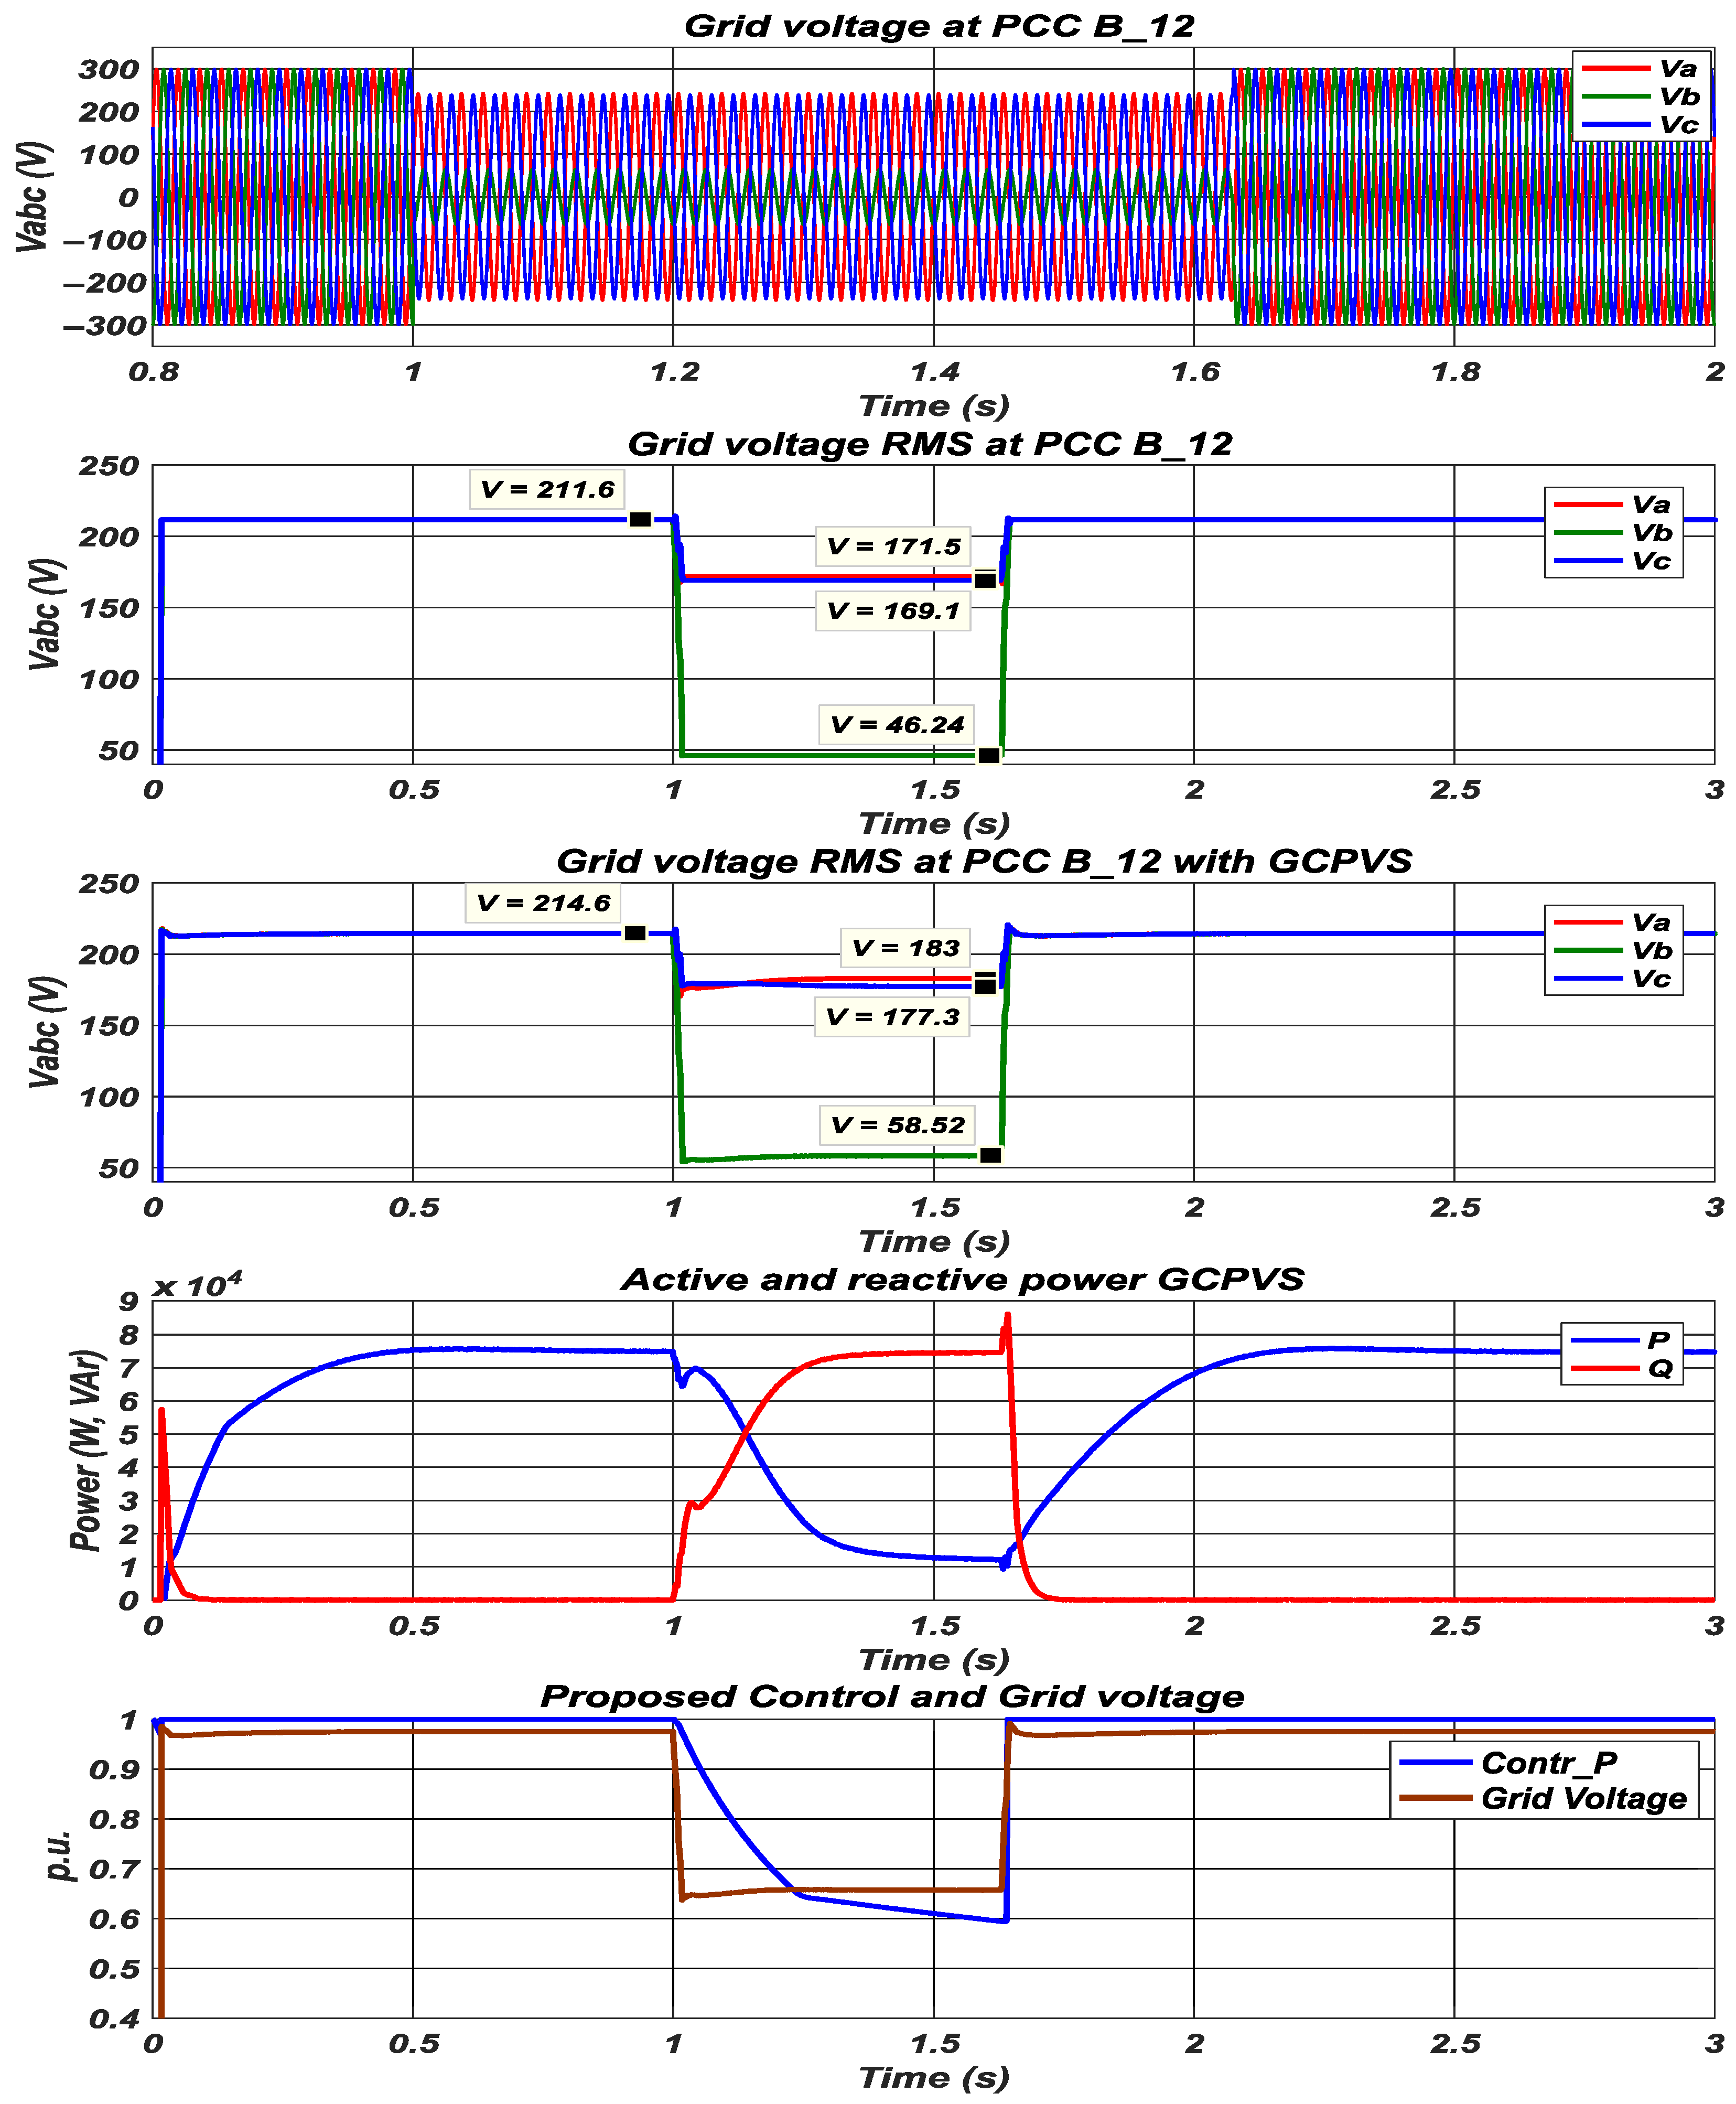
Figure 15 shows the response of the proposed control. When an asymmetric two-phase-to-ground fault occurs, phase A voltage drops to 171.5 V, phase B to 169.1 V, and phase C to 46.24 V during the fault period of 625 ms (duration used by the references [1,9,18,36]).
It is possible to verify for such an event that the insertion of the proposed control reduces the voltage sag. Therefore, it reflects in the increase of the voltage levels in more than 6.7 % for phase A, 26.5 % for phase B, and 4.8 % for phase C. The active power decreases to about 15 kW and the reactive power increases to 72 kVAr. Finally, the average value of into the grid voltage increases from 0.58 p.u. without GCPVS to more than 0.63 p.u. with GCPVS at the time of the fault.
In the sequence, Figure 16 and Figure 17 describe a symmetrical three-phase-to-ground short-circuit, which is the most severe case of voltage sag. Two situations will be presented, the first (Figure 16) with the GCPVS equipped with the proposed control, while for the second (Figure 17), there is a situation with the GCPVS without the proposed control action. In this case, likewise presented by the references [1,18] the inverter will provide the maximum reactive power capacity into the grid just after it notices the fault. For these two situations, the average value of voltage into the grid falls to 0.21 p.u. of the rated voltage.
It is possible to notice that there are advantages and disadvantages in these two situations. In the first situation, Figure 16, with the control acting, the voltage level into the grid will remain a little higher than the second situation, since there is a portion of active power injection together with reactive. In this way, the control identifies the best point the powers, for the purpose of reducing the effects of voltage sags. In the second situation, Figure 17, without actioning the proposed control, the voltage level is lower. Consequently, there is no possibility to improve it, since the control injects only reactive power.
Thus, it is safe to say that the proposed control contributes to mitigate the effects of SDVV/MVD. This happens due to the fact that when injecting active and reactive power into different types of faults, the voltages increase to close to the ideal, while in the other works with only reactive power injection the voltage level is lower than the values investigated by this research. It can be seen that the results of the power graphs require 0.5 s to enter the steady state.
It is worth remembering that this 75 kW GCPVS is considered by ANEEL to be a microgenerator [34]. Therefore, if there were several of DG spread throughout the distribution grid, there would certainly be a more adequate support to the voltage levels during SDVV/MVD.
In order to explore the results in a quantitative way, Table 6 shows the results of the short duration voltage variation for each case investigated.

6. Conclusions

This paper proposes a control strategy for a grid-connected photovoltaic system focused on mitigatating the effects of short-duration voltage variation (SDVV), specifically the momentary voltage dip (MVD). For this purpose, the control operates in conjunction with the automatic voltage regulator in its modified version to ensure a good correlation between the PV inverter operating limit capacity and its dynamics. In this way, the control operates by decreasing the active power delivered and increasing the reactive power injection to soften the impact on grid voltage levels of disturbances that characterize SDVV/MVD.
At first, this proposal seems to be conventional. Nevertheless, it is innovative regarding the control of active and reactive power using AVR to decrease the amount of active power injected into the grid during MVD. This technique releases space for reactive power injection based on the total capacity of the GCPVS, which contributes to the support of the bus voltage level. It is important to note that this proposal has never been presented before in the technical literature. It was also possible to notice improvements in the DC bus voltage since the GCPVS remains injecting active power during the MVD.
The 75 kW GCPVS with the proposed control experienced different SDVV/MVD, and asymmetrical and symmetrical faults such as phase-to-ground, phase-to-phase, phase-to-phase-to-ground, and three-phase-to-ground short-circuits. The simulation results show that it was possible to raise the voltage levels for all events. In the three-phase short-circuit, the most severe fault, the voltage levels, also improved (although not enough to attend the lower voltage limit (198 V) appointed by ANEEL). However, it can be concluded that if a greater number of GCPVS were installed, the voltage support would be certainly more effective even for the worse situation. It is possible to verify that, in normal conditions, the proposed control does not interfere in the GCPVS operation.
Moreover, for the further improvement of the control and continuity of this research, the power compensation should be applied at each one of the three phases to deal with voltage sags situations caused by asymmetrical faults.

Author Contributions

All authors (A.R.P., G.C.G., A.C.d.S., and A.M.D.) contributed to compiling the manuscript in its current state. Their contributions included a detailed survey of the literature and state-of-the-art scenarios, which were essential for the completion of this paper. A.R.P. wrote the paper. All authors have read and agreed to the published version of the manuscript.

Funding

This research received no external funding.

Acknowledgments

Two Brazilian public higher education institutions supported this work: Federal Institute of Paraná-Campus Paranavaí (IFPR) and Federal University of Uberlândia (UFU).

Conflicts of Interest

The authors declare no conflict of interest.

References

  1. Al-Shetwi, A.Q.; Sujod, M.Z.; Blaabjerg, F. Low Voltage Ride-through Capability Control for Single-Stage Inverter-Based Grid-Connected Photovoltaic Power Plant. Sol. Energy 2018, 159, 665–681. [Google Scholar] [CrossRef] [Green Version]
  2. ANEEL Geração Distribuída—ANEEL. Available online: https://www.aneel.gov.br/geracao-distribuida (accessed on 3 August 2020).
  3. INEE O Que é Geração Distribuída. Available online: http://www.inee.org.br/forum_ger_distrib.asp (accessed on 3 August 2020).
  4. Liu, H.; Xu, K.; Zhang, Z.; Liu, W.; Ao, J. Research on Theoretical Calculation Methods of Photovoltaic Power Short-Circuit Current and Influencing Factors of Its Fault Characteristics. Energies 2019, 12, 316. [Google Scholar] [CrossRef] [Green Version]
  5. Hasanien, H.M. An Adaptive Control Strategy for Low Voltage Ride through Capability Enhancement of Grid-Connected Photovoltaic Power Plants. IEEE Trans. Power Syst. 2016, 31, 3230–3237. [Google Scholar] [CrossRef]
  6. Afshari, E.; Moradi, G.R.; Yang, Y.; Farhangi, B.; Farhangi, S. A Review on Current Reference Calculation of Three-Phase Grid-Connected PV Converters under Grid Faults. In Proceedings of the 2017 IEEE Power and Energy Conference at Illinois (PECI), Champaign, IL, USA, 23–24 February 2017; pp. 1–7. [Google Scholar]
  7. Goqo, Z.; Davidson, I.E. A Review of Grid Tied PV Generation on LV Distribution Networks. In Proceedings of the 2018 IEEE PES/IAS PowerAfrica, Cape Town, South Africa, 28–29 June 2018; pp. 907–912. [Google Scholar]
  8. Sufyan, M.; Rahim, N.A.; Eid, B.; Raihan, S.R.S. A Comprehensive Review of Reactive Power Control Strategies for Three Phase Grid Connected Photovoltaic Systems with Low Voltage Ride through Capability. J. Renew. Sustain. Energy 2019, 11, 042701. [Google Scholar] [CrossRef]
  9. Cabrera-Tobar, A.; Bullich-Massagué, E.; Aragüés-Peñalba, M.; Gomis-Bellmunt, O. Review of Advanced Grid Requirements for the Integration of Large Scale Photovoltaic Power Plants in the Transmission System. Renew. Sustain. Energy Rev. 2016, 62, 971–987. [Google Scholar] [CrossRef]
  10. Wang, L.; Qiao, T.; Zhao, B.; Zeng, X.; Yuan, Q. Modeling and Parameter Optimization of Grid-Connected Photovoltaic Systems Considering the Low Voltage Ride-through Control. Energies 2020, 13, 3972. [Google Scholar] [CrossRef]
  11. Ammar, M.; Sharaf, A.M. Optimized Use of PV Distributed Generation in Voltage Regulation: A Probabilistic Formulation. IEEE Trans. Ind. Inform. 2019, 15, 247–256. [Google Scholar] [CrossRef]
  12. Mishra, M.K.; Lal, V.N. An Improved Methodology for Reactive Power Management in Grid Integrated Solar PV System with Maximum Power Point Condition. Sol. Energy 2020, 199, 230–245. [Google Scholar] [CrossRef]
  13. IEEE Standard Association. IEEE Standard for Interconnection and Interoperability of Distributed Energy Resources with Associated Electric Power Systems Interfaces. In IEEE Std 1547-2018 (Revision of IEEE Std 1547-2003); IEEE: Piscataway, NJ, USA, 2018; pp. 1–138. [Google Scholar] [CrossRef]
  14. Albuquerque, F.L.; Moraes, A.J.; Guimarães, G.C.; Sanhueza, S.M.R.; Vaz, A.R. Photovoltaic Solar System Connected to the Electric Power Grid Operating as Active Power Generator and Reactive Power Compensator. Sol. Energy 2010, 84, 1310–1317. [Google Scholar] [CrossRef]
  15. Safayet, A.; Fajri, P.; Husain, I. Reactive Power Management for Overvoltage Prevention at High PV Penetration in a Low-Voltage Distribution System. IEEE Trans. Ind. Appl. 2017, 53, 5786–5794. [Google Scholar] [CrossRef]
  16. Kraiczy, M.; Wang, H.; Schmidt, S.; Wirtz, F.; Braun, M. Reactive Power Management at the Transmission-Distribution Interface with the Support of Distributed Generators—A Grid Planning Approach. Transm. Distrib. IET Gener. 2018, 12, 5949–5955. [Google Scholar] [CrossRef]
  17. Ouai, A.; Mokrani, L.; Machmoum, M.; Houari, A. Control and Energy Management of a Large Scale Grid-Connected PV System for Power Quality Improvement. Sol. Energy 2018, 171, 893–906. [Google Scholar] [CrossRef]
  18. Al-Shetwi, A.Q.; Sujod, M.Z. Grid-Connected Photovoltaic Power Plants: A Review of the Recent Integration Requirements in Modern Grid Codes. Int. J. Energy Res. 2018, 42, 1849–1865. [Google Scholar] [CrossRef]
  19. Wen, H.; Fazeli, M. A Low-Voltage Ride-through Strategy Using Mixed Potential Function for Three-Phase Grid-Connected PV Systems. Electr. Power Syst. Res. 2019, 173, 271–280. [Google Scholar] [CrossRef]
  20. Stanelyte, D.; Radziukynas, V. Review of Voltage and Reactive Power Control Algorithms in Electrical Distribution Networks. Energies 2020, 13, 58. [Google Scholar] [CrossRef] [Green Version]
  21. Choi, S.-J.; Lim, S.-H. Fluctuation Suppression of DC-Link Voltage Using Control of Converters Connected with DC Distributed Generation. Energies 2020, 13, 5832. [Google Scholar] [CrossRef]
  22. Pelin, D.; Žnidarec, M.; Šljivac, D.; Brandis, A. Fast Power Emulation Approach to the Operation of Photovoltaic Power Plants Made of Different Module Technologies. Energies 2020, 13, 5957. [Google Scholar] [CrossRef]
  23. ANEEL Procedimentos de Distribuição de Energia Elétrica No Sistema Elétrico Nacional—PRODIST. Available online: https://www.aneel.gov.br/prodist (accessed on 11 May 2021).
  24. Caetano, L.; Caaixeta, G.; Lima, T.; Oliveira, J.; Ramos, R.; Piccini, A.R. Modelling of a Multipurpose Photovoltaic Generator Block Using ATP-EMTP. IEEE Lat. Am. Trans. 2019, 17, 203–209. [Google Scholar] [CrossRef]
  25. Reznik, A.; Simões, M.G.; Al-Durra, A.; Muyeen, S.M. LCL Filter Design and Performance Analysis for Grid-Interconnected Systems. IEEE Trans. Ind. Appl. 2014, 50, 1225–1232. [Google Scholar] [CrossRef]
  26. Souza, A.C. Sistemas Fotovoltaicos Trifásicos com Compensação de Reativo, Armazenamento Interno de Energia e Inércia Virtual (Three-Phase Photovoltaic Systems with Reactive Compensation, Internal Energy Storage and Virtual Inertia); Universidade Federal de Uberlândia: Uberlândia, Brazil, 2020. [Google Scholar] [CrossRef] [Green Version]
  27. Blaabjerg, F.; Teodorescu, R.; Liserre, M.; Timbus, A.V. Overview of Control and Grid Synchronization for Distributed Power Generation Systems. IEEE Trans. Ind. Electron. 2006, 53, 1398–1409. [Google Scholar] [CrossRef] [Green Version]
  28. Teodorescu, R.; Liserre, M.; Rodriguez, P. Grid Converters for Photovoltaic and Wind Power Systems, 1st ed.; Wiley: Piscataway, NJ, USA; Hoboken, NJ, USA; Chichester, UK; West Sussex, UK, 2011; ISBN 978-0-470-05751-3. [Google Scholar]
  29. ANEEL PRODIST—Módulo 8—Qualidade Da Energia Elétrica—ANEEL. Available online: https://www.aneel.gov.br/modulo-8 (accessed on 10 August 2020).
  30. IEEE Standard Association. IEEE Recommended Practice for Excitation System Models for Power System Stability Studies. IEEE 421.5-2016; IEEE Standard Association: Piscataway, NJ, USA, 2016; pp. 1–207. [Google Scholar] [CrossRef]
  31. Piccini, A.R. Análise da Viabilidade da Conexão de Geração Solar Fotovoltaica na Rede de Distribuição de Palmas-TO via MATLAB/PSAT; Universidade Federal de Uberlândia: Uberlândia, Brazil, 2014. [Google Scholar] [CrossRef]
  32. Piccini, A.R.; Tamashiro, M.A.; Guimarães, G.C.; Rodrigues, A.R.; Barbosa, C.S. Steady State Analysis of a Medium/Low Voltage Distribution Grid Behavior with PV System Penetration. REPQJ 2014, 532–537. [Google Scholar] [CrossRef]
  33. Rivera Sanhueza, S.M.; Leal Freitas, S.C. Overvoltage Forecast in a Urban Distribution Power Grid Considering PV Systems Conection. IEEE Lat. Am. Trans. 2018, 16, 2221–2227. [Google Scholar] [CrossRef]
  34. ANEEL PRODIST—Módulo 3—Acesso Ao Sistema de Distribuição. Available online: https://www.aneel.gov.br/modulo-3 (accessed on 10 August 2020).
  35. IEC International Standard IEC 60076-1, Power Transformers—Part 1: General Edition 2.1 2000-04. “Annex D: Three-Phase Transformer Connections”. 2000. Available online: https://www.mathworks.com/help/physmod/sps/ug/three-phase-three-limb-core-type-two-winding-transformer.html (accessed on 10 August 2020).
  36. Bagchi, S.; Chatterjee, D.; Bhaduri, R.; Biswas, P.K. An Improved Low-Voltage Ride-through (LVRT) Strategy for PV-Based Grid Connected Inverter Using Instantaneous Power Theory. IET Gener. Transm. Distrib. 2021, 15, 883–893. [Google Scholar] [CrossRef]
Figure 1. Proposed control to the injection of active and reactive power during the voltage sag.
Energies 14 06244 g001
Figure 2. GCPVS under study.
Energies 14 06244 g002
Figure 3. Block diagram of the inverter with proposed control, based on the αβ stationary system.
Energies 14 06244 g003
Figure 4. Schematic diagram for optimization of the SDVV/MVD control.
Energies 14 06244 g004
Figure 5. Flowchart of the SDVV/MVD control strategy.
Energies 14 06244 g005
Figure 6. Single-line diagram of the real grid modeled in Matlab/Simulink®.
Energies 14 06244 g006
Figure 7. Peak voltages and currents measured at PCC or B_12.
Energies 14 06244 g007
Figure 8. Measured RMS phase values: (a) voltages; (b) currents.
Energies 14 06244 g008
Figure 9. Phase voltages with system fault at (a) B_12 without DG, (b) GCPVS output terminal.
Energies 14 06244 g009
Figure 10. Phase voltages at B_12: (a) Fault at phase B without GCPVS operation, (b) Fault at phase B with GCPVS operation.
Energies 14 06244 g010
Figure 11. RMS three-phase currents for phase B-to-ground short-circuit on: (a) B_12 without GCPVS, (b) B_12 with GCPVS, (c) GCPVS output terminal.
Energies 14 06244 g011
Figure 12. Active and reactive power measured at (a) B_12 without GCPVS, (b) B_12 with GCPVS, (c) GCPVS output terminal.
Energies 14 06244 g012
Figure 13. RMS grid voltage (p.u.) and control output (p.u.).
Energies 14 06244 g013
Figure 14. Simulation results of the GCPVS proposed for SDVV/MVD: phase-to-phase short-circuit for 500 ms.
Energies 14 06244 g014
Figure 15. Simulation results of the GCPVS proposed for SDVV/MVD: phase-to-phase-to-ground short-circuit for 625 ms.
Energies 14 06244 g015
Figure 16. Simulation results of the GCPVS proposed for SDVV/MVD: symmetric three-phase short-circuit for 625 ms, with proposed control action.
Energies 14 06244 g016
Figure 17. Simulation results of the GCPVS proposed for SDVV/MVD: symmetric three-phase short-circuit for 625 ms, without proposed control action.
Energies 14 06244 g017
Table 1. Voltage ranges applied to the SDVV control.
DesignationDuration of VariationVoltage Amplitude (RMS Value) Range with Respect to the Nominal Voltage (Vnom)
Momentary Voltage Dip (MVD)Greater than or equal to one cycle and less than or equal to three seconds0.1 VnomV < 0.9 Vnom
Table 2. Data from the transformers connected to the 1106 South court distribution grid [31], modified.
NamePrimary BusSecond. BusPower (kVA)High/Low Voltage (kV)R1 (Ω)L1 (mH)R2 (Ω)L2 (µH)
T_5B_4B_575.013.8/0.3840.6272209.700.0308158.98
T_7B_6B_730.013.8/0.38120.6120495.000.0915375.29
T_10B_9B_10112.513.8/0.3824.8277142.700.0188108.20
T_12B_11B_12112.513.8/0.3824.8277142.700.0188108.20
T_14B_13B_14112.513.8/0.3824.8277142.700.0188108.20
T_16B_15B_16112.513.8/0.3824.8277142.700.0188108.20
T_20B_19B_20112.513.8/0.3824.8277142.700.0188108.20
T_22B_21B_22112.513.8/0.3824.8277142.700.0188108.20
T_25B_24B_2530.013.8/0.38120.6120495.000.0915375.29
T_29B_28B_29150.013.8/0.3817.3512108.500.013282.28
T_32B_31B_3275.013.8/0.3840.6272209.700.0308158.98
T_34B_33B_3475.013.8/0.3840.6272209.700.0308158.98
Table 3. Number of consuming units connected to transformer secondary’s which are represented by PQ loads [31], modified.
BusVoltage (kV)Number of Consumers Connected to the TransformerName of Each Load SetActive Power Consumed by the Sum of the Loads (W)Reactive Power Consumed by the Sum of the Loads (VAr)
B_50.3813RLC_518,554.9411,009.85
B_70.380RLC_70.000.00
B_100.38280RLC_1073,007.9941,400.00
B_120.381RLC_1248,155.9128,574.04
B_140.38251RLC_1418,620.0411,048.48
B_160.38122RLC_1623,198.1713,764.98
B_200.38171RLC_2023,285.4013,196.44
B_220.38309RLC_2229,132.0016,509.87
B_250.380RLC_250.000.00
B_290.38265RLC_2928,732.0017,048.57
B_320.384RLC_3221,285.4012,062.99
B_340.3811RLC_3431,932.0018,096.70
Total1427
Table 4. Data from the interconnection lines [31], modified.
AWG/MCM Cable ModelOutput BusInput BusName of LineLength (km)Resistance (Ω/km)Inductance (H/km)
2B_2B_3L20.2010.2010.201
2/0B_2B_4L40.1936030.1936030.193603
2/0B_6B_23L60.0001820.0001820.000182
2B_23B_24L240.2370.2370.237
2B_3B_8L30.1135470.1135470.113547
2B_8B_9L90.0001980.0001980.000198
2B_17B_8L80.3190.3190.319
2B_3B_11L110.1528330.1528330.152833
2B_11B_13L130.0002670.0002670.000267
2B_13B_15L150.0750.0750.075
2/0B_30B_31L310.0722400.0722400.072240
2/0B_31B_33L330.0000680.0000680.000068
2/0B_37B_30L300.0460.0460.046
2/0B_30B_26L260.0443070.0443070.044307
2B_26B_27L270.0000420.0000420.000042
2B_27B_28L280.0630.0630.063
2B_27B_17L170.0606820.0606820.060682
2B_17B_18L180.0000570.0000570.000057
2B_18B_19L190.2370.2370.237
2B_18B_21L210.2282780.2282780.228278
2/0B_26B_1L10.0002150.0002150.000215
2/0B_23B_1L230.0780.0780.078
Table 5. Electric current values at 1.39 s, during short-circuit, and at 2.5 s, in steady state condition.
Without GCPS on B_12With GCPS on B_12GCPS Output
1.39 s2.5 s1.39 s2.5 s1.39 s2.5 s
Ia61.65 A88.16 A95.41 A59.96 A140.9 A115.6 A
Ib74.63 A110.50 A135.3 A
Ic88.16 A82.91 A135.3 A
Table 6. Resume the voltage variations for each of short-circuits.
Momentary Voltage Dip for Different Short-CircuitsProposed Control ActionVa (V)Vb (V)Vc (V)
Start conditionWithout211.6211.6211.6
With214.6214.6214.6
Phase-to-groundWithout147.2178.6211.6
With156.0186.6219.7
Phase-to-phaseWithout189.157.8181.9
With199.468.7189.6
Phase-to-phase-to-groundWithout171.546.2169.1
With183.058.5177.3
Three-phaseWithout46.246.246.2
With66.966.966.9
Three-phaseWithout46.246.246.2
Reactive power injection only66.266.266.2
Publisher’s Note: MDPI stays neutral with regard to jurisdictional claims in published maps and institutional affiliations.