1. Introduction
In recent years, electrochemical energy storage technology has played a key role in the application of smart grid, electric vehicle and ship electrical systems. Li-ion batteries are the energy carrier in electrochemical energy storage, whose energy density and cycle life are the two bottlenecks restricting the energy storage efficiency of the system [
1]. In order to solve these bottlenecks, on the one hand, highly specific capacity materials are applied and new materials are produced to improve the battery’s energy density and cycle life. On the other hand, according to the external characteristic parameters of the battery (voltage, capacity and temperature, etc.), suitable analysis methods are adopted to improve the cycle life of the battery [
2].
At present, the research on extending the cycle life of lithium batteries mainly includes two aspects. On the one hand, the research focuses on the cycle performance of lithium batteries based on chemical materials or physical structure. On the other hand, the study of li-ion batteries concentrates on optimal battery charging strategy. Lu et al. [
3] summarize the research progress of aqueous rechargeable li-ion battery electrolytes and future possible development trends through the discussion of related literature. The results show that the mixed electrolyte formed by adding additives and gelling agent to the aqueous electrolyte can effectively improve the cycle life of aqueous rechargeable li-ion batteries. Andrew et al. [
4] proposed a method to improve the battery structure by placing a lithium metal reservoir in the electrode to compensate for the consumption of recyclable lithium. The method is verified by experiments with Button batteries, which show that the service life of the battery can be significantly improved. Lu et al. [
5] reviewed the recent progress in the design and research of li-ion battery electrode materials based on Metal-Organic Framework (MOF)-derived materials. The introduction of MOFs breaks through the bottleneck in the design of electrode materials and endows traditional electrode materials with new characteristics, thus realizing the design and synthesis of electrode materials with consideration of specific capacity, cycle life, energy density and power. The studies [
3,
4,
5] analyze the cycle life of said battery from the perspective of improving the material of the battery. These studies focusing on chemical materials and physical structures of Li-ion batteries have positive effects on improving the cycle life of the battery. However, they are at the stage of sample preparation currently. More efforts, including analysis, tests, etc., are needed in order to apply these material- and structure-based methods.
Compared with developing new materials and changing the battery’s structure, it is more practical to optimize the charging mode to prolong its cycle life. Perez et al. [
6] put forward the electrothermal model based on aging kinetics and found the best scheme of fast charging from three aspects: reducing charging time, delaying battery decay and controlling suitable static charging current. Luo Yutao et al. [
7] put forward the capacity attenuation model based on vehicle cycle working conditions. This model simulation showed that the battery life can be increased by 50%. Lin et al. [
8] designed an adaptive battery temperature observer under the condition of fast charging. Based on online parameter identification of least squares, the thermal model of the lithium battery was obtained. Afterwards, the battery temperature observer was applied to estimate the temperature and cycle life. Zhang et al. [
9,
10] proposed an online lithium battery capacity estimation method, with consideration of thermodynamic properties, which divides the capacity estimation into three stages: (1) estimating the internal temperature and heat production of a battery using a two-state thermal model; (2) the estimated temperature and heat production are used as the input of the synovium observer to estimate the battery capacity; (3) using the estimated capacity and temperature to identify the capacity decay model. Experimental results show that this capacity estimation method has better accuracy and robustness. The above-mentioned studies estimated the battery’s cycle life from the charging state. However, the actual running state of the whole vehicle was not considered, and the working conditions of the lithium battery in the power vehicle cannot be updated in real time.
In order to overcome shortcomings of the above-mentioned methods, Wu et al. [
11,
12,
13] proposed the differential thermal voltammetry (DTV) method, which can diagnose aging batteries in operation by measuring the surface temperature and terminal voltage only. It is verified that the DTV method can provide the information of battery aging in a short time, and the adaptive method based on DTV principle is more suitable for battery life diagnosis.
Based on the DTV principle, this paper proposes an improved GITT method, which can describe the open circuit voltage-temperature change (
OCV-dT/dV) characteristics of state of health (SOH) more accurately by decoupling the terminal voltage into overpotential and stoichiometric drift. On this basis, the adaptive charge–discharge voltage boundary is found to prolong the cycle life of the battery, and the adaptive adjustment of the battery management system is made. In this paper, the principle of DTV, overpotential and stoichiometric drift are introduced in
Section 2. In
Section 3, the standard GITT and improved GITT experiments are performed on the DTV curve at 4C magnification and the
V-dT/dV and
OCV-dT/dV relationships are obtained. In
Section 4, based on the relationship between
V-dT/dV and
OCV-dT/dV, the DTV adaptive is carried out, and the relevant characteristic parameters are compared before and after self-adaption. In
Section 5, the adaptive charge–discharge voltage boundary experiment is performed. In
Section 6, the experimental results are processed and analyzed, verifying that this method can improve the cycle life of the battery to a certain extent.
2. DTV Correlation Principle
The principle of differential thermal voltammetry (DTV) is to calculate the first derivative of the terminal voltage-temperature (
V-T) curve under the condition of constant current charging and discharging to obtain the terminal voltage-temperature change(
V-dT/dV) curve. The
V-dT/dV curve describes the temperature rise of the battery at unit voltage. The DTV curve is usually solved by the fixed voltage interval method, which avoids the error caused by fitting the
V-T curve. The fixed voltage interval Δ
V is substituted for
dV, and Δ
T is the temperature change correspondingly under the Δ
V interval. When Δ
V→0, the following relation is approximated:
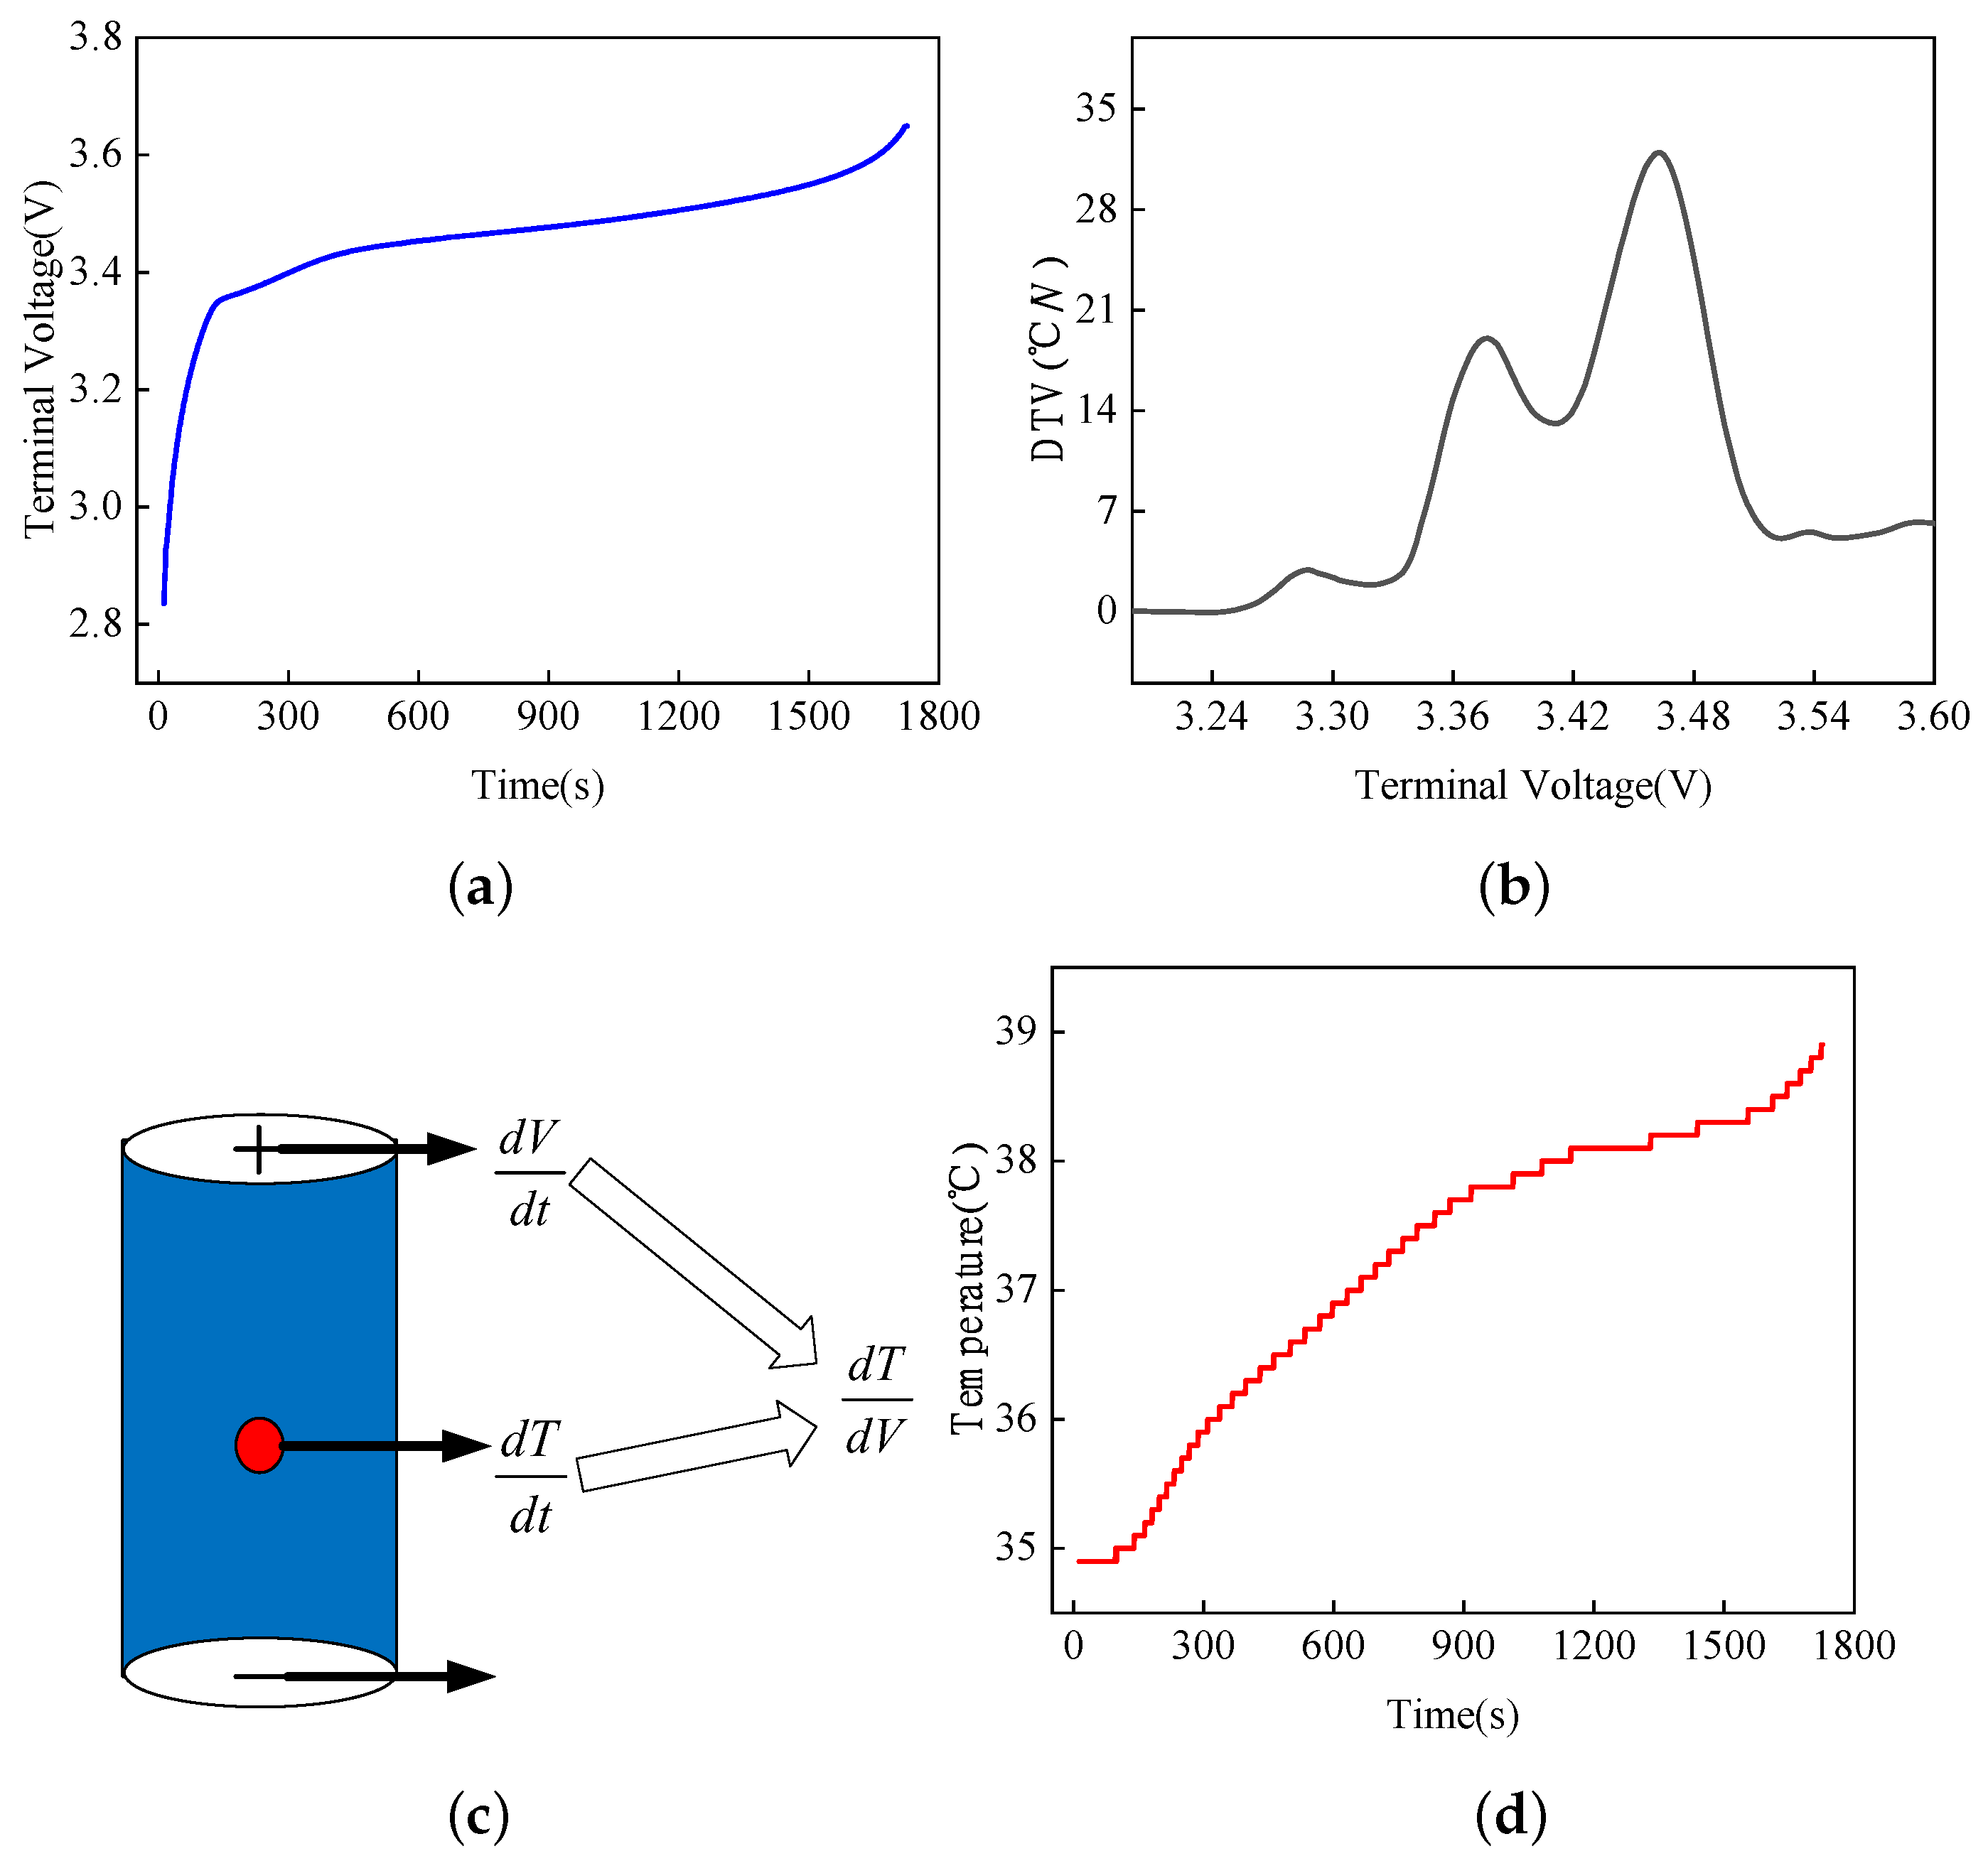
The DTV curve is shown in
Figure 1a–d.
Figure 1a is the charging curve of the
battery at the 2C rate. During the charging period from 300 to 1500 s, the charging curve has a relatively flat voltage platform, during which the battery generates a lot of heat.
Figure 1b shows the DTV curve under 2C charge. The DTV peak indicates that the battery generates a large amount of heat over a small voltage range. The area under the peak is the temperature rise of the battery in this voltage range. The heat of a battery during charging and discharging come from four sources: reaction heat, polarization heat, joule heat and side reaction heat, among which joule and polarization heat predominate. With this heat production, the battery temperature rises, leading to the increase in diffusion rate of lithium ions in the battery. Consequently, a large number of lithium ions cannot be embedded into the electrode quickly, resulting in the change of the structure of the electrode and thus different peaks in DTV curves, as shown in
Figure 1b.
Figure 1c is a li-ion battery diagram. The DTV curve is obtained by measuring the charge and discharge voltage of the battery and the surface temperature.
Figure 1d is the temperature rise curve of the battery during charging. The temperature rise of the battery reaches 4.8 °C during constant current charging at 2C. As can be seen in
Figure 1, the charging curve and the temperature rise curve can hardly reflect the real state inside the battery.
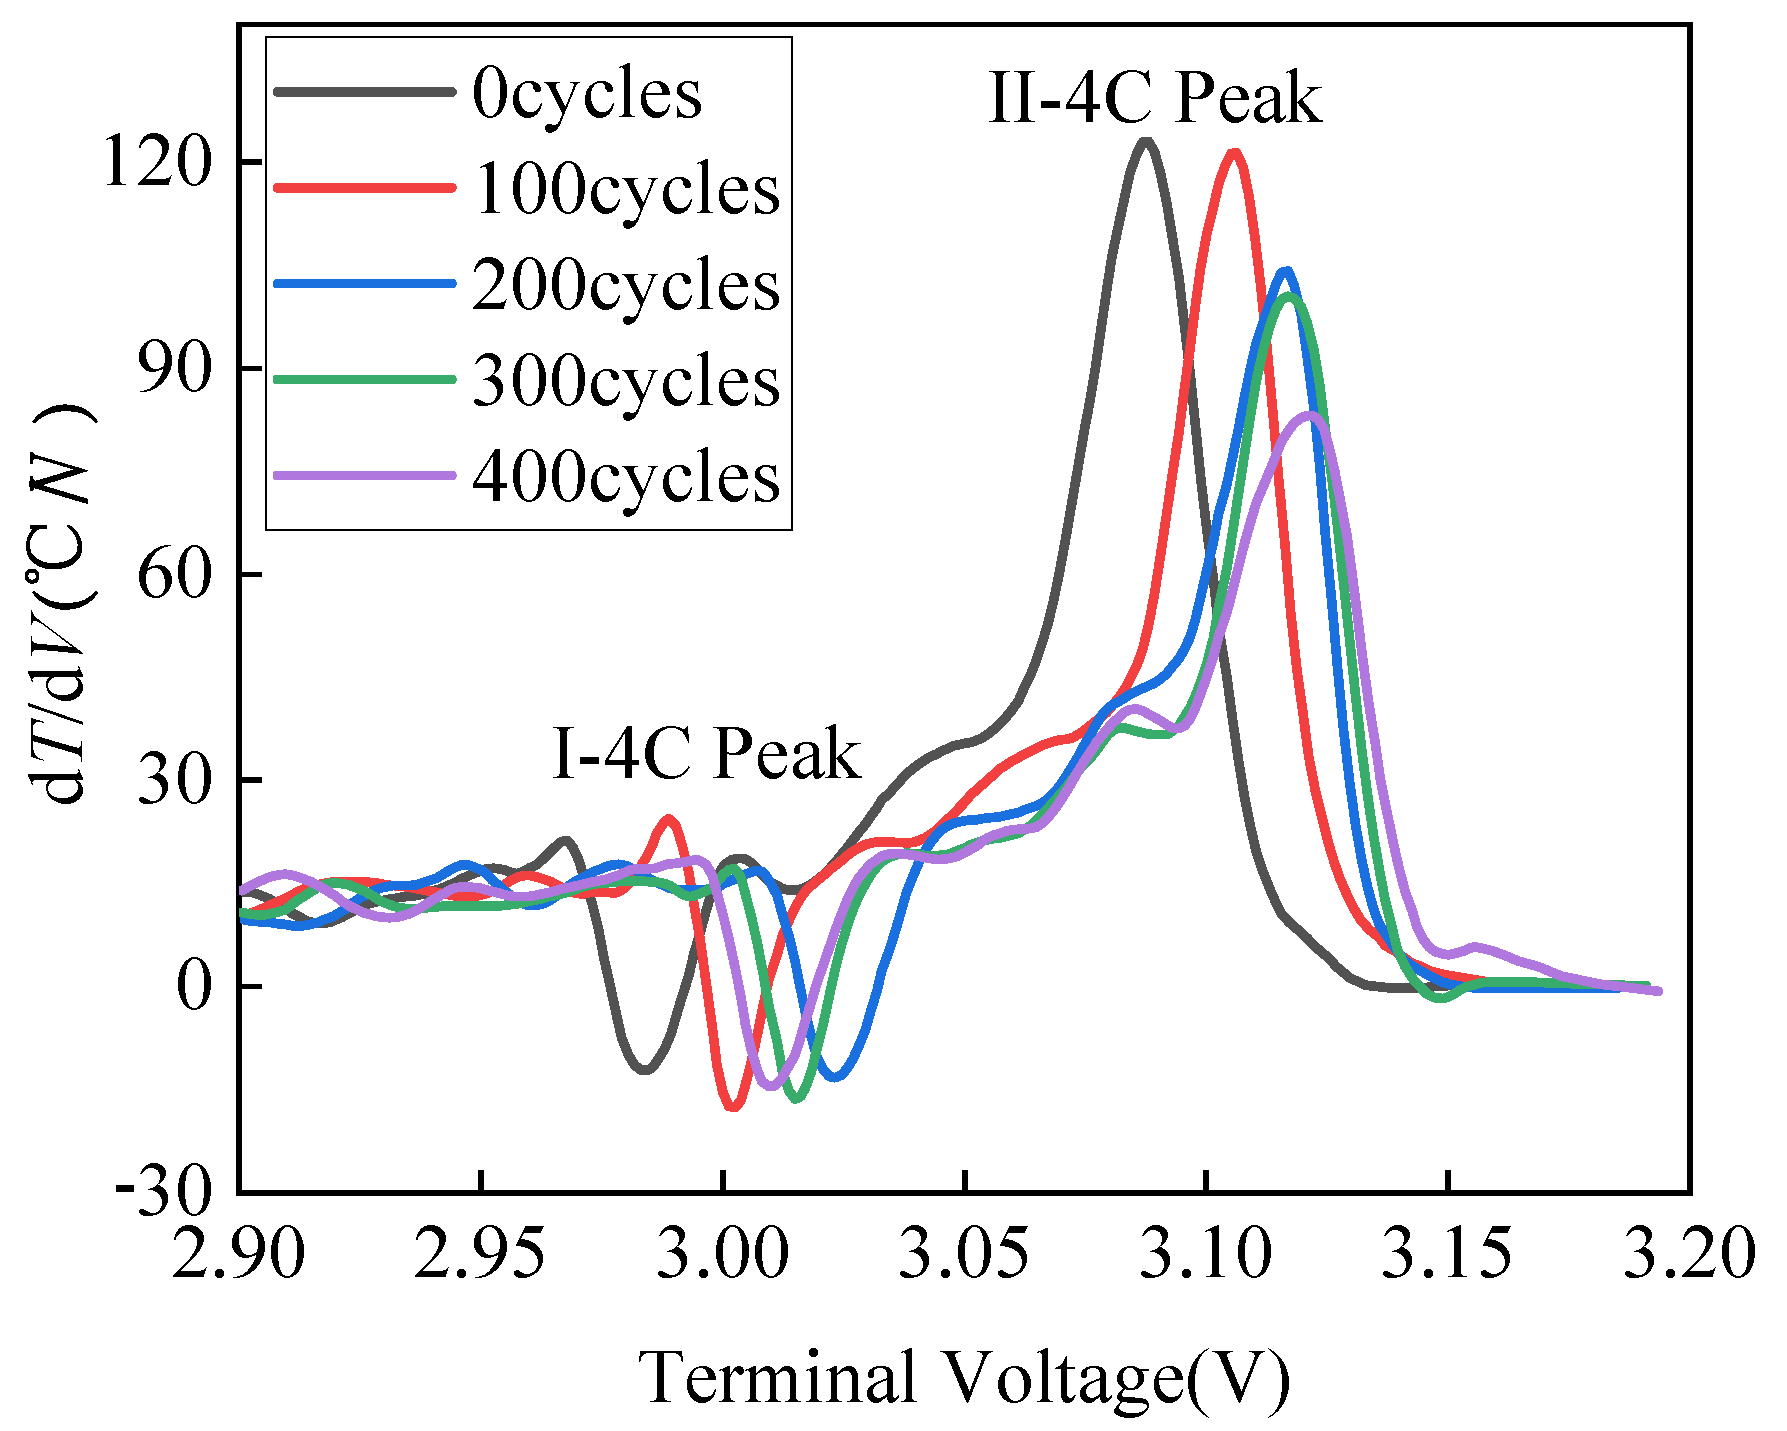
Figure 2 shows DTV curves of a 4C rate battery discharge at different SOH (from 0 cycles to 400 cycles with steps of 100 cycles). At the I-4C Peak region, as is shown in the figure, the height of the peak with different SOH are almost the same, not accurately reflecting the battery’s aging status. In addition, the peak position with different SOH changes without a certain pattern vs. terminal voltage. Thus, the characteristics of DTV curves at the I-4C peak region cannot accurately analyze the aging of the battery. For the II-4C peak region, there is a clear change in the peak height with varied SOH. In addition, the peak position of DTV curves moves increases terminal voltage along with cycles, indicating that the II-4C peak region can reflect the battery aging. Thus, the peak II-4C region was selected to perform analysis. The peak position of DTV is determined by the coupling of overpotential and stoichiometric drift [
14]. The overpotential is produced by the internal resistance of the battery, and the stoichiometric drift reflects the change of the open circuit voltage (OCV) during battery aging.
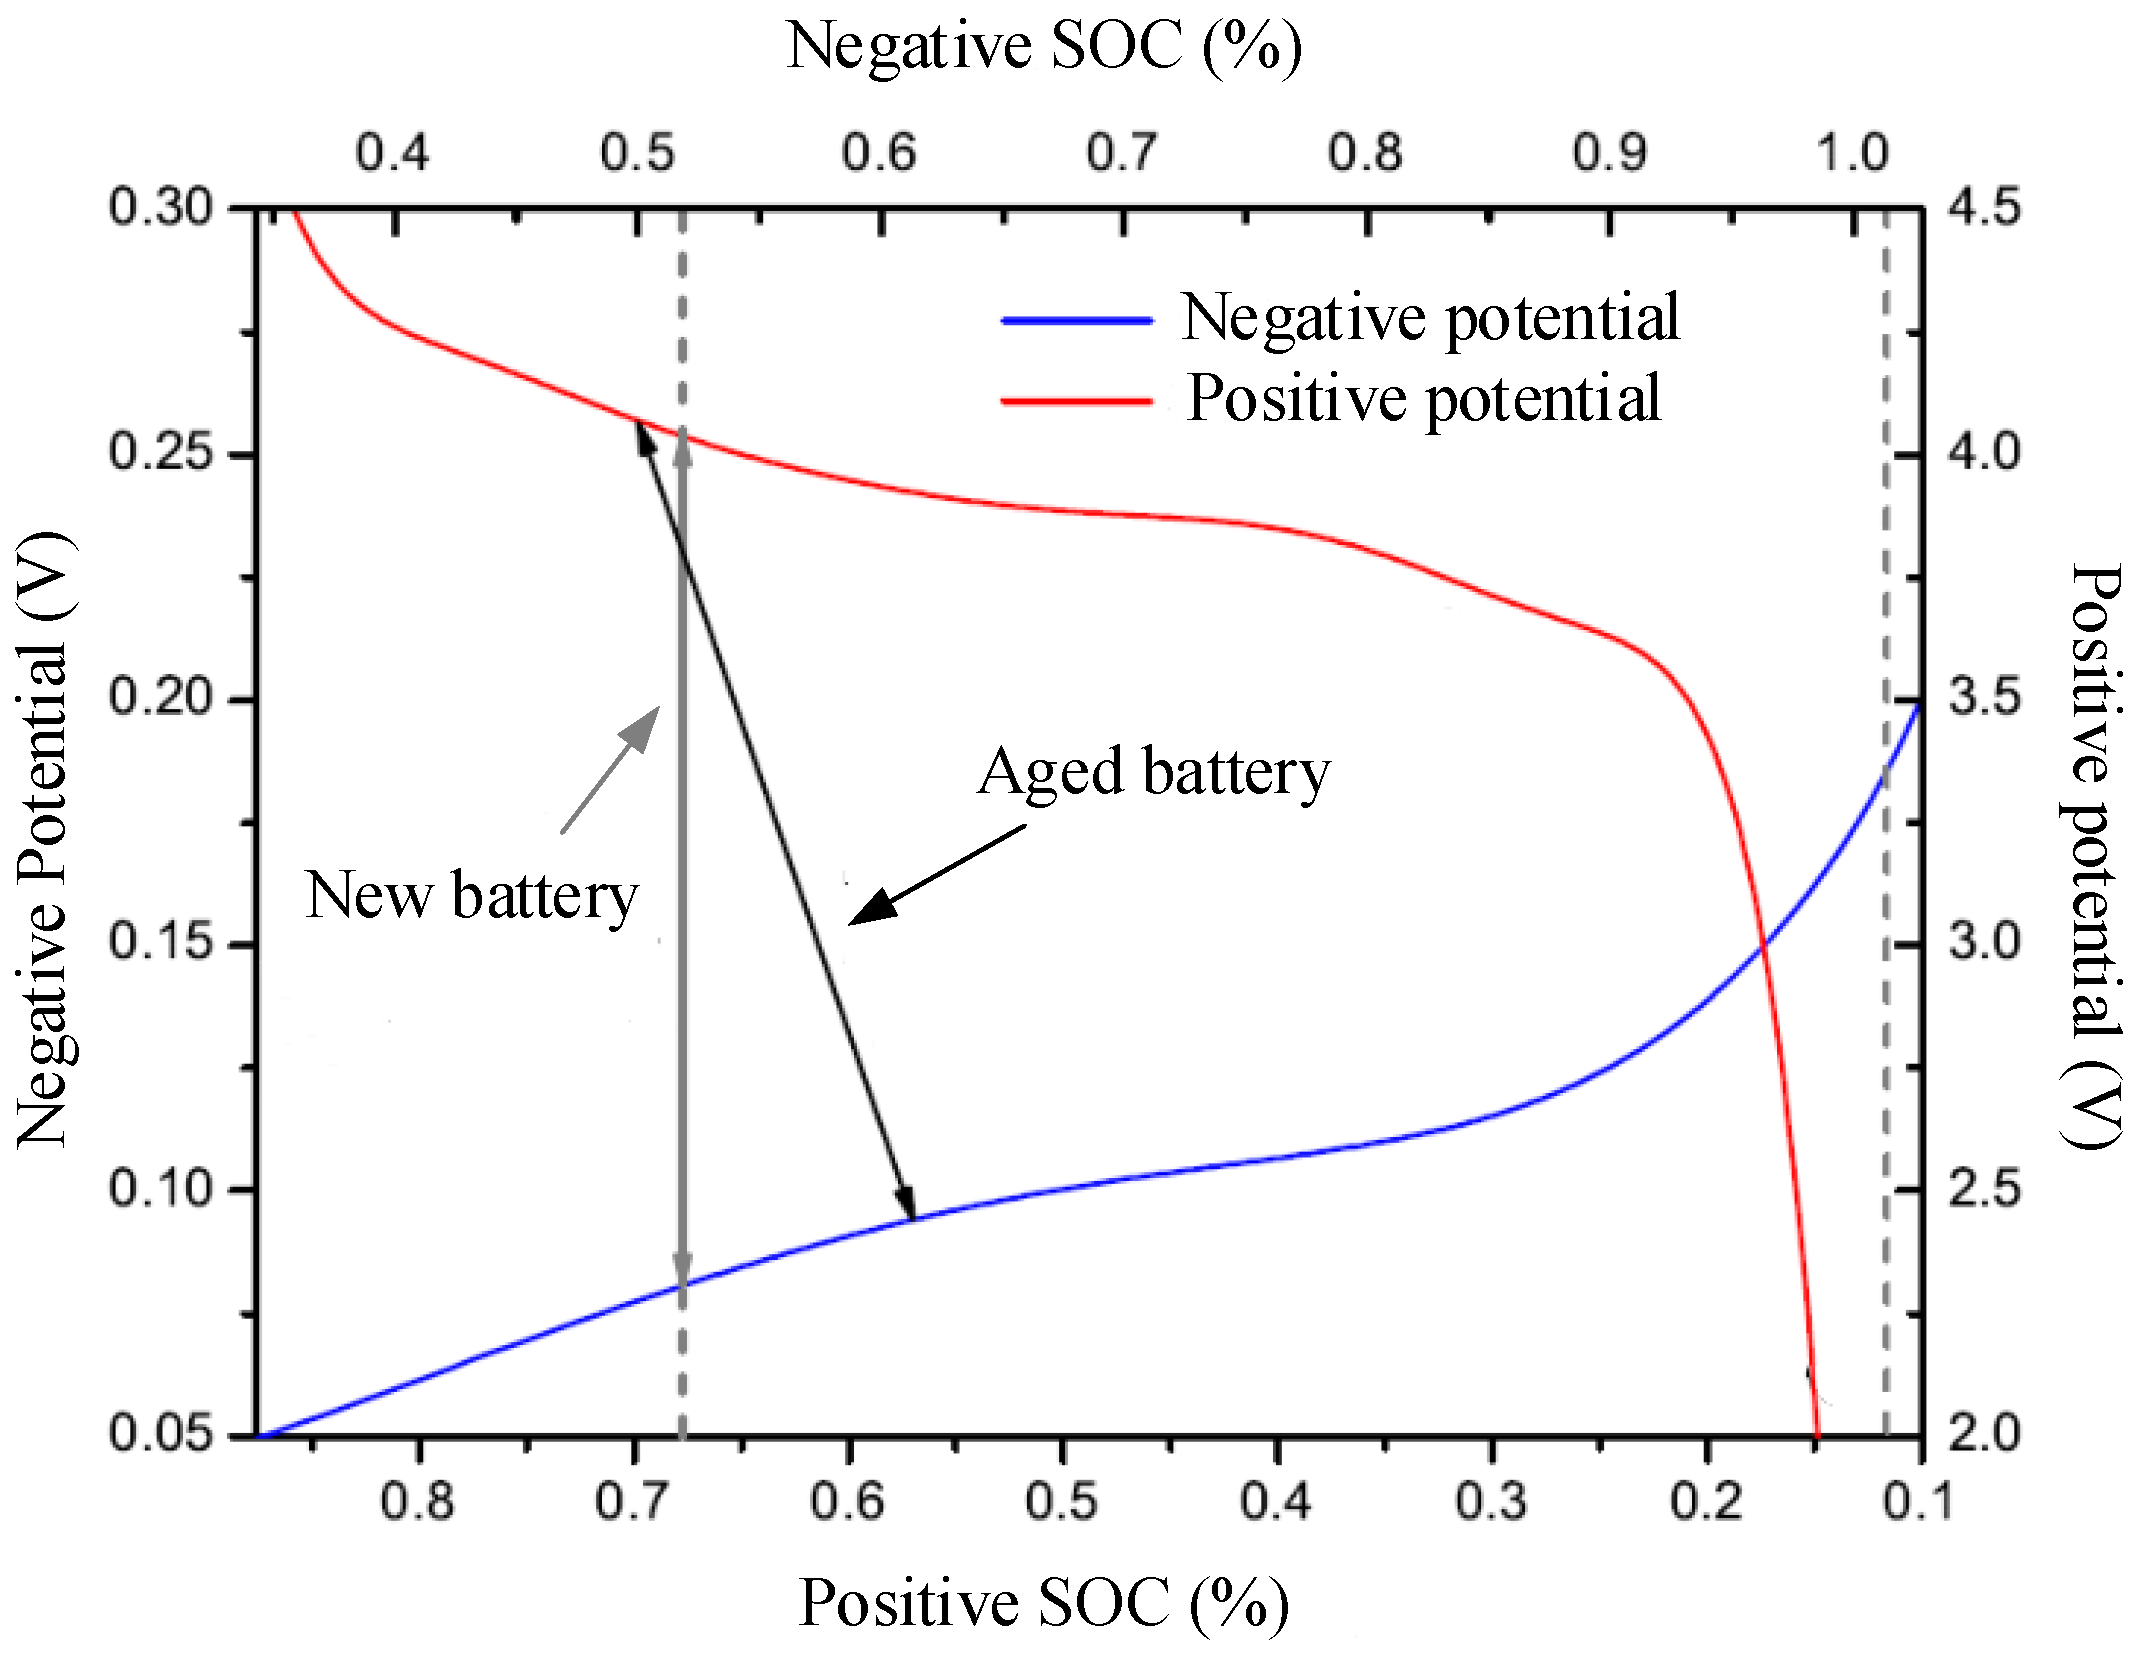
The stoichiometric drift of the battery electrode is shown in
Figure 3 [
15]. The Open Circuit Voltage (OCV) of the battery is the difference between the equilibrium potentials of the positive and negative electrodes. With the charging and discharging process going on, the degradation of the battery will occur from the macroscopic view, such as the oxidation of the collector, the change of the shapes of the cathode and anode, and the change of the interface between the negative electrode and the electrolyte. These degradation mechanisms at different stages interact with each other to cause battery aging and have great effect on the battery’s electrical performance. Among them, the change of the shapes of the cathode and anode may cause electrode potential shifts to different degrees, which makes the OCV curve of the battery shift to a certain extent. This phenomenon is called stoichiometric shift. In
Figure 3, the gray arrows represent the positive and negative potentials of the new battery at rest, and the black arrows represent the drift of the positive and negative potentials after the battery has aged.
3. Galvanostatic Intermittent Titration Technique
Reference [
15] proposes that the relationship between open circuit voltage-temperature change (
OCV-dT/dV) can be used to identify the cut-off voltage of the battery under different aging conditions, so that the battery can run more safely in the healthy voltage working range, thus improving the service life of the battery. According to the theory in [
15] as reference, OCV values of each State of Charge (SOC) point of a battery need to be obtained at first. However, the DTV method is usually suitable for the ratio above 2C, because only with a high ratio can the battery produce enough heat to make its curve characteristics obvious enough. However, on the other hand, at a high C ratio, the terminal voltage of the battery cannot be approximated as OCV.
OCV is the battery potential at the thermodynamic equilibrium. At present, there are two main methods to measure the OCV of batteries. The first one is the so-called low rate discharge method. Due to small polarization, the measured voltage can be approximated as OCV. The advantage of this method is its simple operation, while the disadvantages include big measuring error, long consumption time and limitation to online applications. The second method is the Galvanostatic Intermittent Titration Technique (GITT). The battery is charged or discharged for a very short period (24 s in this paper) and then rests for a certain period until it reaches the equilibrium state. Then, the OCV at the current SOC is measured. This process is repeated until the battery is fully charged or discharged. As a result, several OCV at different SOC are obtained. This method can be used to acquire more accurate OCV.
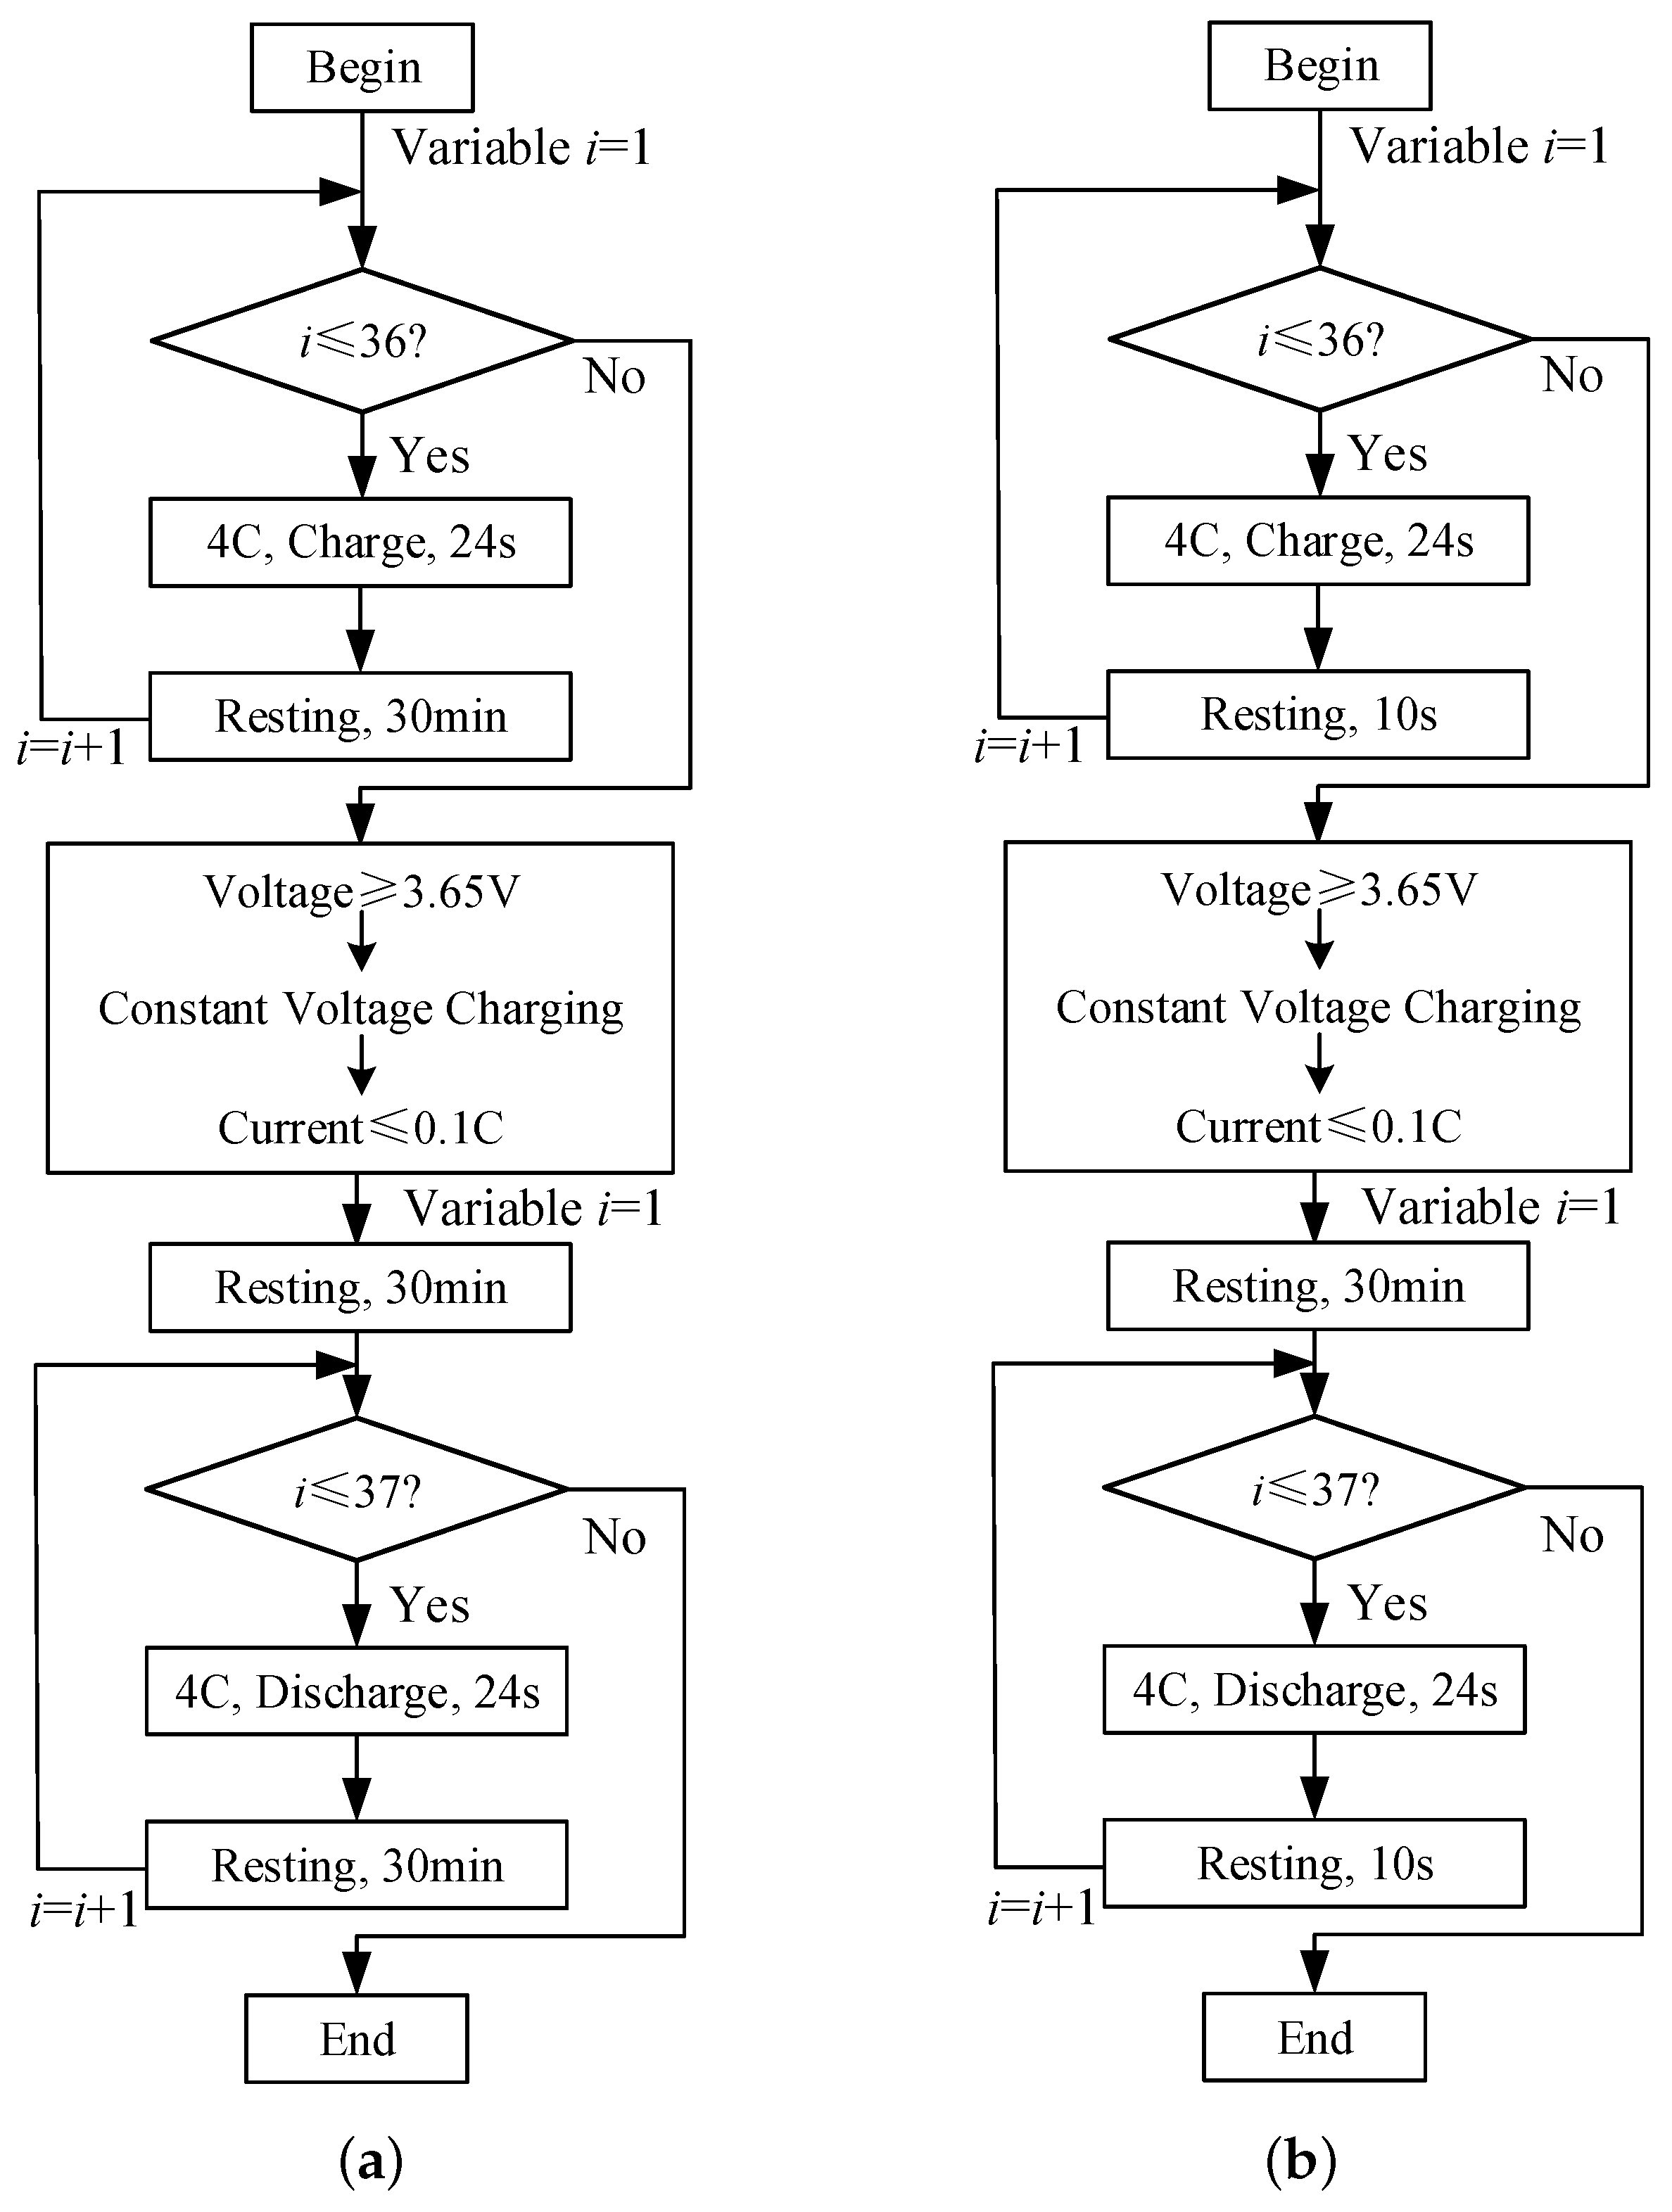
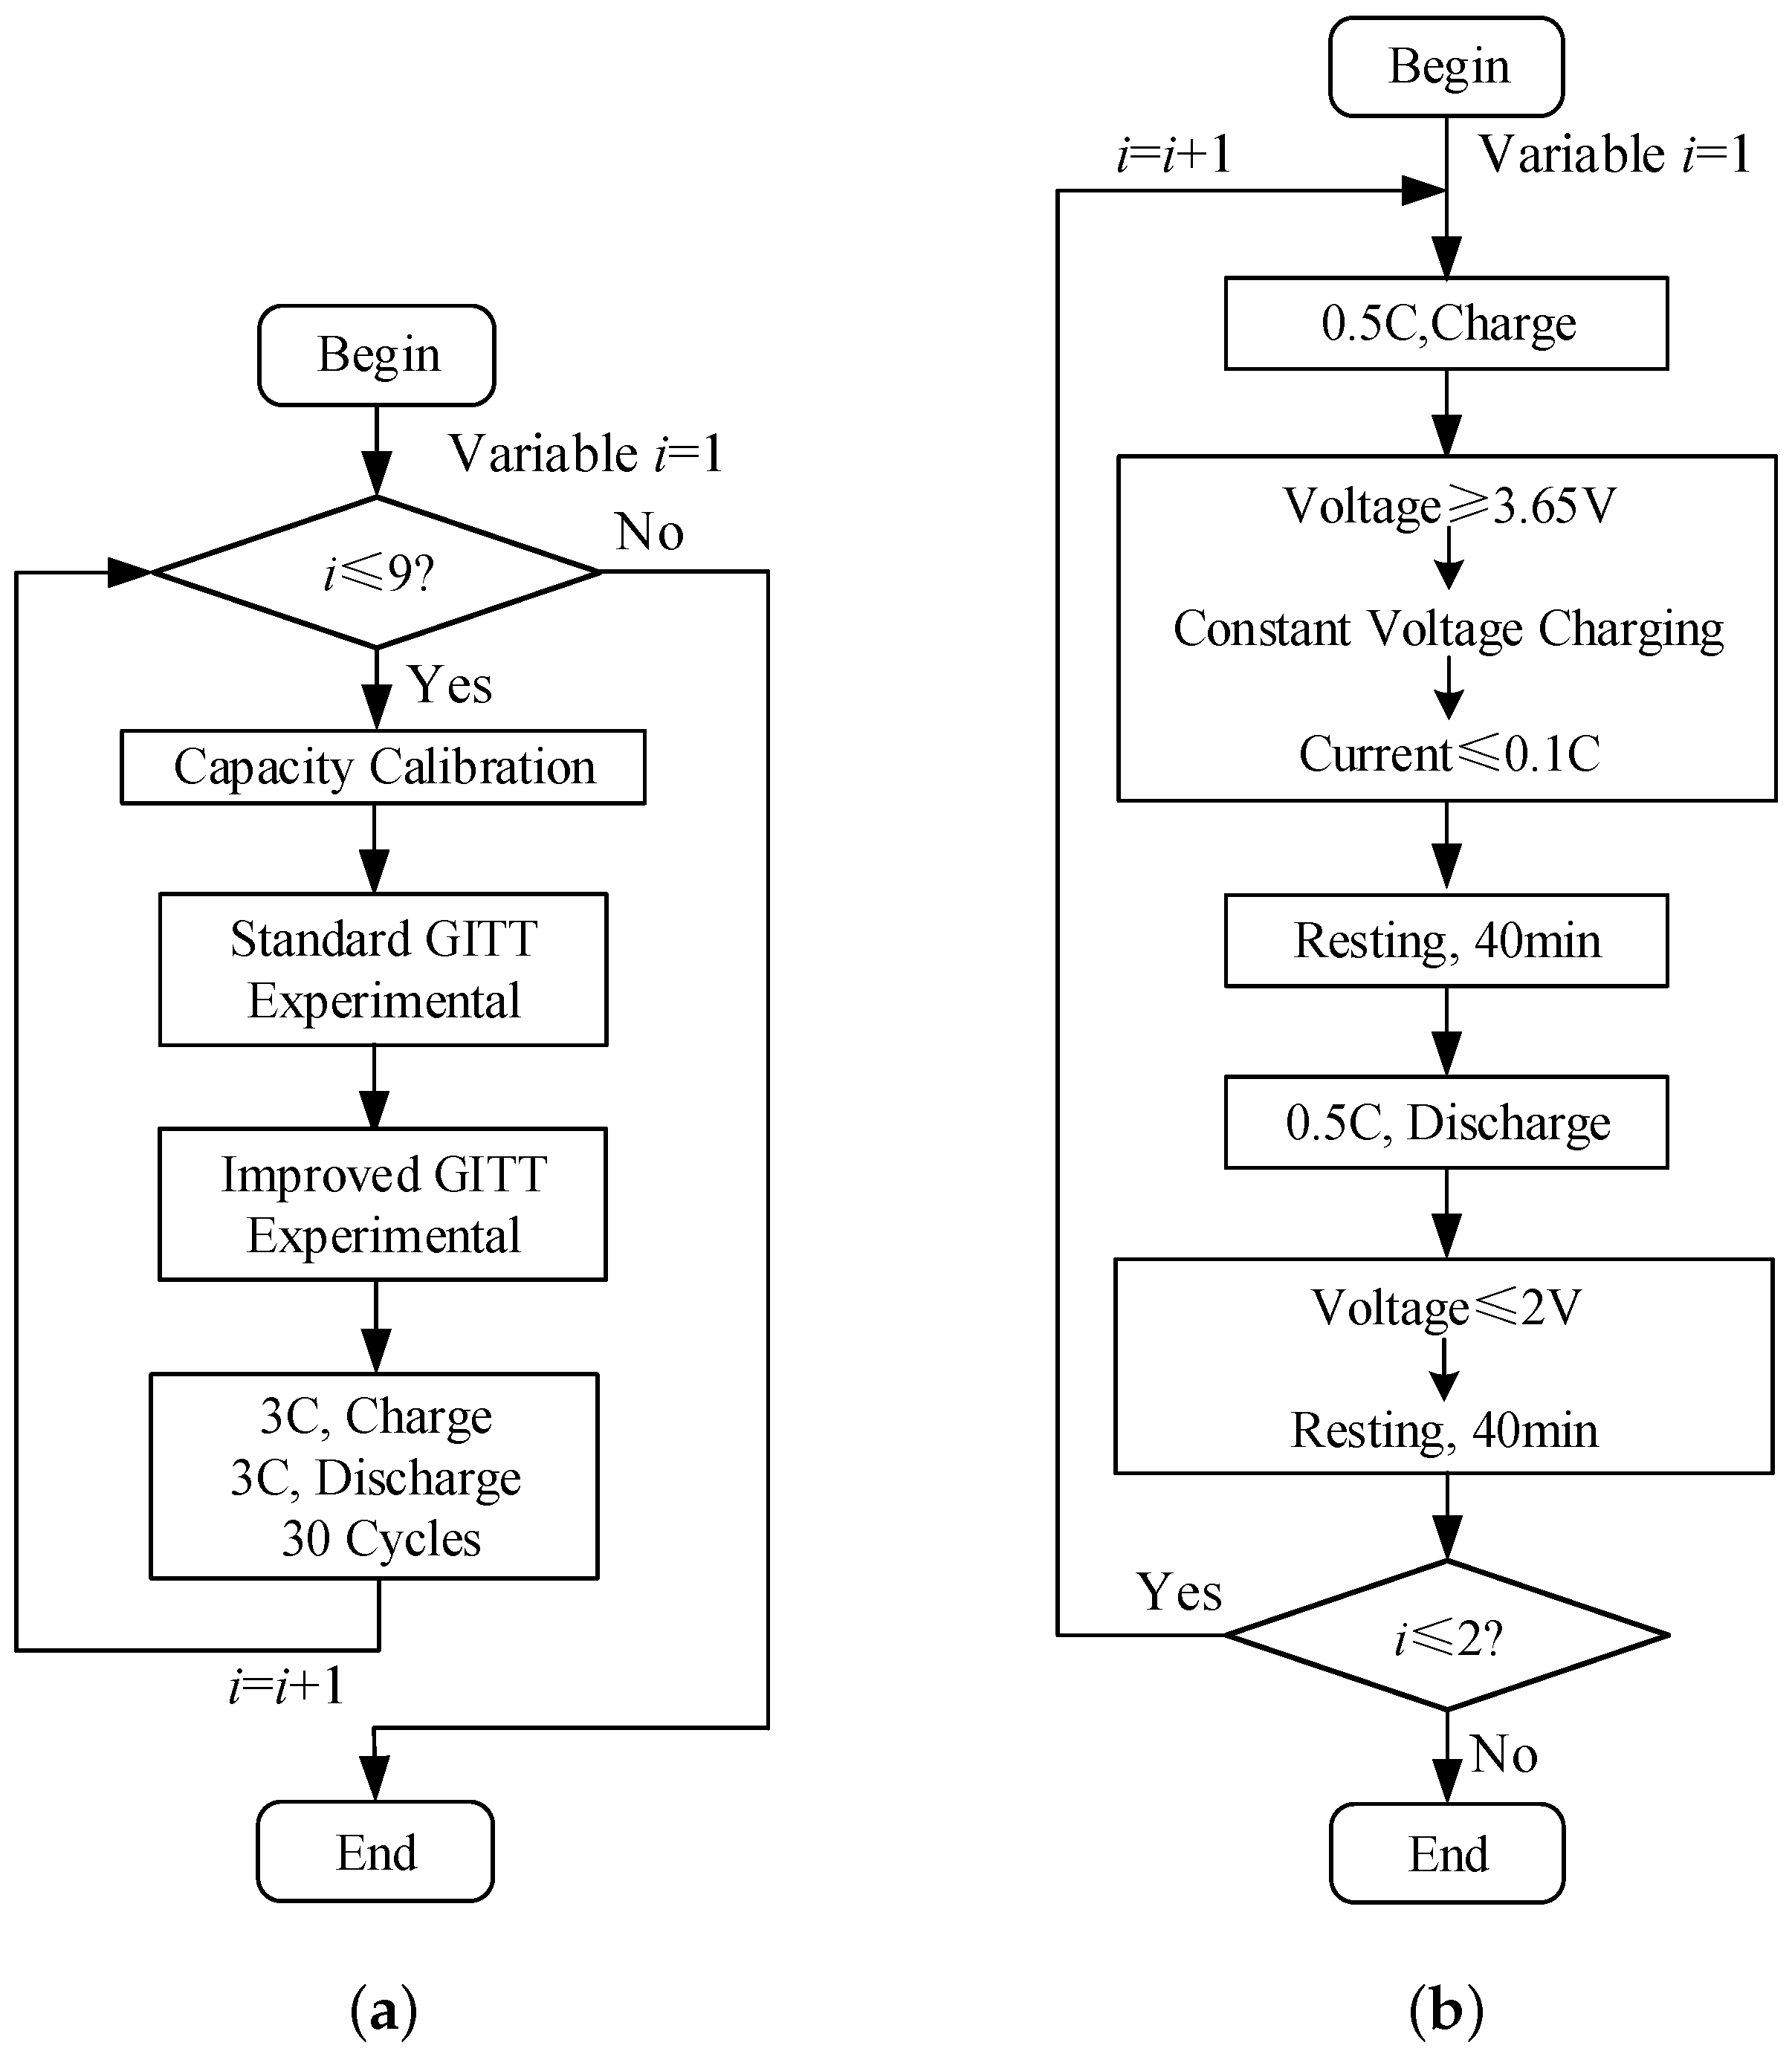
The flowchart of GITT is shown in
Figure 4. GITT is performed every 2.5% of SOC. Theoretically, a total of 40 charges and discharges should be performed. However, in the actual test, there are errors between the calibrated capacity and the actual capacity, so the cycle times
i of charge and discharge are set to 36 and 37, respectively.
Figure 4a,b show the experimental steps for the standard and improved GITT.
During the charge–discharge cycle of the standard GITT experiment, in order to make the battery rest time long enough, the battery rest time is set to 30 min, and the terminal voltage after 30 min is approximately taken as OCV value of each SOC point. During the charge–discharge cycle of the improved GITT experiment, in order to reduce the influence of the temperature drop caused by long-time resting on the measurement of the heat production of the battery, the rest time is set to 10 s.
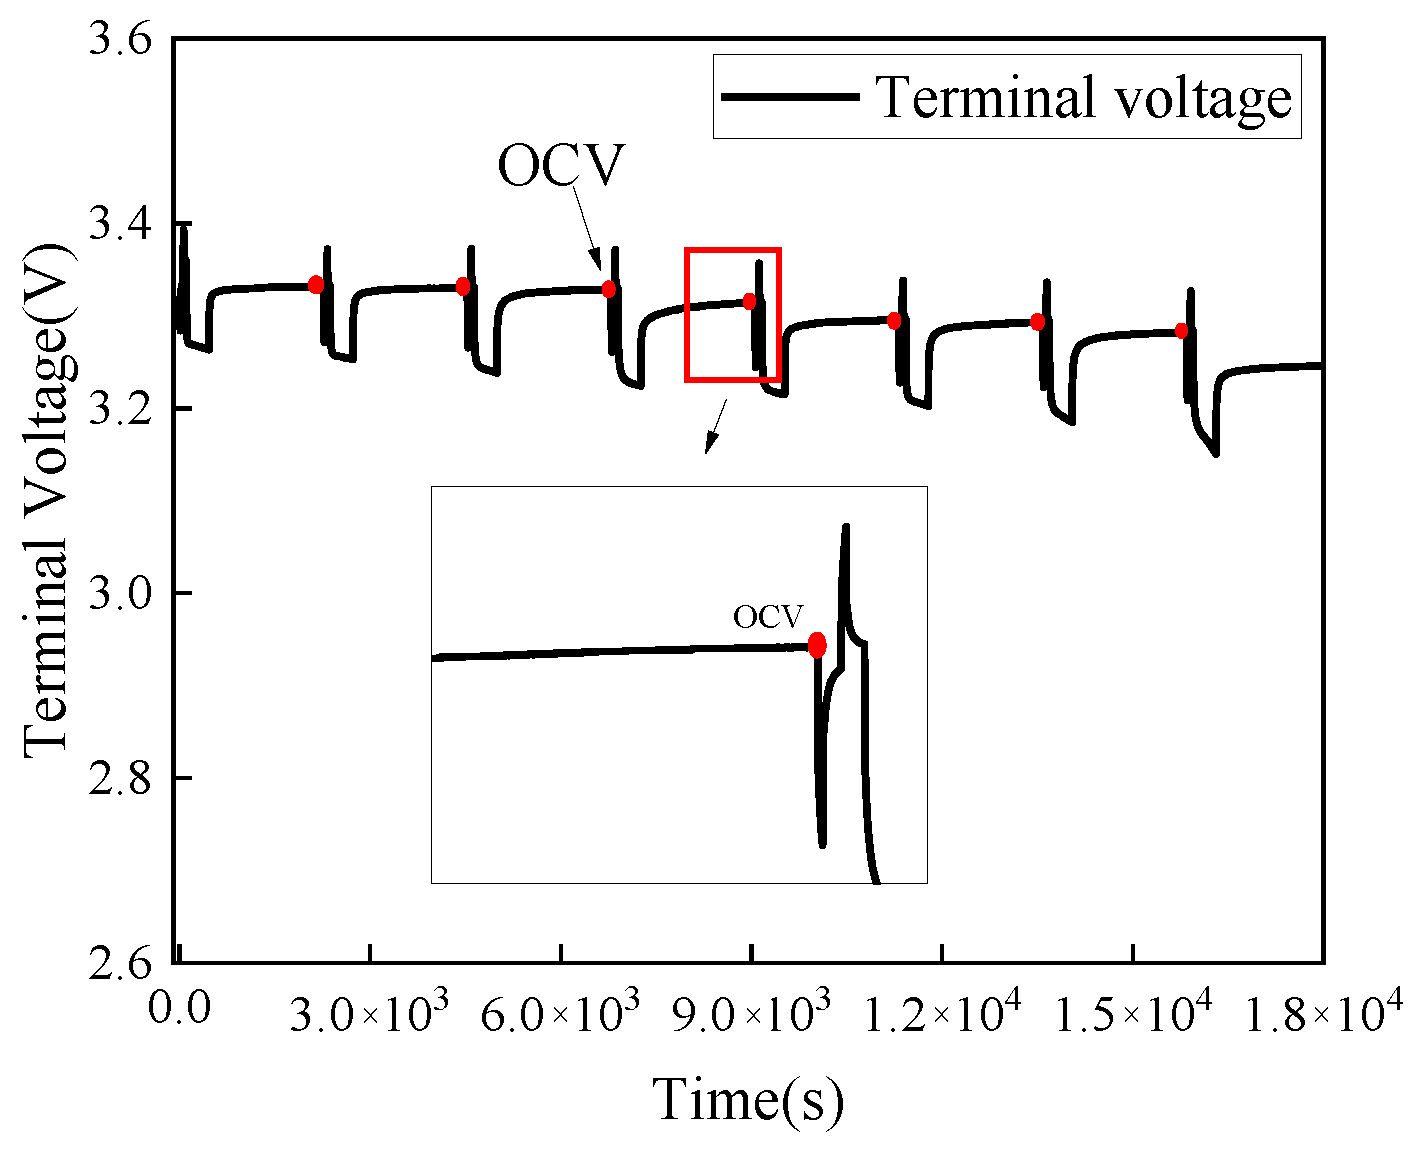
Figure 5 shows the standard GITT experimental curve. During the entire standard GITT period, the battery temperature is raised during the short pulse discharge period and then returns to room temperature during the 30 min resting phase. Consequently, the calculated DTV curve based on GITT method is discontinuous.
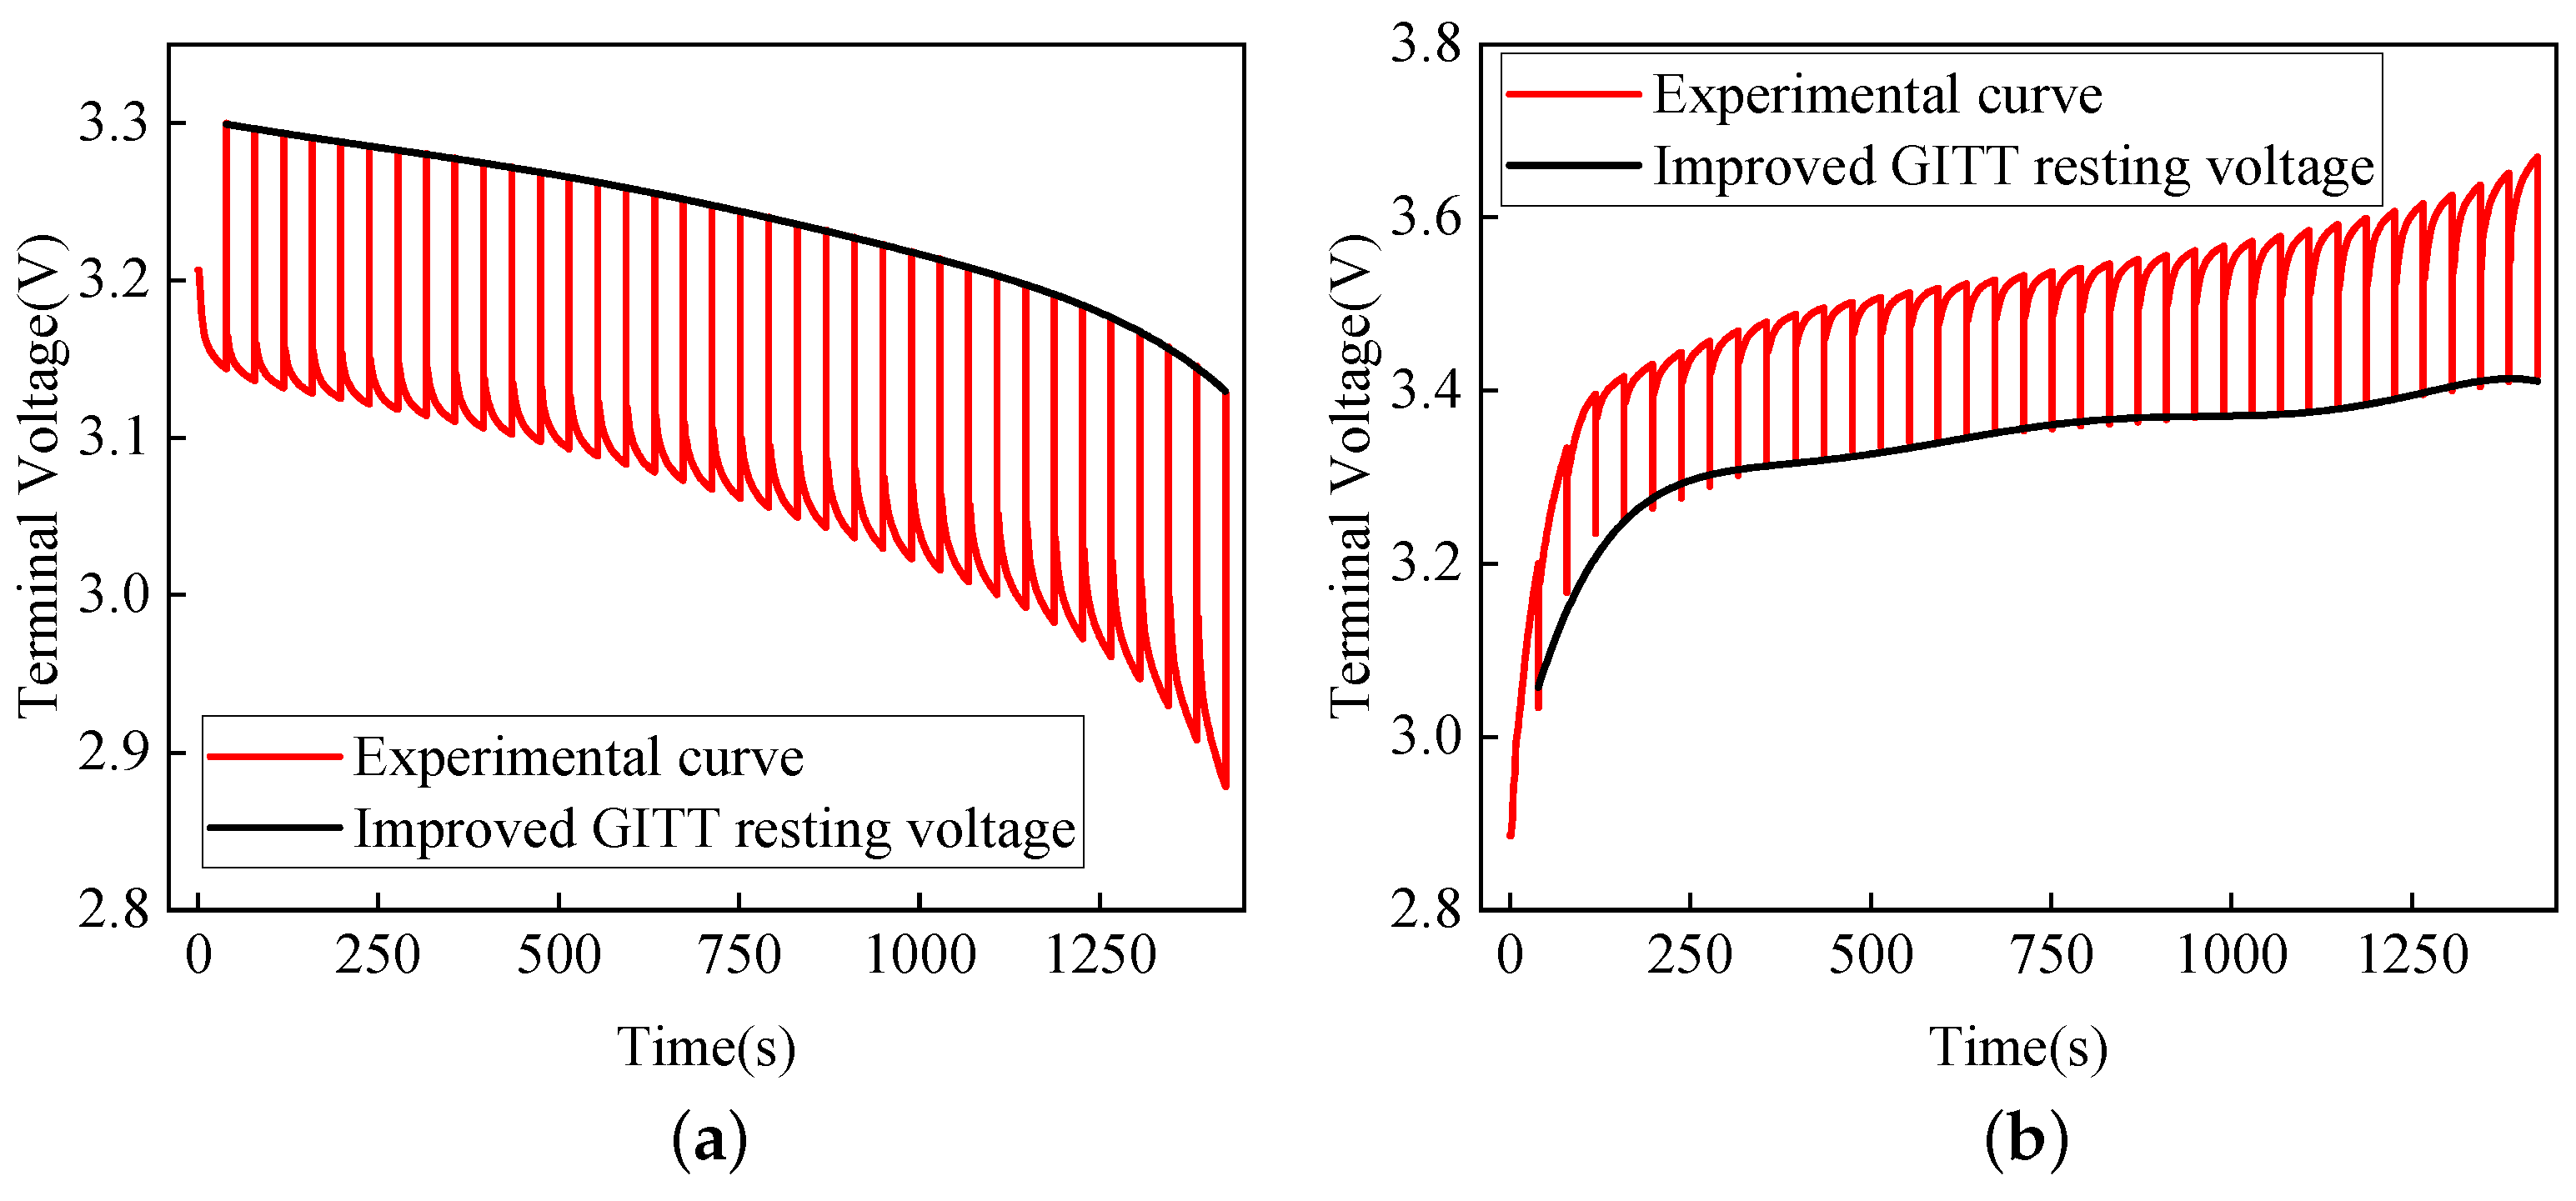
The experimental curve obtained by the improved GITT method is shown in
Figure 6. The black line indicates the terminal voltage of the battery after resting for 10 s following each charge–discharge period.
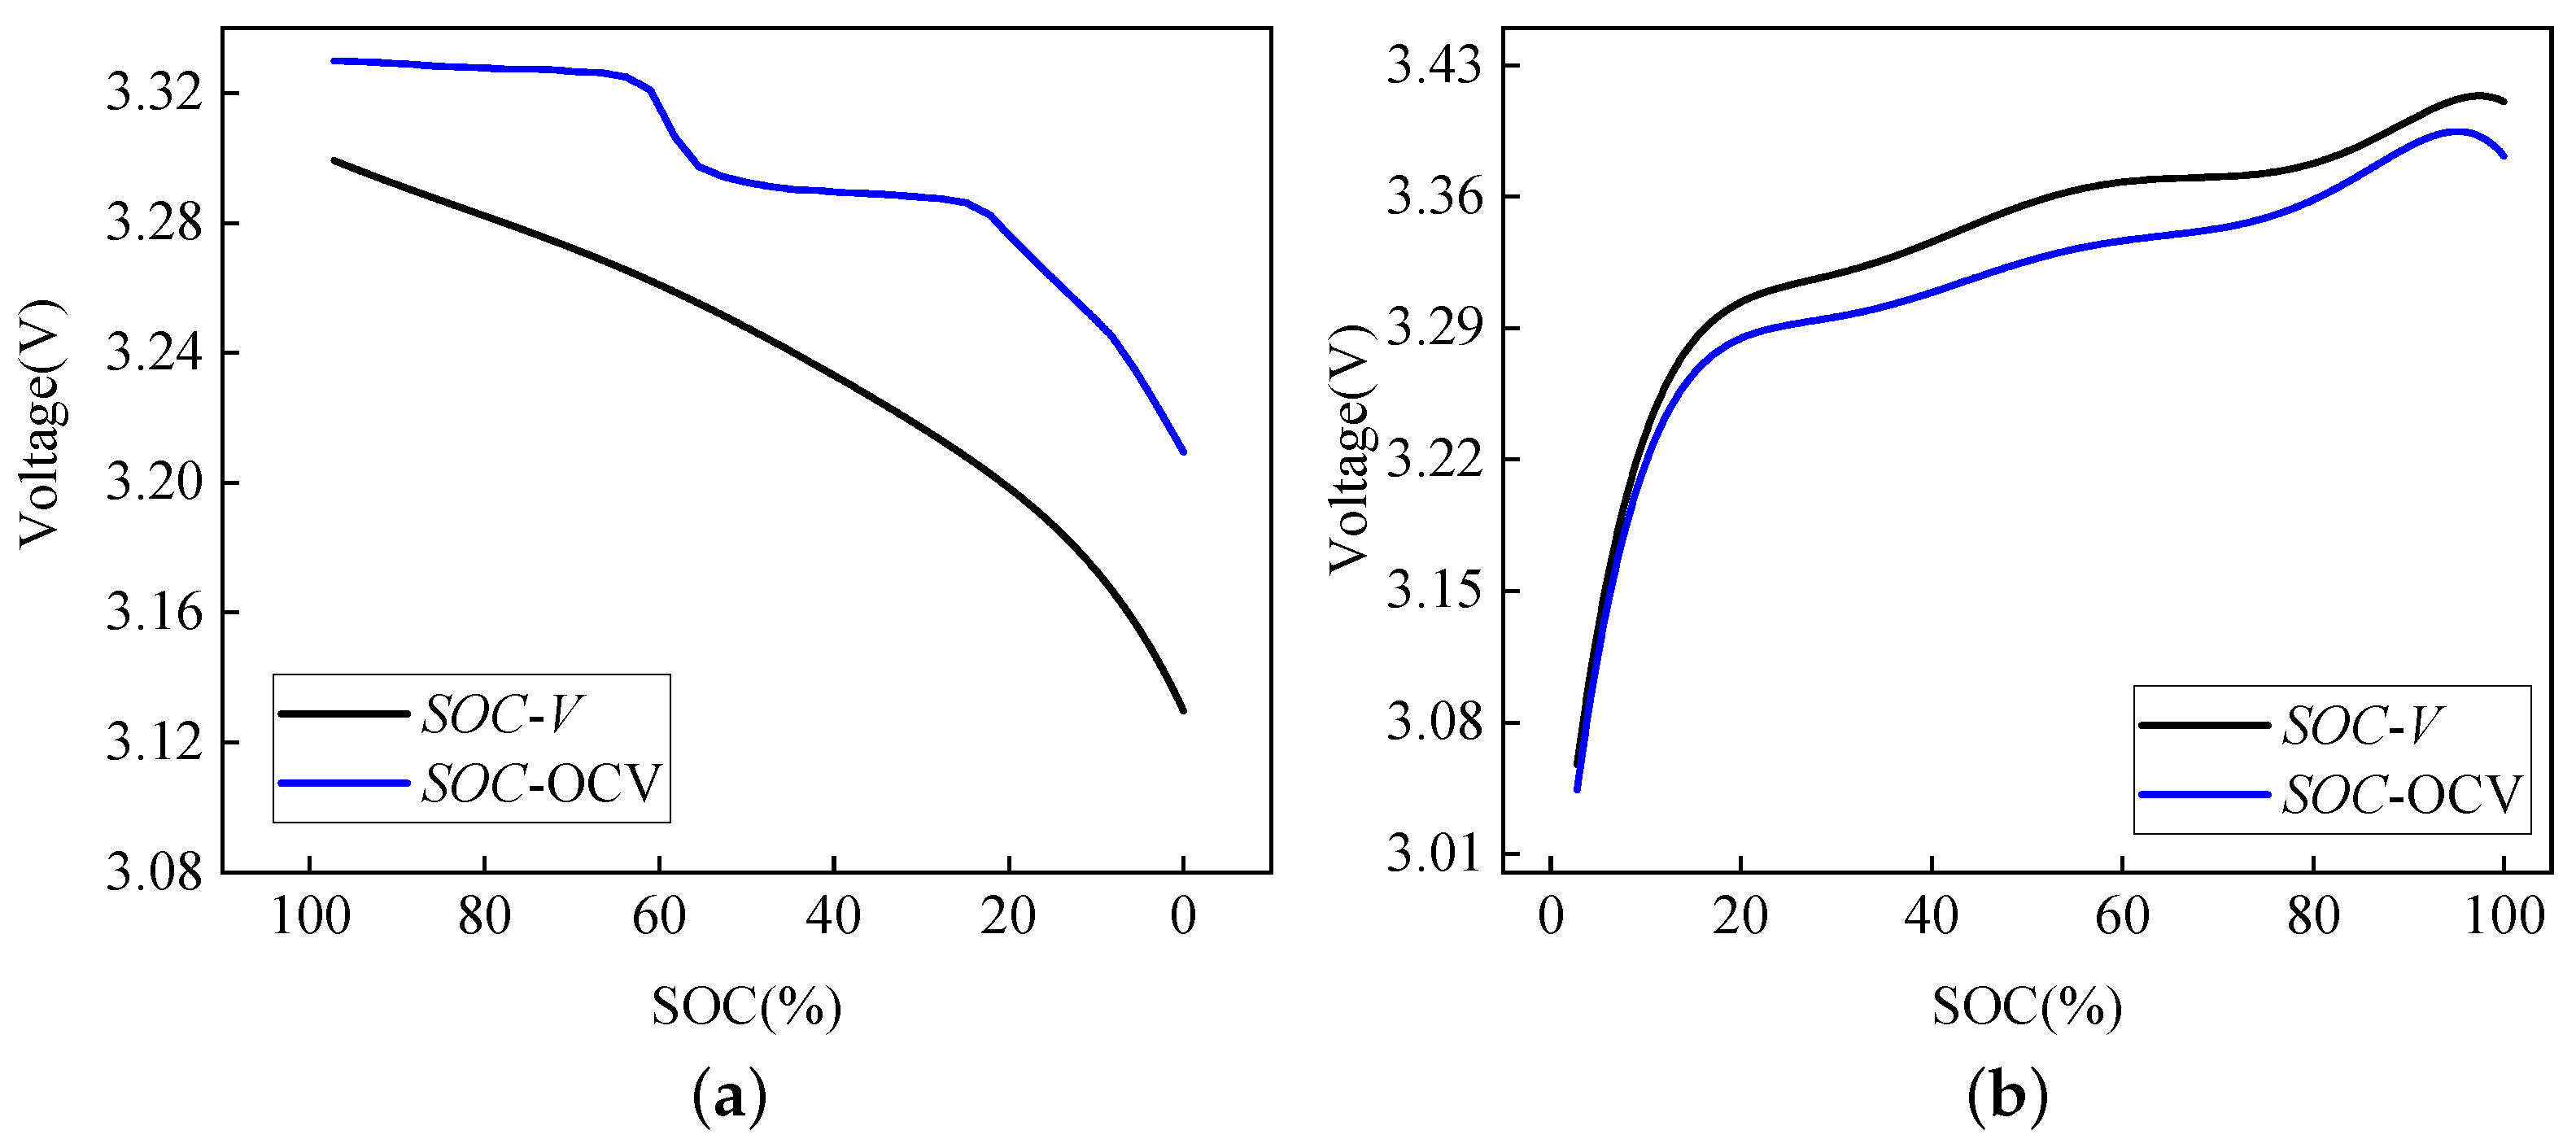
During the discharge and charge process, the fitting curves of
SOC-OCV were obtained under the standard GITT experiments (
Figure 7, black line), and the fitting curves of
SOC-V were obtained under the improved GITT experiments (
Figure 7, blue line).
With the improved GITT method, according to Equation (
1), the
V-dT/dV curves can be calculated directly, as shown in
Figure 8 (black line). However, with the standard GITT method, the temperature of the battery starts from room temperature in the beginning of each cycle. The
OCV-dT/dV curves calculated directly from the results based on the standard GITT method are obviously inaccurate. As batteries have similar characteristics under the same SOC, if the charging and discharging currents are the same, the temperature changes of the batteries are also similar. Therefore, by mapping the temperature of each sample point in the improved GITT experiment to the temperature in the standard GITT experiment at the same SOC, and then fitting the DTV curve according to Equation (
1),
OCV-dT/dV curves as shown in
Figure 8 (blue line) are obtained.
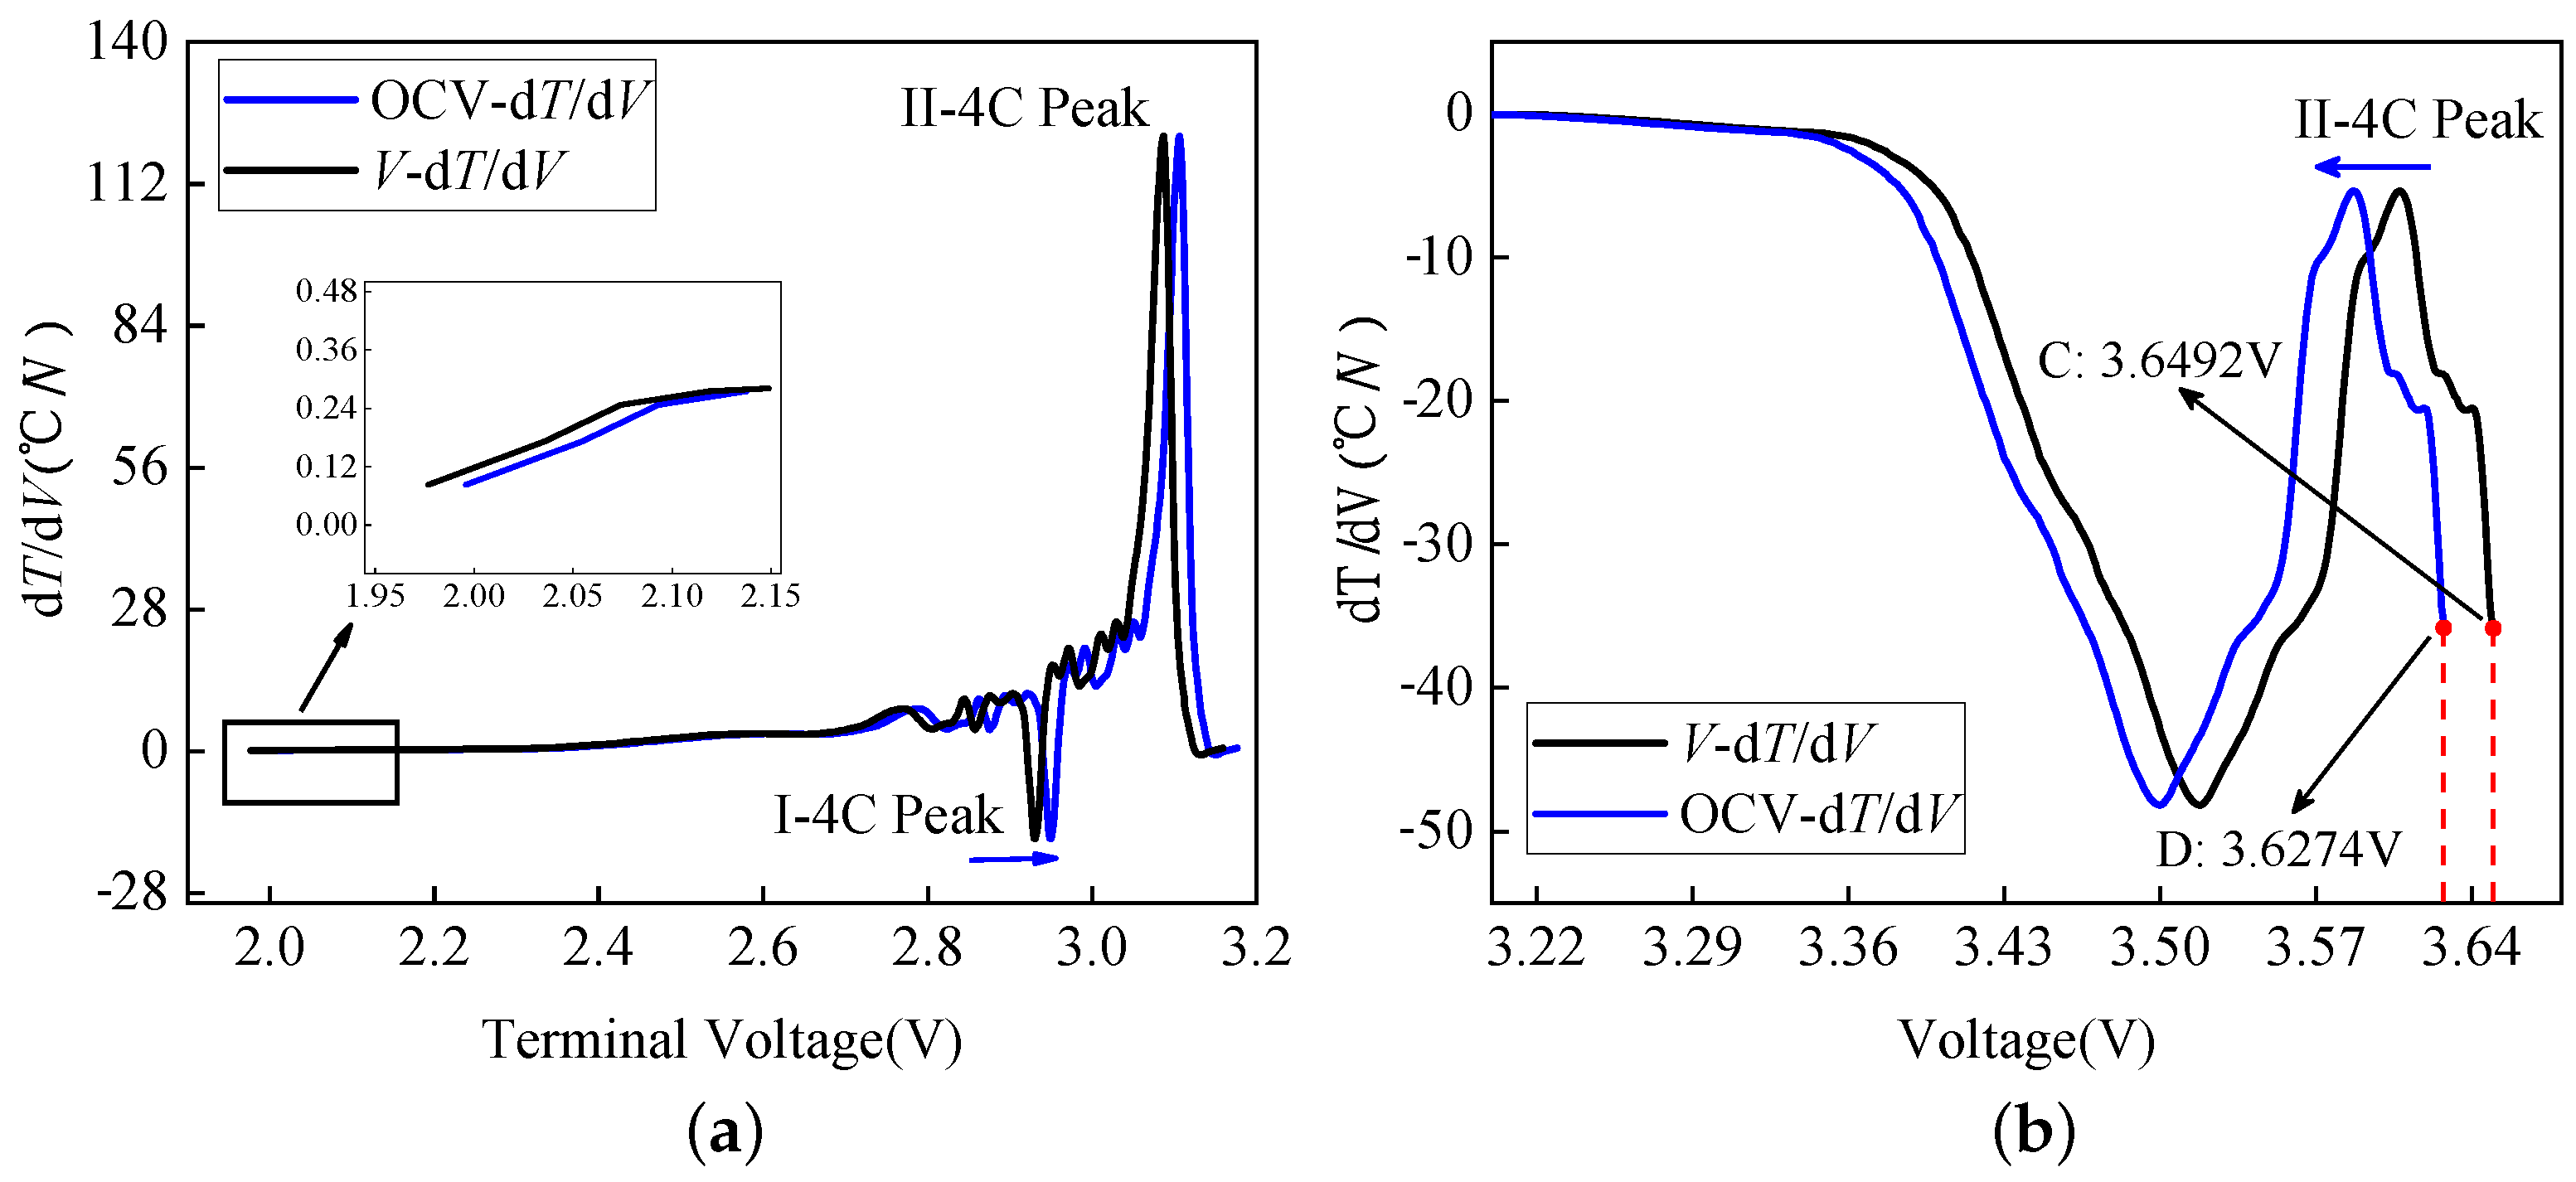
As can be seen from
Figure 8a, during the discharge process, the
OCV-dT/dV curve (blue line) moves to the right of the
V-dT/dV curve (black line) in the voltage axis. Additionally, the starting point of the
OCV-dT/dV curve, which represents the battery’s discharging cut-off point, is increased from point A to point B, as shown in the figure. During the charge process, the
OCV-dT/dV curve (blue line) moves to the left of the
V-dT/dV curve (black line) in the voltage axis. Additionally, the ending point of the
OCV-dT/dV curve, which represents the battery’s charging cut-off point, is decreased from point C to point D, as shown in
Figure 8b. If the two curves in the discharge and charge stages are combined for analysis, the whole curve after combination shows clearly the change of the battery’s discharge/charge cut-off voltage (from 1.9959 to 1.9970 V and 3.6492 to 3.6274 V, respectively). The boundary of the
OCV-dT/dV curve(1.9970–3.6274 V) is the normal operating voltage range of the battery under this condition. If the initial preset discharge and charge cut-off voltages (1.9959 and 3.6492 V, respectively) remain unchanged, the battery will be over-discharged and -charged, leading to battery aging.
4. DTV Adaptive
DTV adaptive aims to extract and compare the characteristic parameters of
V-dT/dV and
OCV-dT/dV curves in order to achieve the adaptive goal. DTV adaptive can be implemented by using Equation (
2):
in the equation,
is the DTV parameter of
V-dT/dV curve,
is the characteristic parameter offset caused by overpotential,
is the DTV parameter of
OCV-dT/dV curve, and
i is the SOH of the battery.
The SOH of the battery can be calculated by Equation (
3):
where
represents the current battery capacity and
represents the initial battery capacity.
The DTV parameters represent the parameters related to the terminal voltage and OCV, in which the DTV terminal voltage (V-dT/dV)-related parameters are the coupling result of the overpotential and the stoichiometric drift, and the DTV open-circuit voltage (OCV-dT/dV)-related parameters represent the stoichiometric drift. These two kinds of parameters include peak capacity of DTV, discharge and charge cut-off voltages and peak position of DTV.
In this section, the 1800 mAh batteries were used for 400 cycles of charging and discharging. The charge rate is 1C and the discharge rate is 2C. After every 50 cycles, a standard GITT test and an improved GITT test were performed to obtain V-dT/dV and OCV-dT/dV curves. Then, the DTV peak position, the discharge and charge cut-off voltages and the DTV peak capacity were calibrated, and 9 calibration points were obtained.
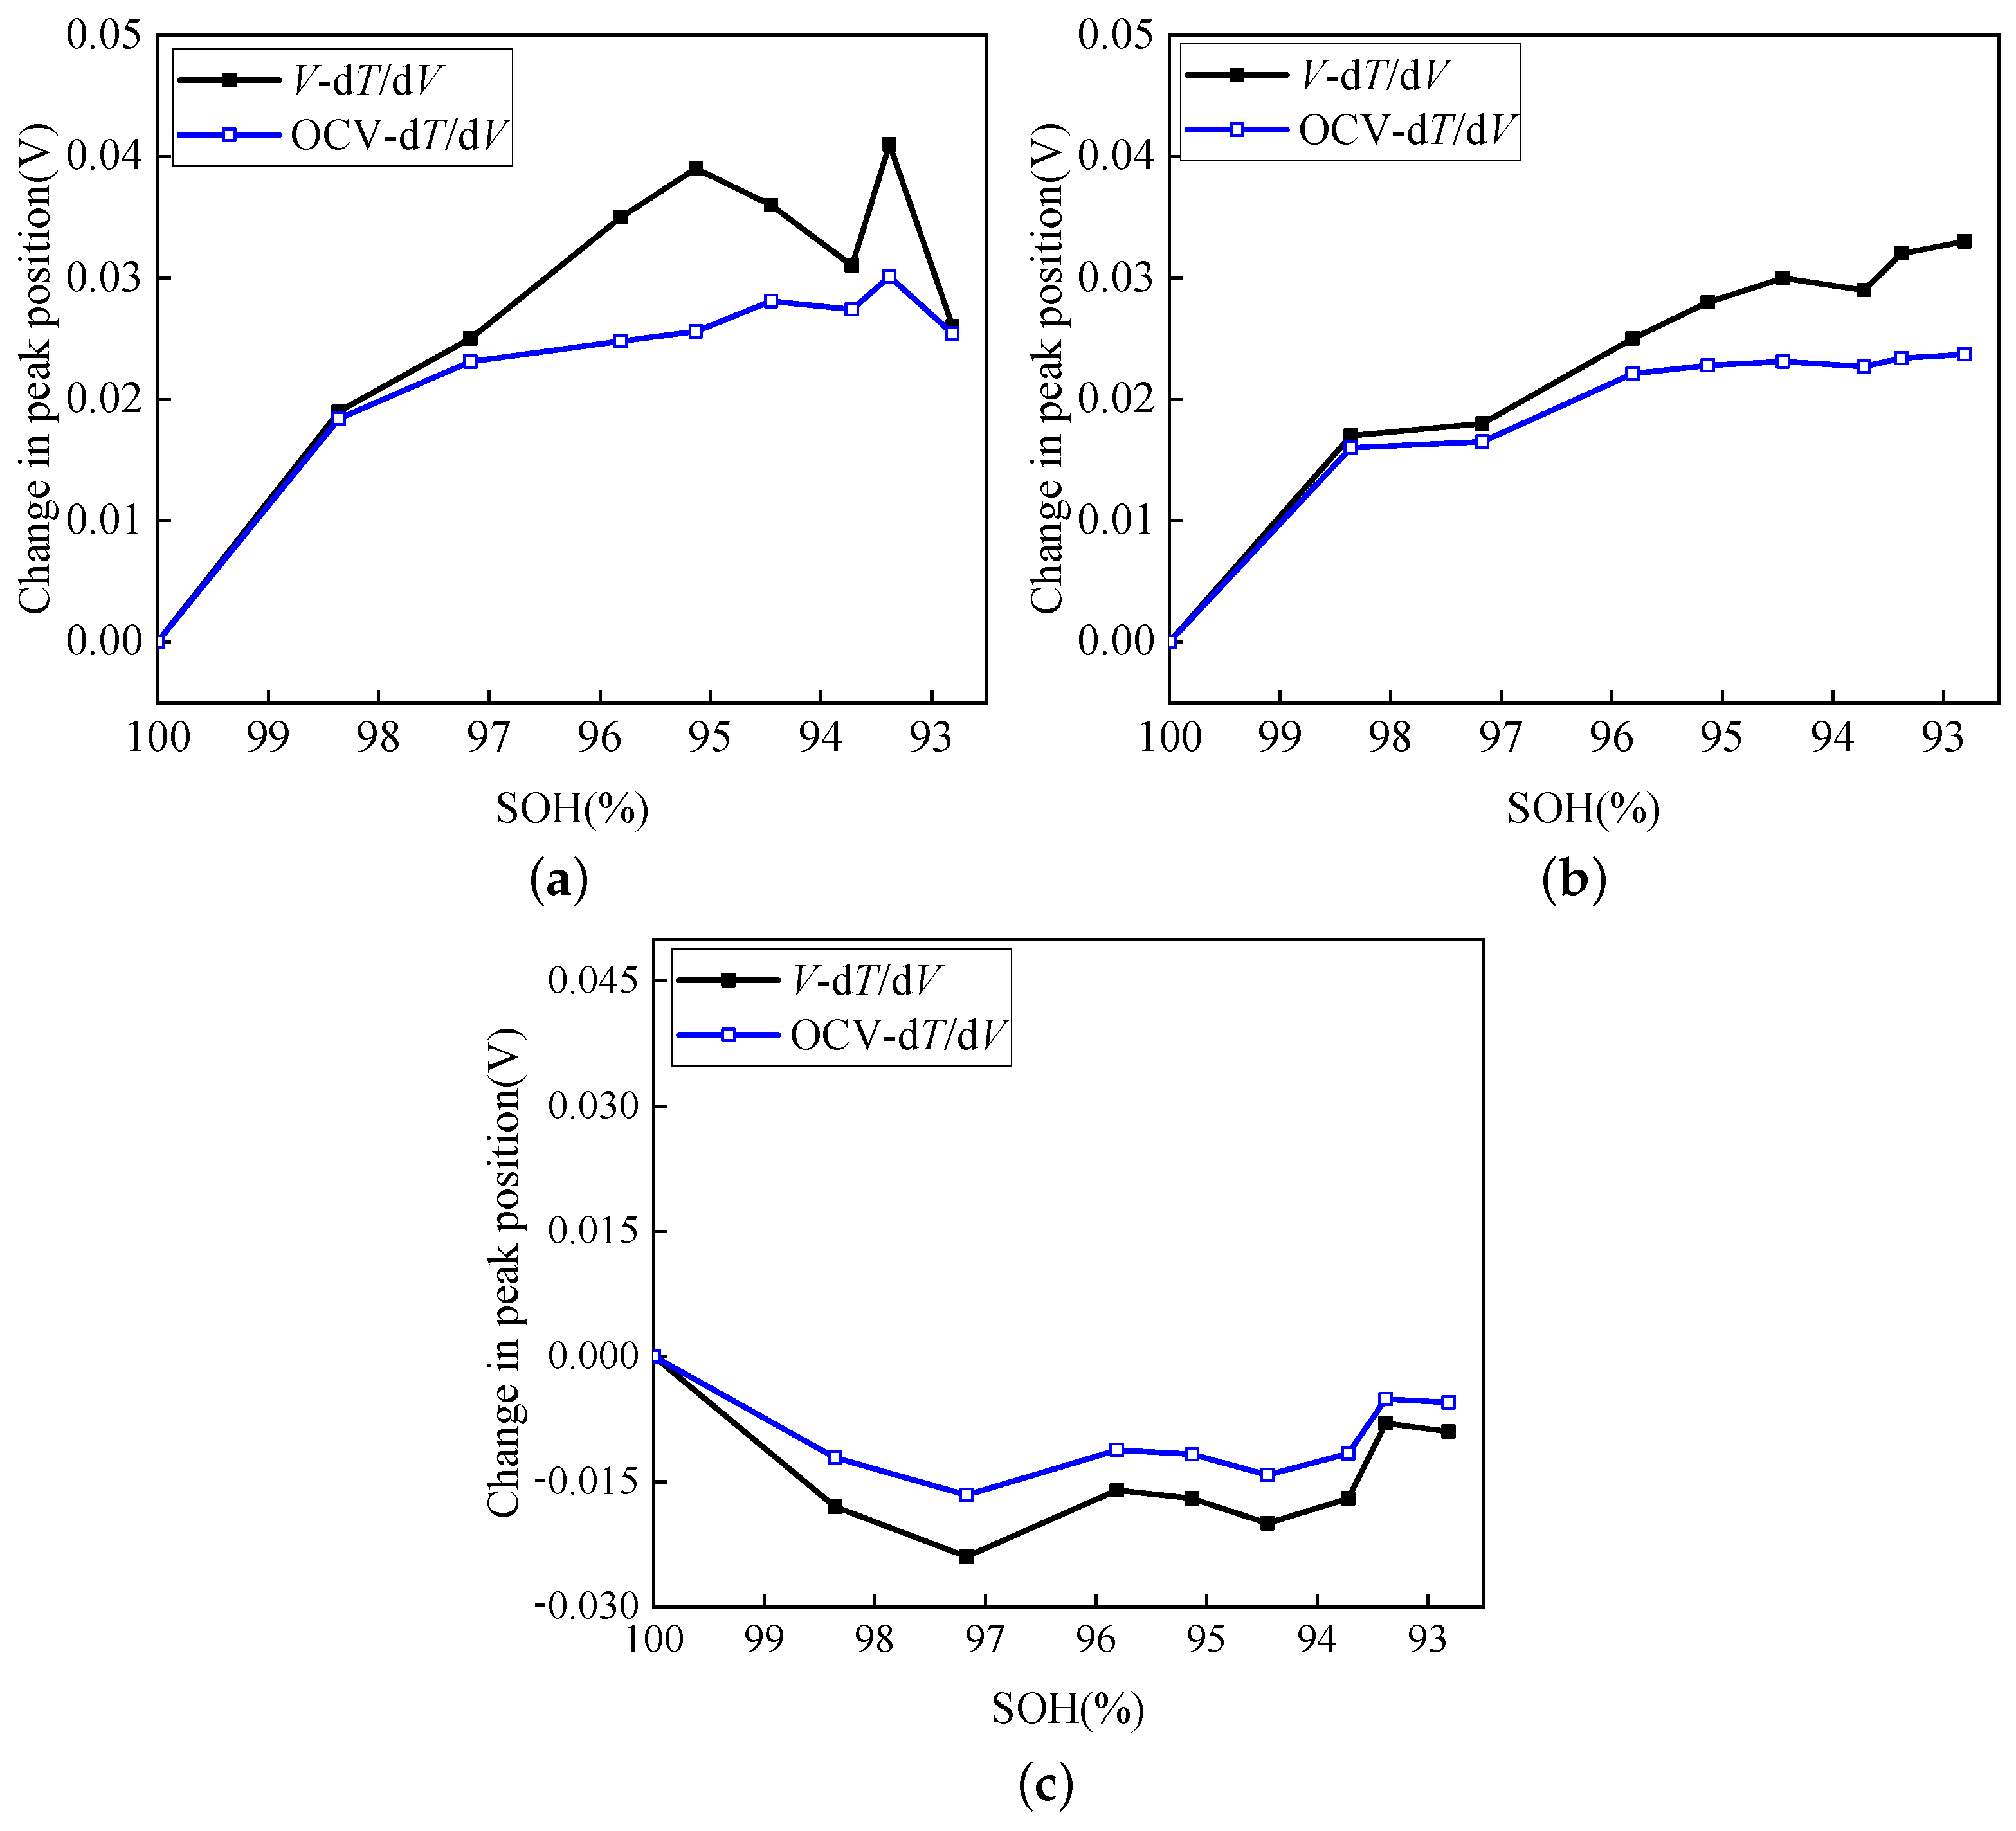
Taking the initial DTV peak position as the origin, the change of DTV peak position can be obtained.
Figure 9 shows the change in peak position from the two DTV curves—
V-dT/dV and
OCV-dT/dV. With the aging of the battery, the change of DTV peak position gradually slows down. The reason for this phenomenon is that the growth of the Solid Electrolyte Interphase (SEI) consumes parts of the lithium ions, which makes the stoichiometry change and leads to the change of peak position.
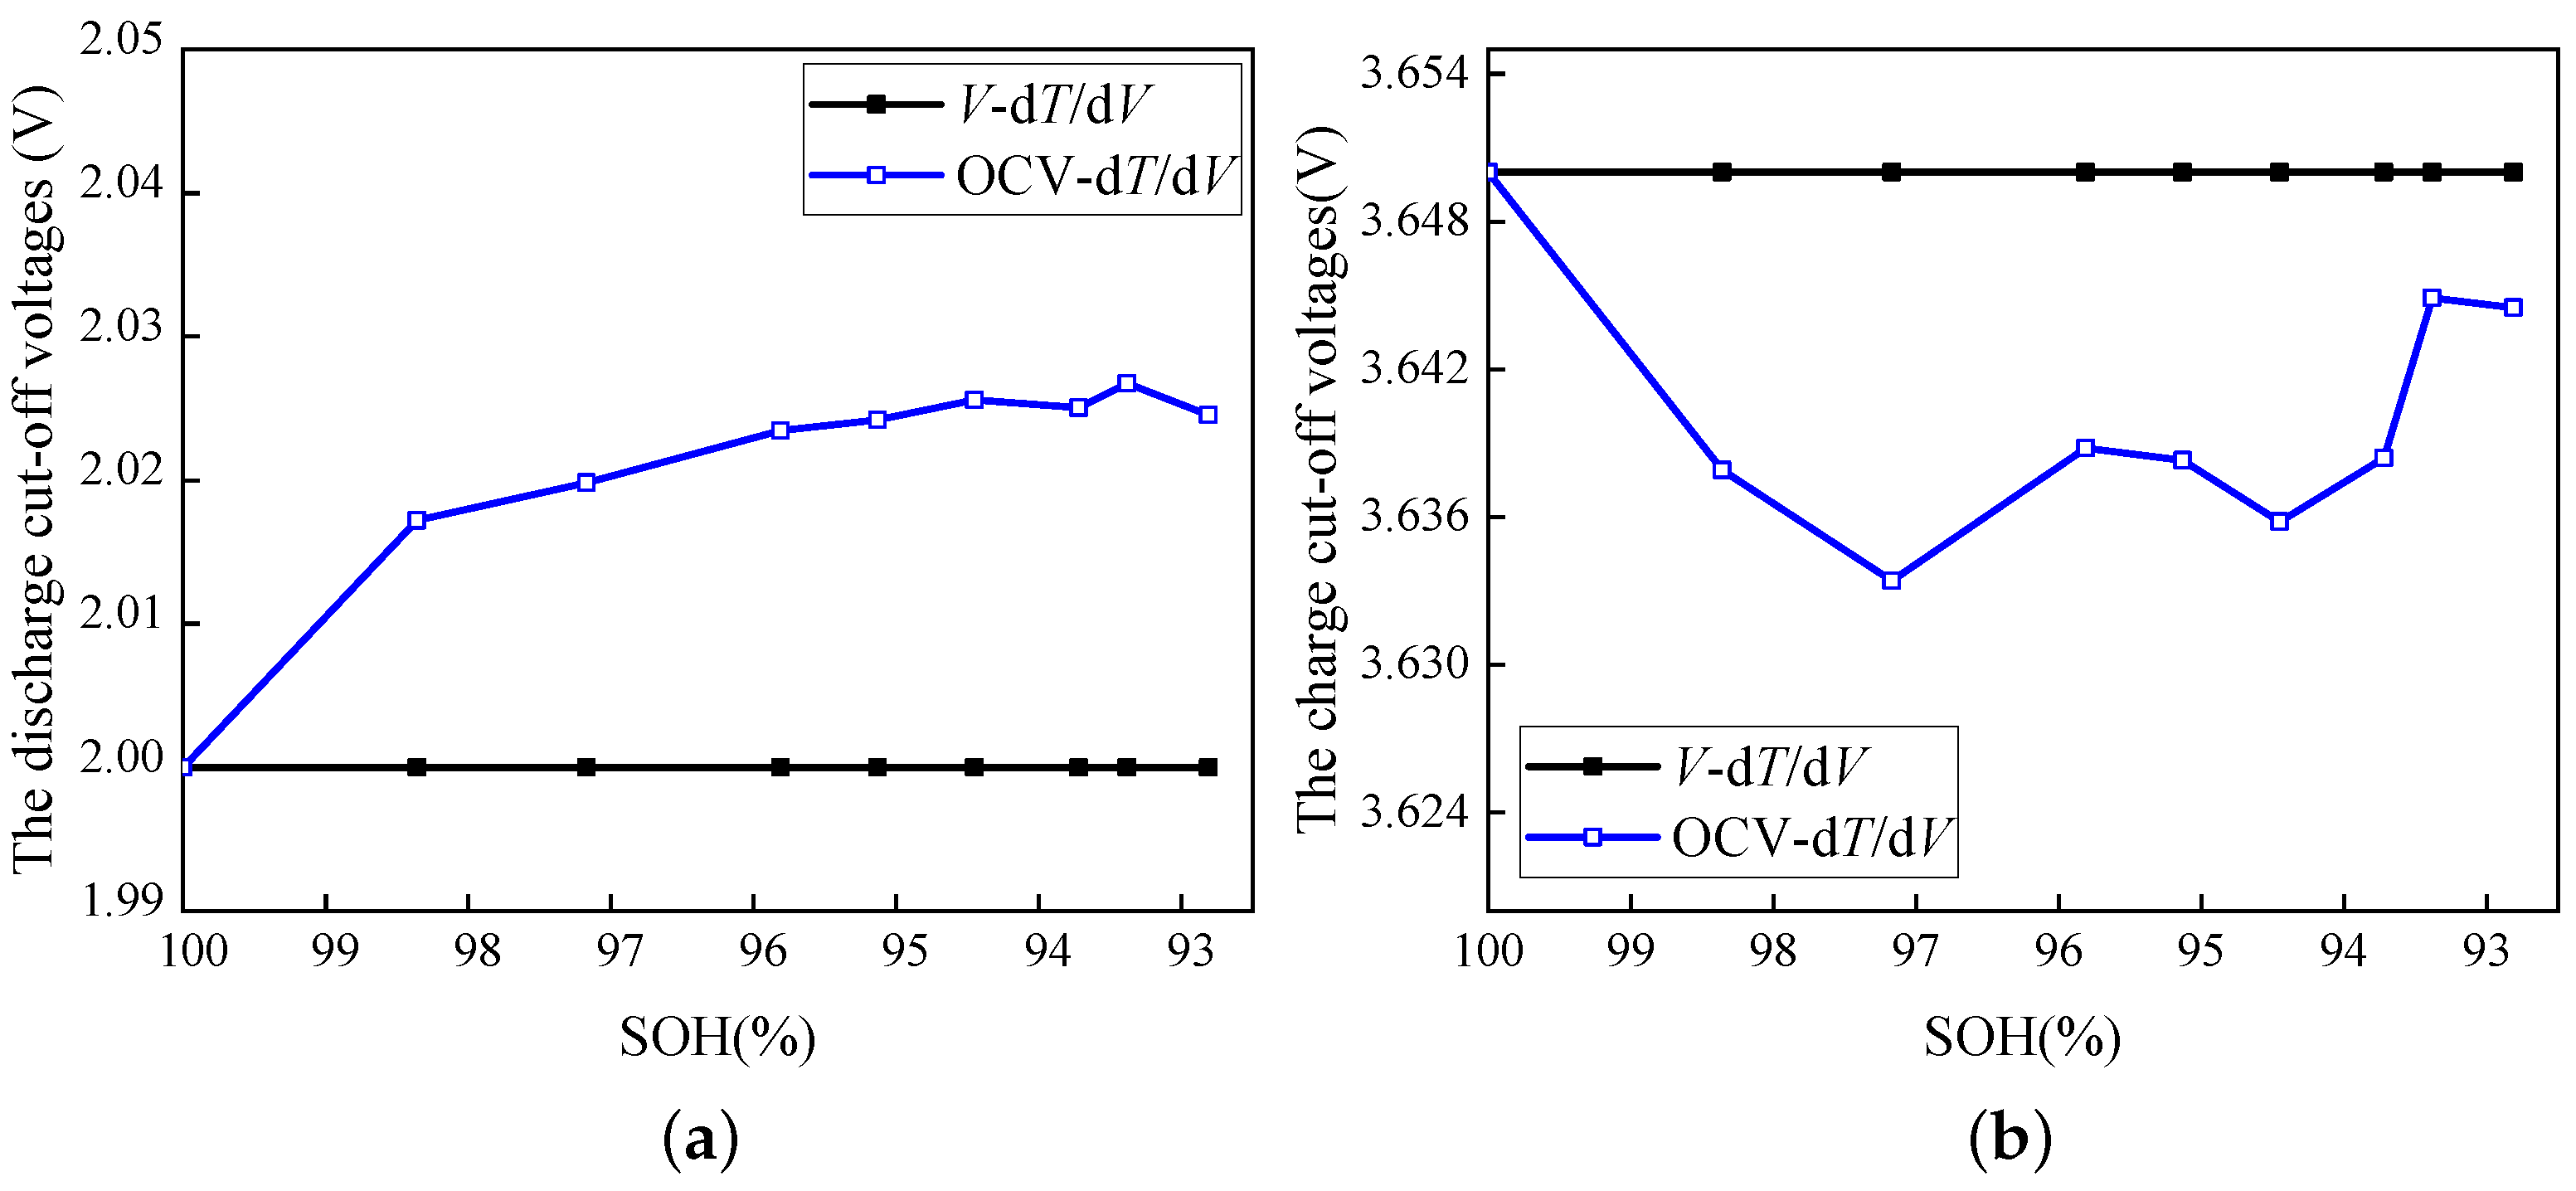
The discharge DTV curve moves toward the high-potential direction and the charge DTV curve moves toward the low-potential direction; the potential direction can be seen from
Figure 8. The discharge cut-off voltage is obtained according to the starting point of the discharge
OCV-dT/dV curve; the charge cut-off voltage is obtained according to the ending point of charge
OCV-dT/dV curve. Based on this, the discharge and charge cut-off voltages of the battery were obtained, as shown in
Figure 10.
The discharge and charge cut-off voltages of DTV are changed from 2.00 and 3.65 V to 2.023 and 3.633 V, respectively. The discharge cut-off voltage increases gradually in the discharge direction, while the charge cut-off voltage varies irregularly in the charging direction. This is due to the existence of various degradation mechanisms during the charging process, including Loss of Lithium Inventory (LLI) and Loss of Active Material (LAM) [
16], LLI shifts the peak to a higher potential, while LAM shifts the peak in the opposite direction. Therefore, the peak position offset is caused by the two decay mechanisms, which indicates that the peak position does not reflect the stoichiometric drift well when the battery is charged, but the charge cut-off voltage can still be determined by using Equation (
2).
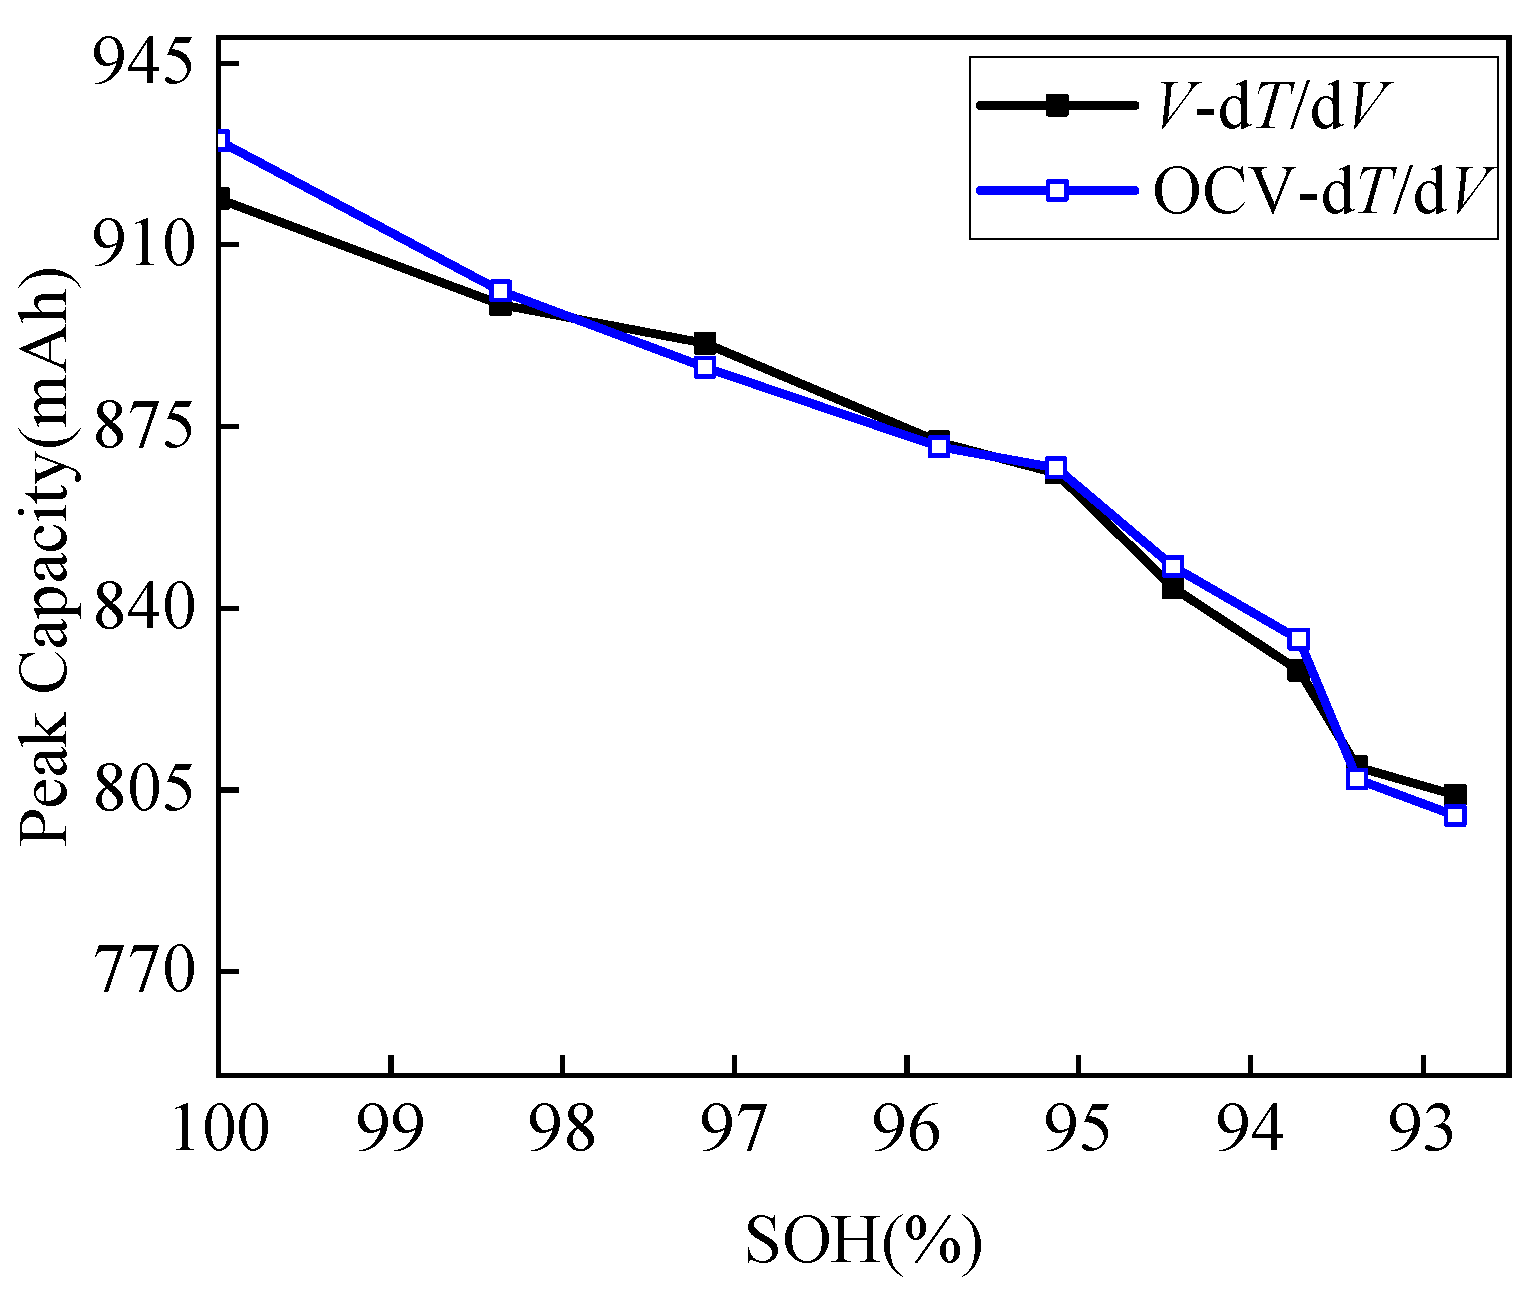
The peak capacity of I-4C and II-4C were compared before and after adaptive peak capacity, as shown in
Figure 11. The peak capacity of DTV is the difference between two peaks. It can be seen from the graph that the peak capacity before and after the adaption are almost constant, which indicates that the capacity attenuation caused by stoichiometric drift is small.
5. Adaptive Experimental Design
In
Section 4, the variations of peak capacity, peak position and the discharge and charge cut-off voltages of DTV before and after adaption are discussed. In order to verify the effect of the change of the discharge and charge cut-off voltages on the battery life, the 1800 mAh
batteries were divided into five groups for DTV adaptive experiments, with a total of 270 cycles. The experimental conditions are shown in
Table 1.
In
Table 1, “Adaptive” means using the results of adaptive cut-off voltage of Group 1 to determine the discharge and charge cut-off voltages of Group 2 and Group 3 under the current aging state. The cut-off voltages for Group 4 and Group 5 were maintained at the values set in
Table 1.
Groups 2–5 were subjected to 3C rate cyclic charge–discharge aging experiments. Every 30 cycles, the cut-off voltage of Group 2 and Group 3 was adapted, keeping the cut-off voltage of Group 4 and Group 5 unchanged. The specific experimental conditions of Group 1 are shown in
Figure 12. Among them, the details of the standard GITT experiment and the improved GITT experiment are shown in
Section 3 and
Figure 4; the details of the capacity calibration experiment are shown in
Figure 12b. SOH is defined as the ratio of the current capacity to the initial capacity, which can be calculated from the results of the capacity calibration experiment, as shown in Equation (
3). The other groups carry out the cyclic aging experiments under the same conditions and carry out a total of nine adaptions.
6. Experimental Results and Analysis
Using the analysis method in
Section 1,
Section 2 and
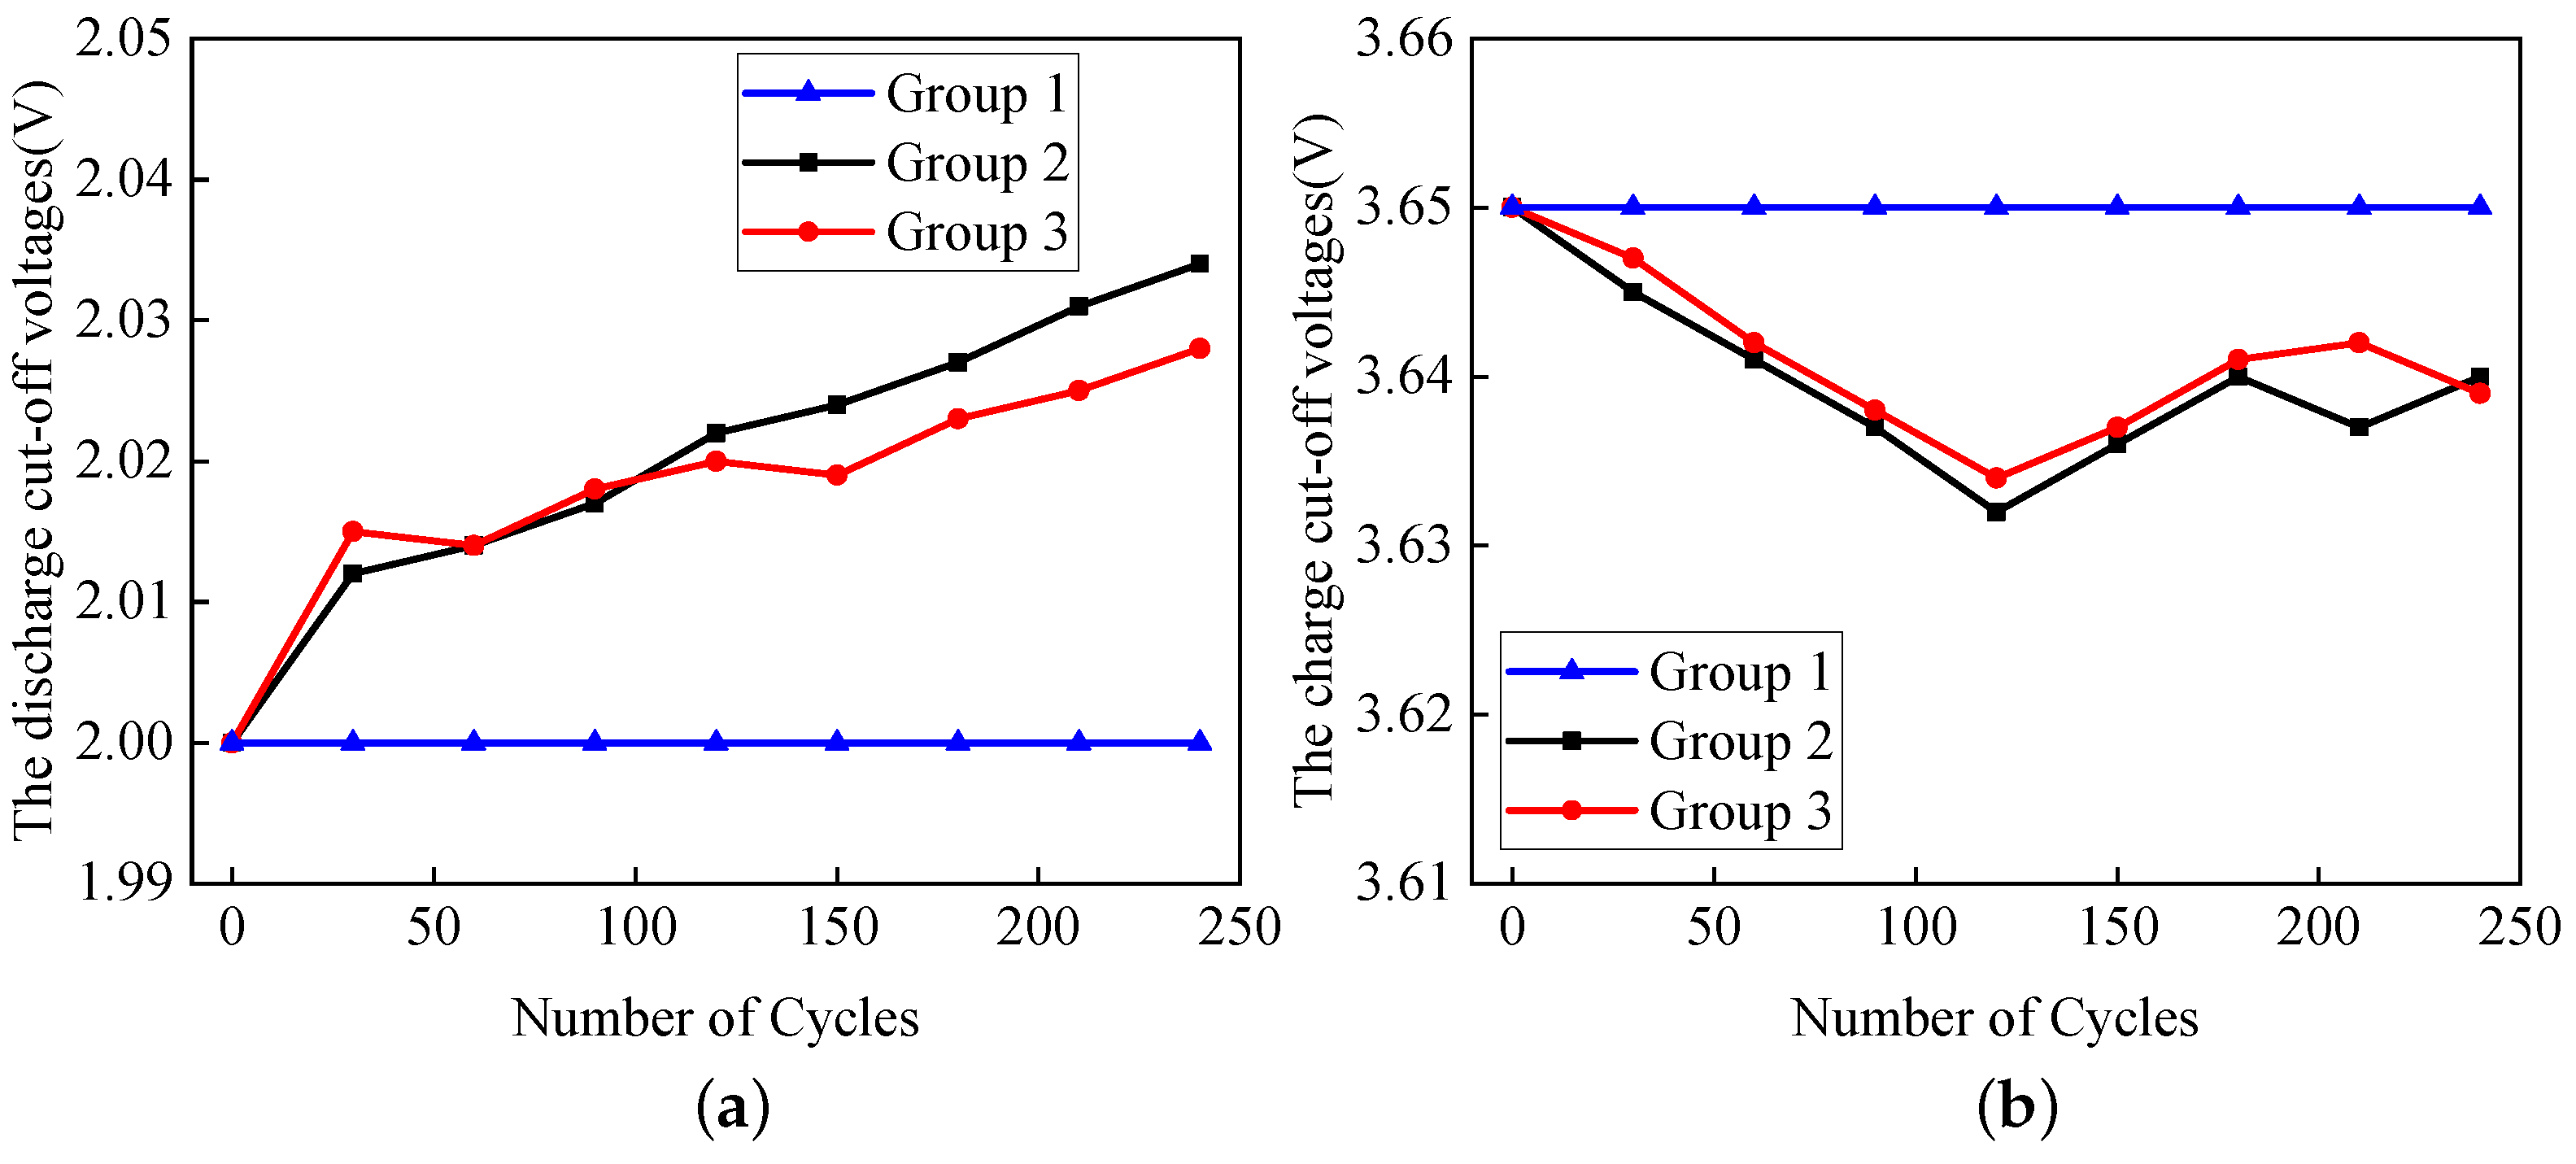
Section 3, the discharge and charge cut-off voltages of Group 2 and Group 3 after the adaptions were obtained as shown in
Figure 13. As can be seen from the diagram, the discharge cut-off voltage were about 30 mV, and the charge cut-off voltages were within 20 mV. Compared with the 100 mV of Group 4 and Group 5, the discharge and charge cut-off voltages after adaption had a smaller degree of change.
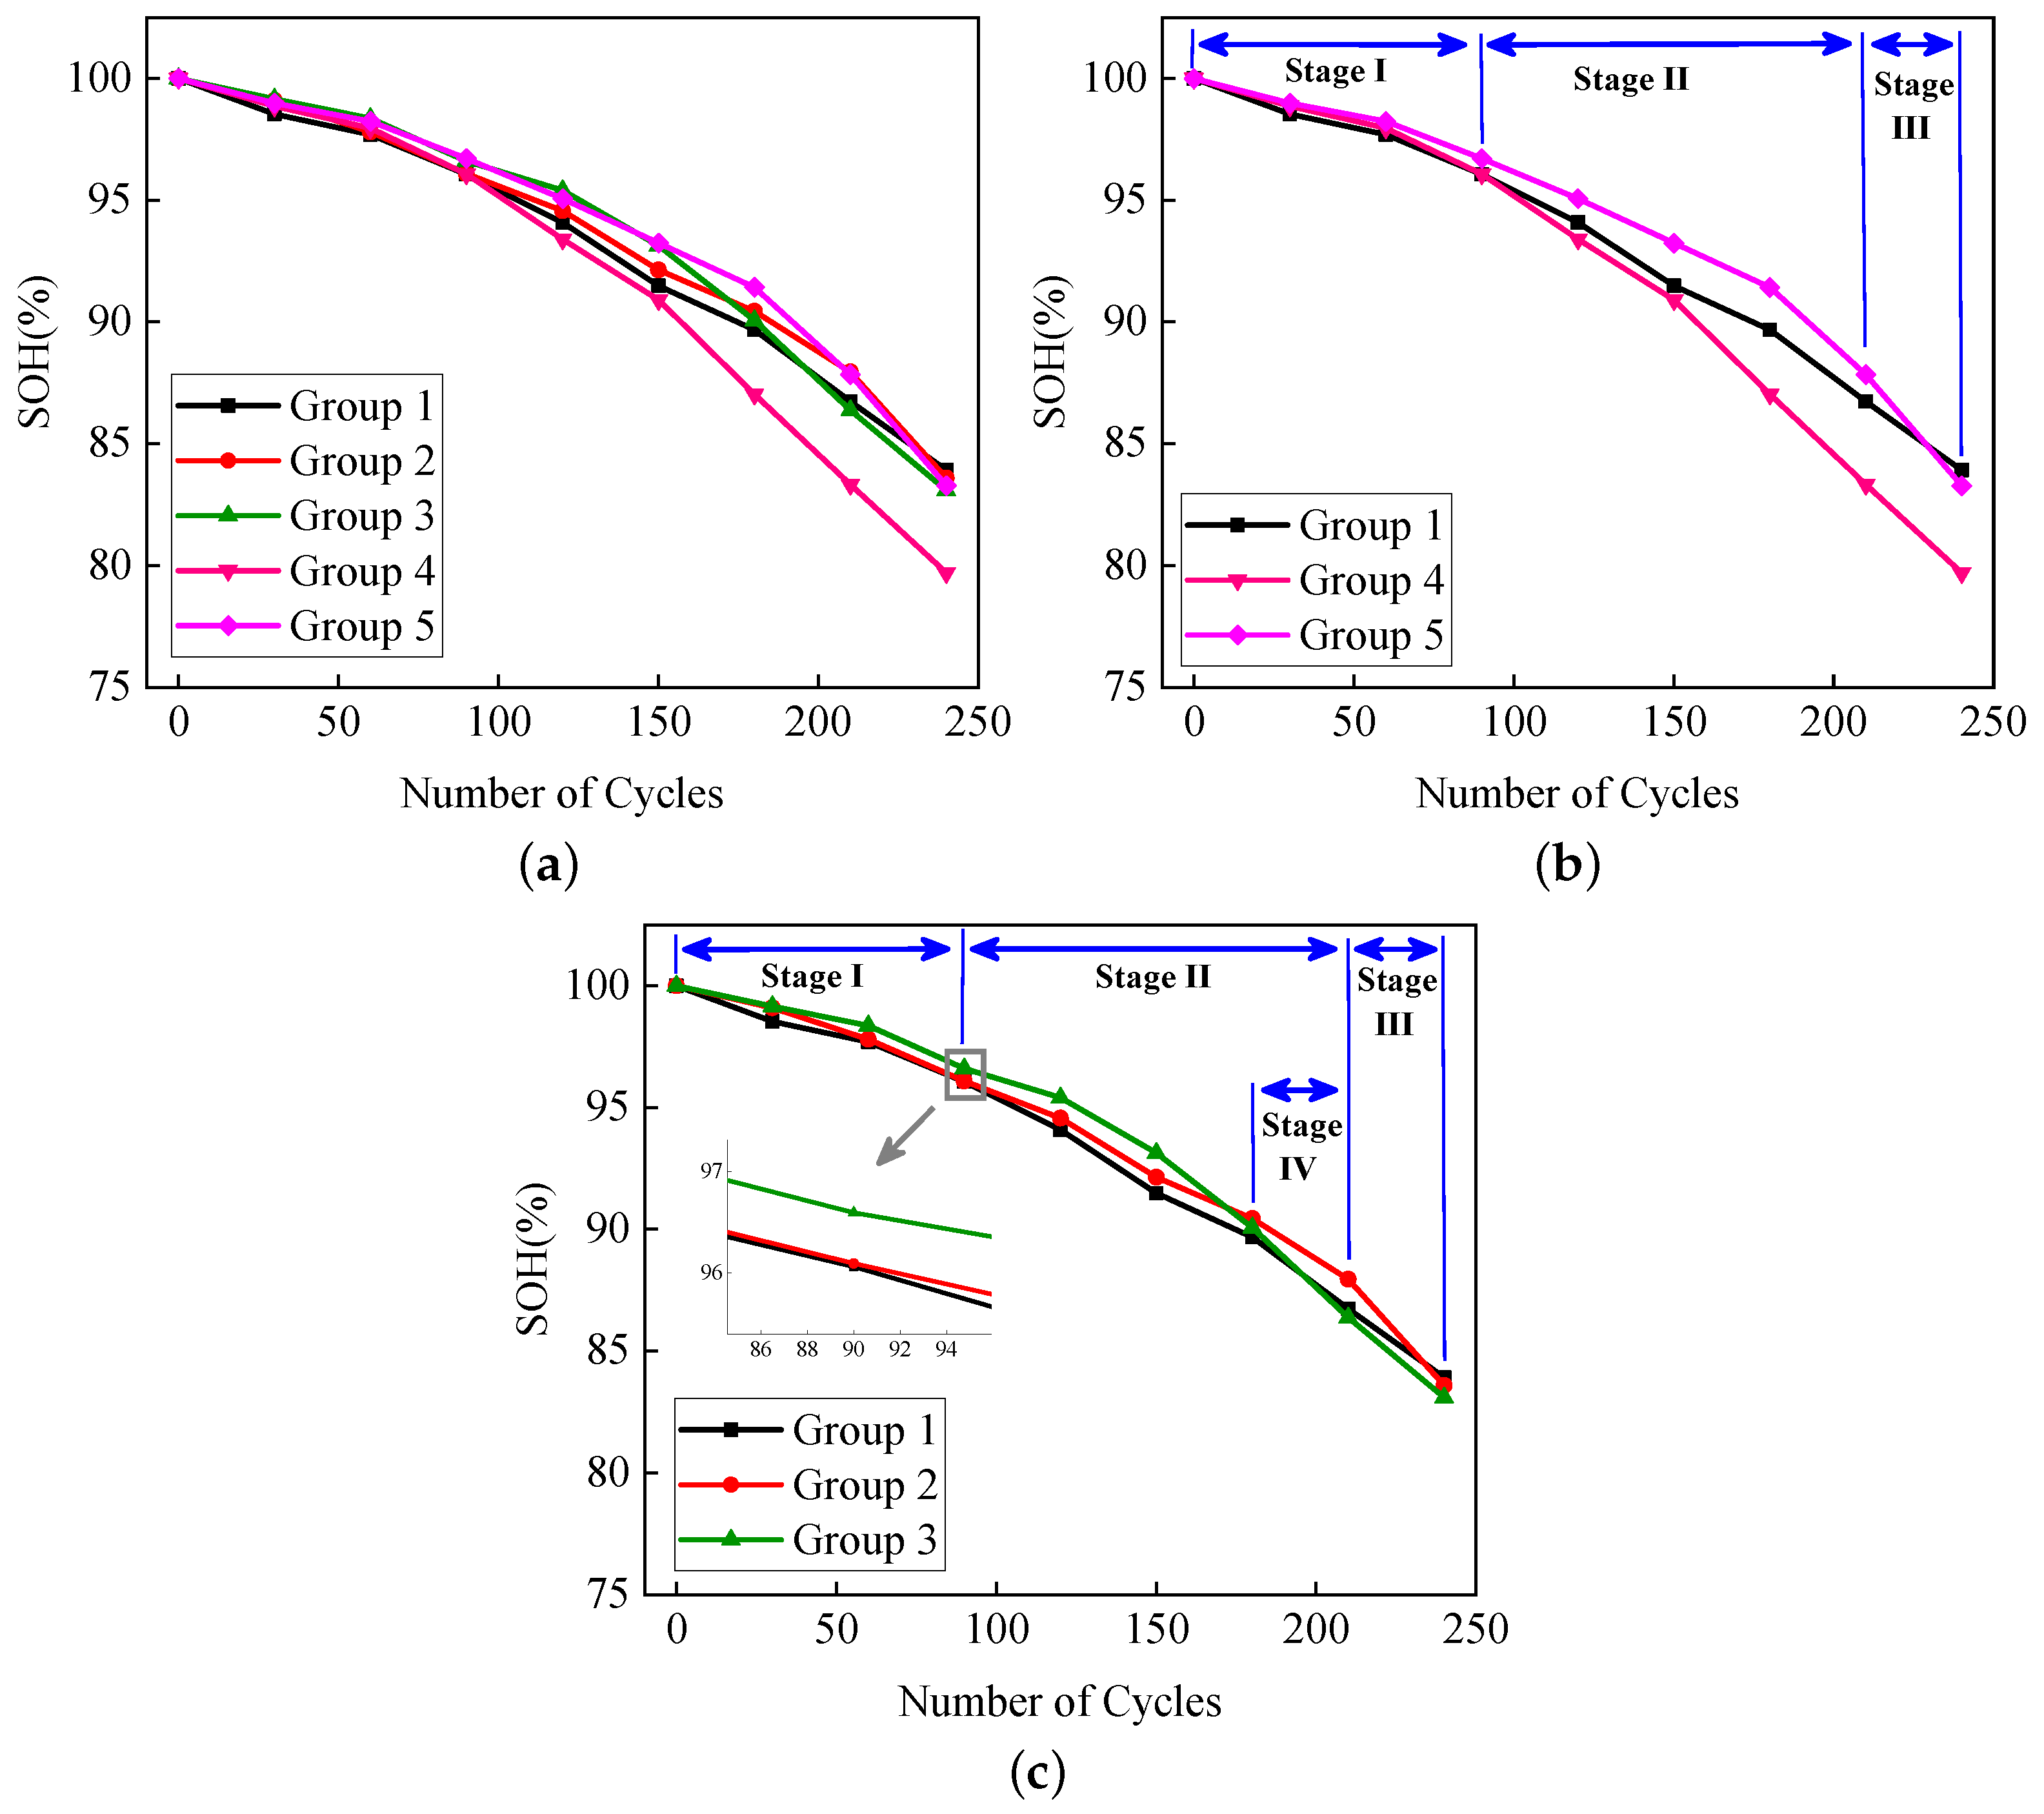
According to experimental results, the capacity degradation diagrams of all batteries are drawn in
Figure 14a. Comparing the experimental results of Groups 1, 4 and 5, among which a certain difference exists in the discharge and charge cut-off voltages, it was found that the the capacity degradation is divided into three stages, as shown in
Figure 14b. In
Stage I (0–90 cycles), increasing/decreasing the discharge and charge cut-off voltages had no significant effect on the battery decay rate, which means that there is no obvious difference in SOH of the three groups. In
Stage II (90–210 cycles), by decreasing the discharge and increasing the charge cut-off voltages (Group 4), the decay rate of the battery obviously accelerated, leaving the SOH of Group 4 worse than that of Group 1, while, by increasing the discharge and decreasing charge cut-off voltages (Group 5), the decay rate of the battery slowed down, leading to a better SOH of Group 5 compared with that of Group 1. In
Stage III (210–240 cycles), by decreasing the discharge and increasing charge cut-off voltages (Group 4), the decay rate of the battery is still larger than that of Group 1. However, by increasing the discharge and decreasing charge cut-off voltages (Group 5), the decay rate of the battery changed from being smaller to larger compared with that of Group 1, leaving the SOH of Group 5 worse than that of Group 1.
Comparing the experimental results of Group 2 and Group 3, it was found that, in
Stage I and
III, adapting the discharge and charge cut-off voltages has a non-monotonous effect on the battery’s degradation rate. It is speculated that, in these two stages, other factors, including temperature, the battery’s chemical composition, etc., have joint effects on the battery’s aging, while, in
Stage II, the effect of adapting discharge and charge cut-off voltages on the battery’s degradation rate is more obvious. Thus, we focus on
Stage II. It can be seen from
Figure 14c that adapting discharge and charge cut-off voltages slows down the decay rate of the battery in
Stage II. However, at the end of
Stage II (
Figure 14c,
Stage IV), Groups 2 and 3 show different trends. The decay rate of the battery in Group 2 is still smaller than that of Group 1, leaving the SOH of Group 2 better than that of Group 1, while the decay rate in Group 3 gradually increased, leading to a similar SOH with that of Group 1 at the end of
Stage IV.
In order to quantitatively analyze the change of SOH of the battery, the experimental results for Group 2–Group 5 are processed according to the following equation:
in the equation, the
represents the change of SOH,
i represents the number of experimental groups, and
k represents the number of cycles. Based on (4), every 30 cycles, the differences in SOH of Group 1 and Groups 2–5 are calculated. Then, the decay rate of
after the
kth cycle can be calculated according to Equation (
5) and the results are shown in
Table 2.
in the equation, the
represents the decay rate of
of the
ith group battery after the
kth cycle.
The positive value (“+”) indicates that, under the same operating conditions, the degradation of the battery is slower compared with Group 1. The negative value (“−”) indicates that the battery degrades more rapidly under the same operating conditions.
From the
values of Group 4 and Group 5, it can be seen that the
values of Group 4 and Group 5 are all positive (“+”) in
Stage I, which shows that monotonously enlarging or narrowing the battery’s operational voltage range will lead to slower degradation of the battery than that of Group 1. In
Stage II, when enlarging the battery’s operational voltage range (Group 4), except the initial point,
is negative (“−”), which highlights the accelerated decay rate of the battery. When narrowing the operational voltage range (Group 5), the
is positive (“+”), which highlights the slowing down of the decay rate of the battery. In
Stage III, the
of Group 4 and Group 5 are all negative (“−”), which shows that both enlarging and narrowing the operational voltage range leads to rapid degradation of the battery. It can be seen that the conclusion from
Table 2 is the same with that from
Figure 14b.
It is also found in
Table 2 that the
of Group 2 is positive (“+”) in
Stage II, which indicates that the decay rate of the battery is smaller compared with that of Group 1. The
of Group 3 is positive (“+”) except for the last point at the end of
Stage II, which shows that the battery decays at a slower rate.
Through the analysis of the experimental results, it was found that the adaptive method to change the discharge and charge cut-off voltages can effectively slow down the decay rate of the battery in the stage where the decay rate is sensitive to the change of the discharge and charge cut-off voltages (Stage II). Thus, this method can improve the cycle life of the battery.
7. Conclusions
Based on the improved GITT experiment, this paper studies the adaptive DTV of li-ion batteries.
(1) The relationship between V-dT/dV and OCV-dT/dV was obtained by the improved GITT method, and the new characteristic parameters were determined by the DTV adaptive method. The influence of stoichiometric drift on the change of characteristic parameters of DTV before and after adaption were analyzed, which shows the discharge and charge cut-off voltage increases and decreases, respectively, after adaption.
(2) According to the experimental results, it can be concluded that in the beginning of the battery’s life cycle, decreasing/increasing the discharge/charge cut-off voltage will lead to slower degradation of the battery. When it comes to the end of the battery’s life, decreasing/increasing the discharge/charge cut-off voltage will lead to rapid degradation of the battery. The other way around, increasing/decreasing the discharge/charge cut-off voltage, will not lead to a mono-directional change of battery’s aging at the beginning and the final stage.
(3) In the middle of the battery’s life-cycle, the adaptive method to change the discharge and charge cut-off voltages can effectively slow down the degradation of the battery. Thus, the adaptive method proposed in this paper can be applied in the middle of the battery’s lifetime.


 ,
, 


