Article

Effect of Microwave Pulses on the Morphology and Development of Spark-Ignited Flame Kernel

1
State Key Laboratory of Coal Combustion, Huazhong University of Science and Technology, Wuhan 430074, China
2
School of Energy and Power Engineering, Huazhong University of Science and Technology, Wuhan 430074, China
3
Henan Key Laboratory of Photoelectric Energy Storage Materials and Applications, School of Physics and Engineering, Henan University of Science and Technology, Luoyang 471023, China
4
Department of Mechanical Engineering, University of California—Berkeley, Berkeley, CA 94720, USA
*
Author to whom correspondence should be addressed.
Energies 2021, 14(19), 6205; https://doi.org/10.3390/en14196205
Submission received: 13 August 2021 / Revised: 23 September 2021 / Accepted: 24 September 2021 / Published: 28 September 2021
(This article belongs to the Special Issue Advanced Engine Technologies and Fuels)

Abstract

:
Microwave-assisted spark ignition (MAI) is a promising way to enhance the ignition performance of engines under lean conditions. To understand the effect of microwave-induced flow during MAI, the development and morphology of spark-ignited methane-air flame kernel under various microwave pulse parameters are experimentally studied. Experiments are conducted in a constant volume combustion chamber, and flame development is recorded through a high-speed shadowgraph method. Flame area and deformation index are adopted to evaluate the flame characteristic. Results show that increasing the microwave pulse energy from 0 to 150 mJ exhibits a threshold process for expanding the flame kernel area under 0.2 MPa ambient pressure. When the pulse energy is below the threshold of 90 mJ, the microwave enhancing efficiency is much lower than that beyond the threshold. Increasing microwave pulse repetition frequency (PRF) changes the flow on flame surface and raises the absorption efficiency for microwave energy, and thus helps to improve the MAI performance under higher pressures. Hence, 1 kHz pulses cause more obvious flame deformation than those with higher PRF pulses under 0.2 MPa, while this tendency is reversed as the ambient pressure increases to 0.6 MPa. Besides, microwave pulses of different repetition frequencies lead to different flame kernel morphology, implying the various regimes behind the interaction between a microwave and spark kernel.

Graphical Abstract

1. Introduction

Lean burn, an efficient method to reduce the NOx emissions while improving the fuel consumption of spark ignition engines [1,2], has drawn significant attention from the automobile and aerospace industry. However, the very lean mixture also leads to ignition instability and cycle to cycle variability due to the fluctuations during the flame kernel growth. An inevitable challenge for this low-NOx-CO2 combustion strategy is to ensure the ignition stability and the relight capacity particularly in aero-engines [3,4].
Considering that both the ignition kernel and flame front actually contain large number of charged particles, it is possible to couple energy into the ignition kernel and accelerate the flame development through an additional electric field. In fact, the electric field has been verified to be a promising method to increase the flame speed and have significant influence on reducing polluted emissions [5,6,7], and the ion wind induced by the electric field on a flame front is widely considered as an important mechanism for the improvement [8,9,10]. However, generating a spatial electric field and accelerating the flame propagation in the whole engine cylinder are very difficult due to the structure incompatibility. A more practical way is to form a local strong electric field around the electrodes to strengthen the spark ignition process.
For the latter, microwave is a suitable way to generate a near-electrode electric field as it can be transmitted synchronously with a high voltage signal through a coaxial cable. Microwave has also been reported to have great improvement for the combustion process [11]. Actually, the novel microwave-assisted spark ignition (MAI) technology [12,13,14] was developed based on this thought, and its primary purpose is emitting microwave in and forming an electric field near the electrodes to expand the spark plasma kernel, and finally strengthen the ignition process. The past decade has witnessed an increasing interest in MAI, and numerous previous studies on MAI reported that the addition of microwave could greatly increase the amount of hydroxyl radical in the plasma and thus enhance the ignition characteristics of lean burn [14]. The experiments based on a single cylinder engine [15] showed that MAI obviously reduced the cyclic combustion variation under extreme lean conditions. However, MAI was not always efficient and there were some situations in which the effect of MAI was restricted, e.g., if the reactive mixture was near the stoichiometric ratio, the influence of microwave was not obvious [16].
Factors which may influence the MAI performance were explored using CH4-Air flame with 60 kHz pulse repetition frequency in a constant volume chamber in [17], and it was shown that the enhancement of MAI on flame development decreased as either the equivalence ratio approached stoichiometric or the ambient pressure increased beyond 3 bar. Besides, when microwave was on, some engrossing wrinkles were observed on the flame kernel surface, and this was considered an important factor for enhancing the ignition process since the wrinkles expanded the superficial area of flame and thus increased the burning rate. Similar MAI performance was also presented in [18], where microwave enhancement weakened with ambient pressure increasing in the experiments fueled by C2H2 with 700 W microwave power and 10 kHz pulse repetition frequency. For this negative effect of pressure (NEP), a possible reason is that under higher pressure, the mean free path of electrons decreases, causing an insufficient electron acceleration [19]. Another possible reason for NEP is that the critical flame radius necessary for ignition is smaller under higher ambient pressure, and thus the ignition kernel can reach that critical value earlier, making the microwave effect inconspicuous [20]. If the second reason is tenable, then means to improve the microwave feed-in before the flame reaches the critical radius may be useful to improve MAI performance under higher pressures.
Up to now, most studies on microwave- or electric field-assisted ignition in CVCC were more concentrated on the overall combustion characteristics, e.g., heat release, based on the pressure measurements during the combustion period [17,18,21], whereas scant attention was paid to the effects of energy absorption and microwave-induced flow during the initial flame development. It was only mentioned in [17] that microwave-induced wrinkles on the flame kernel surface were conducive to the flame kernel development. However, the influencing factors of wrinkle formation were not sufficiently discussed. Although some optimized strategies for MAI have been proposed and tested based on the CVCC system in [22,23,24,25], the influence of microwave peak power and pulse repetition frequency on the early flame morphology was not well covered due to the insufficient focus on the flame kernel development. Thus, the interaction regime between microwave and flame kernel as well as the further optimized strategies still need to be explored.
This paper aims to further explore the interaction regime between the microwave and initial flame, and then provide an efficient way to improve the NEP of MAI. The influence of microwave pulses on early spherical flame ignited by spark is studied with a range of microwave energy and pulse repetition frequency under evaluated ambient pressures. Special attention is paid on the morphology as well as the development of initial flame kernel which are critical for subsequent flame propagation. The microwave-induced morphology changes are reflected by the expanding spherical CH4-Air flame, and are captured with the high-speed shadowgraph system. By adding the discharge tests to compare with the ignition tests, the influence of microwave on the combustion reaction kinetics can be decoupled, then the effect of increasing microwave pulse energy can be analyzed from a novel perspective. In addition, the different deformation regimes with different microwave pulse repetition frequency are discussed by considering the plasma stability.
Compared with previous papers, the novelty of present work is listed below:
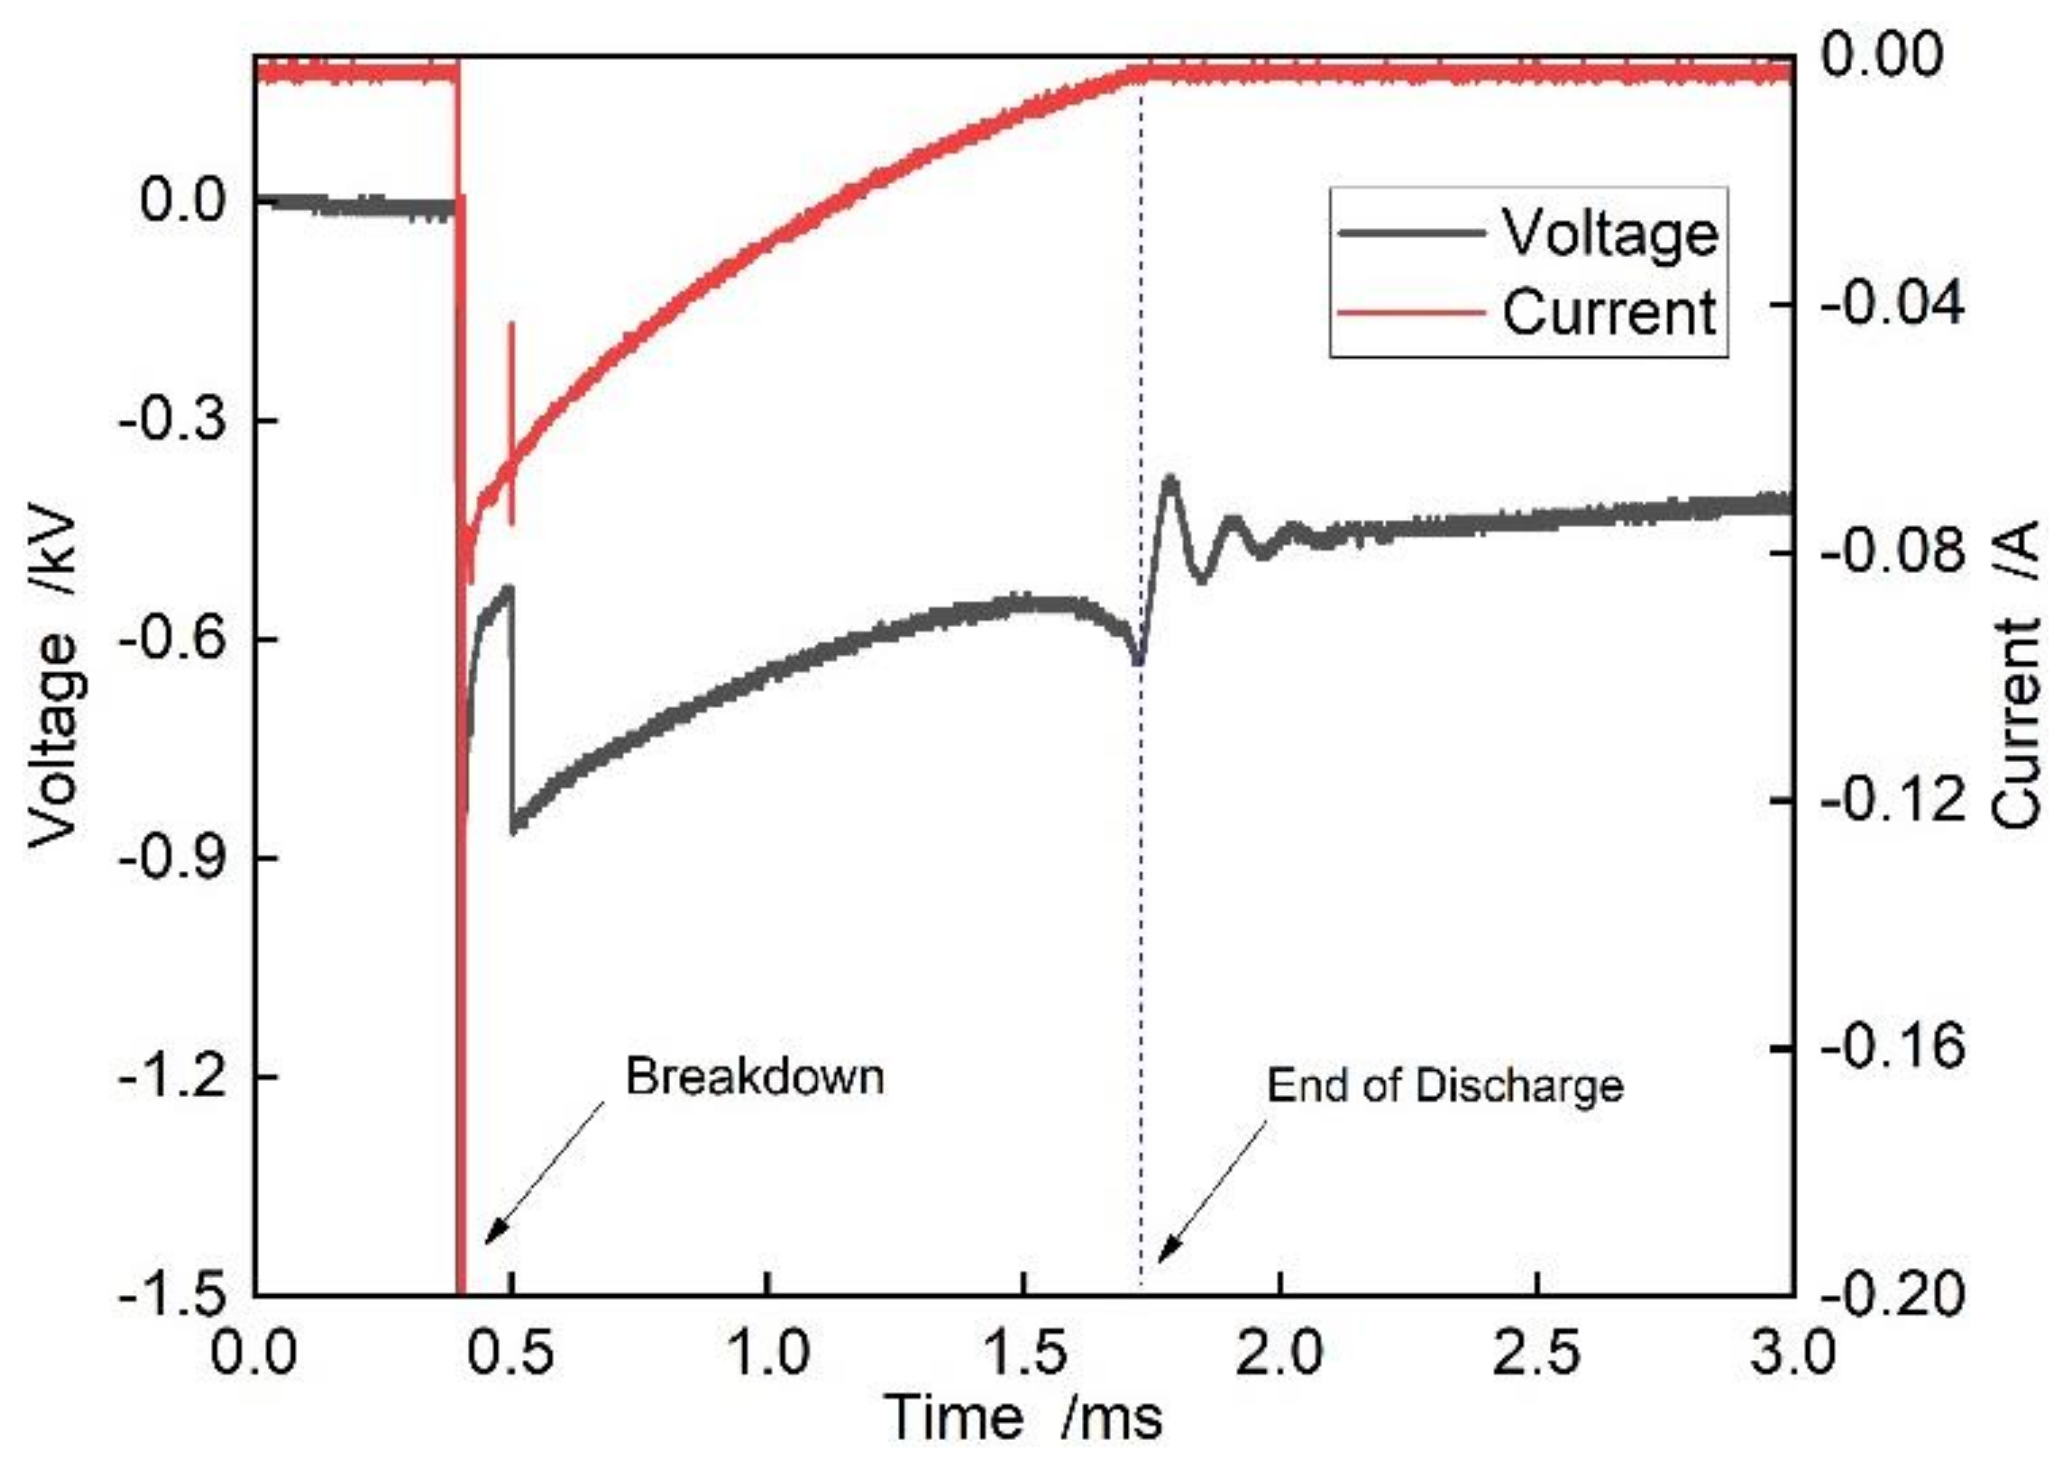
  • The transient spark discharge energy and mean microwave pulse energy are measured under different conditions.
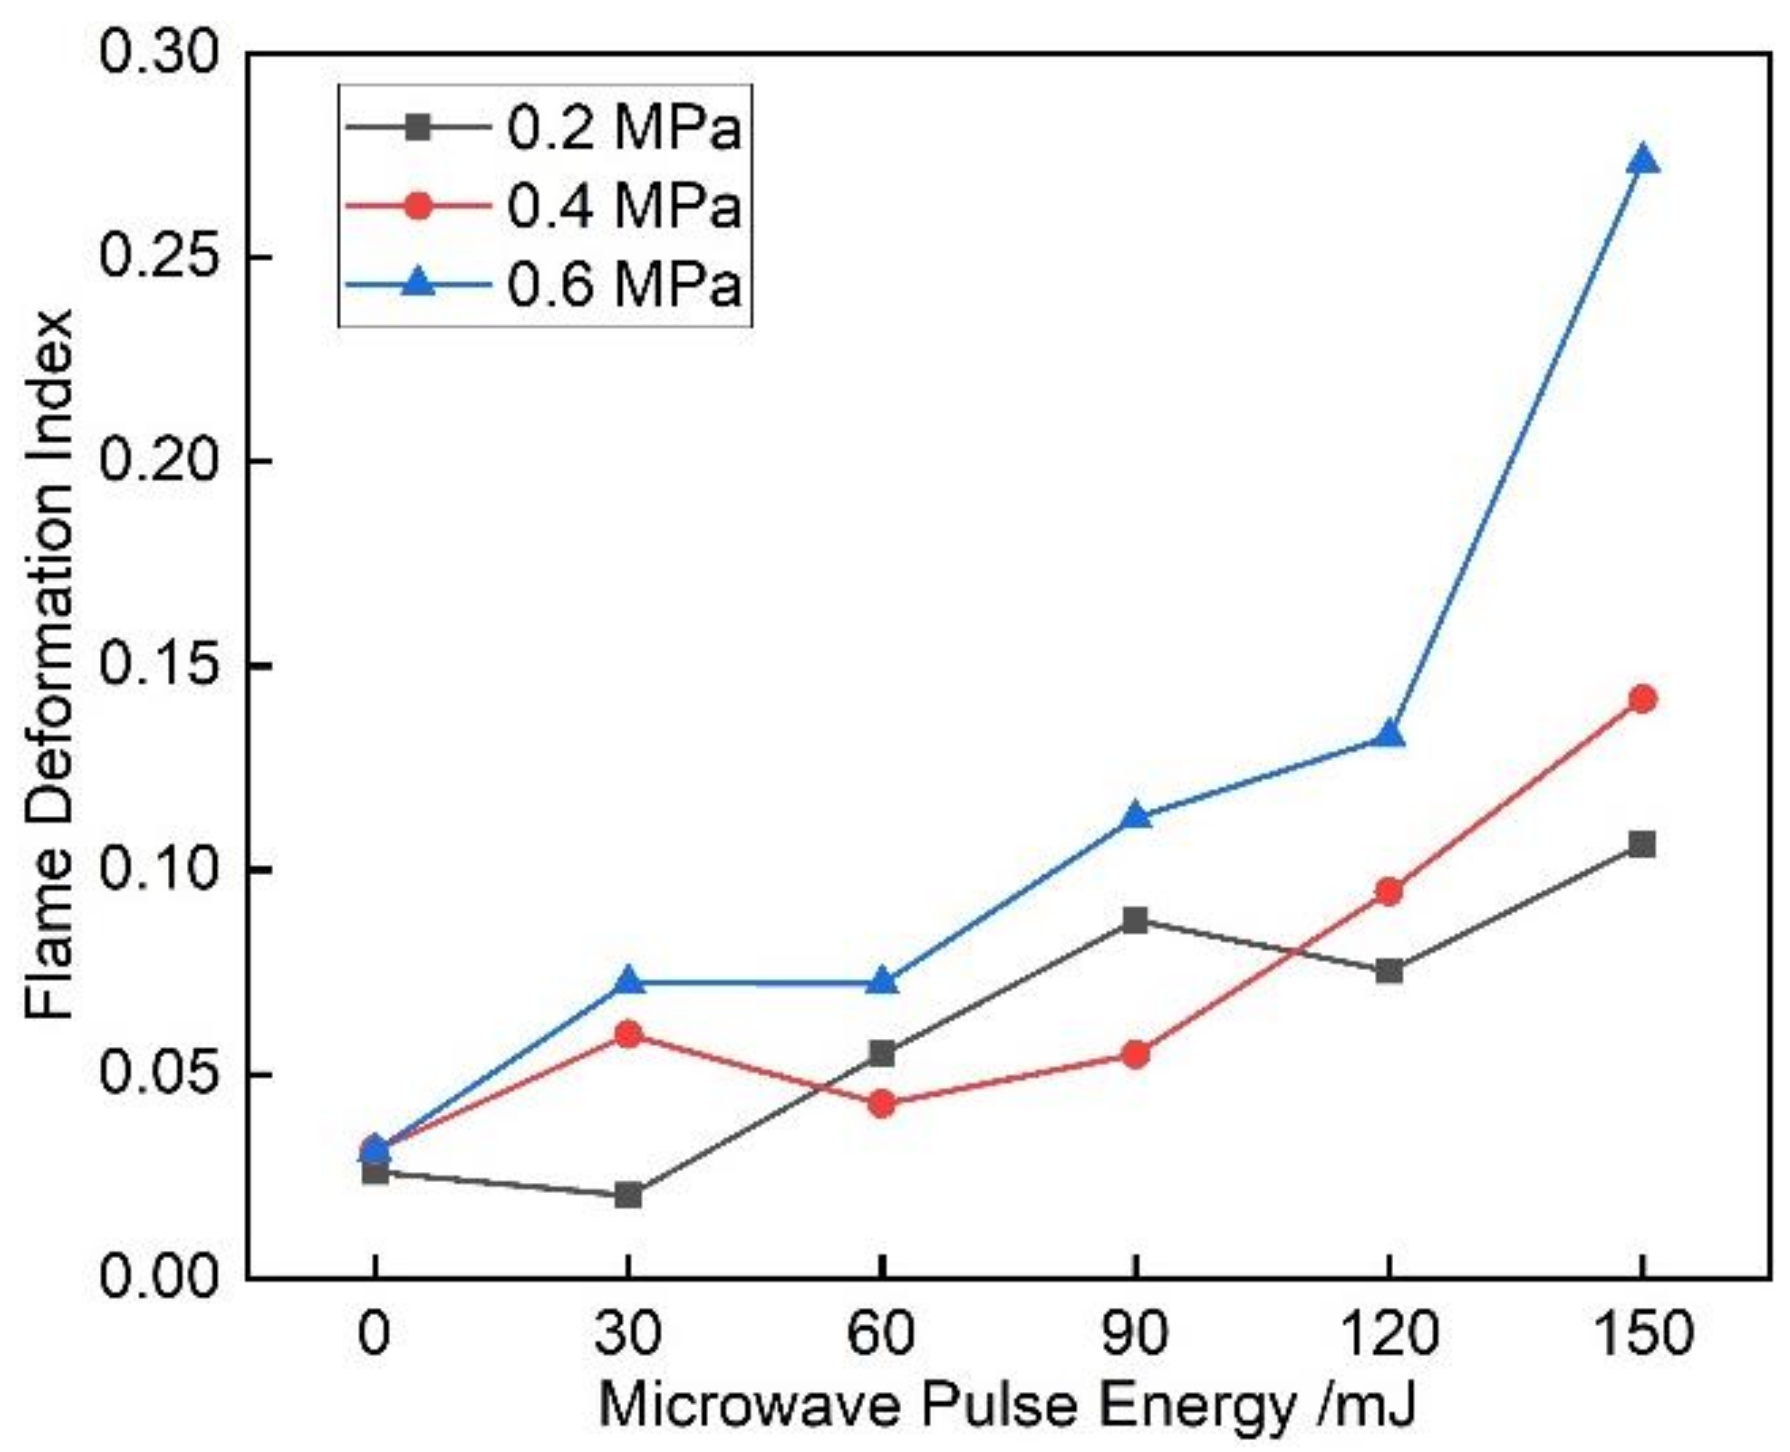
  • It is the first time in MAI research that the deformation degree of flame kernel is quantitively described by introducing deformation index. Based on it, the microwave-caused flow is related to the microwave enhancing regime.
  • The influencing regimes of both microwave power and pulse repetition frequency are discussed from the perspectives of both flow and energy accumulation.
  • Regimes of microwave-induced wrinkles and flame deformation under different microwave parameters are related to the plasma instability and discussed deeply.
In this light, the present paper may provide a stepping stone to further understand the fundamentals of microwave on spark ignition.

2. Experimental Setup and Methods

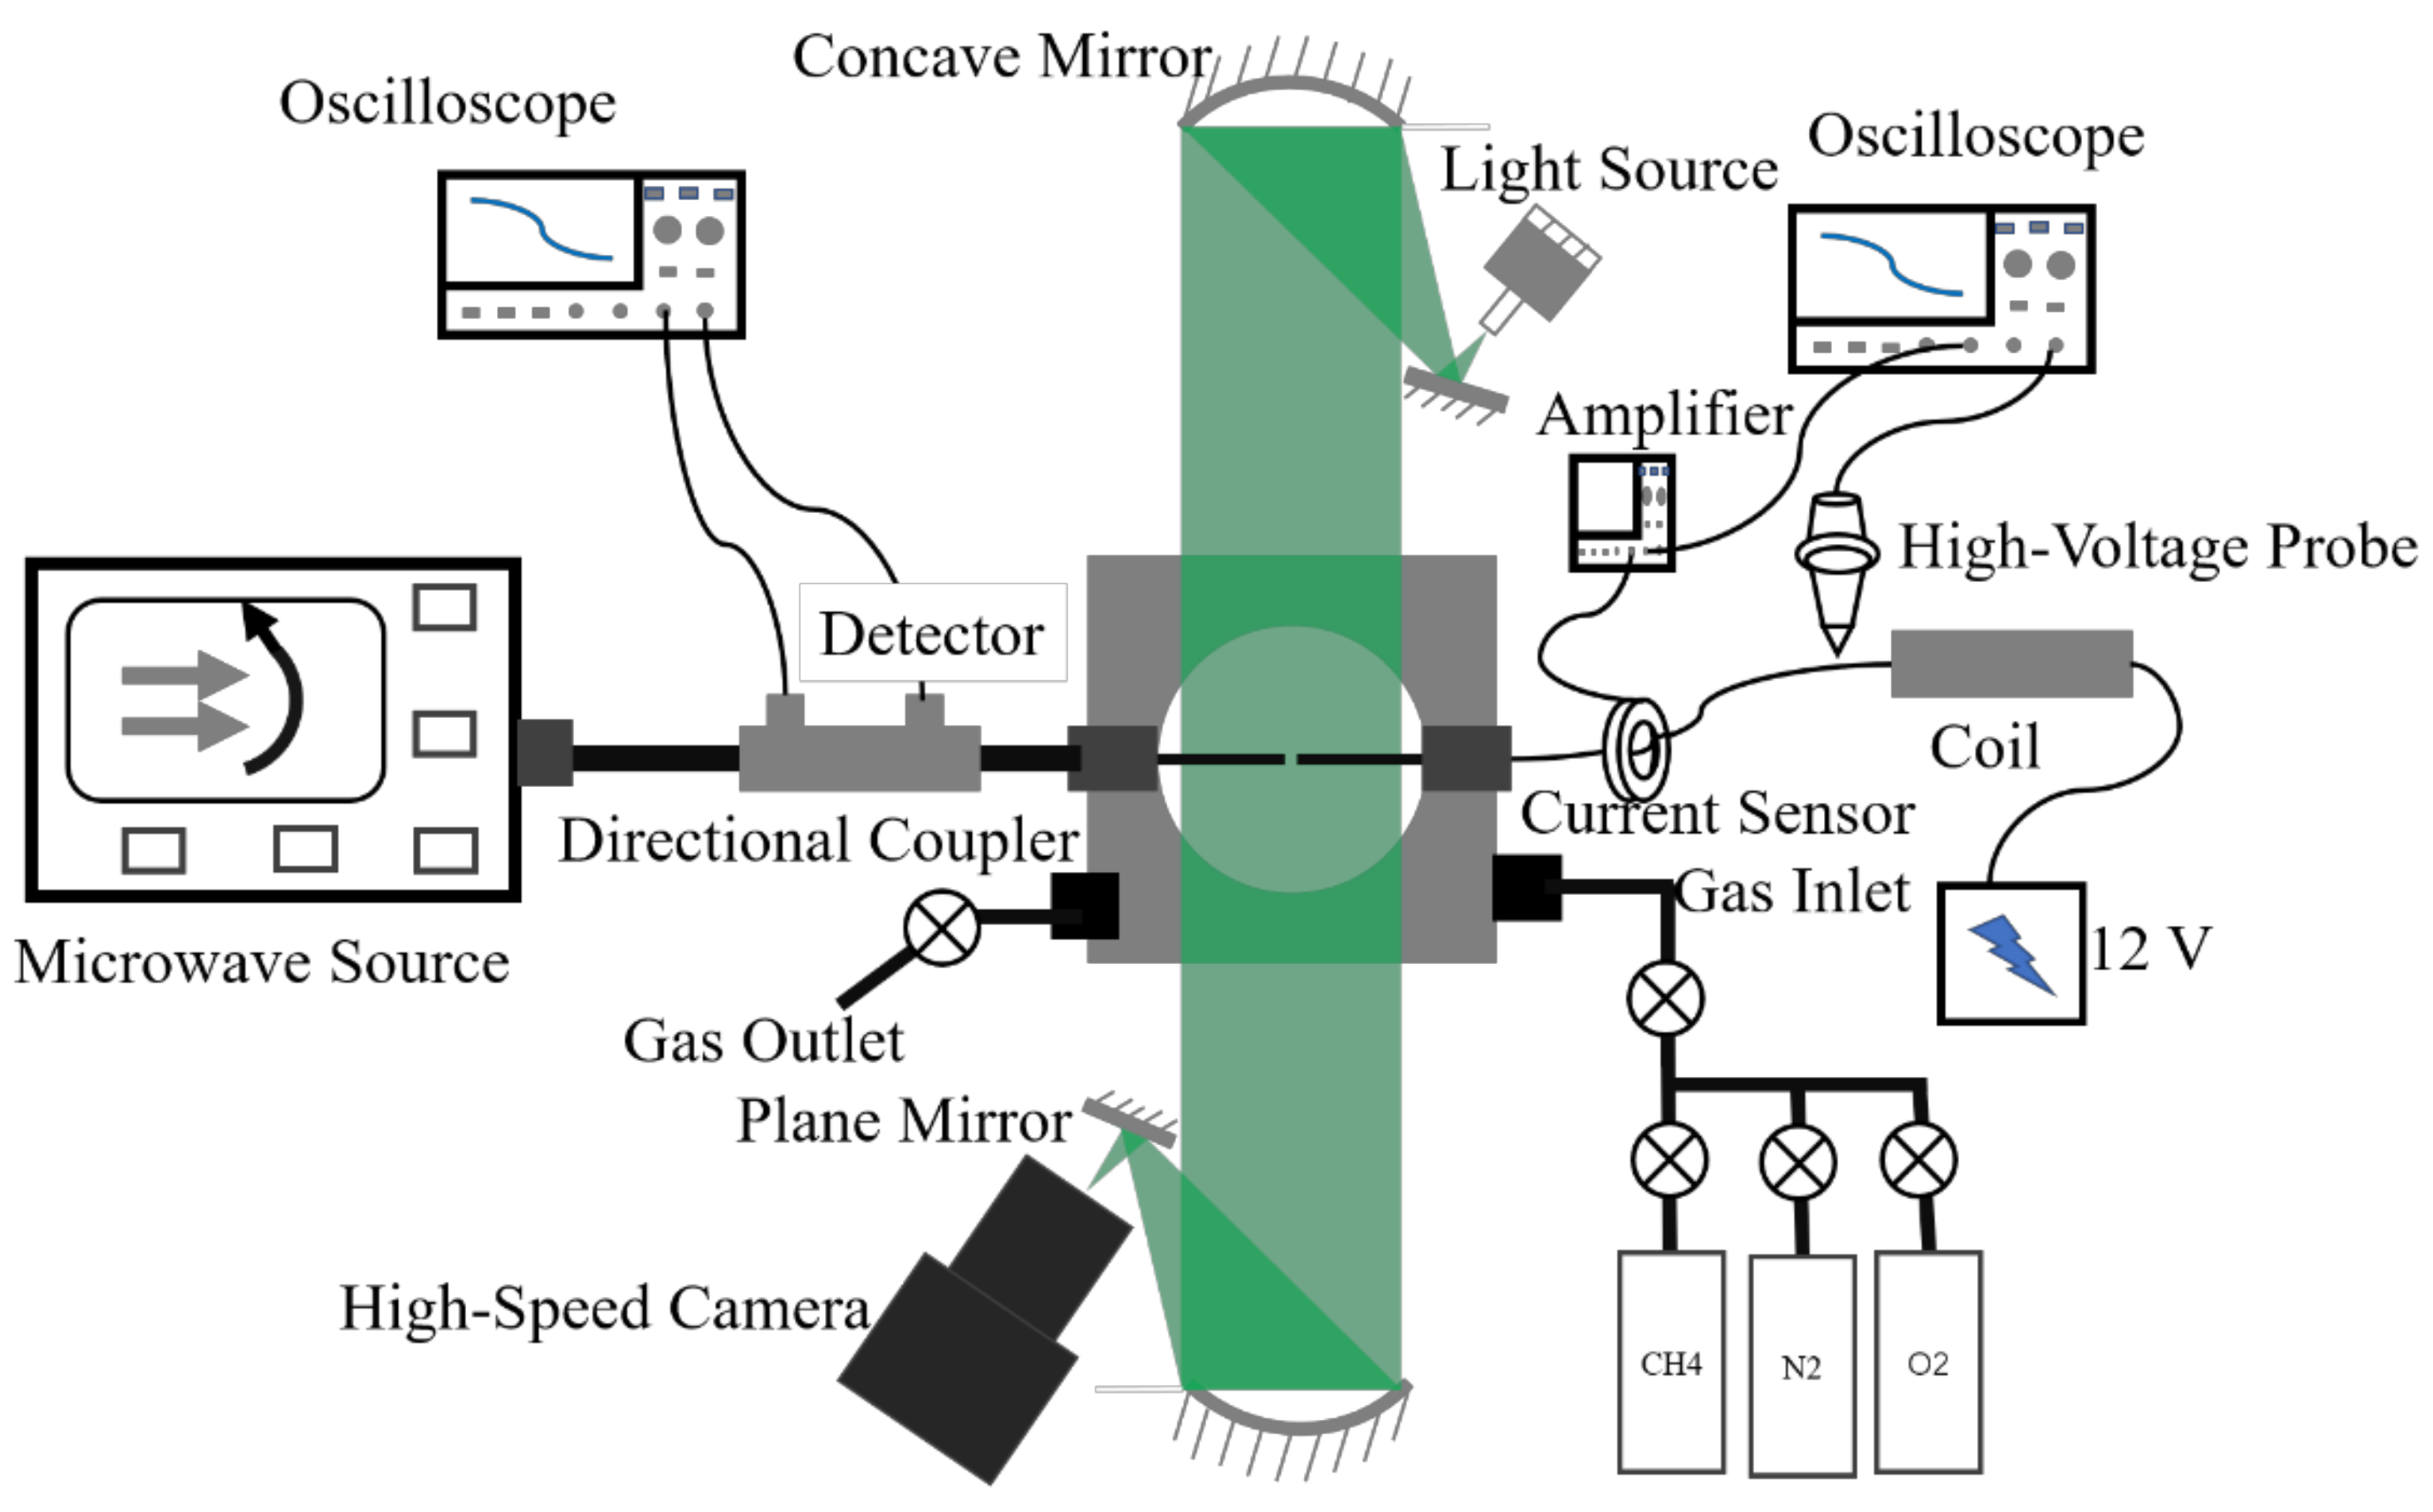
2.1. Microwave-Assisted CVCC System

As shown in Figure 1, the experimental apparatus is a microwave-assisted CVCC system, which consists of four major parts: microwave system, CVCC system, spark ignition system and high-speed shadowgraph system. A microwave of 2.45 GHz intrinsic frequency is generated by the solid-state microwave source and transmitted by coaxial cable. The microwave is emitted in pulse mode and the repetition frequency is adjustable from 1–80 kHz. In this system, a dual direction coupler jointed with two attenuators and power meters is used to measure the incident and reflected mean microwave power. More than emitting microwave, the microwave antenna also plays the role of ground electrode for the spark plug, and the two electrodes constitute the pin-pin configuration. Noting that the microwave electric field is not enough to breakdown the mixture, the spark discharge is necessary in MAI mode. More details about the experimental apparatus can be found in [24,25]. In addition, COMSOL Multiphysics is adopted to numerically simulate the microwave electric field in CVCC under vacuum condition by setting the boundary as a perfect electric conductor, and more details about the numerical model can be found in [25].

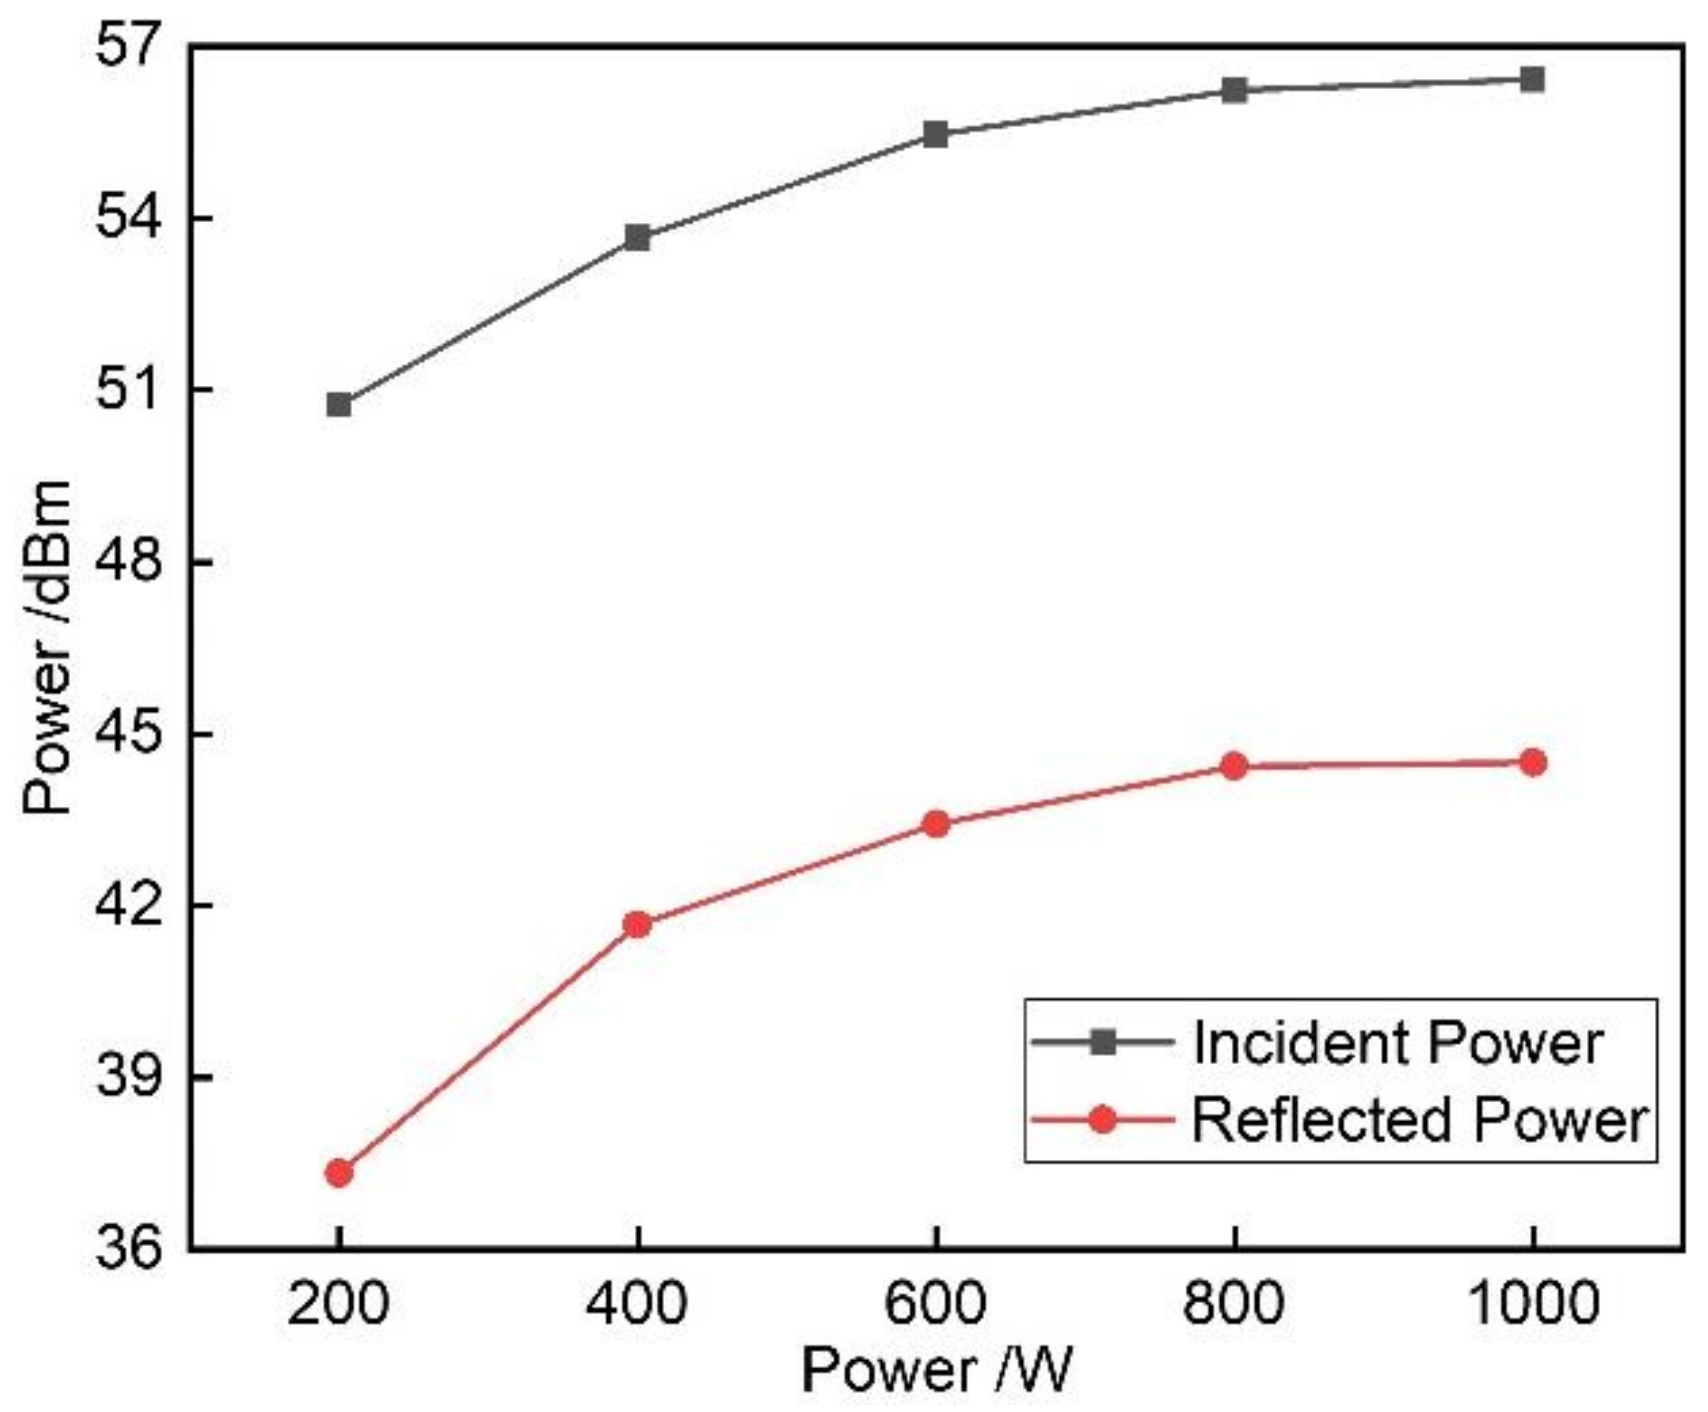
2.2. Discharge Energy and Microwave Pulse Energy

The transient spark discharge energy is measured based on a four-channel oscilloscope (Tektronix 2024C) jointly with a current sensor (TCP 312 Tektronix) and a high-voltage probe (P6015A Tektronix). When the trigger signal is sent out, the primary coil is closed and then the secondary coil is charged along with the increase in electrode voltage. Once the electrode voltage is beyond the threshold value, the breakdown occurs and the discharge channel forms. The local mixture is strongly heated by ohmic-heating, and then is dissociated, generating amounts of radicals to initiate combustion.
Figure 2 provides the obtained voltage and current characteristics of the spark discharge process. At the moment the charging time ends, the voltage surges to about 8 kV in a very short time of microsecond scale [22], and then breakdown occurs. The duration of discharge is about 1.3 ms and the end is marked with the moment the current decreasing to zero. The spark discharge energy is then calculated with following Equation (1):
E n e r g y s p =   V × I d t
where V is the voltage and I is the current. The calculated spark energy is 45 mJ under atmosphere condition in present study.
The mean powers of incident and reflected microwave are detected with the power meter in the continuous pulse mode of microwave source, and the result with 1.5 dB measurement uncertainty is shown in Figure 3. Note that the mean power rather than transient variation of power is detected due to the lack of response frequency. Accordingly, the energy emitted into the chamber can be calculated through Equation (2):
E n e r g y w a v e = t × r × P × η
where t is the microwave duration and is equal to 3 ms, r is the duty cycle, P is the detected power. η is the transmission efficiency and is evaluated as 25% according to [18].

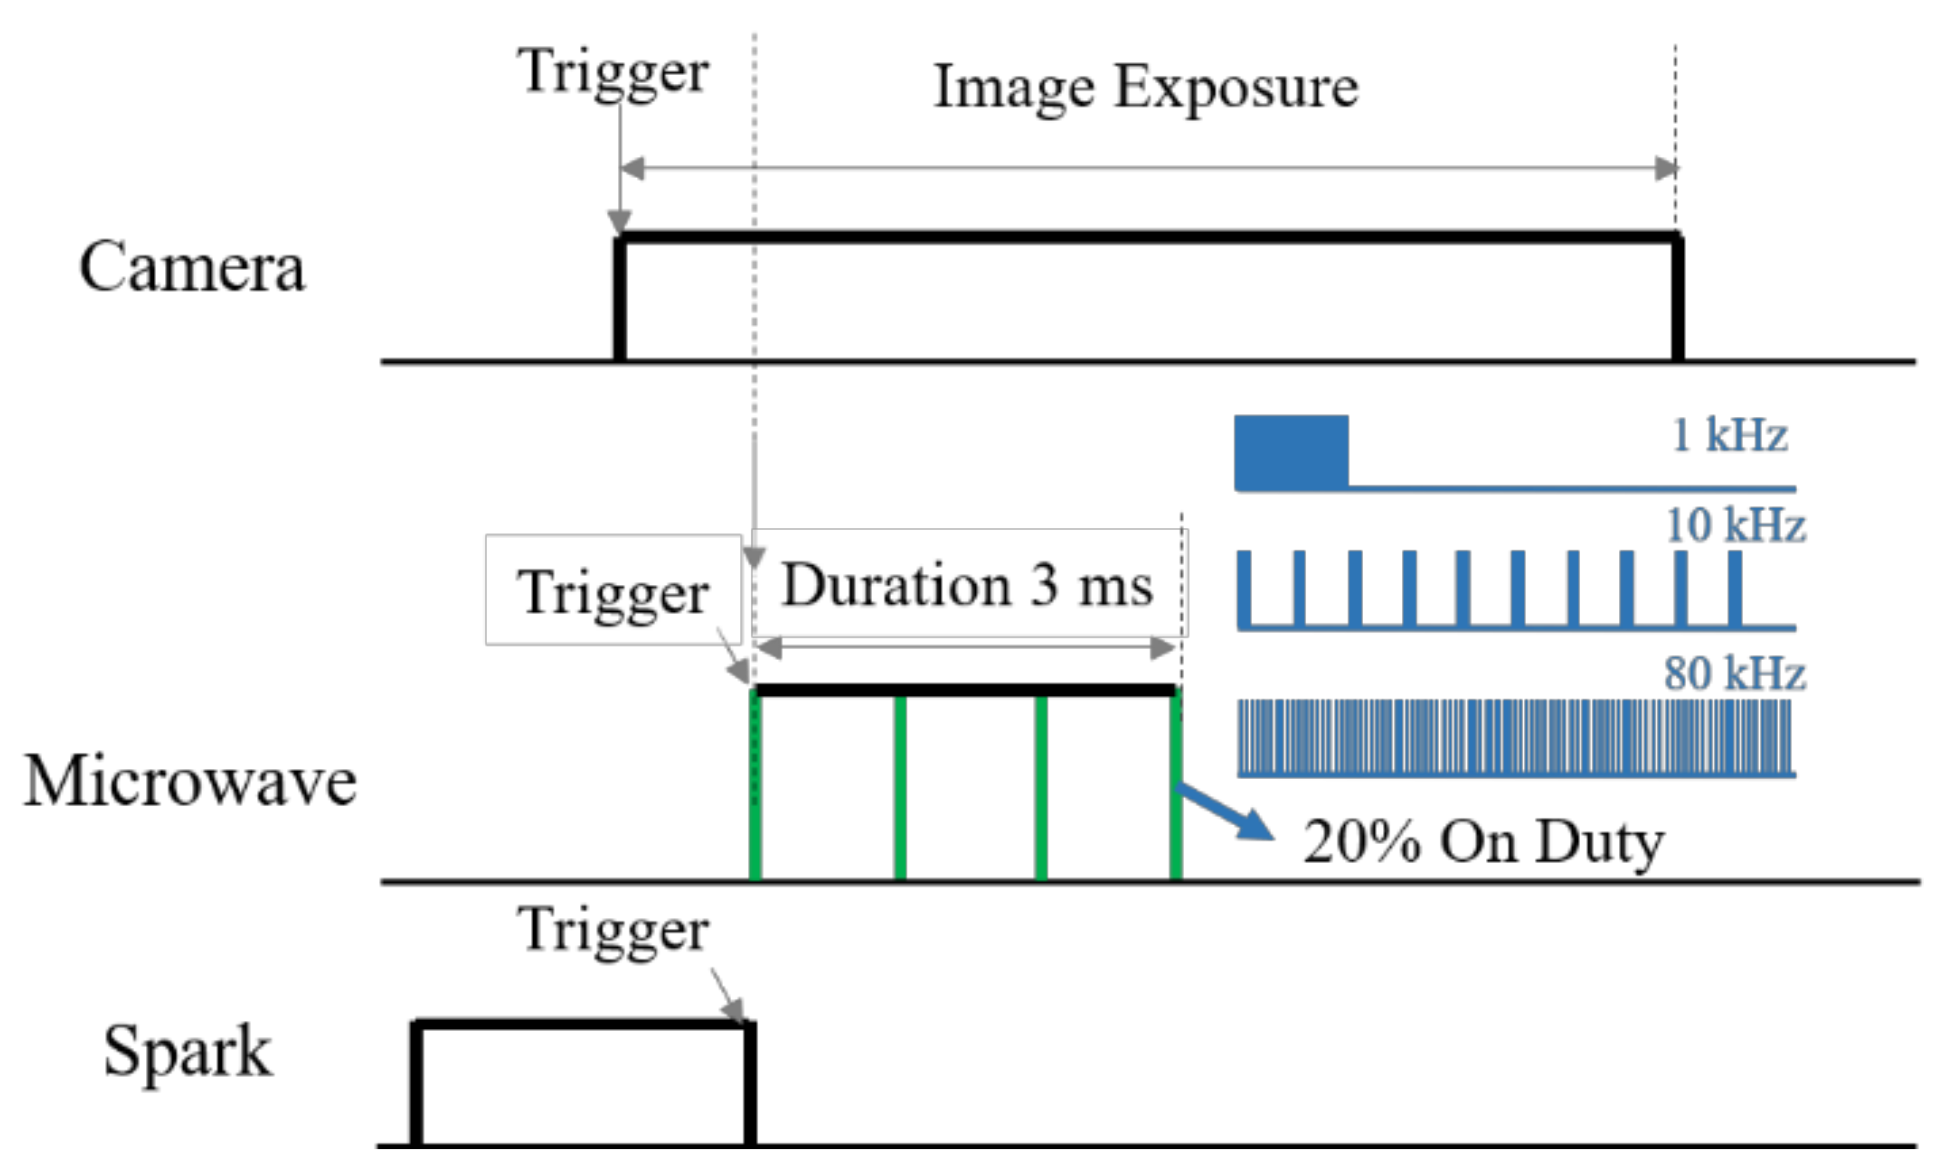
2.3. Experimental Procedure

Before charging each gas component into the chamber, the combustion products after the ignition test are scavenged out with N2 flow. The scavenging procedure is repeated 3 times to ensure that there mainly is N2 remaining in the chamber. The mixture of N2 and O2 mixed in a volume ratio of 3.76 is adopted as the ambient air. The equivalence ratio is achieved by charging each gas component into the chamber according to the gas partial pressure law. The combustion chamber is heated to 373 ± 2 K ensuring that the water vapor will not condense on the window. As shown in Figure 4, the microwave source and spark are trigged at the same time, while the high-speed camera is trigged 1 ms earlier. The accuracy of the trigger signal can be controlled within 0.1 microsecond. The microwave pulse repetition frequency is varied from 1–80 kHz with duty cycle of 20%, and the pulse energy varies from 0–150 mJ by adjusting the output of microwave source. The error of microwave pulse width is within 1 microsecond, and the variation in microwave pulse energy is controlled within 5%.

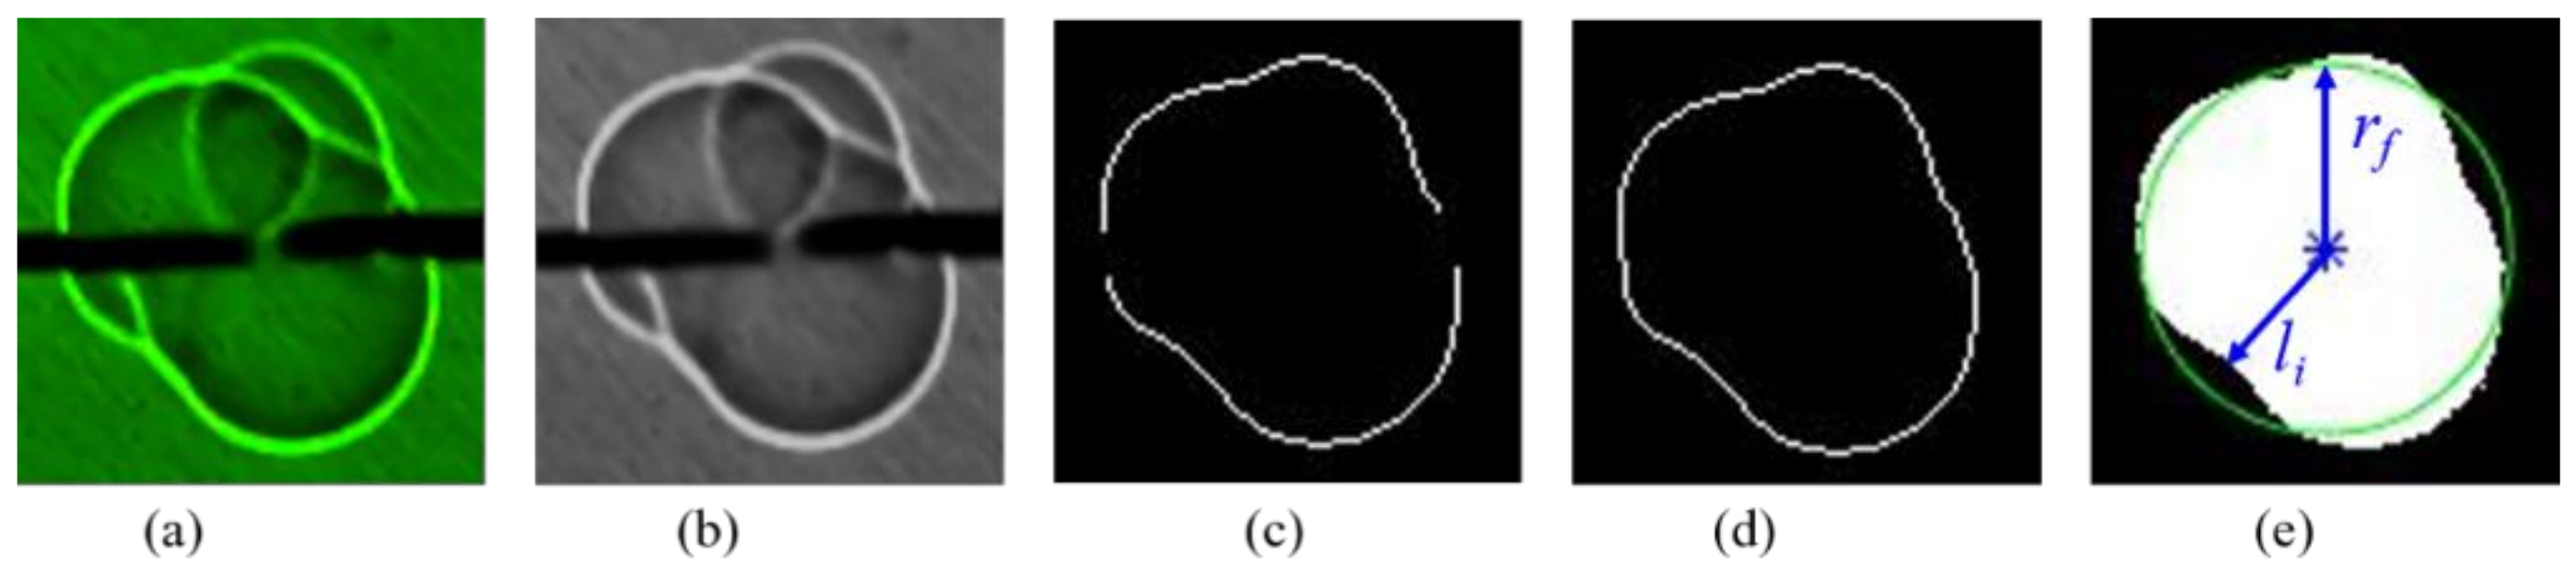
2.4. Image Processing

The flame area and deformation index are adopted to evaluate the effect of micro-wave on ignition. Figure 5 illustrates the procedures of image processing through a MATLAB program [25].
The flame images are initially grayed, and then two images that gap 20 frames are Boolean subtracted to obtain the initial flame boundary. The threshold of gray value is set as 30/255 based on experience, through which the binarization process can extract the flame outline while reducing the noise in the image. To maintain the consistency, this threshold is kept constant in all the image processing. Next, the flame boundary is repaired by connecting the adjacent breakpoints through linear interpolation. Finally, the closed boundary is filled to get the connected domain which is considered the flame projection on the plane. The flame area (Af) can be obtained by counting the pixel in the domain. The microwave enhancement ratio (Emic) is defined with Equation (3), where A f × M A I and A f × S I represent the flame area in MAI mode and SI mode, respectively. The flame equivalent radius (rf) can be calculated by Equation (4). The flame deformation index (DIndex) is defined with Equation (5), where li is the length between the pixel point on flame boundary and the barycenter of flame indicated with blue asterisk in Figure 5e, and n is the pixel number of flame boundary.
E m i c = A f × M A I A f × S I
r f = A f π
D i n d e x = i = 1 n l i r f 2 n
The flame speed is defined as the first derivative of flame radius with time (drf/dt), and obtained through a five-point stencil as expressed with Equation (6):
d r f d t r f t + 2 n + 8 r f t + n 8 r f t n + r f t 2 n 12 n
where r is the flame kernel radius and t is the corresponding time [26]. To minimize noisy deviation in drf/dt, n is selected as 0.5 ms.
Note that Dindex actually represents the circularity of flame and can only indicate the deformation of flame boundary. Wrinkles located inside the flame boundary cannot be characterized with Dindex, because the wrinkles of different gray values are hard to be concurrently recognized by the program. Therefore, only the flame deformation is quantitatively analyzed, while the flame wrinkles are qualitatively discussed in present study. Each test is independently repeated at least 5 times to reduce errors, and the standard deviation is indicated with the error bar in the figures in next section.

3. Results and Discussion

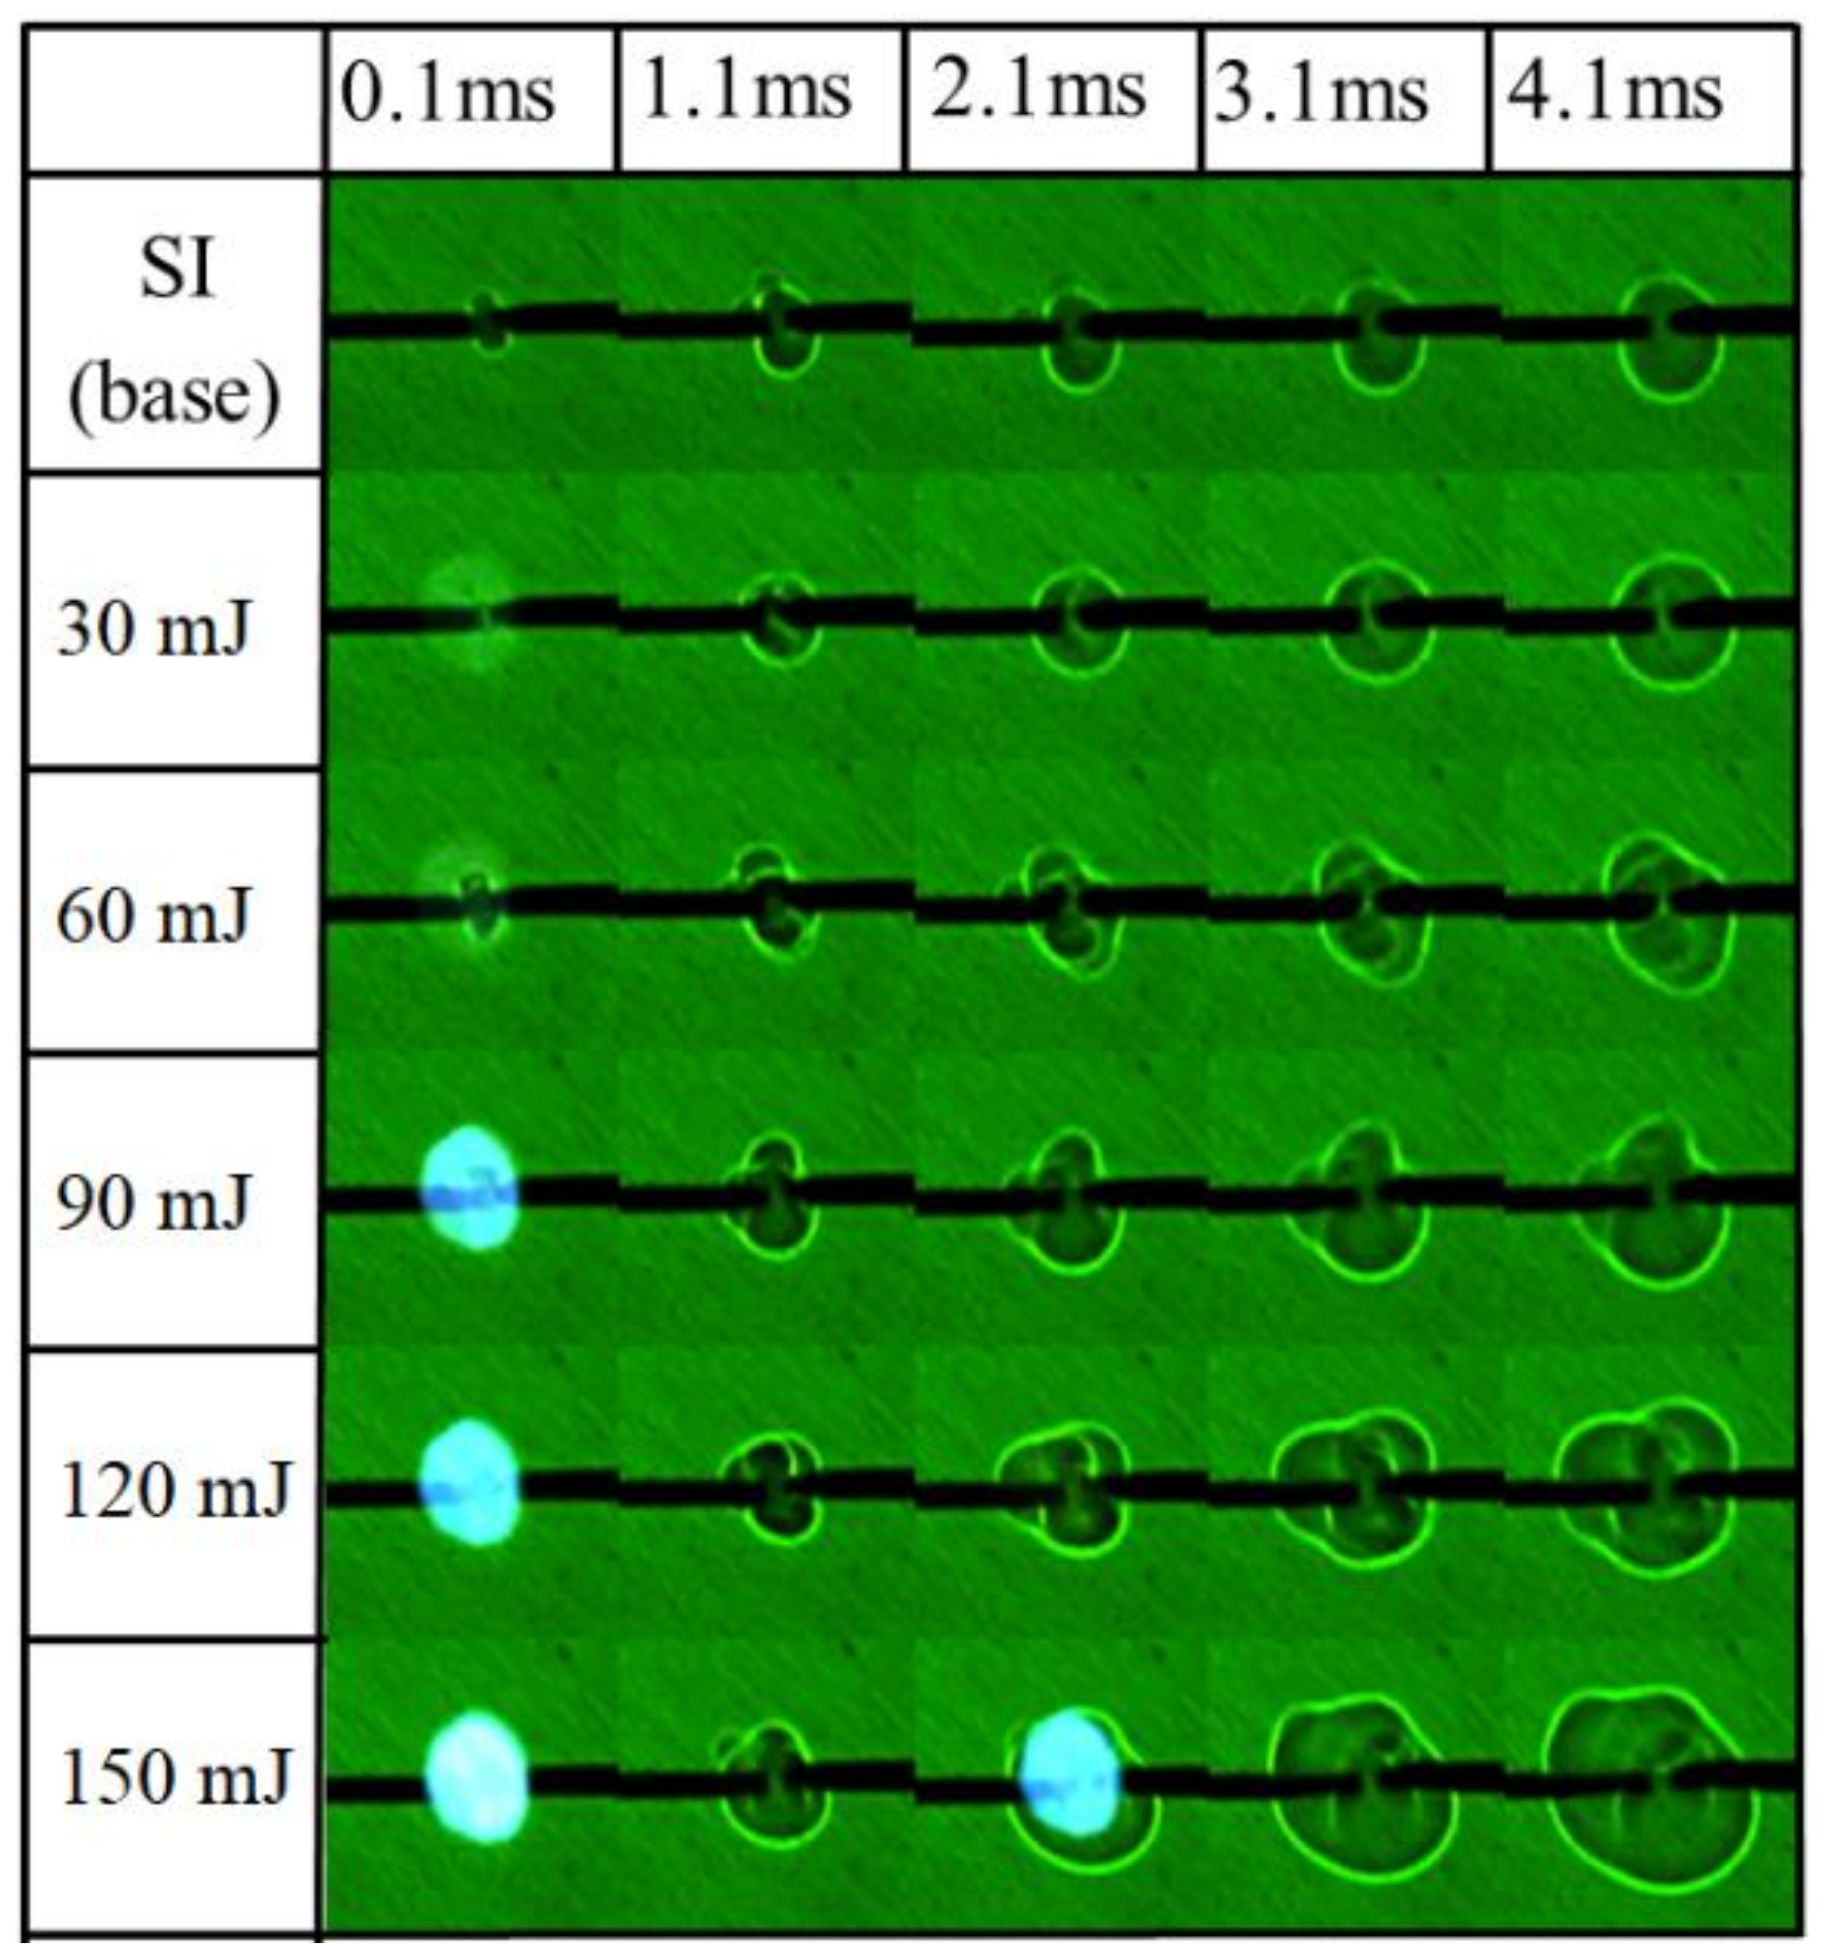
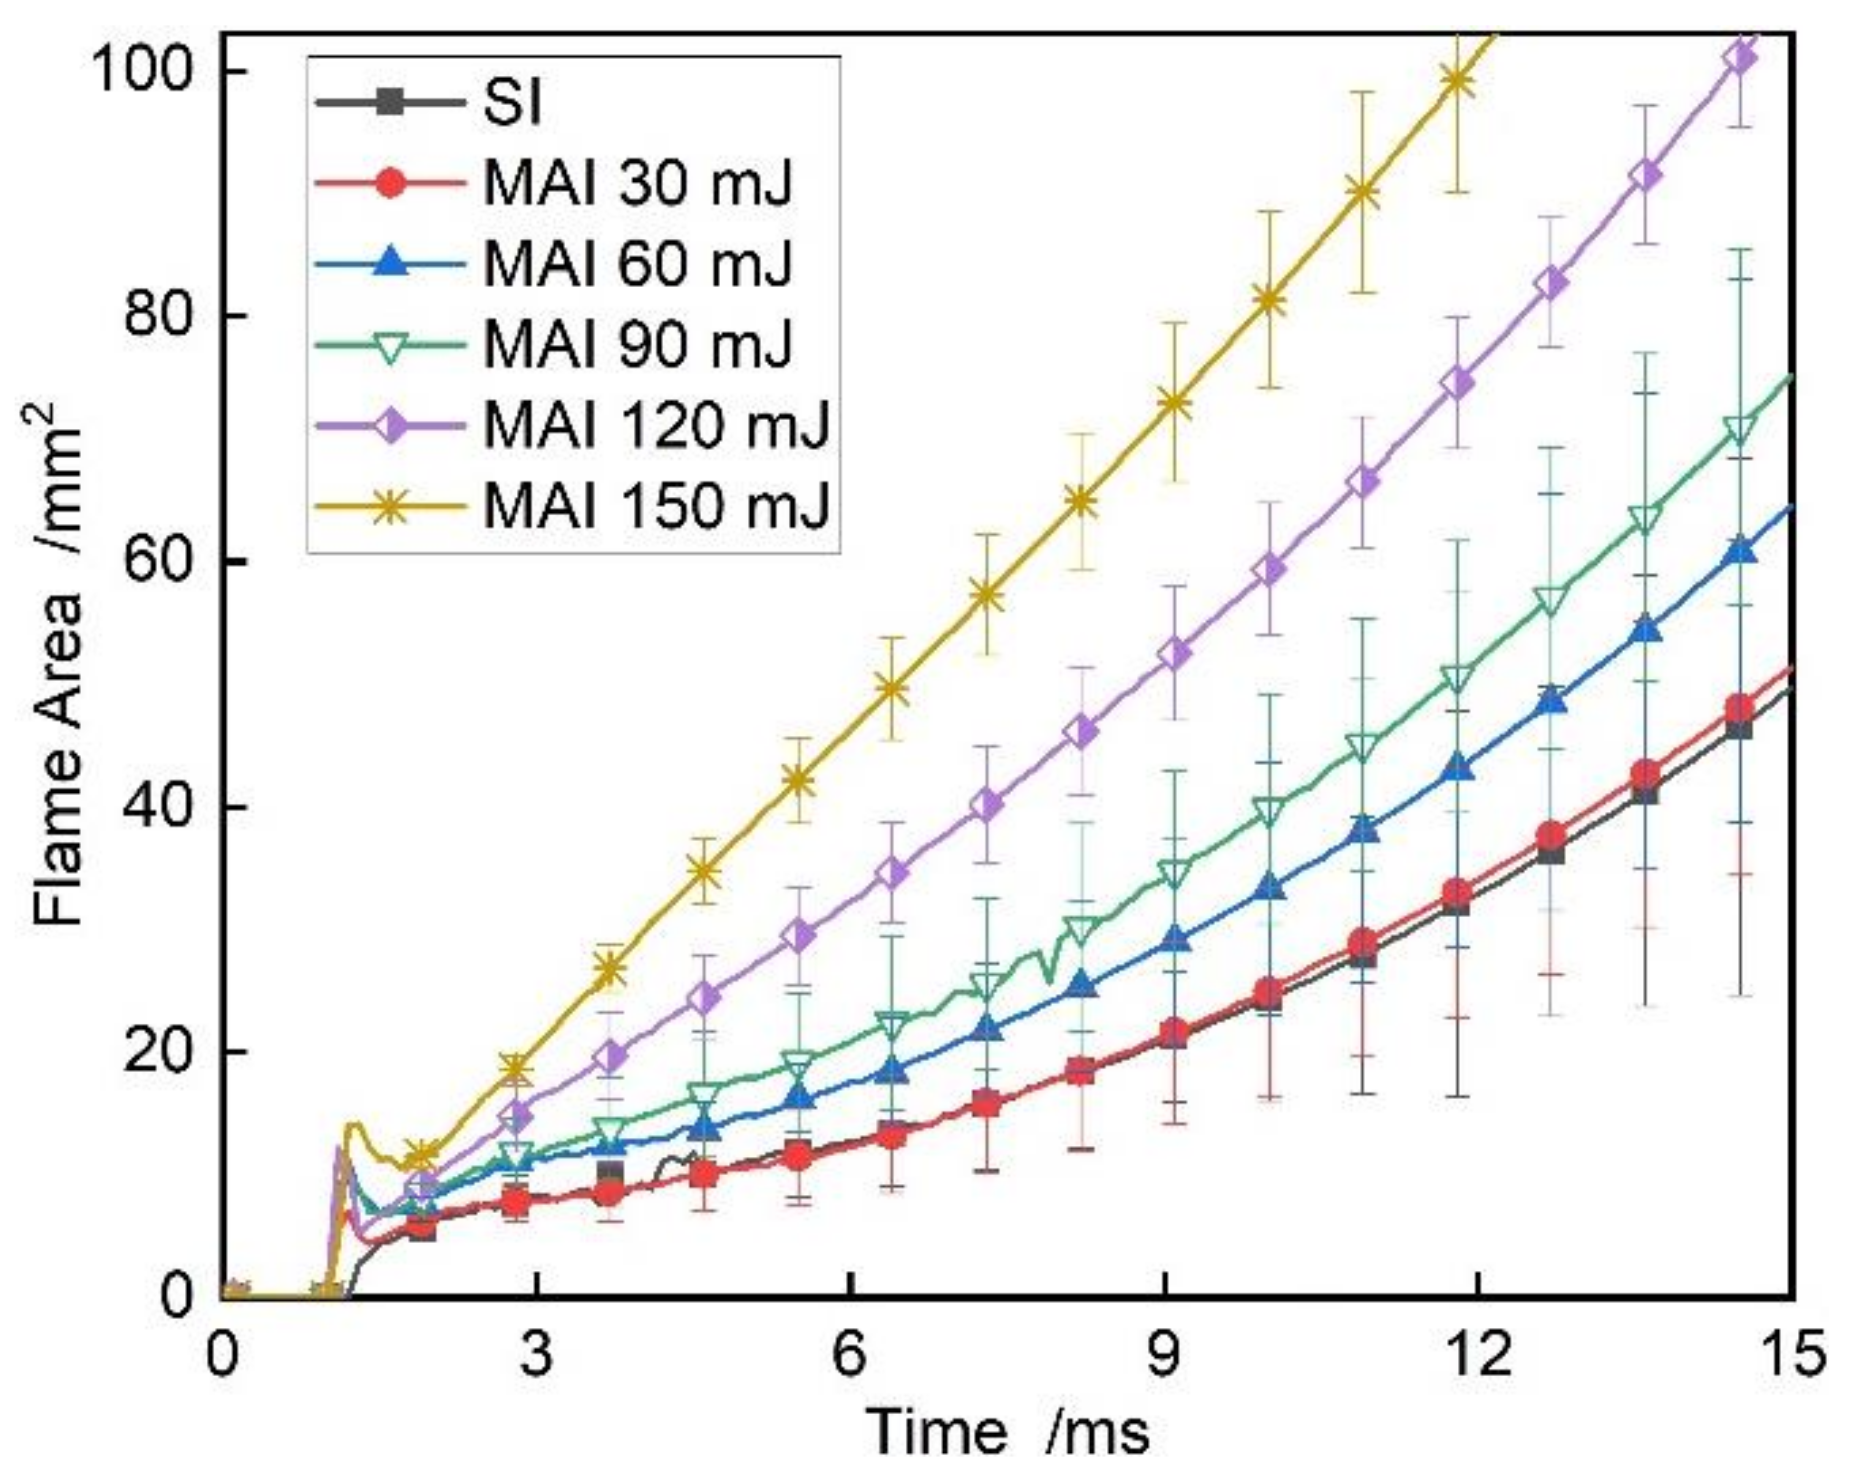
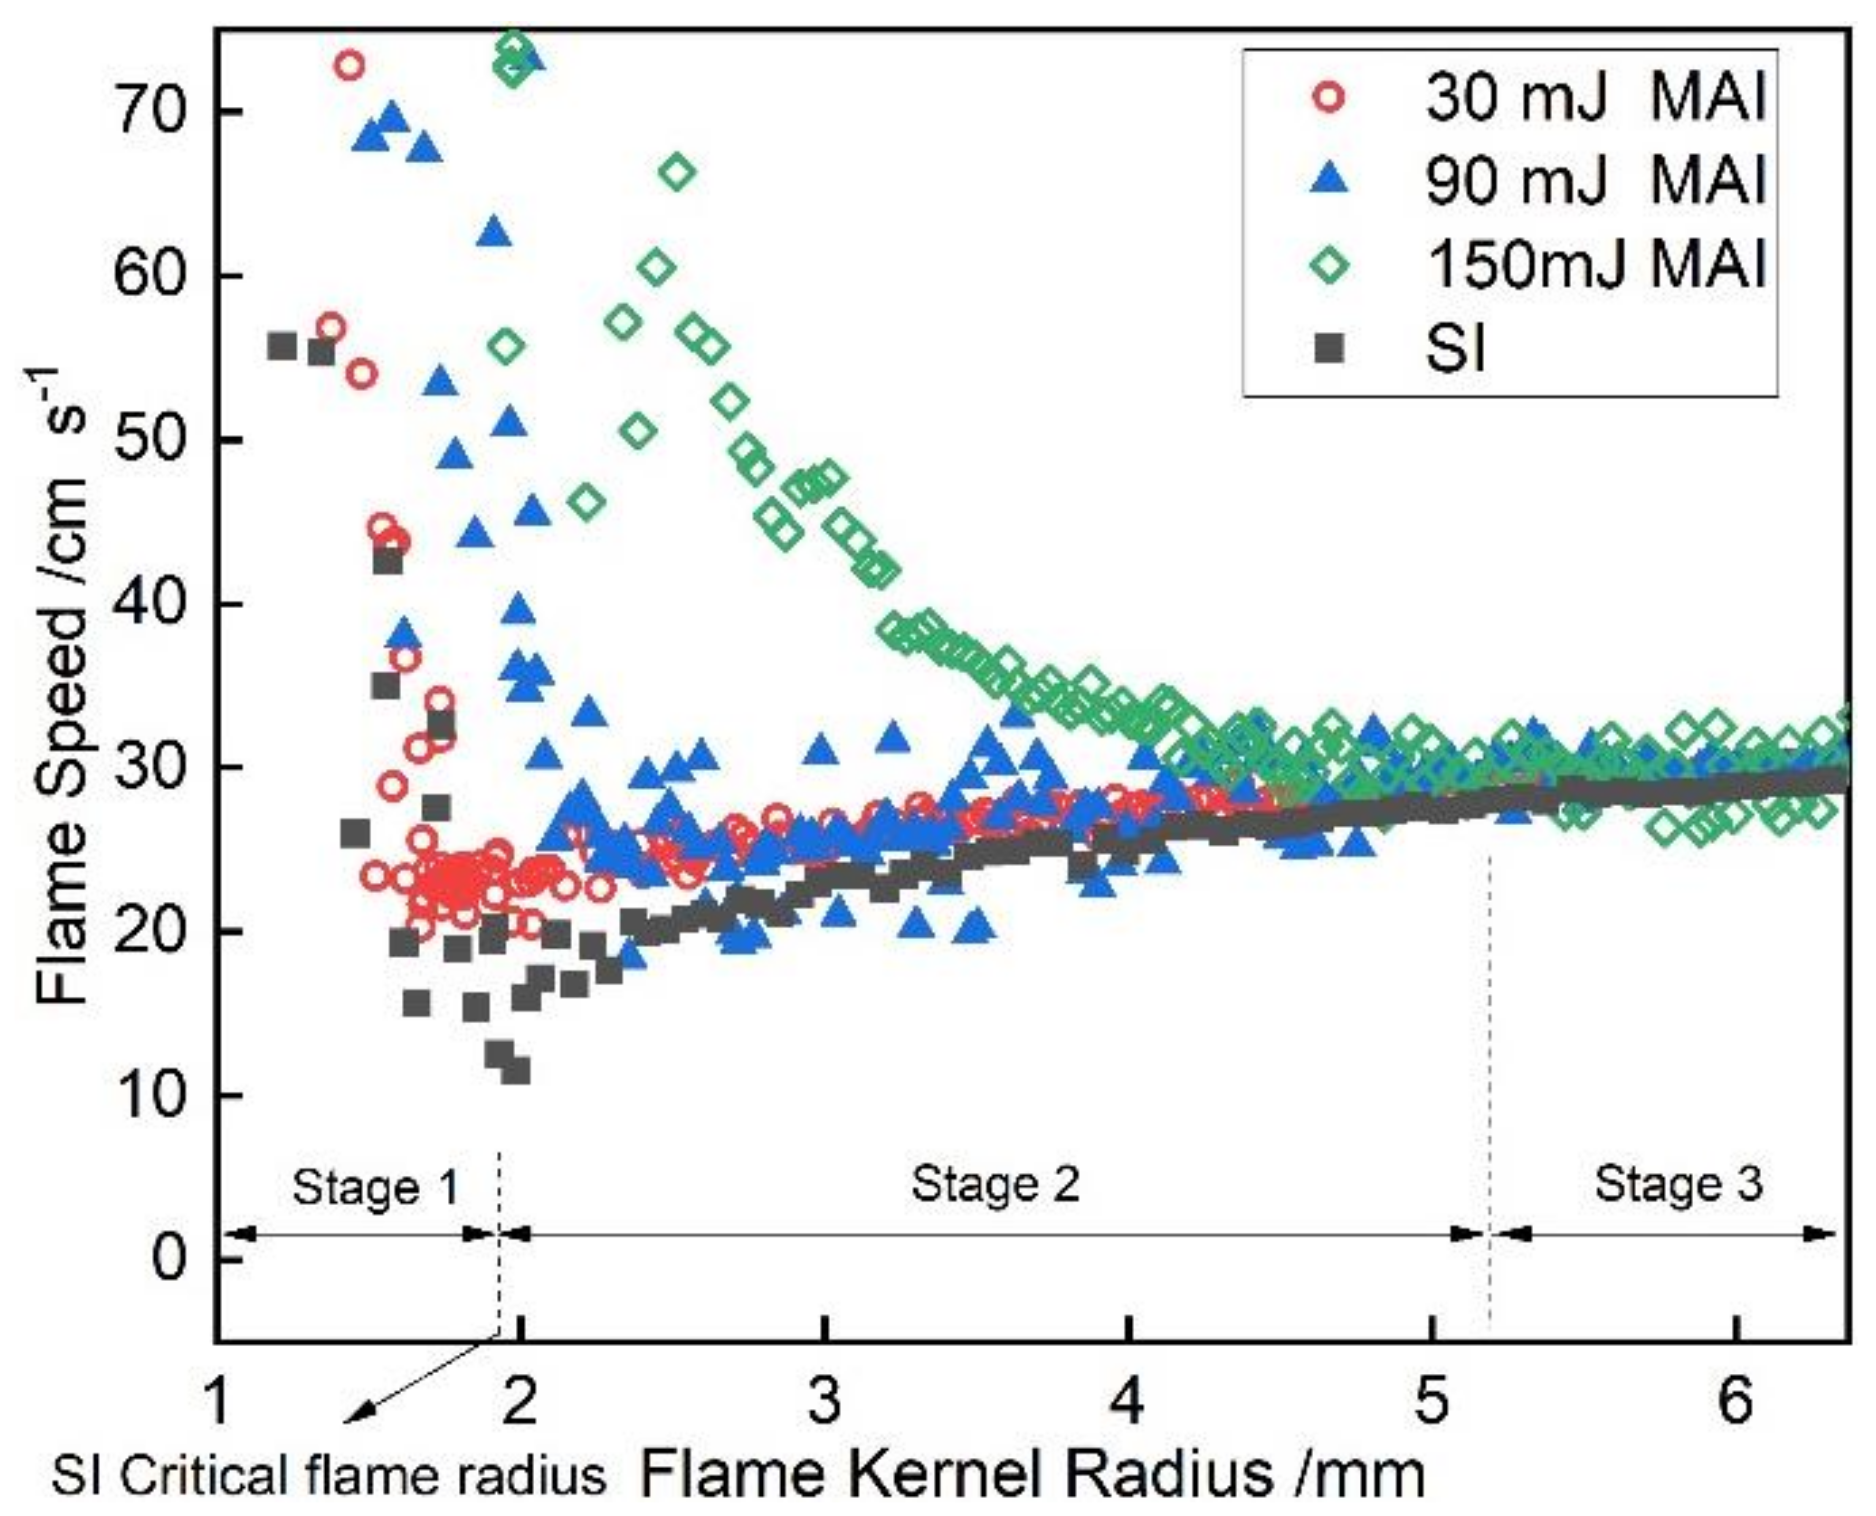
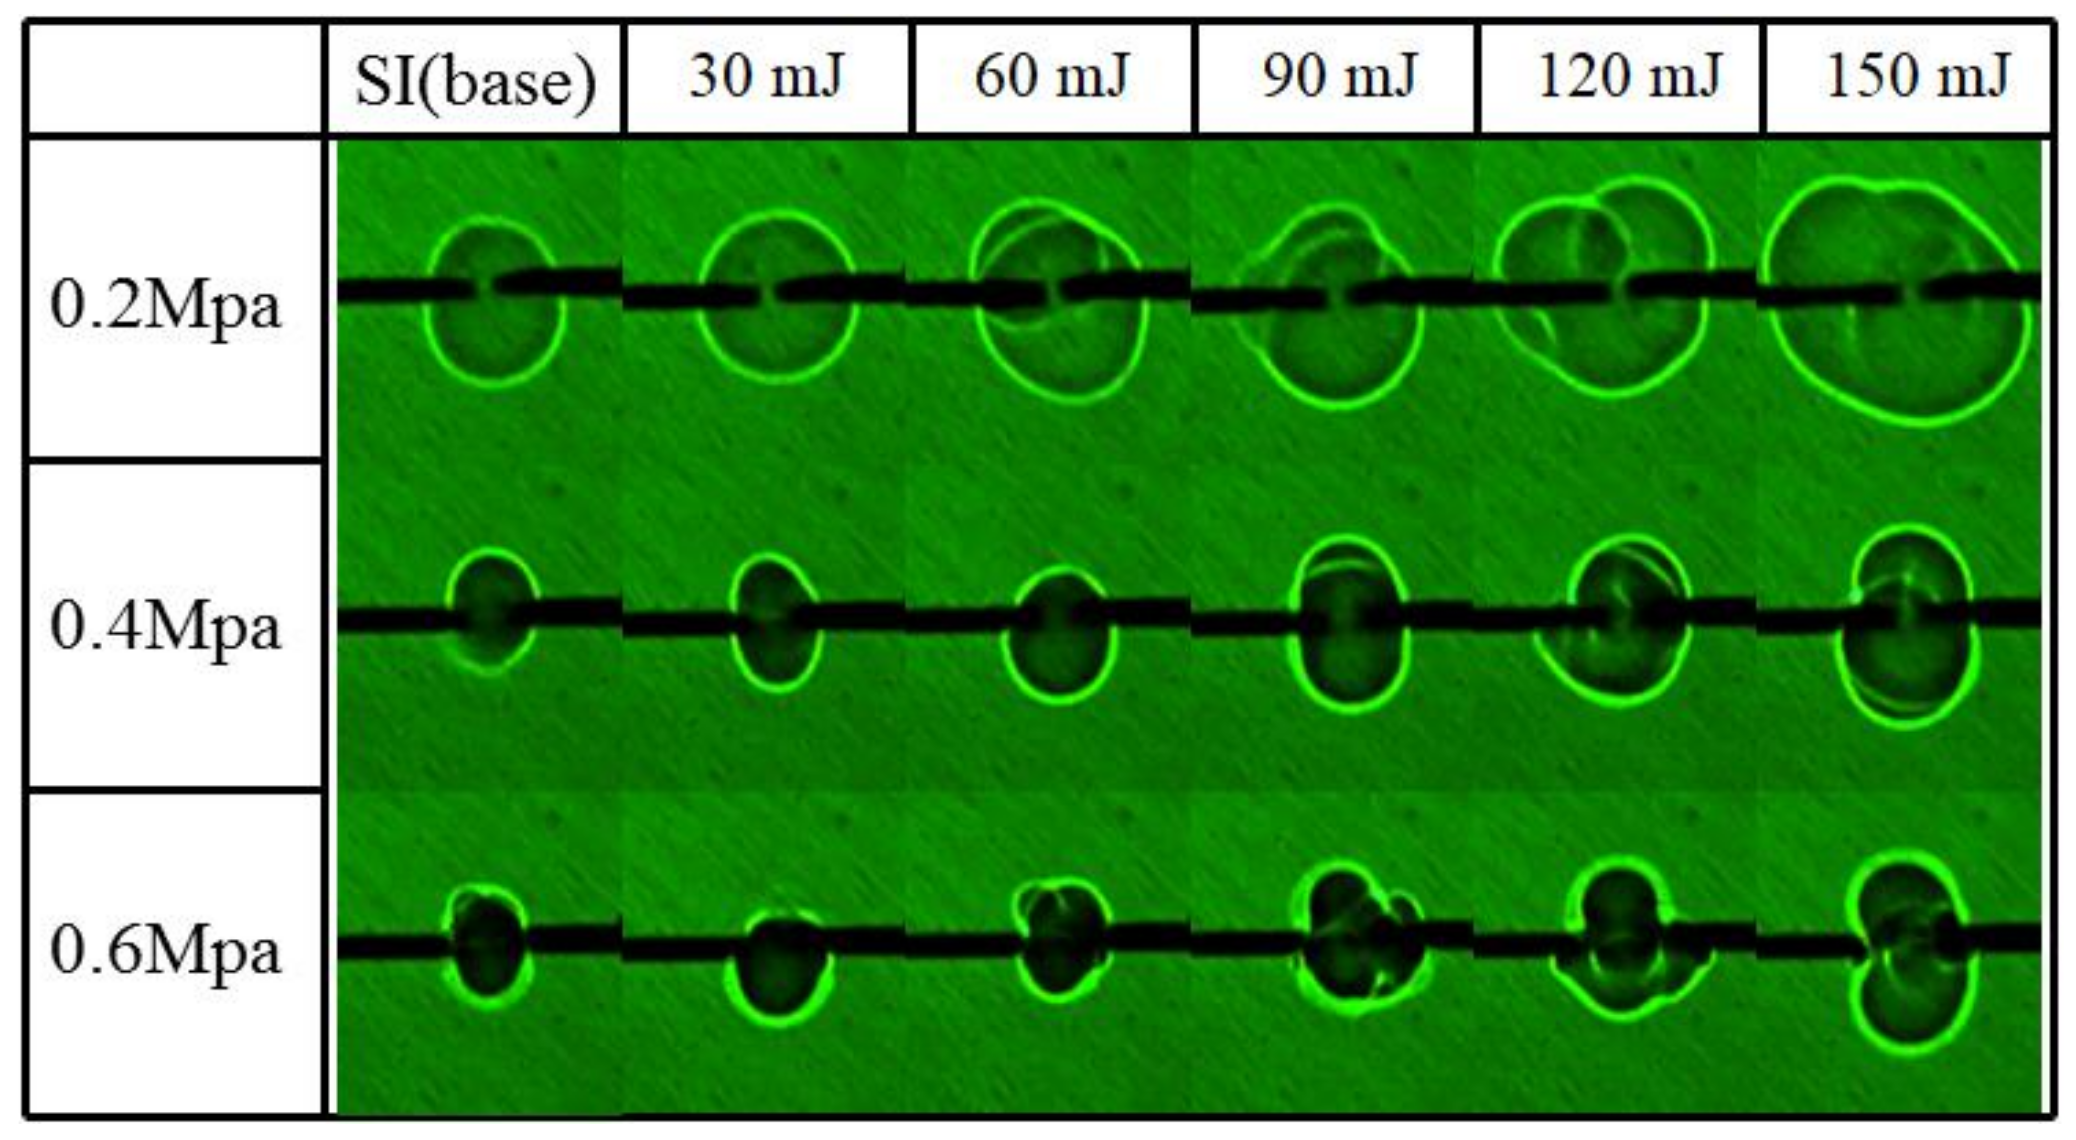
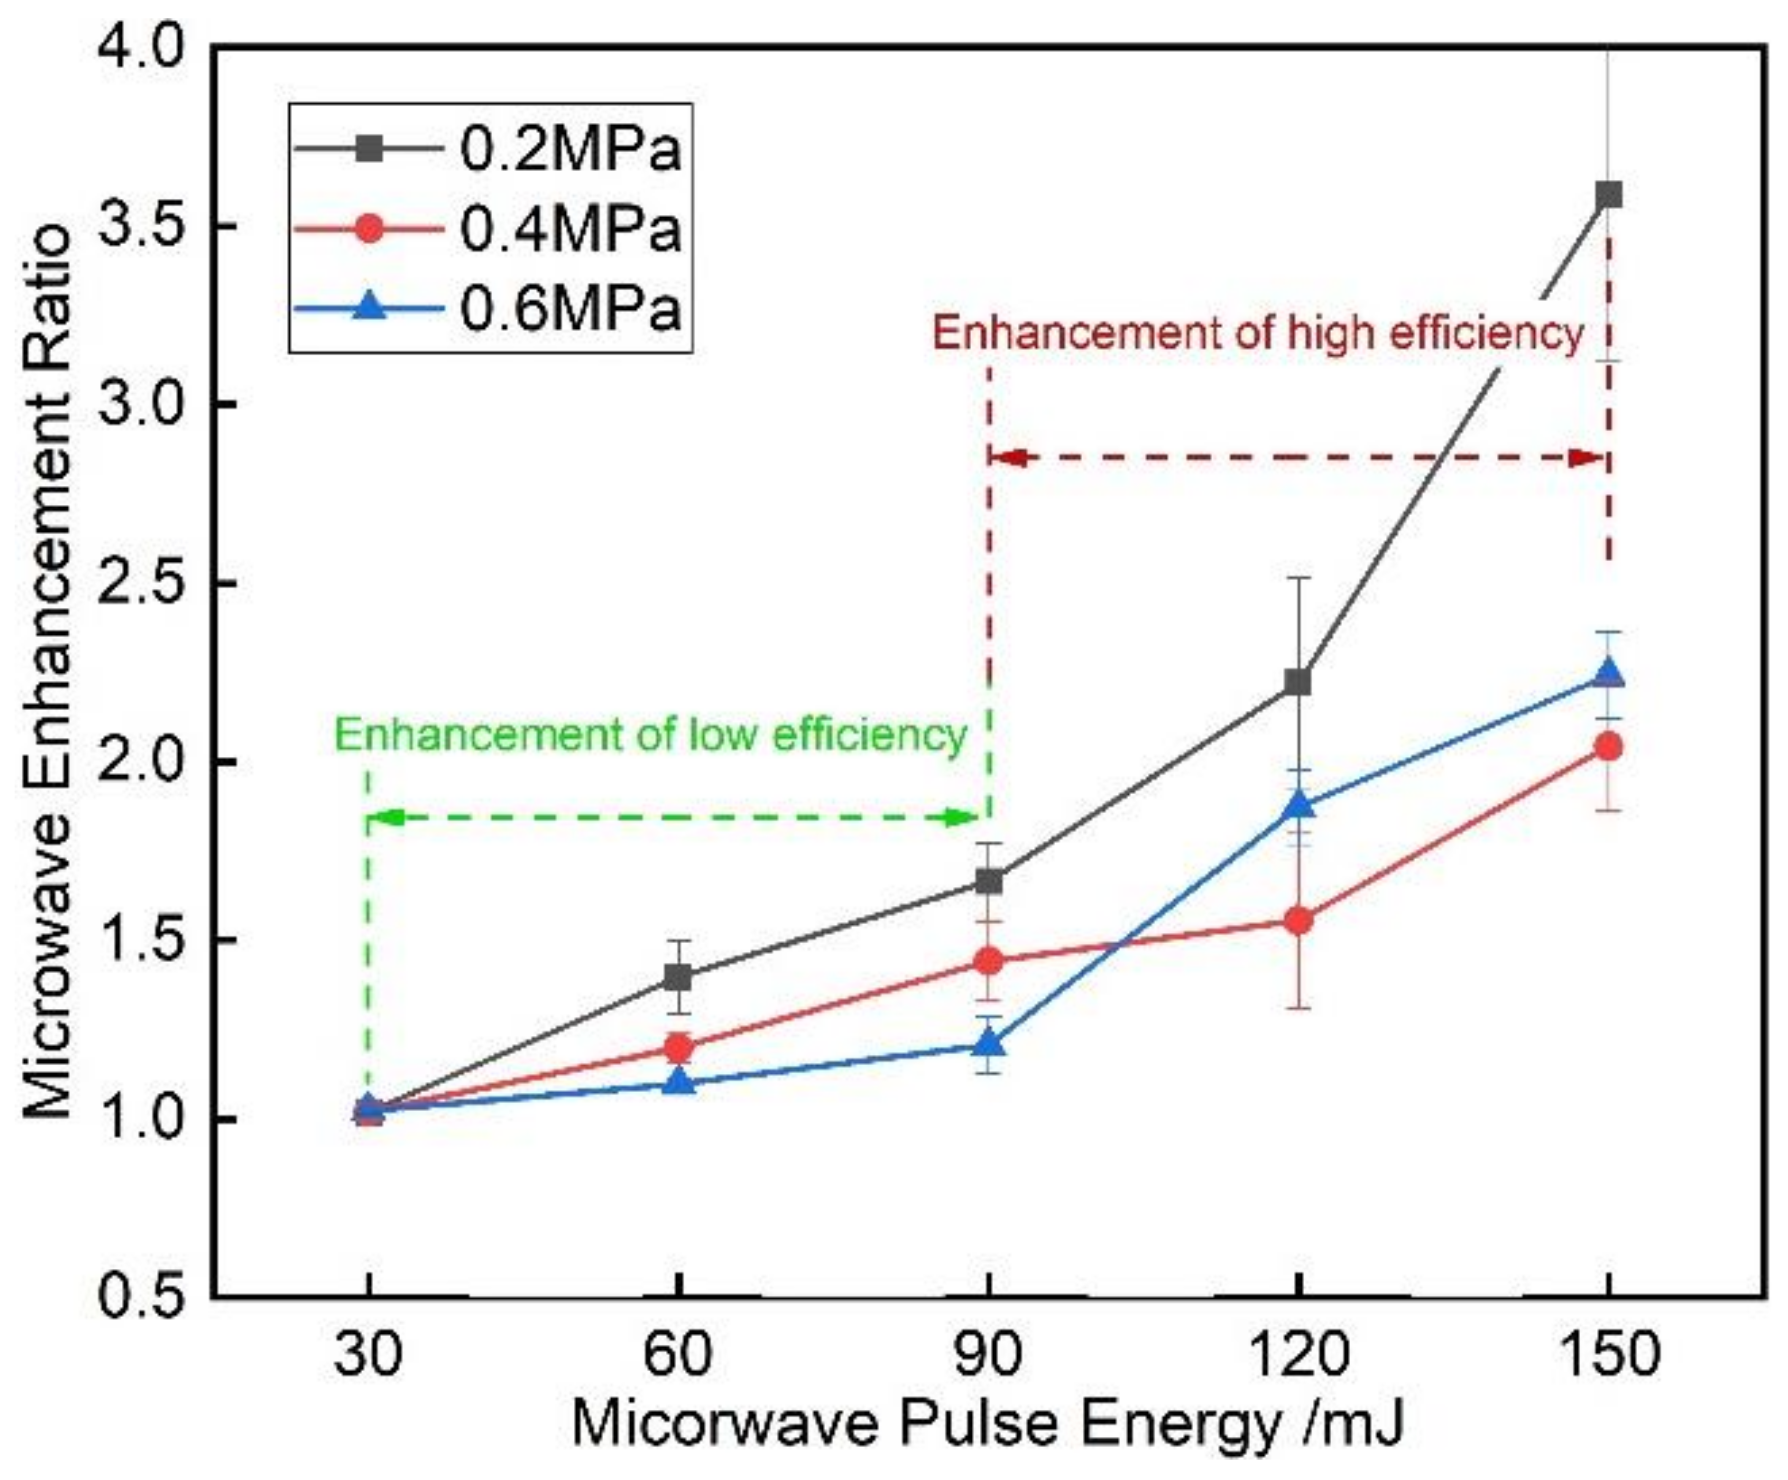
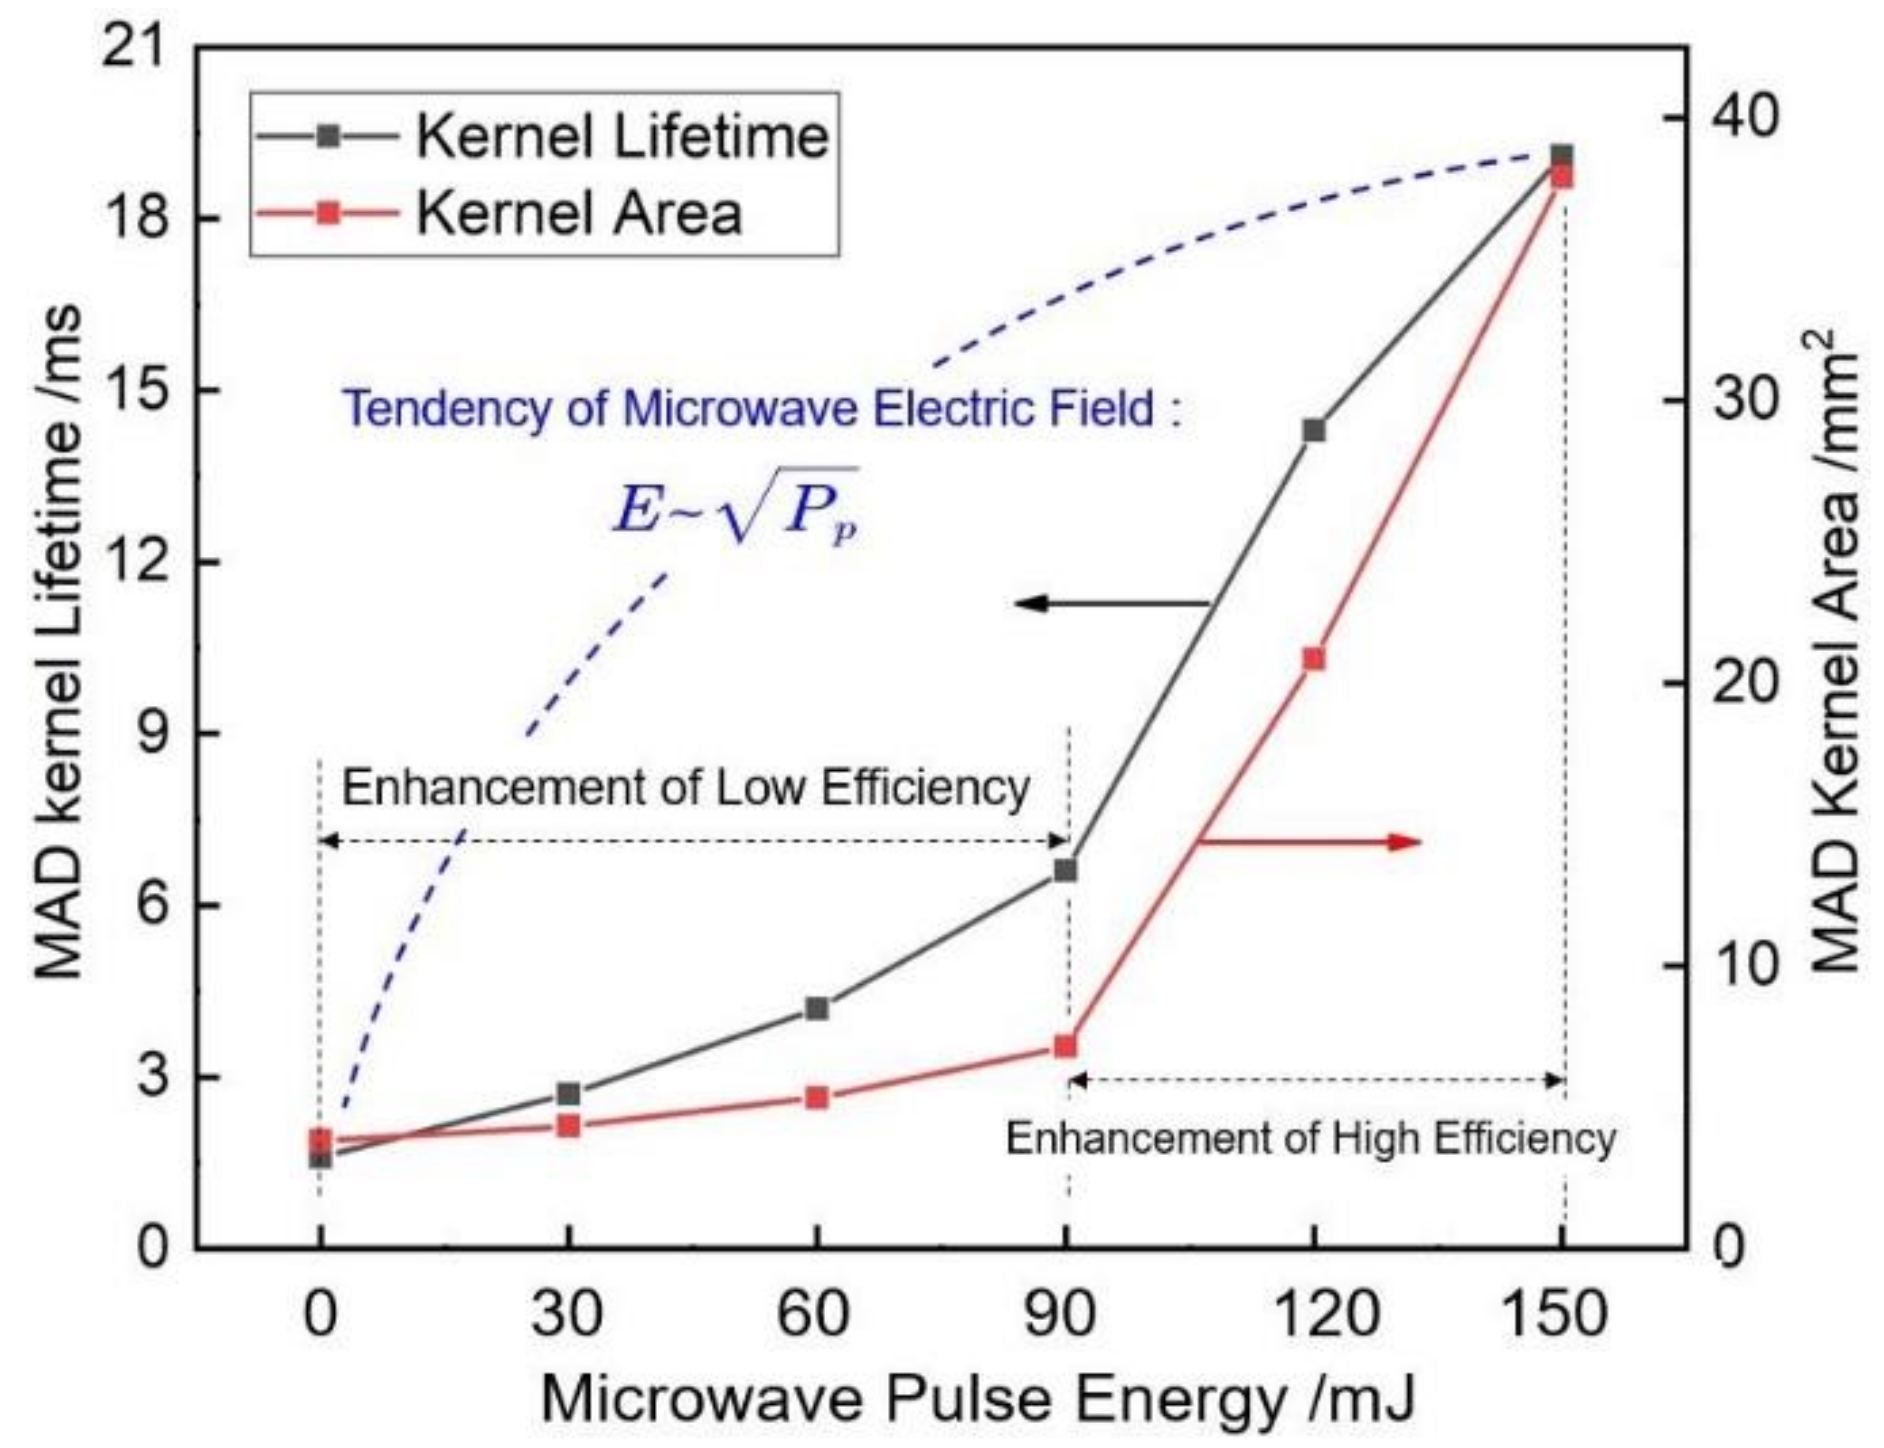
3.1. Threshold Process of Flame Development with Increasing Pulse Energy

One direct way to improve the microwave energy absorption is increasing the pulse energy of microwave source. Figure 6 shows the image sequence of ignition test with an equivalence ratio of 0.6 and ambient pressure of 0.2 MPa at different pulse energy. The addition of microwave generates a bright spot at the center of flame kernel, and the bright spot becomes brighter and the flame area increases as the microwave pulse energy increases. Figure 7 presents the flame area evolution against time. As pulse energy increases, the flame area steadily increases. The flame speed evolution against flame radius is provided in Figure 8. Figure 8 indicates that a typical spark ignition (SI) process can be divided into three stages as named Stage 1, Stage 2, and Stage 3. In Stage 1, following the breakdown, spark energy is dominant in this stage, and it drives the ignition kernel expansion, but the flame speed is quickly reduced as the flame front propagates without extra energy supplied. Only if the flame kernel radius exceeds its critical flame radius before the flame speed decreases to zero, can the flame kernel enter the Stage 2 [27]. In Stage 2, more combustion reactions can release chemical energy to support the flame expanding, and thus the flame speed increases again. After the flame kernel radius developing to a certain level, the chemical energy released from combustion reactions will completely dominate the subsequent flame development. Then, the flame will enter the Stage 3 and grow to a self-sustained flame. This phenomenon was also reported in other papers [27,28]. The flame speeds in all cases approach to a uniform value in Stage 3, indicating that the effect of increasing the pulse energy chiefly speeds up the early flame development but has no apparent influence on flame propagation.
Figure 9 presents the images of MAI kernel at 7 ms after the start of spark with increasing microwave pulse energy under pulse repetition frequency of 40 kHz and equivalence ratio of 0.6. In the spark ignition (SI) case, the flame surface is relatively smooth because in the early stage of CH4-Air flame the hydrodynamic instability [29,30] is not strong enough to significantly affect the flame morphology. In the 30 mJ microwave pulse energy case, the flame characteristics are nearly identical to the case without microwave. As the microwave pulse energy increases further, wrinkles occur on the flame surface and a larger flame area are observed. Figure 10 provides the clearer evolution of microwave enhancement ratio corresponding to Figure 9. Figure 11 shows the flame deformation index evolution against pulse energy. Increasing microwave pulse energy not only makes the flame area larger, but also deforms the flame more obviously. Furthermore, as shown in Figure 10, there is a difference in enhancing efficiency between lower pulse energy and higher pulse energy. For instance, in the 0.2 MPa case, there is a possible pulse energy threshold of 90 mJ. When the microwave pulse energy is less than 90 mJ, the microwave enhancing efficiency on SI is relatively low, but once the pulse energy increases greater than 90 mJ, the enhancing efficiency becomes higher in terms of flame area.
A possible reason is related to the chemical kinetics. At low pulse energy, the microwave effect may be mainly reflected in heating rather than chemical reaction kinetics since the electric field is not strong enough [31]. In addition, since the absorption efficiency of spark plasma to microwave energy is low as analyzed in Section 2.2, the spark-absorbed microwave energy in the 30 mJ and 60 mJ cases are not prominent compared to the spark energy of 45 mJ, finally causing unremarkable enhancement. To the contrary, at higher pulse energy, microwave may not only have the thermal effect, but also have the possibility to induce high-energy electron collisions in the strong local electric field region to enhance the chemical reaction kinetics [31]. Therefore, a surge in microwave enhancement occurs when the pulse energy goes beyond a certain threshold value. This tendency levels off under 0.4 MPa and 0.6 MPa ambient pressures and this may support the above hypothesis, since the mean electron energy is reduced under higher ambient pressures. Rao. et al. [32] reported a similar phenomenon with a power threshold of microwave beyond which more oxhydryl radical were generated. Thus, the enhanced chemical kinetics were believed to be a decisive factor that caused the obvious difference in enhancing efficiency between higher and lower microwave power. Whether the chemical effect is the only regime responsible for causing the difference is still questionable since the combustion is closely coupled with the thermal effect.
In order to decouple the chemical reaction kinetics from the thermal effect, discharge tests in which the equivalence ratio is 0 are conducted. Figure 12 shows the typical discharge image sequences with various microwave pulse energies. In the base case, a typical spark discharge (SD) process can be divided into two stages, namely rapidly expanding driven by the spark energy and gradually dimming without extra energy supply. With the microwave added, the kernel obviously becomes larger and exists for a longer time. In addition, higher energy induces a brighter spot at the kernel center, indicating that more excited particles are generated [24].
Figure 13 gives the information about the maximum area and lifetime of microwave-assisted discharge (MAD) kernel at different microwave pulse energy, where the lifetime is defined as the length from the sparking to the moment when the discharge kernel edge cannot be recognized by the MATLAB program. The maximum kernel area and lifetime of discharge kernel are two indicators that mirror the thermal effect of microwave energy, since the initial spark energy for each case is the same and there is no fuel. The square of the microwave field strength is approximately proportional to the microwave pulse energy [33]. As shown in Figure 13, obviously, the trend of two indicators is not consistent with that of the electric field intensity nor the linear increase of microwave energy. Similar to the situation in the ignition test, the discharge test shows different microwave efficiency between low pulse energy and higher pulse energy cases. Since there is no influence from combustion reaction kinetics, the key to explain this phenomenon can found regarding the efficiency of microwave energy absorption. Note that the process of spark kernel absorbing microwave energy is completed mainly through electrons, because the great mass difference between electron and ions makes ions hardly accelerated by 2.45 GHz microwave electric field [34]. Therefore, the number of electrons is closely related to the amount of microwave energy that the spark kernel can absorb.
Therefore, there is a reasonable description for the observation in Figure 13. In the spark discharge process, the electron number reaches its peak value at the moment spark breakdown occurs, which then quickly drops in 2 milliseconds due to the electron collisions [24]. With the addition of microwave, the rapid reduction in electron density will be slowed down. The larger number of electrons maintained by the higher microwave pulse energy will in turn increase the absorption efficiency of spark kernel in the subsequent microwave duration. From both the ignition and discharge tests, this “self-acceleration” interaction characteristic between the microwave and spark kernel may cause the threshold process. The bright spot generated by microwave at the flame center may support this hypothesis. The bright spot is dim and does not reappear in 30 mJ case implying that microwave has no obvious effect for the last 2 ms of the entire 3 ms duration. In the 120 mJ and 150 mJ cases, the presence of bright spot is occurring throughout the duration indicating the longer interacting period between microwave and spark kernel.

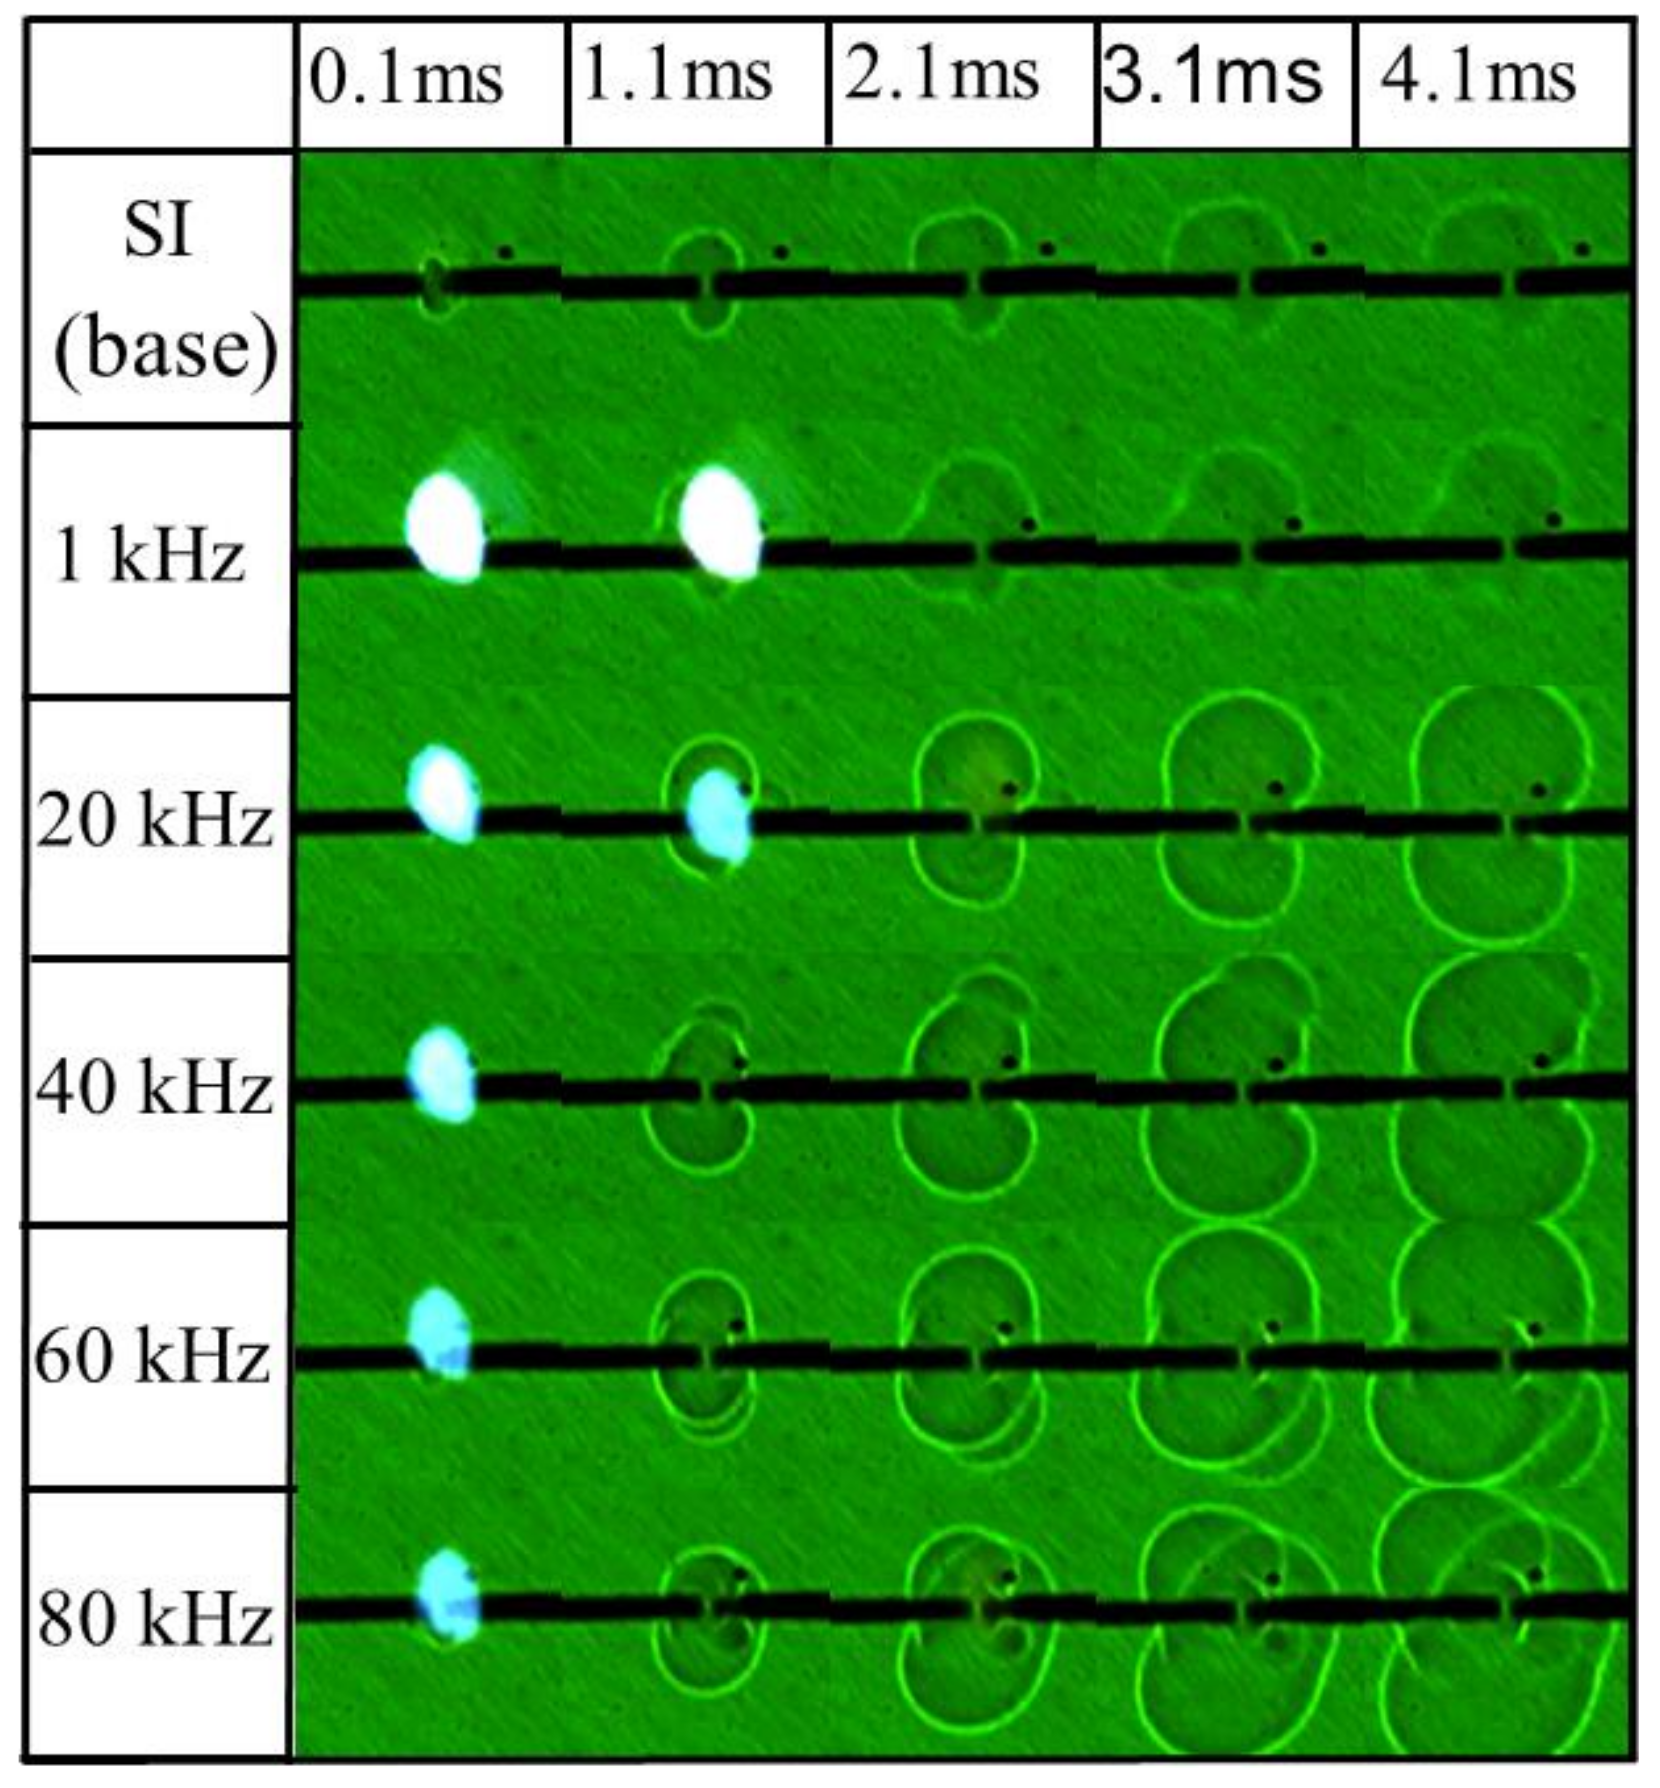
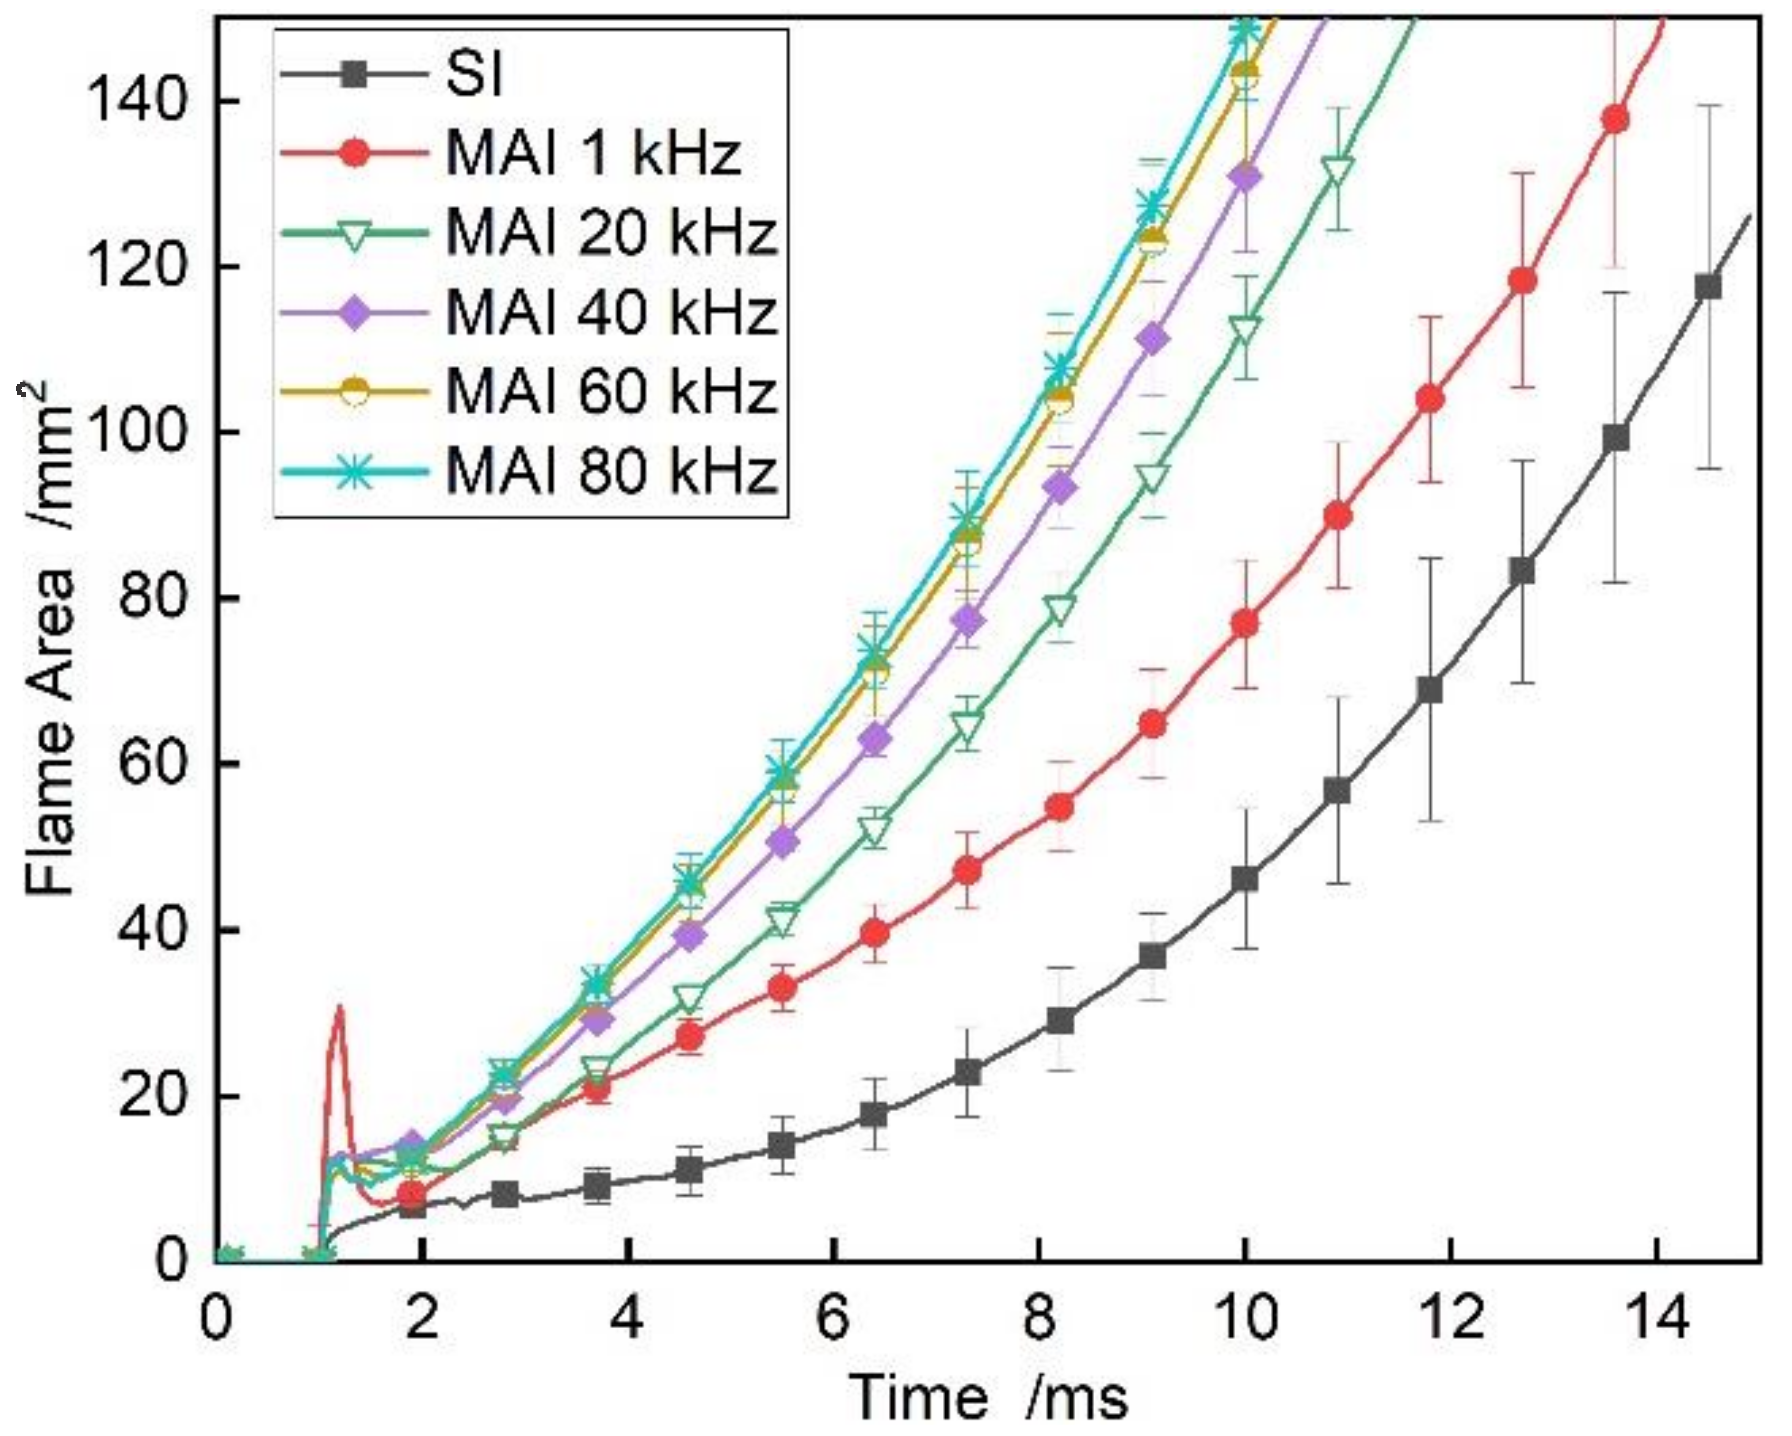
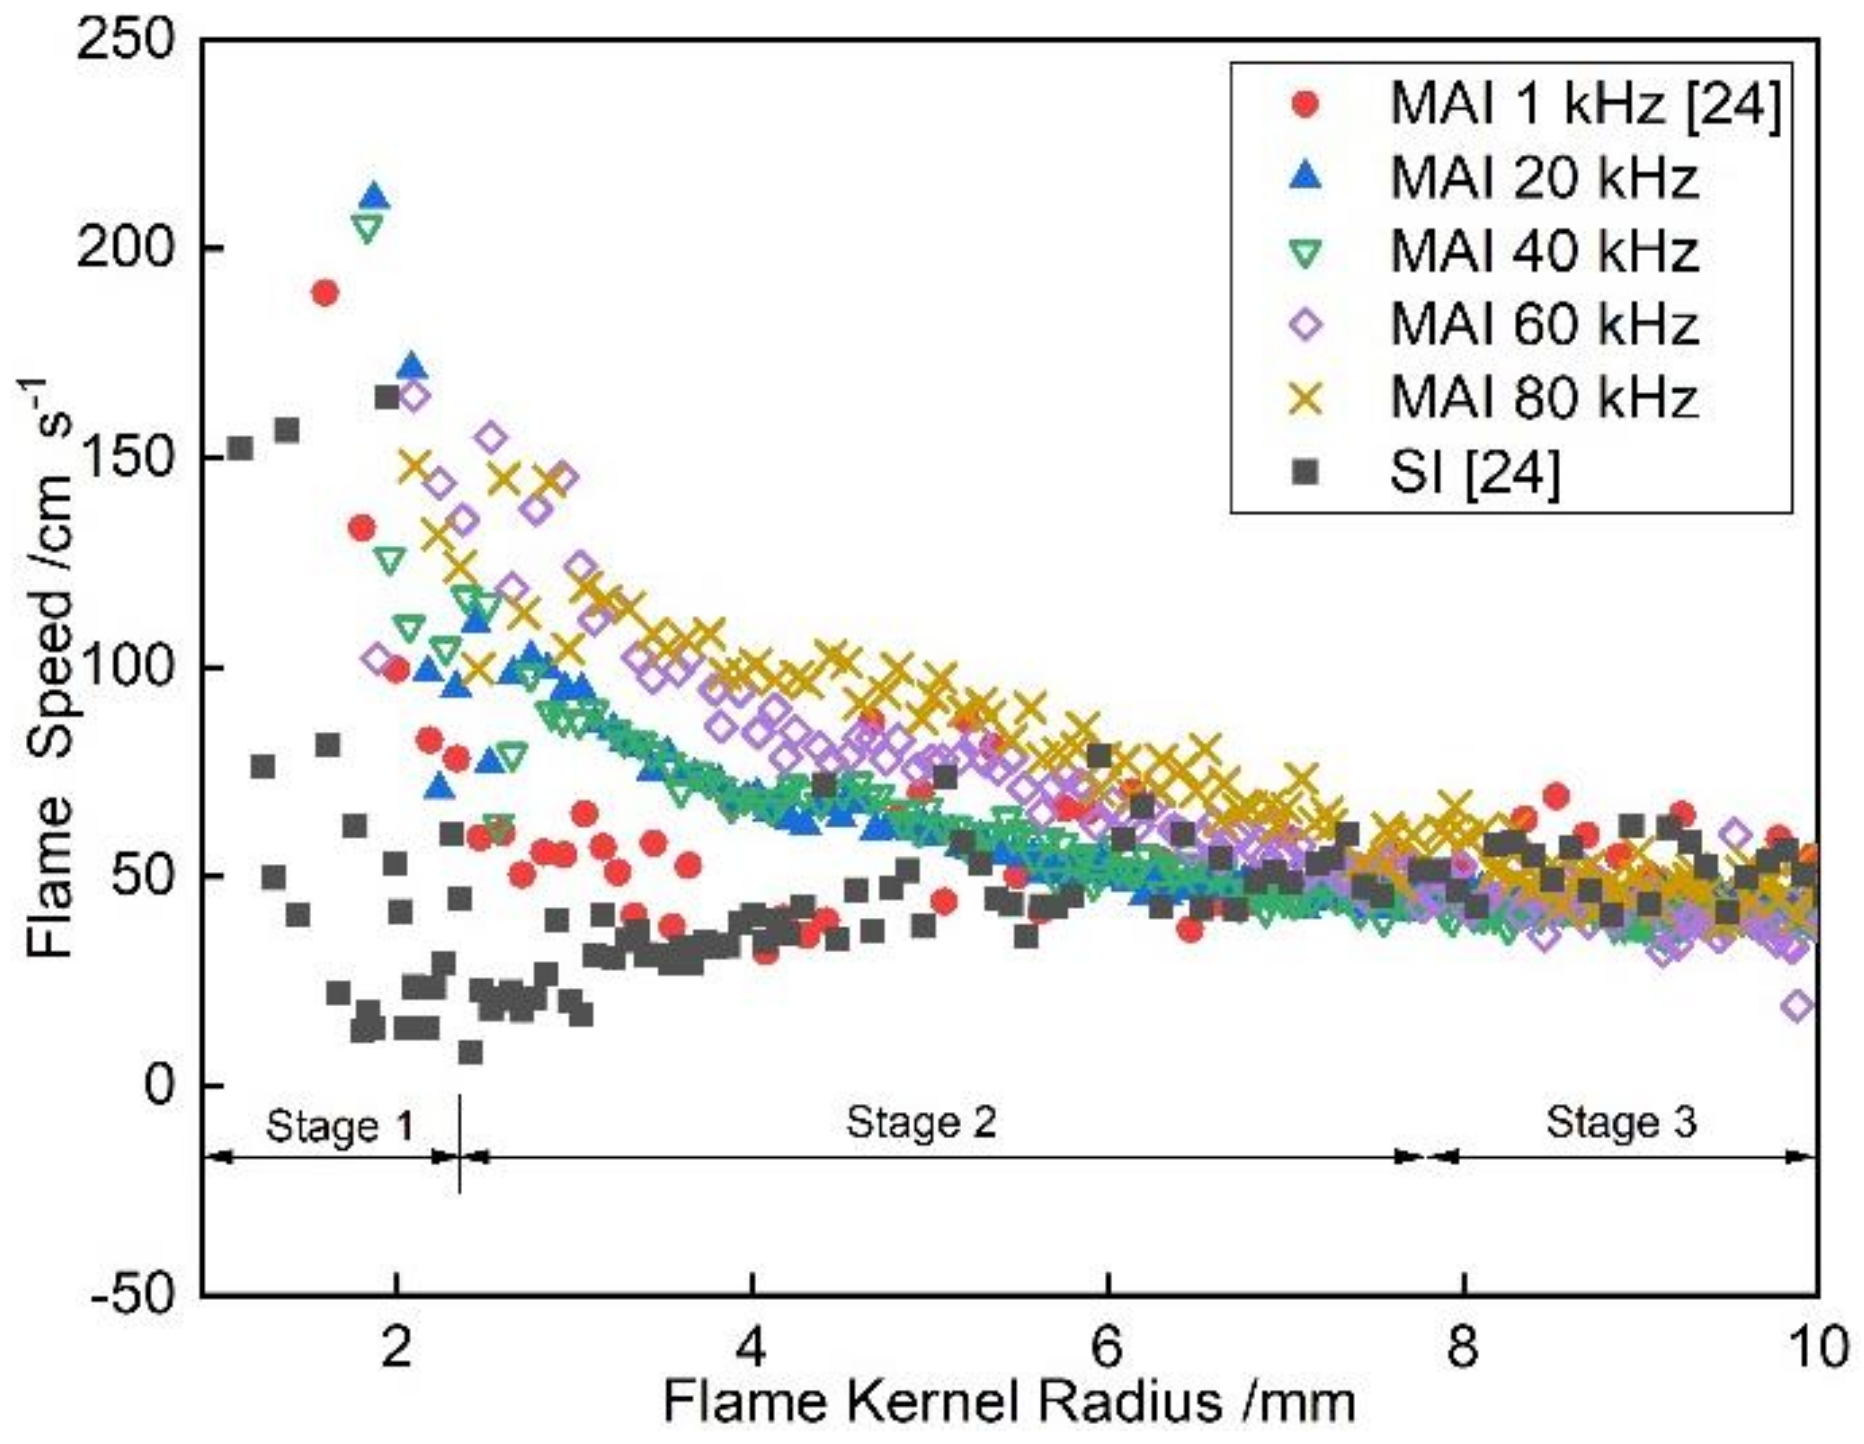
3.2. Flame Deformation with Various PRF

To understand the influence of microwave pulse on the flow of early flame, the effect of microwave pulse repetition frequency (PRF) on MAI performance is studied through ignition tests under various ambient pressures. Early ignition kernel image sequence in Figure 14 presents that flame kernel is larger when higher PRF is used. Besides, microwave radiation generates bright spots at the center of flame kernel as well as the cracks on flame surface. Here, the crack means the line on the flame surface, which may arise from the initial wrinkles on flame kernel. From Figure 14, the largest brightness of the bright spot occurs in 1 kHz case, and it reduces as PRF increases, and this tendency is consistent with that in [24]. However, the cracks are more obvious with higher microwave PRF. The time evolution of flame kernel area for MAI with pulse repetition frequency varied from 1–80 kHz is provided in Figure 15. The flame area grows faster as microwave pulse repetition frequency increases, and such propensity is more prominent when increasing the pulse repetition frequency from 0 (SI) to 20 kHz. However, raising the pulse repetition frequency further, the tendencies toward flame kernel development become closer.
The flame speed versus kernel radius with different PRF is presented in Figure 16. The addition of 1 kHz microwave pulses obviously enhances the flame development in Stage 1 and Stage 2, and it reduces the required time for flame kernel reaching the critical flame radius. Furthermore, increasing the pulse repetition frequency accelerates this process further. The additions of 20–80 kHz microwave pulses even make the Stage 2 be completely skipped and the flame development directly turns to Stage 3. This may be because the microwave accelerates the electrons in the flame kernel, which then enhance the reaction kinetics by a series of collisions. On the whole, increasing pulse repetition frequency mainly accelerates early flame development, but at later stages the growth rates of flames with different pulse repetition frequency converge gradually. This tendency is similar with that shown in Figure 8, to some extent verifying that increasing PRF may increase the energy absorption efficiency since the total energy is the same in each case.
Figure 17 shows the shadowgraph images of flame kernel at 7 ms after sparking, and Figure 18 provides the corresponding microwave enhancement ratio with different pulse frequencies under 0.2 MPa, 0.4 MPa, and 0.6 MPa. Obviously, although the enhancement of microwave weakens with ambient pressure increasing, in terms of flame area, increasing pulse repetition frequency provides a considerable improvement for MAI under high ambient pressures. However, the effect of increasing pulse repetition frequency levels off after it increases beyond 20 kHz, particularly under 0.6 MPa ambient pressure.
Figure 19 shows the evolution of flame deformation index with microwave pulse repetition frequency. Under 0.2 MPa, 1 kHz PRF causes the largest deformation, and as the PRF increases, the flame deformation index reduces though the flame area increases. When the ambient pressure raises to 0.6 MPa, the deformation index increases with PRF. One possible reason for the different tendency of deformation index in the two cases is because that under 0.2 MPa the flame speed is larger [29], and disturbance generated by high PRF pulses is too weak to influence the flame front which leaves the electrode gap too fast. By contrast, the flame speed is much slower under 0.6 MPa [29], and the flame front can therefore stay at the strong region of microwave electric field for a longer time, so that a high PRF pulse can induce more wrinkles which can easily affect the flame circularity. Besides, from Figure 14 and Figure 17, as the pulse repetition frequency rises, more wrinkles appear on the flame surface, implying that changing the flow on the flame kernel surface and enlarging the reaction area may be another way to enhance the ignition using microwave. The formation mechanism of these wrinkles may result from the plasma instabilities and will be discussed in detail in Section 3.3.
Another reasonable cause for this improvement may be that the higher pulse repetition frequency makes the energy absorption of spark plasma more efficient. If the pulse repetition frequency is set as 1 kHz, for instance, the pulse width of a single pulse is 0.2 ms longer than that in higher frequency, and this may cause a sharp temperature increase in this period, and the majority of energy may be lost through heat transfer with the electrodes. As pulse repetition frequency increases, the plasma average temperature may decrease. It is possible that the plasma shows the characteristics of low temperature plasma, and thus more energy is sufficiently used in flame kernel expanding [13,14]. However, the enhancement amplitude by microwave gradually levels off as the pulse repetition frequency increases further, indicating that the net energy absorbed by the flame kernel approaches to a consistent value.

3.3. Mechanism of the Wrinkles

Based on the image sequences in previous sections, the kernel morphology feature during the subsequent development differs under various conditions. Figure 20 presents the typical images at 3 ms after sparking in MAD and MAI modes with a pulse repetition frequency of 1–80 kHz and pulse energy of 150 mJ under 0.2 MPa. In MAD mode, there is no fuel and thus the spark kernel will not form a flame. The kernel size with 1 kHz pulse repetition frequency is the smallest, but the kernel front is distinctively driven far away from the center of electrodes. Increasing the pulse repetition frequency makes more and more wrinkles occur on the kernel surface. In MAI mode, the spark kernel finally forms a propagating flame, but the wrinkles on flame surface are not obvious, even if the pulse repetition frequency is increased.
Wrinkles recorded by the high-speed camera through the shadowgraph method are related to the density gradient on the flame kernel surface which is closely related to the local temperature [35]. Note that the shock wave generated by the spark will affect the density field, but it is not considered in present paper since a typical speed of shock wave is at 102–103 m/s scale [36], indicating that the shock wave will leave the electrodes in less than 10 microseconds. In MAD mode, the discharge kernel temperature during the whole lifetime is relatively lower because there is no fuel, so that the addition of microwave pulse may lead to significant changes in local temperature and generate apparent density ripples. However, in MAI mode, the flame kernel temperature is far higher because of the extra energy released from chemical reactions, such that microwave pulses may give no explicit rise to the temperature and less wrinkles can be observed.
Considering that the density ripples are originated from the pulse microwave energy, and the energy transmission process can be described as that the electrons are firstly accelerated by microwave electric field, and then the energy is converted to thermal energy by electron collisions to form the density ripples. Thus, the distributions of both the microwave electric field and electron density control the wrinkle formation. Since the electrons are mainly located at the gap of the electrodes where the gas breakdown occurs, the microwave electric field distribution will help to understand why the wrinkle number increases with the pulse repetition frequency. Therefore, the microwave electric field distribution is simulated here using COMSOL Multiphysics based the model similar to [25], and the result is plotted in Figure 21. Here, the plane shown in Figure 21 is perpendicular to the electrodes. So, the electrodes are projected as two points coinciding at the center of the plane. As shown in Figure 21, the largest microwave electric filed strength is located at the center and it is attenuated as the distance from gap center increases.
Plasma-absorbed mean microwave energy can be expressed by the equation below:
P = n e 2 E 2 2 m v v 2 v 2 + ω 2
where E is the electric field, v is the collision frequency between electron and bulk gas, ne and m is the electron density and mass, respectively [37]. w is 2.45 GHz in present study.
Based on Figure 21 and Equation (7), there is a possible description about the process of plasma absorbing microwave energy. When microwave is on, electrons from spark breakdown absorb the microwave energy, and the absorbed amount depends on the local electric field strength. Electrons with different energy then collide with other particles, generating a local temperature increase, and due to the gradient of electric field, a temperature gradient. Thus, a pressure gradient appears which pushes the plasma away. Then, the wrinkles (density ripples) are generated. The whole process is based on the electron collisions [38] which is in line with the situation in the present paper that electron collision is of extremely high frequency.
When the microwave pulse repetition frequency is 1 kHz, the pulse width of a single pulse is longer, so the temperature gradient formed by the microwave is stronger in this period, and it causes the bigger disturbance. That is why the kernel front in a certain direction is distinctively far away from the electrode center. As pulse repetition frequency rises, the temperature gradient generated by a single microwave pulse is reduced, and thus the amplitude decreases. However, the number of disturbances in a unit of time increases, so that more wrinkles are observed.
Moreover, the different regimes in influencing the flow on flame with 1 kHz and higher PRF may also indicate that their enhancing mechanisms for the flame development are different. Possibly, the stronger density disturbance induced by 1 kHz microwave increases the momentum of flame front and drives it away from the electrode center, reducing the heat loss to the electrodes and thus enhancing the ignition. With the PRF increasing, the amplitude of the induced disturbance decreases but the reaction area may increase, strengthening the flame development.

4. Conclusions

The effects of microwave pulses on the spark-ignited flame kernel development are experimentally investigated based on a self-developed constant volume combustion chamber system. Special attention is paid to the energy absorption and early flame morphology. Based on this, the mechanism of microwave enhancement is deeply discussed, and the following conclusions can be summarized:
Microwave pulses can effectively enlarge the flame area and deform the flame kernel boundary, but the effect deteriorates with increases in ambient pressure. Increasing microwave pulse energy, the effect of microwave on flame kernel is improved under high ambient pressures as more energy is emitted in. Unexpectedly, increasing the microwave pulse energy, the microwave enhancement shows a threshold process. When the microwave energy is below the threshold value, the enhancing amplitude is smaller than that when microwave energy is beyond the threshold value. A similar threshold process is also observed in the discharge tests, indicating that the absorption efficiency of spark for microwave energy may be increased as microwave energy increases.
Raising the microwave pulse repetition frequency ameliorates the negative effect of pressure on microwave enhancement, and the reasons for this may be considered from two aspects. On one hand, it increases the wrinkles and aggravates the flame deformation, particularly under high ambient pressures, to some extent increasing the reaction area and convection on the flame surface. On the other hand, it may improve the absorption efficiency of spark plasma on microwave energy.
Inducing disturbance and then deforming the flame surface is a possible regime for microwave pulses to enhance the spark ignition. However, this enhancing regime may also change when increasing pulse repetition frequency from 1 to 80 kHz. With 1 kHz pulse repetition frequency, the strong density ripple pushes the flame front away from electrodes and thus reduces the heat loss. However, when 80 kHz pulse repetition frequency is adopted, the wrinkles are accumulated on the flame surface and expand the reaction area.

Author Contributions

Conceptualization, X.C. and Z.W. (Zhaowen Wang); methodology, X.Z.; software, H.W.; validation, H.W and X.Z.; writing—original draft preparation, X.Z.; writing—review and editing, Z.W. (Zhaowu Wang) and J.-Y.C.; supervision, Z.W. (Zhaowen Wang); project administration, X.C.; funding acquisition, Z.W. (Zhaowen Wang). All authors have read and agreed to the published version of the manuscript.

Funding

This research was funded by the State Key Laboratory of Automotive Safety and Energy, grant number KF2028 and the National Natural Science Foundation of China, grant number 51576083.

Institutional Review Board Statement

Not applicable.

Informed Consent Statement

Not applicable.

Data Availability Statement

The data presented in this study are available on request from the corresponding author.

Acknowledgments

Dong Zhou and Zhihao Wang are greatly acknowledged for their unselfish assistance in the experiments.

Conflicts of Interest

The authors declare no conflict of interest. The funders had no role in the design of the study; in the collection, analyses, or interpretation of data; in the writing of the manuscript, or in the decision to publish the results.

References

  1. Yu, X.; Guo, Z.; Sun, P.; Wang, S.; Li, A.; Yang, H.; Li, Z.; Liu, Z.; Li, J.; Shang, Z. Investigation of combustion and emissions of an SI engine with ethanol port injection and gasoline direct injection under lean burn conditions. Energy 2019, 189, 116231. [Google Scholar] [CrossRef]
  2. Zhuang, Y.; Qian, Y.; Hong, G. Lean Burn Performance of a Spark Ignition Engine with an Ethanol–Gasoline Dual Injection System. Energy Fuels 2018, 32, 2855–2868. [Google Scholar] [CrossRef]
  3. Collin-Bastiani, F.; Vermorel, O.; Lacour, C.; Lecordier, B.; Cuenot, B. DNS of spark ignition using Analytically Reduced Chemistry including plasma kinetics. Proc. Combust. Inst. 2019, 37, 5057–5064. [Google Scholar] [CrossRef]
  4. Sjerić, M.; Kozarac, D.; Tatschl, R. Modelling of early flame kernel growth towards a better understanding of cyclic combustion variability in SI engines. Energy Convers. Manag. 2015, 103, 895–909. [Google Scholar] [CrossRef]
  5. Imamura, O.; Chen, B.; Nishida, S.; Yamashita, K.; Tsue, M.; Kono, M. Combustion of ethanol fuel droplet in vertical direct current electric field. Proc. Combust. Inst. 2011, 33, 2005–2011. [Google Scholar] [CrossRef]
  6. Kim, G.T.; Park, D.G.; Cha, M.S.; Park, J.; Chung, S.H. Flow instability in laminar jet flames driven by alternating current electric fields. Proc. Combust. Inst. 2017, 36, 4175–4182. [Google Scholar] [CrossRef]
  7. Mao, X.; Chen, Q.; Rousso, A.C.; Chen, T.Y.; Ju, Y. Effects of controlled non-equilibrium excitation on H2/O2/He ignition using a hybrid repetitive nanosecond and DC discharge. Combust. Flame 2019, 206, 522–535. [Google Scholar] [CrossRef]
  8. Kuhl, J.; Seeger, T.; Zigan, L.; Will, S.; Leipertz, A. On the effect of ionic wind on structure and temperature of laminar premixed flames influenced by electric fields. Combust. Flame 2017, 176, 391–399. [Google Scholar] [CrossRef]
  9. Park, D.G.; Chung, S.H.; Cha, M.S. Bidirectional ionic wind in non-premixed counterflow flames with DC electric fields. Combust. Flame 2016, 168, 138–146. [Google Scholar] [CrossRef]
  10. Park, D.G.; Chung, S.H.; Cha, M.S. Visualization of ionic wind in laminar jet flames. Combust. Flame 2017, 184, 246–248. [Google Scholar] [CrossRef]
  11. Leonov, S.B. Electrically Driven Supersonic Combustion. Energies 2018, 11, 1733. [Google Scholar] [CrossRef] [Green Version]
  12. Ikeda, Y.; Nishiyama, A.; Kaneko, M. Microwave Enhanced Ignition Process for Fuel Mixture at Elevated Pressure of 1 MPa. In Proceedings of the 47th AIAA Aerospace Sciences Meeting including The New Horizons Forum and Aerospace Exposition, Orlando, FL, USA, 5–8 January 2009. [Google Scholar] [CrossRef]
  13. Ikeda, Y.; Nishiyama, A.; Katano, H.; Kaneko, M.; Jeong, H. Research and Development of Microwave Plasma Combustion Engine (Part II: Engine Performance of Plasma Combustion Engine); SAE 2009-01-1049; SAE: Warrendale, PA, USA, 2009. [Google Scholar]
  14. Ikeda, Y.; Nishiyama, A.; Wachi, Y.; Kaneko, M. Research and Development of Microwave Plasma Combustion Engine (Part I: Concept of Plasma Combustion and Plasma Generation Technique); SAE 01-1050; SAE: Warrendale, PA, USA, 2009. [Google Scholar]
  15. Rapp, V.H.; DeFilippo, A.; Saxena, S.; Chen, J.Y.; Dibble, R.W.; Nishiyama, A.; Moon, A.; Ikeda, Y. Extending Lean Operating Limit and Reducing Emissions of Methane Spark-Ignited Engines Using a Microwave-Assisted Spark Plug. J. Combust. 2012, 2012, 927081. [Google Scholar] [CrossRef] [Green Version]
  16. Nishiyama, A.; Ikeda, Y. Improvement of Lean Limit and Fuel Consumption Using Microwave Plasma Ignition Technology; SAE Technical Paper Series 2012-01-1139; SAE: Warrendale, PA, USA, 2012. [Google Scholar] [CrossRef]
  17. Wolk, B.; DeFilippo, A.; Chen, J.-Y.; Dibble, R.; Nishiyama, A.; Ikeda, Y. Enhancement of flame development by microwave-assisted spark ignition in constant volume combustion chamber. Combust. Flame 2013, 160, 1225–1234. [Google Scholar] [CrossRef]
  18. Hwang, J.; Bae, C.; Park, J.; Choe, W.; Cha, J.; Woo, S. Microwave-assisted plasma ignition in a constant volume combustion chamber. Combust. Flame 2016, 167, 86–96. [Google Scholar] [CrossRef]
  19. Starikovskaia, S.M. Plasma assisted ignition and combustion. J. Phys. D Appl. Phys. 2006, 39, R265–R299. [Google Scholar] [CrossRef]
  20. Ju, Y.; Sun, W. Plasma assisted combustion Dynamics and chemistry. Prog. Energy Combust. Sci. 2015, 48, 21–83. [Google Scholar] [CrossRef]
  21. Duan, H.; Wu, X.; Hou, J.; Zhang, C.; Gao, Z. Experimental study of lean premixed CH4/N2/O2 flames under low-frequency alternating-current electric fields. Fuel 2016, 181, 1011–1019. [Google Scholar] [CrossRef]
  22. Zhang, X.; Wang, Z.; Wu, H.; Liu, C.; Cheng, X.; Chen, J.-Y. Propulsive effect of microwave-induced plasma jet on spark ignition of CO2-diluted CH4-air mixture. Combust. Flame 2021, 229, 111400. [Google Scholar] [CrossRef]
  23. Zhang, X.; Wang, Z.; Huang, S.; Wu, H.; Jin, B.; Cheng, X. Experimental Study of CH4-Air Premixed Spherical Expanding Flames with Microwave Assisted Ignition. Trans. CSICE 2020, 38, 226–233. [Google Scholar] [CrossRef]
  24. Zhang, X.; Wang, Z.; Wu, H.; Zhou, D.; Huang, S.; Cheng, X.; Chen, J.-Y. Experimental study of microwave assisted spark ignition on expanding C2H2-Air spherical flames. Combust. Flame 2020, 222, 111–122. [Google Scholar] [CrossRef]
  25. Zhang, X.; Wang, Z.; Zhou, D.; Wu, H.; Cheng, X.; Jin, B.; Chen, J.-Y. Strengthening effect of microwave on spark ignited spherical expanding flames of methane-air mixture. Energy Convers. Manag. 2020, 224, 113368. [Google Scholar] [CrossRef]
  26. Cha, M.S.; Lee, Y. Premixed Combustion Under Electric Field in a Constant Volume Chamber. IEEE Trans. Plasma Sci. 2012, 40, 3131–3138. [Google Scholar] [CrossRef]
  27. Chen, Z.; Burke, M.P.; Ju, Y. On the critical flame radius and minimum ignition energy for spherical flame initiation. Proc. Combust. Inst. 2011, 33, 1219–1226. [Google Scholar] [CrossRef]
  28. Kim, H.H.; Won, S.H.; Santner, J.; Chen, Z.; Ju, Y. Measurements of the critical initiation radius and unsteady propagation of n-decane/air premixed flames. Proc. Combust. Inst. 2013, 34, 929–936. [Google Scholar] [CrossRef]
  29. Huang, S.; Zhang, Y.; Huang, R.; Xu, S.; Ma, Y.; Wang, Z.; Zhang, X. Quantitative characterization of crack and cell’s morphological evolution in premixed expanding spherical flames. Energy 2019, 171, 161–169. [Google Scholar] [CrossRef]
  30. Huang, S.; Huang, R.; Zhang, Y.; Zhou, P.; Wang, Z.; Yin, Z. Relationship between cellular morphology and self-acceleration in lean hydrogen-air expanding flames. Int. J. Hydrog. Energy 2019, 44, 31531–31543. [Google Scholar] [CrossRef]
  31. Starikovskiy, A.; Aleksandrov, N. Plasma-assisted ignition and combustion. Prog. Energy Combust. Sci. 2013, 39, 61–110. [Google Scholar] [CrossRef] [Green Version]
  32. Rao, X.; Hemawan, K.; Wichman, I.; Carter, C.; Grotjohn, T.; Asmussen, J.; Lee, T. Combustion dynamics for energetically enhanced flames using direct microwave energy coupling. Proc. Combust. Inst. 2011, 33, 3233–3240. [Google Scholar] [CrossRef]
  33. Stockman, E.S.; Zaidi, S.H.; Miles, R.B.; Carter, C.D.; Ryan, M.D. Measurements of combustion properties in a microwave enhanced flame. Combust. Flame 2009, 156, 1453–1461. [Google Scholar] [CrossRef]
  34. Chen, F.F. Introduction to Plasma Physics and Controlled Fusion, 3rd ed.; Springer: Cham, Switzerland, 2015; pp. 200–249. [Google Scholar] [CrossRef]
  35. Gu, X.; Li, Q.; Huang, Z.; Zhang, N. Measurement of laminar flame speeds and flame stability analysis of tert-butanol–air mixtures at elevated pressures. Energy Convers. Manag. 2011, 52, 3137–3146. [Google Scholar] [CrossRef]
  36. Colin, O.; Ritter, M.; Lacour, C.; Truffin, K.; Mouriaux, S.; Stepanyan, S.; Lecordier, B.; Vervisch, P. DNS and LES of spark ignition with an automotive coil. Proc. Combust. Inst. 2019, 37, 4875–4883. [Google Scholar] [CrossRef] [Green Version]
  37. Jankowski, K.J.; Reszke, E. Chapter 1, An Introduction to Microwave Plasma Spectrometries. In Microwave Induced Plasma Analytical Spectrometry; The Royal Society of Chemistry: London, UK, 2011; pp. 1–22. [Google Scholar] [CrossRef]
  38. Dysthe, K.B. A thermal oscillating two-stream instability. Phys. Fluids 1983, 26, 146–158. [Google Scholar] [CrossRef]
Figure 1. Schematic of the experimental setup.
Energies 14 06205 g001
Figure 2. Secondary voltage and current signals with 3 ms coil charging time.
Energies 14 06205 g002
Figure 3. The detected incident power and reflected power under different set power of microwave source.
Energies 14 06205 g003
Figure 4. Trig signal configuration.
Energies 14 06205 g004
Figure 5. Procedures of image processing (a) Original image; (b) gray processing; (c) Boolean subtraction and binaryzation; (d) linear interpolation; (e) filling and calculation.
Energies 14 06205 g005
Figure 6. Shadowgraph images of MAI kernel development with pulse energy 30–150 mJ at pulse repetition frequency 40 kHz under equivalence ratio 0.6 and ambient pressure 0.2 MPa.
Energies 14 06205 g006
Figure 7. Evolution of flame kernel area versus time in MAI mode with various pulse energy under equivalence ratio 0.6 and ambient pressure 0.2 MPa.
Energies 14 06205 g007
Figure 8. Flame speeds development against flame kernel radius with 3 ms MAI duration and 40 kHz PRF.
Energies 14 06205 g008
Figure 9. Images of flame kernel at 7 ms after start of spark with increasing microwave pulse energy under ambient pressure 0.2 MPa, 0.4 MPa, and 0.6 MPa.
Energies 14 06205 g009
Figure 10. Microwave enhancement ratio at 7 ms after start of spark with microwave pulse energy varying from 0–150 mJ under ambient pressure 0.2 MPa, 0.4 MPa, and 0.6 MPa.
Energies 14 06205 g010
Figure 11. Evolution of flame deformation index with microwave pulse energy.
Energies 14 06205 g011
Figure 12. Typical discharge kernel evolution in SI mode and MAI mode.
Energies 14 06205 g012
Figure 13. Maximum area and lifetime of microwave assisted discharge kernel at pulse energy 30–150 mJ at pulse repetition frequency 40 kHz under 0.2 MPa ambient pressure.
Energies 14 06205 g013
Figure 14. Image sequence of early flame with pulse repetition frequency of micro wave varying under 0.1 MPa ambient pressure and 0.7 equivalence ratio.
Energies 14 06205 g014
Figure 15. Time evolution of flame kernel area for SI and MAI with pulse repetition frequency 1–80 kHz under 0.1 MPa and φ = 0.7.
Energies 14 06205 g015
Figure 16. Flame speed versus kernel radius with pulse repetition frequency of 1–80 kHz under 0.1 MPa ambient pressure.
Energies 14 06205 g016
Figure 17. Shadowgraph images of flame kernel at 7 ms after sparking with various microwave pulse repetition frequencies under 0.2 MPa, 0.4 MPa and 0.6 MPa.
Energies 14 06205 g017
Figure 18. Microwave enhancement ratio at 7 ms after sparking with different pulse repetition frequencies under 0.2 MPa, 0.4 MPa and 0.6 MPa.
Energies 14 06205 g018
Figure 19. Evolution of flame deformation index with microwave pulse repetition frequency.
Energies 14 06205 g019
Figure 20. Typical wrinkles in shadowgraph images obtained with MAD and MAI mode of various pulse repetition frequencies.
Energies 14 06205 g020
Figure 21. Simulated microwave electric field distribution.
Energies 14 06205 g021
Publisher’s Note: MDPI stays neutral with regard to jurisdictional claims in published maps and institutional affiliations.

