1. Introduction
The continuous development of aero-gas turbines leads to constant improvements that benefit air passengers and the environment. A commonly used combustion technology to reduce the formation of
is the RQL combustor, describing the three major combustion regions—
Rich,
Quench and
Lean—in an annular combustor. As shown in
Figure 1, the air from the compressor is divided into two major flow paths. A small amount of the compressor air is used to create an air-assisted fuel spray, providing a minimal amount air for burning that fuel spray in a rich environment (red arrow). The remaining air is guided around the combustor liner and used for consecutive mixing, dilution and, mainly, for the cooling of the liner walls.
Many different cooling schemes exist to allow for protection of the combustor walls, which are exposed to flame temperatures varying from 1700–2500 K. A good overview is given in [
1] (p. 3). With a pressure drop of
3–4% between the liner and outer flow, impingement-effusion cooling can protect the metal parts efficiently with higher cooling effectiveness. This concept implements a double wall for the combustor liner, where an initial stage of impingement cooling is followed by an effusion cooling scheme for the innermost wall. The flow in between the two specimen is complex and has great influence on especially the performance of the effusion cooling.
This article presents an extensive experimental investigation of the aerodynamic behavior of such a cooling design. An engine-similar test rig is presented, which allows the analysis of flow in the cavity between the two liner walls, using particle image velocimetry (PIV) at engine similar conditions. The presented results show the effects of varying operating conditions and different geometrical setups, mainly the cavity height between the double walls and the relative positioning of impingement and effusion holes at different impingement Reynolds numbers. Time averaged and transient results are presented, adding to the understanding of the complex cavity flow and its effect on thermal performance.
A second article with an extensive thermal analysis using thermography has been prepared and published [
2].
Flow Analysis in Impingement Effusion Cooling Double-Walls
Andrews et al. [
3] carried out experiments to investigate the overall wall heat transfer for an impingement and effusion cooled wall. The authors concluded an increased heat transfer with both cooling methods combined, compared to applying impingement cooling alone; however, effusion cooling has a larger contribution. Different impingement and effusion double wall configurations also were experimentally investigated by Martiny et al. [
4] under scaled conditions and realistic density ratios. The results also show a major influence of effusion cooling especially downstream on the test surface.
El-Jummah et al. [
5] investigated the same topic by performing conjugate heat transfer calculations with CFD methods. A similar calculation was done by Oguntade et al. [
6] with reduced mass flows. All authors agree that impingement cooling can increase total cooling effectiveness, especially in the early upstream effusion region where the exterior coolant film is not yet fully deployed. The main cooling contribution, especially downstream, is introduced by the effusion cooling on the hot gas side. Thus, significant parts of the flow design for a double wall cooling need to ensure a homogeneous and effective feed of the effusion holes while maintaining an acceptable impingement cooling effectiveness.
Different plate distances between impingement and effusion wall were studied by Al Dabagh et al. [
7]. Additionally, a variation of hole size by maintaining the amount of holes was performed. They showed strong influence of the wall distance on the resulting flow field and effusion cooling infeed. Cocchi et al. [
8] investigated two geometries of a double wall cooling scheme experimentally and using CFD. Hole pattern geometries were comparable with the ones used in this study. They showed an influence of longitudinal pattern shift on cavity flow patterns. Flow analysis showed hexagonal flow patterns comparable to cloud structures, influencing the effusion hole infeed and subsequently, the discharge coefficient. Chen et al. [
9] carried out CFD calculations for a similar cooling setup, but introduced crossflow for the coolant between the inner and outer walls. The results are comparable.
In [
10,
11,
12], a series of experiments were carried out to investigate full-coverage effusion cooling of a combustor wall with internal impingement cooling. The results are in agreement with previous studies with the main new feature being the simultaneously acquired data on either side of the effusion specimen. Crossflow leads, in general, to a deterioration of hot side cooling effectiveness. Flow analysis is only performed with basic probes and derived from thermal data but again shows a complex flow field in the cavity between the two walls.
Murray et al. [
13,
14] conducted numerical and experimental investigations for walls with combined impingement and effusion cooling methods designed for turbine blades and developed methods to evaluate the cooling performance of cooling schemes with double walls. Using CFD, they showed complex flow fields in the cavity between the two walls and also showed the interaction between impingement flow and effusion hole flow.
Shrager et al. [
15,
16] performed thermal and aerodynamic analysis of a double-wall combustor liner. With a general impingement–effusion setup comparable to the one in this study, they focused on the area of dilution holes which are not included in this article’s setup. The time-averaged results are shown for the host gas side effusion flow.
Jet impingement heat transfer with a focus on the correlation to flow analysis was performed in [
17,
18]. While the first article shows steady-state results in good agreement to the data presented here, the second article shows transient data, especially at higher frequencies acquired using laser Doppler anemometry. Numerical data with obstructions (ribs) at the impingement surface are shown in [
19]—however, only time-averaged values are shown.
The test setup used for this article was analyzed, using a conjugated heat transfer numerical approach [
20]. The results indicate that the strongest effect on cooling effectiveness is introduced by the blowing ratio. After a short distance downstream of the initial effusion holes, the effusion cooling is of higher importance than the internal impingement cooling. The flow inside the cavity has a strong influence on the effusion cooling flow. It subsequently mainly depends on the cavity height and the arrangement between impingement holes (and their main flow trajectory) and effusion inflow holes.
A tabulated overview of available literature with research on double-wall combustor cooling is given in the appendix; see
Appendix B.
2. Experimental Methodology
The test rig consists of two rectangular channel sections that are connected together through a cavity in which a combustor double wall is simulated. Measurements focus on the flow patterns in this cavity. The double wall cooling test section is integrated in the flow lab at the ITS. The infrastructure to drive the test section is shown in
Figure 2, left side. For the open loop main flow the air is provided by a radial compressor, which is capable of providing a mass flow of 3 kg/s at a pressure ratio of 1.4. The air can be heated by electrical heaters with a maximum power of 450 kW, which is not used for the aerodynamic tests. After the heater, the air passes additional mixers, screens and meshes to further improve uniformity. Eventually, the airflow is accelerated through a nozzle to achieve the target velocity.
The coolant air is provided in a semi-closed loop. Compressed air is supplied by a rotary screw compressor and discharged through a valve into the closed loop coolant system. The amount of air introduced into the closed loop is tracked by a mass flow meter and equals the ejected coolant in the test section.
To circulate the air in the closed-loop section and to achieve engine similar coolant Reynolds numbers, a blower is integrated. To maintain constant air temperature, the heat input of the blower is removed with a heat exchanger.
2.1. Test Section
The central test section is an upscaled, planar double-wall combustor liner design, shown in
Figure 2, right side. Both the hot gas and the coolant channels are rectangular in the cross section with parallel flow direction. They are connected via a cavity with an impingement plate on the coolant side and an effusion plate on the hot gas side.
The hot gas is introduced via the nozzle at the heater outlet. The exit width and height of the nozzle are
mm and
mm. A turbulence grid generates an isotropic turbulence level of
% (design [
21]). Further downstream, a boundary layer bleed is installed to obtain a reproducible boundary layer thickness in the hot gas channel. After the boundary layer bleed, the channel height reduces to
mm. The test specimen is integrated in the bottom wall of the channel.
The coolant channel has the same width and a height of mm. The coolant flow channel inlet design (see ②) is adapted to increase coolant flow homogeneity (numerically designed and experimentally validated). The flow profile is further improved by introducing screens and meshes into the vertical portion of the coolant inlet. A turbulence grid with % is added in the flow channel.
The connecting cavity is introduced through a plastic frame and sealed with PTFE against both channels. The height of the inset defines the distance between the specimen as specified for the different geometrical setups. A shift in longitudinal direction between impingement and effusion specimen can be set. The geometrical configurations shown in this article are summarized in
Table 1. To allow for optical measurements in the cavity using PIV, parts of the PEEK frame can be replaced by glass elements. Seeding is introduced to the coolant flow far upstream of the initial mixers and turbulence grid to allow for a homogeneous particle distribution.
In contrast to the thermal experiments, PIV experiments are performed with non-heated main flow. This reduces cavity flow temperatures and high-speed camera temperatures, both leading to a major increase in PIV raw image quality. However, the density ratio is lower at , which can be accepted since the main area of interest is the flow in the cavity. Thus, the experiments are not performed at a multitude of blowing ratios (or similar momentum flux ratios I) but at different coolant impingement Reynolds numbers—this Reynolds number is identified as the main similarity for the cavity flow structures, while the momentum flux ratio mainly influences interaction with the hot gas flow. The coolant crossflow and hot gas Reynolds numbers are still chosen to match those of the thermal experiments.
Comparing the operating points with the thermal measurement operating points should thus be performed considering Reynolds numbers since blowing ratios and momentum flux ratios vary, due to changes in density and velocity of the hot gas flow. The Reynolds numbers are computed with the following:
with the total impingement mass flow and the total area of all impingement holes combined (
N number of holes, 159). The viscosity is determined using a Sutherland approach with the coolant inlet temperature T
c. The Reynolds number is controlled employing the mass flow rate. The operating points chosen are a high nominal impingement Reynolds number of
and a low impingement Reynolds number of
. While the former corresponds to the high blowing ratio of
in the thermal experiment, the latter corresponds to the same blowing ratio at unscaled engine conditions, including non-linear effects in the material properties introduced with the large change in temperatures during scaling. The operating conditions are summarized in
Table 2.
Compared to the thermal operating points, slightly higher deviations are visible. Those are mainly introduced by a varying hot gas temperature, which is not perfectly controlled when the main heater is not used. However, considering that the measurements were performed over multiple days, the operating points are highly stable and thus, the data are well comparable.
2.2. Test Specimen
The used scaling factor for a typical engine geometry is
, resulting in a reference diameter of
mm. The specimen on the hot gas side with effusion holes has 159 laidback fan-shaped cooling holes distributed over 25 rows. In streamwise direction, the effusion hole pattern is shifted by
, i.e., the pattern repeats every 4th row. In streamwise direction, every row of cooling holes has a distance of
to the next row. In a row, the pitch between each cooling hole is
. The effusion cooling holes are inclined by
to the surface and have a cylindrical entry diameter of
. The lateral opening angle and laidback opening angle is
(designed after the 7-7-7 configuration introduced by Schroeder et al. [
22]).
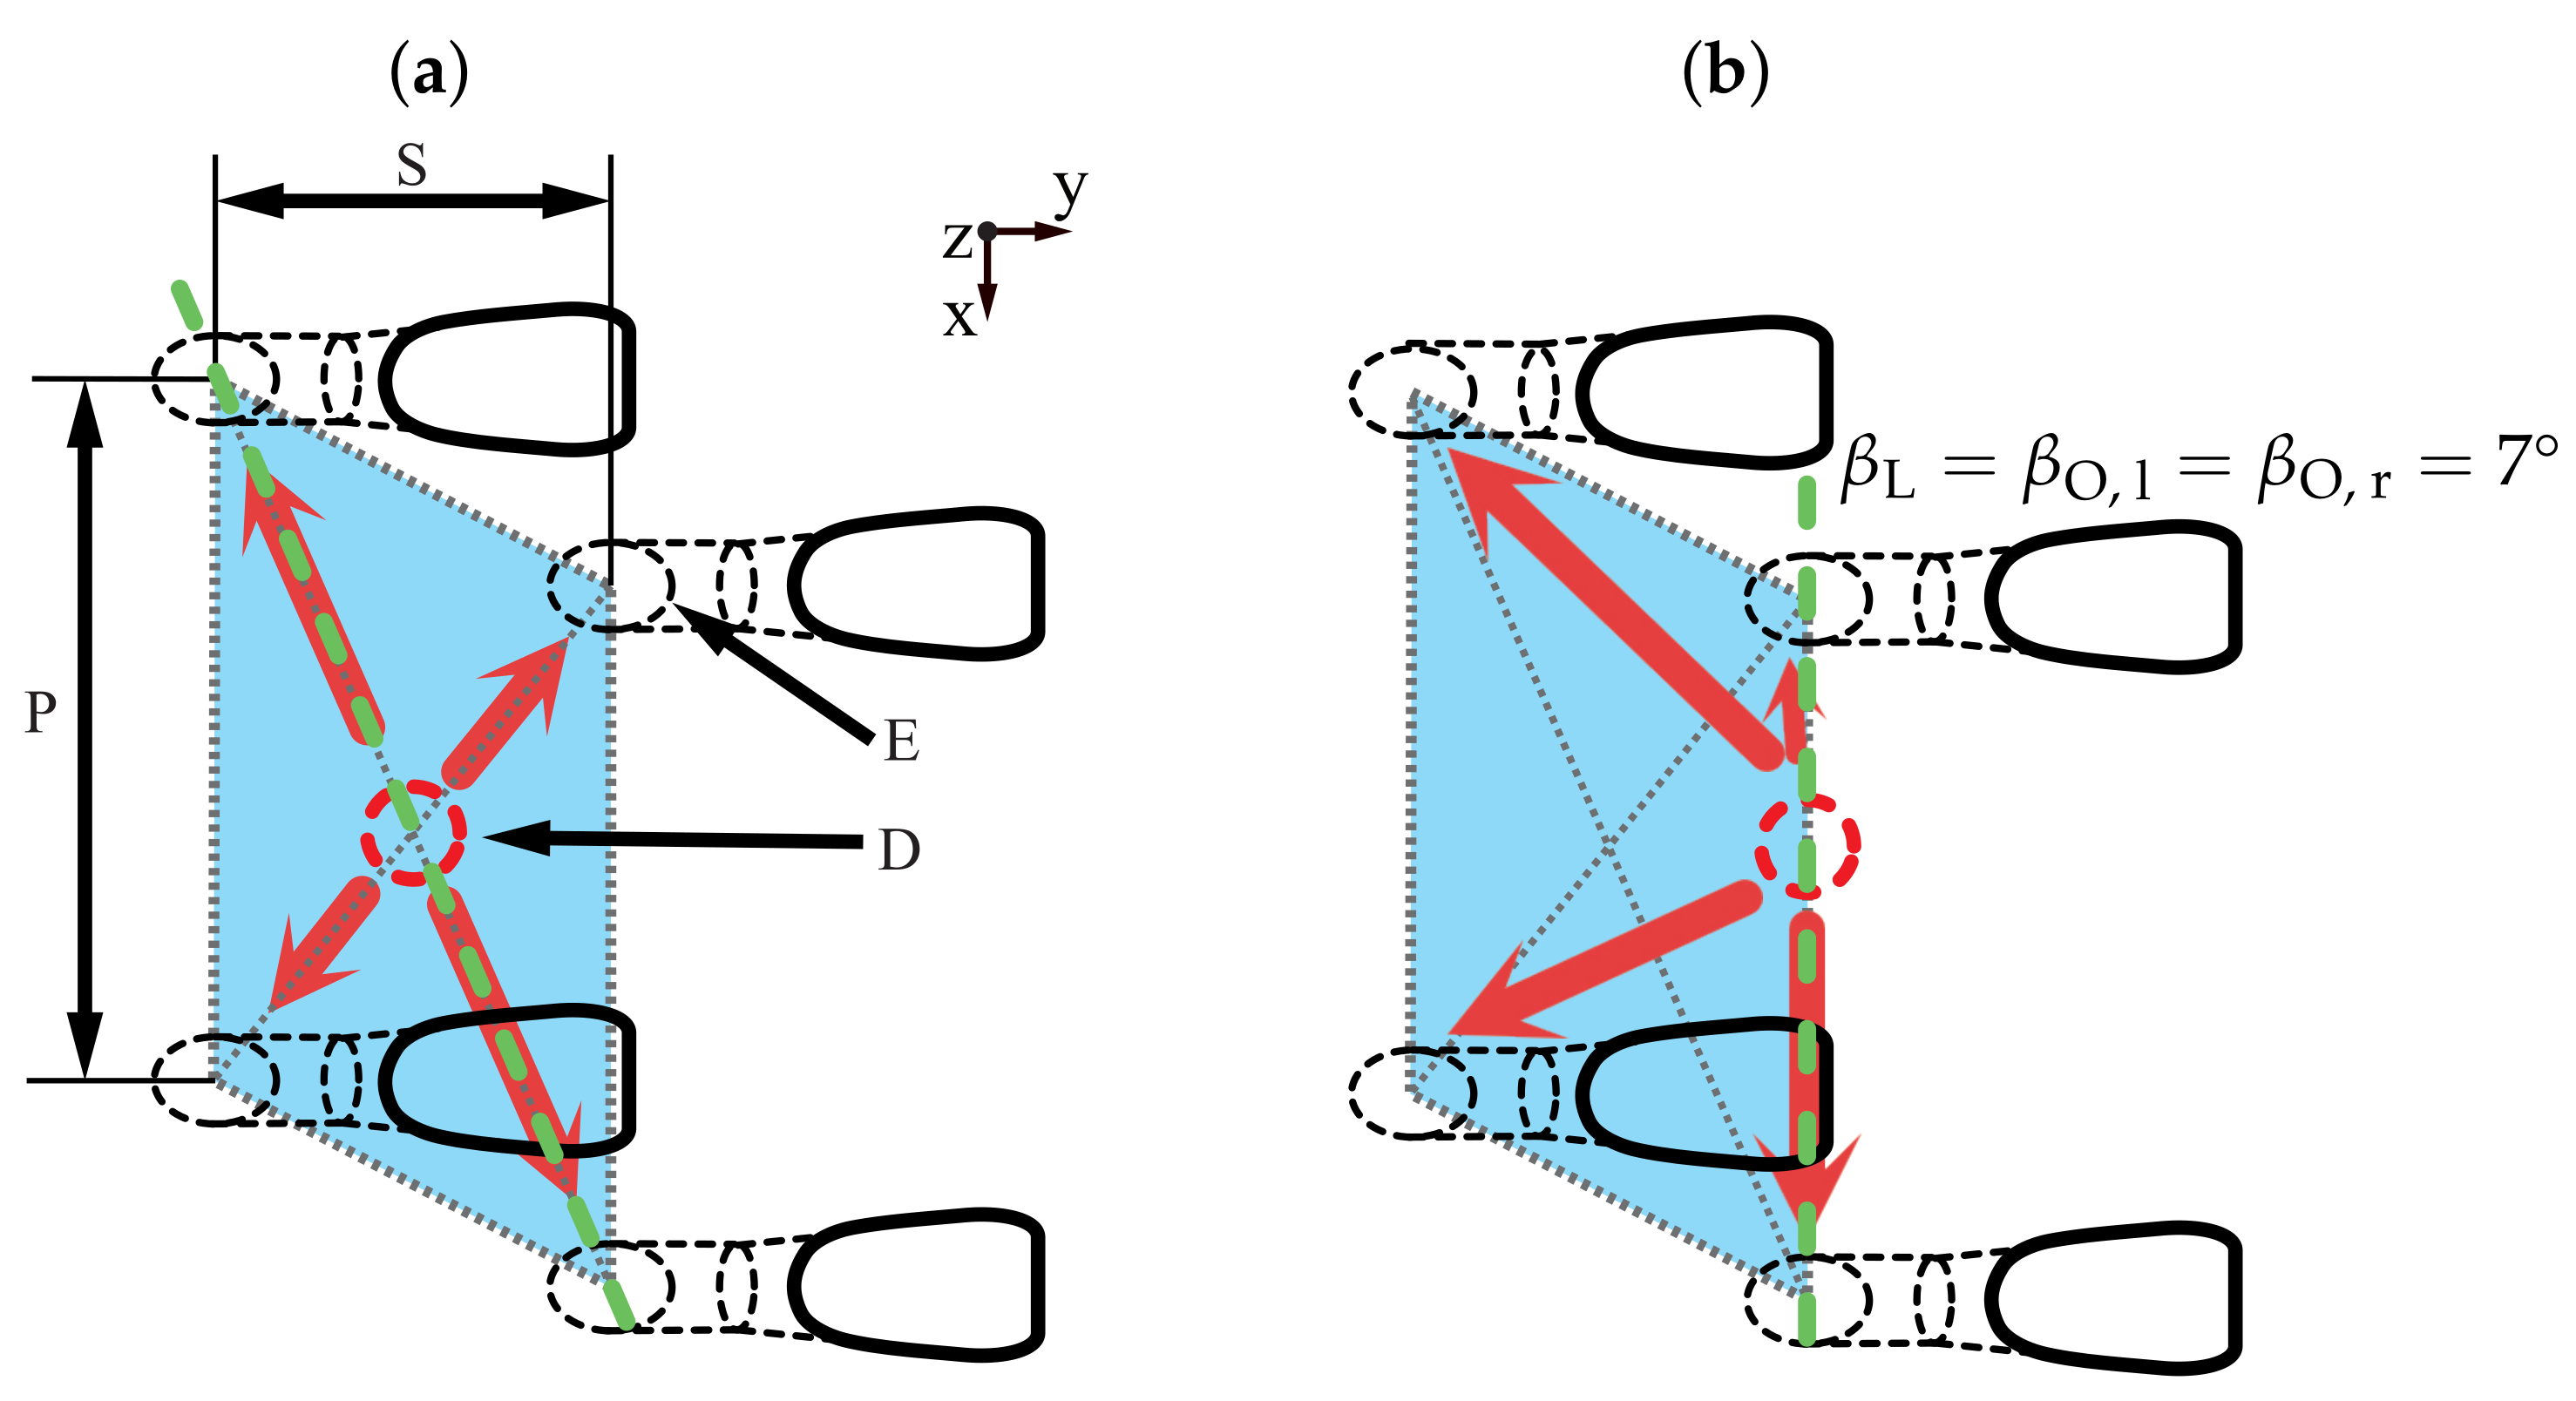
The impingement specimen has vertical cylindrical cooling holes with a diameter of
D. The pitch and spacing of each cooling hole remain the same as for the effusion cooling holes, while their position is offset as described in
Figure 3a. The chosen placement maximizes the wetted area on the backside of the effusion specimen before the coolant is ejected through the effusion cooling holes. For the misaligned setup
MALO05, the impingement specimen is shifted by
in longitudinal direction (
y), placing the impingement exit opening on the rows of effusion entry holes; see
Figure 3b. The specimen with the effusion holes is made of TiAl6-V4 and has a thickness of
mm. The impingement plate is made of stainless steel AISI 420 with a thickness of
mm. The selection of material and thickness were derived from scaling the Biot number for a flat plate at jet engine conditions to experimental conditions. Additional information on hydraulic porosity and similarity scaling for the two specimen are given in the article focusing on the thermal study [
2].
2.3. Measurement Methods and Data Processing
The velocity data are acquired, using high speed stereo PIV. The setup consists of a Quatronix Darwin Duo 527 nm green dual cavity laser with a power of W and two Photron Fastcam SA4 cameras. The synchronization is set to a data rate of Hz, allowing frequency analysis up to Hz. Considering RAM limitations and frame size (depending on cavity height), the total number of images and thus, the total amount of recorded time, varies from 4365 images per plane for the large cavity height of up to 5456 images per plane for the small height . Average values do not change significantly after an initial set of ≈1200 images for any of the configurations.
The laser sheet optical axis is aligned with the
. The cameras are placed approximately at the laser outlet (
x) and offset to the
. The stereo angle is ≈
° in a sideways–backward scattering setup. The cameras and the laser are placed on a traverse system, which moves the combined setup in
. For each test configuration, approximately 20 light sheets are recorded with a spacing of
mm for each configuration (≈250 total). The resulting sheet setup (center sheet) is shown in
Figure 4a. Due to the high spatial resolution,
time averaged data for each test configuration can be re-interpolated in 3D space, using a linear interpolation on a regular grid with a spacing of ≈
mm.
The origin is placed at the outlet of the impingement hole for the MALO00 cases. For MALO05 cases, the relative alignment to the impingement holes changes, e.g., the sheets are kept at the same absolute positions. The hole outlet thus is subsequently located at .
Calibration is performed a single time for each test configuration before acquiring all data planes, using a multi layer target placed inside the test rig and the PIVView software package. Subsequently, the images are post-processed using the same software. Post processing includes a disparity correction and a standard multipass PIV evaluation with a final grid size of 16 px and a window overlap of 50%, yielding a final physical resolution of 2 vecs./mm. Outliers (points with no stable correlation result) are identified but not replaced, using, e.g., interpolation at this stage of evaluation.
The time distance for the double images is chosen for each case to optimize validation rate between 5–10 μs. The resulting validation rates are shown for a worst case scenario with high Reynolds number at large cavity heights in the center plane (this yields the maximum span of velocities in the domain) in
Figure 4b. Validation rates are in unity in most of the domain; however, in the core jet, some evaluations fail, due to high velocity and thus, high particle displacement. Before final processing, these remaining outliers are interpolated, using a spatial linear approach at each time step. Afterwards, only points with a validation rate of unity are considered—this removes points at borders where the convex hull of valid data changes with time and points inside the domain if interpolation errors occur, yielding the most conservative approach. The data can then be used for transient analysis or 3D interpolation and visualization.
For estimating the measurement uncertainty in the PIV experiments, a method based on correlation statistics introduced by [
23] was used. The local relative uncertainty was found to be below 5% in the core jet region. The spatial average of the temporally averaged relative local uncertainty in the impingement jet main stream direction was below 16%. This high value is mainly caused by locally very small displacements. Due to the complexity of the three-dimensional impingement flow field this cannot be avoided.
This uncertainty analysis is based on the time-resolved data. As stated above, after employing approximately 25% of available time resolved data, the mean values and statistics of the data do not change significantly. Thus, the error (excluding a possible bias) is further reduced in these data set types.
3. Results and Discussion
The presented experimental setup allows the acquisition of time-resolved velocity data in the cavity of a double-wall combustor liner. Compared to previous work, several unique features are realized in this experimental setup. Coolant cross flow is introduced, mainly affecting the impingement jets. Two main geometrical variations are identified and studied: the change in cavity height as a main design parameter and the relative alignment of effusion to impingement specimen, which can occur due to thermal expansion in the real engine.
The results are discussed in the following sections: initially, time-averaged velocity data are analyzed to show jet profiles for different configurations, the effects of cavity height and longitudinal alignment on the flow patterns inside the cavity. Core influence factors are identified. Subsequently, several configurations are chosen and compared against the baseline configuration of , MALO00 (which also showed good thermal performance). The comparison is performed, applying more advanced techniques and leveraging the time-resolved data.
Most of the data, especially velocities, are shown in normalized quantities:
normalized with, for example, the reference velocity
being the maximum value of the dataset underlying the displayed case (e.g., maximum value of a given plane) if not otherwise stated. The maximum values for each plot are summarized in
Appendix C.
3.1. Jet Profiles
Jet profiles are analyzed at the jet center, and thus, in different absolute locations for the aligned and misaligned cases. The figures show normalized jet velocity over lateral expansion. Profiles are shown at
%,
%, and
% relative cavity height
, which is defined as the following:
with the three design cavity heights
of
,
and
. The aligned case
MALO00 is shown with solid lines, the misaligned case with dashed lines. All profiles are displayed in
Figure 5. Additionally, the profiles at the same origin but on
x-normal planes are shown in
Figure A1 in
Appendix A (slightly lower resolution due to out of plane direction on plot
x-axis).
All configurations show a distinct jet profile with the highest velocities at the exit location and a degradation of the jet downstream, e.g., the maximum velocity drops while the jet width increases. The profiles are similar for all configurations, and thus, no major changes in flow regime are induced by the changing test configurations. At the smallest cavity height , the jet profile shows little momentum loss, with peak velocities at of above , leading to a high local heat transfer at the effusion target plate. With increasing cavity height of to , the jet momentum loss increases gradually, leading to wider jet profiles with lower peak velocities. This results in a more equalized jet heat transfer at the effusion target wall. The presence of misalignment (cases MALO05) shows a major effect with larger cavity heights at jet distances further downstream. The lower momentum jet is more strongly influenced by the changing flow patterns close to the effusion specimen, preventing momentum loss and inducing minor lateral shifts. The effects of alignment are, however, comparatively small.
The jets are symmetric in the
y-normal plane. As shown in
Figure A1, a jet deflection in the
x-normal plane (thus in
y-direction) is visible. The effect, again, increases with larger jet traveling distances and lower jet momentum (lower impingement Reynolds number). The jets are deflected in the negative main flow direction, induced by a separation bubble at the impingement hole inlet, due to the present crossflow, also shown in the preliminary CFD study [
20]. While the effect is small with deflections below
, the position of the maximum heat transfer on the effusion specimen will vary. The effect of misalignment is very small. Only for large cavities and low momentum jets, most noticeably at
,
, the misalignment leads to jet stabilization as seen in the rotated plane in
Figure 5.
3.2. Cavity Flow Patterns
Depending on the configuration, distinct flow patterns in the cavity are expected, which can show a strong influence on the local heat transfer and effusion hole flow patterns.
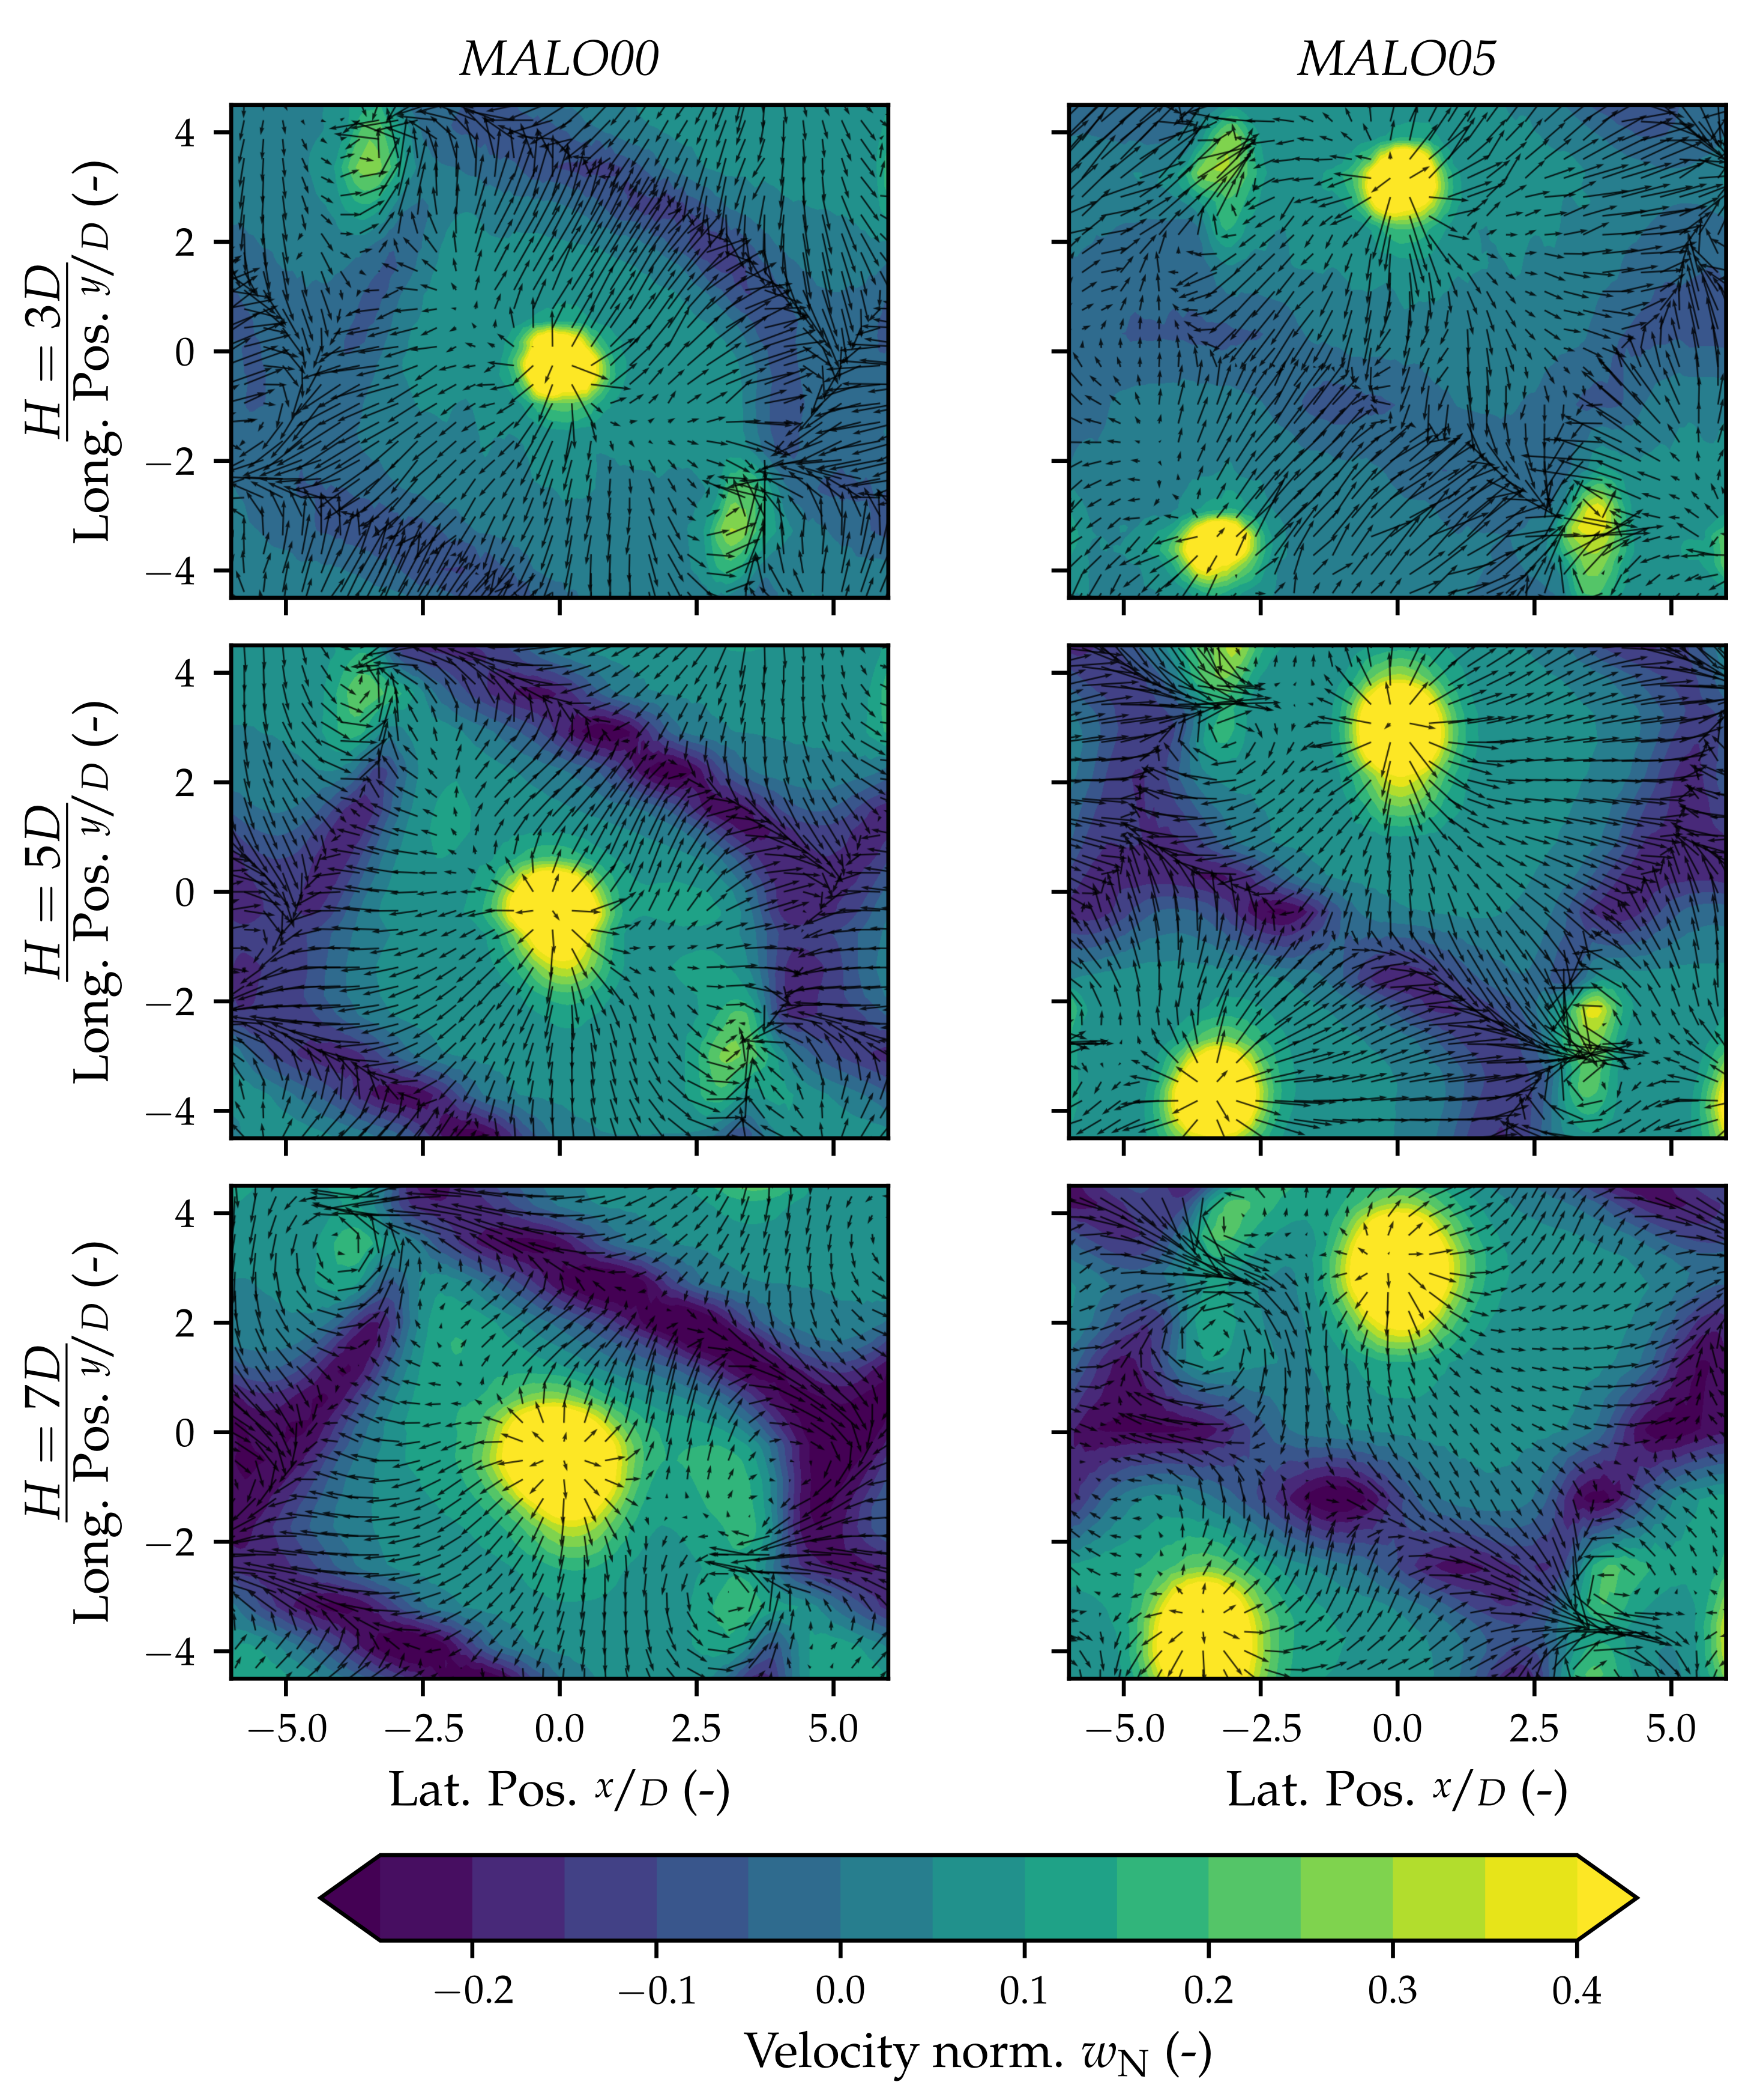
Due to the highly three-dimensional nature of the flow, some conclusions cannot be fully supported with the displayed figures. As stated below, the full datasets are available on request. The main jet velocity component (
z-axis,
w) is shown at a constant height of
% for all cavity heights and both alignments in
Figure 6.
The contour plots show normalized
w-velocity (normalized with the max. velocity magnitude in a given plane) for the lower Reynolds number
. The same figure for the higher Reynolds number of
is shown in
Figure A2—due to high similarity, only the lower Reynolds number are discussed.
In all configurations shown, a distinct flow pattern develops showing the previously described pattern of separation lines between the repeating impingement-effusion cells. At the smallest cavity height
, the magnitude of downflow (e.g., negative velocity) is comparably small, the expected flow pattern is not developed completely, and balance fluxes exist throughout the flow cell. With increasing cavity height, the vortex system stabilizes and increases in downflow intensity. The separation lines appear more clearly. A stable vortex system establishes inside the cavity, clearly defining repeating flow cells with the optimal pattern to maximize the wetted area and optimize effusion hole inflow. For both alignments, the jet diameter increases with cavity height—the absolute jet distance increases and thus, the jet will dissipate. This increases the area of jet impingement heat transfer on the effusion plate and reduces the local maximum values, which is also discussed in
Figure 5.
Comparing the cases with and without misalignment, a breakup of the separation lines is visible. Due to the less ordered flow in the cavity and the different flow path lengths to the closest four effusion holes, the large cavity vortex is less stable. A stronger interaction between the adjacent flow cells is expected. Higher streamline curvature at the effusion hole inflow and stronger effusion hole inflow separation are the main results, also visible by increased unordered vector patterns in the effusion hole vicinity. Both lead to a decreased effusion hole flow and an increase in local heat transfer coefficients, especially at the effusion hole inflow edges. This effect is most pronounced for the smallest cavity .
To further analyze the interaction between the impinging jet and the effusion hole inflow, a cutting plane is placed through the geometric centers of the two holes. Thus, for
MALO00, this leads to a plane at an angle of ≈
° to the
y-normal plane, while for the misaligned cases, this resembles a
y-normal plane. The resulting planes are shown in
Figure 3 in green. For the rotated planes, the lateral coordinate, in-plane and out-of-plane velocities are recomputed via projection. The planar data are depicted in
Figure 7 for the low Reynolds number
. The high Reynolds number data are shown in
Figure A3 and again are not discussed in detail, due to high similarity. The plot shows the in-plane velocity using streamlines and the out-of-plane velocity using contours. All velocities are normalized, using the maximum velocity magnitude for a given plane.
For all aligned cases, left column, a clear flow vertical stratification to the two effusion holes is visible. No major areas of downflow are present; the majority of mass is transported down in the area in between the effusion holes and forms a stable vortex system. Mass is transported in and out of the plane at the bottom and top, respectively, as is also visible in
Figure 6. Small recirculation areas are present for the smallest cavity height
above
on either side, showing the confined flow patterns with a less stable vortex system. Small inflow vortices are present for the configuration with the highest cavity
. Additionally, a second vortex system forms for
and
at the bottom, induced by jet drag. For the misaligned cases
MALO05, shown in the right column, the flow patterns are different for each cavity height (especially for
, where the closest effusion inflow hole is located). For the smallest cavity
, the major flow direction upward is still maintained; however, a vortex system starts to develop at the left border. With increasing cavity height to
, this small pattern eventually forms a larger recirculation area with major downflow below the effusion inflow hole in the area of
. The right region of the displayed figures (
) show a more similar flow behavior. A vortex system forms that occupies a large region of the cavity at
, where the next effusion inflow hole is located at
. The vortex system’s height relative to the cavity height decreases with increasing cavity height. The previously described effects, combined, lead to a more complex and less systematic cavity flow, which in turn can influence the flow in the effusion holes, the separation behavior in the effusion hole diffusor and subsequently, the total cooling effectiveness on the hot gas side.
3.3. Transient Analysis
The transient data are difficult to interpret, due to a large spread in time scales and noise induced by flow turbulence and measurement uncertainties. Thus, statistics and frequency domain analyses are employed to show the basic effects of instationary behavior. The jet flow statistic moments are summarized in
Table 3. For each configuration, the jet velocity magnitude is extracted at
and
at a line across the geometrical jet center with a width of
, and averaged. The velocity magnitude is normalized with the time-averaged maximum velocity magnitude at each plane. Eventually, the statistics are calculated.
The mean values are in good agreement with the previously shown jet profiles (due to the lateral average employed the jet profile effects are obscured). For the aligned cases
MALO00 at
and
, the integral momentum loss is comparatively small, and the jet can presumably expand freely. At the highest cavity
, the momentum loss is more substantial due to the extended jet travel distance and, additionally, the expanded jet profile is wider than the employed averaging area. However, these low velocity boundary regions will have no major effect on impingement heat transfer, justifying the area of data extraction. For the misaligned cases
MALO05, the jet momentum loss is reduced (except
,
MALO00; see also
Figure 5) presumably due to the complex flow field in the cavity interacting with the jet flow profile.
Standard deviations increase with impingement of the Reynolds number, due to the higher jet momentum and increased jet-crossflow interaction. This effect is more pronounced at the upper analysis line—jets with high initial momentum show less degradation and more variation further downstream. These systematic changes do not show for the lower cavity height , where complex cavity flow patterns with higher momentum interact more strongly with the jet flow pattern. No clear connection between standard deviation and specimen alignment can be deduced.
Skew and Kurtosis excess show a less systematic behavior. Even though skew is normalized with the standard deviation, it is in general very low, showing an evenly distributed velocity magnitude (as expected for a presumably periodically varying jet). Kurtosis excess is notably different at the lower extraction for and at MALO00. The high values at the smallest cavity height point to smaller jet movement through the line of interest (less variation in velocity distribution width) and are again a confirmation for the confined flow in the cavity, where at high cavity heights, the jet can move in space and thus, leads to a wider spread in velocities observed at a fixed position.
Power Spectra
Power spectra for jet velocity are computed for both extraction lines. Additionally, a line is place just below the effusion hole inflow with a lateral width of at .
For all three cases, the main jet velocity component (
w) is chosen for frequency analysis. Frequencies are normalized as Strouhal numbers:
with the computed jet exit velocity
; see
Table 2. The amplitudes are normalized with the maximum amplitude in the spectrum. The resulting data are shown in
Figure 8 for the reference case
,
MALO00. Since the jet center plane does not intersect the effusion hole inflow plane, two different planes are selected for the analysis of the different spectra. All spectra are subject to noise for several reasons: the flow is turbulent, no main external excitation exists, and due to the Nyquist frequency at
Hz, parts of the spectrum are subject to either the mirror of shift frequencies (especially higher frequency turbulence may carry substantial energy). Additionally, any non-true periodic parts of the input signals cannot be represented, due to infinite-length time domain representation of the FFT approach. The jet spectra are similar for both Reynolds numbers. At the lower location, few distinct peaks exist, allowing the detection of a jet fluctuation Strouhal number. With increasing jet travel downstream, more peaks occur, and the jet movement increases in complexity. Jet fluctuation Strouhal numbers are expected to be in the order of
. The effusion inflow spectrum shows a stronger skew to lower Strouhal numbers. This skew increases with the increase in the jet Reynolds number.
These spectra were analyzed for all configurations at the previously described positions. For each configuration and location, the four Strouhal numbers with the highest normalized (relative to the maximum for each configuration and each position) amplitudes are extracted and plotted in
Figure 9, with the color showing the normalized amplitude.
Comparing all the configurations analyzed, the data are less systematic, due to the discussed shortcomings regarding noise and the (in-)correct detection of coherent structures. All configurations show the tendency of a less distinct dominant frequency when changing the evaluation section from to and subsequently, to the effusion inflow area, where the last step shows the major influence with the major frequencies collapsing at very low Strouhal numbers. Thus, jet fluctuation at higher frequencies are introduced to the jet by the coolant cross flow and the separation at the jet hole inlet (which is also the cause for the jet deviation). These higher frequency structures dissipate with time, and especially in the cavity flow, having the cavity act as a damper before the effusion hole inflow. This reduction in fluctuation can prove beneficial for a stable effusion cooling. For the aligned setups MALO00, a larger cavity height, especially , increases damping. The difference between and is smaller. The misaligned configurations MALO05 show different behavior where the larger cavities allow wider spread of dominant Strouhal numbers, due to higher variation in secondary flow structures in the cavity. The smallest cavity height shows small differences between the aligned and misaligned case—a sign that the hexagonal flow pattern cannot fully develop, even in the aligned cases and thus will not show significant differences to the misaligned cases.
4. Conclusions
Extensive flow measurements were performed in the cavity of a double-wall combustor liner test rig. Data were presented for different jet Reynolds numbers ReD, different cavity heights and two different specimen alignments. In contrast to most of the previous research, coolant crossflow was introduced at realistic Reynolds numbers. In addition to time-averaged data, transient data were acquired and analyzed employing basic statistical methods and frequency analysis. Several conclusions can be drawn from the results.
The impinging jet profiles are in good agreement with previous research for similar setups. The main influence of cavity height shows in jet dissipation with jet flow distance. Thus, larger cavity heights will lead to a reduced jet momentum at the target wall; however, the induced heat transfer coefficient increase is spread over a larger area. As shown in the complimentary thermal data paper, this can lead to a more homogeneous thermal load distribution.
A jet deflection is visible in the opposite direction of the coolant crossflow, induced by a separation bubble at the impinging hole inflow. The resulting final jet deflection at the target wall again depends on the cavity height and jet Reynolds number. This deflection can change the location of the maximum impingement heat transfer.
Complex flow patterns are observed in the cavity. For the cavities with larger heights of and and aligned setups MALO00, a stable hexagonal vortex system with improved effusion inflow can be observed. This pattern is less pronounced with the smallest cavity height of . The same pattern is disturbed by a misalignment of the two specimen, leading to a different, more chaotic cavity flow. This possible misalignment needs to be considered during design since thermal shift can lead to relative motion between the two walls of the combustor liner.
Both analyzed operating points of and show similar results when comparing normalized data. Thus, the flow regime for both operating points is assumed to be similar, and the resulting effects on absolute values and, for example, heat transfer, can presumably be interpolated to operating points in between those bounds.
Initial transient data were analyzed, focusing on jet statistics and jet frequency spectra and effusion inflow spectra. Due to the complex time-dependent behavior, these basic methods only give limited insight into the transient flow mechanics. Jet velocity fluctuations increase with the jet Reynolds number and absolute jet traveling distance, and thus, the cavity height.
Basic frequency analysis showed that higher fluctuation frequencies are introduced into the cavity via the jet, their origin presumably being the separation bubble at the hole inflow and a general jet flow instability. The structures connected to those frequency dissipate with jet travel and with residence time in the cavity. At the effusion hole inflow (the cavity outflow), the spectra are shifted to lower frequencies, which can prove beneficial for stable effusion cooling.
For all analyzed values, the configuration with the lowest cavity height showed the highest spread in results, presumably due to the increased flow complexity and instability in the confined cavity.
It has to be noted that the analysis of power spectra was also performed on data without heat addition. The jet spectra are assumed to show little variation with the addition of heat transfer since they are mainly influenced by the cooling air flow. The cavity and effusion spectra are assumed to be more susceptible to change in the case of heat addition. Future analyses are planned.
To better identify dominant frequencies, and more importantly, coherent structures, advanced methods need to be applied. Dominant frequencies are obscured due to damping and non-periodic frequency changes. The application of either short time Fourier transform or wavelet transform may mitigate this issue. Additionally, using proper orthogonal decomposition or dynamic mode decomposition can yield more insight into the complex transient flow coherent structures. After the identification of coherent structures, frequency analysis can be performed more specifically, eliminating most of the noise effects.


 ,
, 


