Abstract
The performance gap, defined as the difference between the measured and the calculated performance of energy-efficient buildings, has long been identified as a major issue in the building domain. The present study aims to better understand the performance gap in high-energy performance buildings in Switzerland, in an ex-post evaluation. For an energy-efficient building, the measured heating demand, collected through a four-year measurement campaign was compared to the calculated one and the results showed that the latter underestimates the real heating demand by a factor of two. As a way to reduce the performance gap, a probabilistic framework was proposed so that the different uncertainties of the model could be considered. By comparing the mean of the probabilistic heating demand to the measured one, it was shown that the performance gap was between 20–30% for the examined period. Through a sensitivity analysis, the active air flow and the shading factor were identified as the most influential parameters on the uncertainty of the heating demand, meaning that their wrong adjustment, in reality, or in the simulations, would increase the performance gap.
Highlights
- The energy performance gap of a new multi-family Minergie® building was identified by comparing the measured and the calculated heating demand.
- The comparisons between the measured and the calculated heating demand showed that the latter underestimates the real heating demand, by a factor of 2.
- Commonly used hypotheses in the Swiss building practice, considering the climate conditions of the building, the indoor temperature and the electricity consumption, as causes of the increased performance gap, were not justified for this case study.
- A probabilistic framework was then proposed, so as to include the different uncertainties of the parameters of the heating demand, as an attempt to reduce the performance gap.
- A sensitivity analysis showed that the shading factor and the active heat flow were identified as being the most influential on the uncertainty of the heating demand. Correction measures were finally proposed, based on these results.
1. Introduction
The rising of the green building concept has been introduced as a solution to the mitigation of the energy consumption in buildings. National building energy standards or energy labels have been recommending different measures for the envelope and the technical installations, in order to meet the requirements of a green building. However, it was realized soon that the monitored and thus the real performance of the building did not correspond to the one calculated during the design phase of the building. This difference, commonly known as the ‘performance gap’, has been already addressed by the scientific community and different studies have been conducted, in order to define precisely the performance gap, its magnitude, explain its causes, and propose solutions in order to deal with it, as summarized thoroughly in [1,2,3].
The underlying causes of the gap vary from the uncertainty of the occupant behavior to the uncertainties of the building energy modeling in general, such as model simplifications of the building complex system [3]. The unpredictability of the user [2,3,4,5,6,7,8,9,10] constitutes one of the most generally accepted reasons explaining the gap [1]. This uncertainty derives from the fact that different parameters influence human behavior, such as psychological or sociological [2], which cannot be quantified or incorporated into the building energy modeling. Other reasons, explaining the performance gap can be the discrepancies between the designed and the real construction, due to limited craftsmanship, as summarized in [1,2,3], the inefficient regulation of the technical systems, [3,6], or the inaccuracies of the measurement system, as mentioned by different studies and summarized in [1,3], etc.
Sun [11] argues that by reducing all the uncertainties, the performance gap could be diminished, based on the definition of the uncertainty, as “being any deviation from the unachievable ideal of completely deterministic knowledge of the relevant system”, given by Walker et al. [12]. Hence, according to Björklung [13], if the data quality cannot be increased, in order to reduce the uncertainty of the input parameters, another alternative and straightforward way to deal with the uncertainty is by using a probabilistic approach. This method allows the attribution of a range of values, described by a probability density function for the uncertain parameters, rather than a single value. In this way, according to the author, the credibility of the model increases, through a better ‘understanding of the model and its behavior’. Thus, by increasing the credibility of the model, the predictability of the building’s energy performance can be enhanced, as well, [11], leading to the limitation of the performance gap.
Different studies have already been conducted, considering a probabilistic framework for the uncertain building parameters, as a way to reduce the performance gap. Sun [11] treated within a probabilistic framework a variety of parameters affecting the building energy, i.e., climate, building, occupancy, technical systems. The author applied the developed methodology in six building case studies and the results showed that the mean of the probabilistic cooling consumption agreed better with the measurements than the deterministic value. In addition, Cali et al. [14] proposed a systematic way of considering the occupant’s behavior within a probabilistic framework, by using a database, based on observed data, in order to improve the predictability of the energy model, as a solution to reduce the performance gap. Probabilistic modeling of the occupant’s behavior was also adopted in the study of Tagliabue et al. [15]. Moreover, Cecconi et al. [16] proposed a method, in order to train an Artificial Neural Network (ANN), so as to predict probabilistic occupants’ profiles.
At the Swiss level, several projects have been conducted, in order to compare the design and the real energy performance, as for example [17,18,19]. The latter includes among others, high energy performance buildings (i.e., Minergie® [20]), but do not provide the reasons for the performance gap, in detail, or do not provide solutions for this type of buildings. Cozza et al. [18] suggested that further studies should be performed for the case of high-performing buildings, in order to better understand the way deep renovations perform in terms of energy, in reality.
Hence, the current study aims at a detailed analysis of the performance gap in one energy-efficient building in Switzerland, e.g., Minergie® certified building, in order to cover the knowledge gap, concerning the causes and the minimization of the performance gap, as well as the determination of relevant solutions both in ex-post evaluations, in this kind of building. A stochastic approach was adopted, as a way to diminish the performance gap, while through a sensitivity analysis the causes of the gap could be identified that led to recommendations for its correction.
2. Materials and Methods
As already documented in Shi et al. [2], there are several definitions regarding the energy performance gap. In this study, the energy performance gap concerns only the operational energy use for heating. It is defined as the difference between the calculated and the monitored useful heating demand. The proposed methodology is presented in Figure 1 and comprises the following steps: (1) the calculation of the normative heating demand and the determination of the real heating demand through measurements, (2) the initial identification of the performance gap, through the comparison of the normative and the measured heating demand of the case study, (3) the development of the probabilistic heating demand model as a way to reduce the performance gap of the heating demand, as well as the global sensitivity analysis, as a way to determine the most influential parameters on the heating demand uncertainty and propose a targeted investigation of these parameters, and finally, (4) the correction of the performance gap, based on the findings of the sensitivity analysis. Based on these results hints can be given, concerning the reasons for the performance gap and the ways to deal with the performance gap.

Figure 1.
Overall methodology applied to the building case study.
2.1. Building Case Study and Monitoring System, Real and Normative Heating Demand
The proposed methodology was applied to a new multi-family residential building (energy reference area (ERA) = 2663 m2), of a green neighborhood in the city of Gland, in Switzerland. Figure 2 presents the views and sketches of the building under investigation. The building was constructed in 2014 and was certified as Minergie-Eco®, meaning a high energy-efficient and ecological performance, respectively. It is connected to the district heating network (wood—80% and gas—20%) and equipped with a double-flow mechanical ventilation system with heat recovery (manufacturer efficiency ~80%), while no decentralized energy production system (solar thermal, photovoltaic, etc.) is installed. A ventilated façade is used for the building envelope, which contains significant glazed surfaces, (triple glazing, average thermal transmittance coefficient of 0.8 W/m2∙K, g = 0.51). More details of the characteristics of the case study can be found in [21].
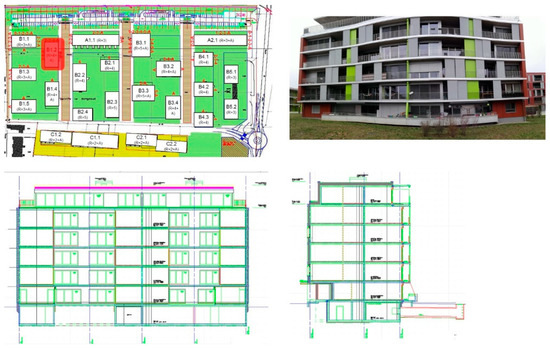
Figure 2.
Different views of the building case study in Gland and its position to the ecological district, marked in red.
For the determination of the real heating demand, a monitoring system was installed by eSmart Technologies SA [22] and included a set of smart meters, gathering data of (a) the energy consumption of the apartments (i.e., consumed heating energy, electricity, internal temperatures of two zones, during day and night, domestic hot water), (b) data of the ventilation unit (i.e., electricity consumption, temperature, etc.), and (c) data taken of the technical room for the whole building (i.e., air flow, electric consumption of the pump, etc.). The measurement campaign was launched at the moment of the operation of the building and data were collected for the years 2014 to 2017 for an hourly time step.
The heating demand was calculated based on a monthly quasi-steady-state approach, according to the SIA 380/1 Swiss energy standard [23] that is also used by the Minergie® standard. The SIA 380/1 heating demand model is currently broadly used by the majority of practitioners in Switzerland. This model calculates the heating needs of the building, through the transmission losses and the solar gains of the envelope, while the domestic hot water (DHW) is not part of the heating demand calculation. The model simulation was performed using the Lesosai software [24] and the different assumptions of the model parameters were based on the Minergie® standard, which are presented in Table 1 (“deterministic calculation”). Based on the measurements and the simulation of the heating demand, the performance gap could be then identified.

Table 1.
Normative value and range considered in both deterministic and stochastic assessment of the building heating demand.
2.2. Minimization and Explanation of the Performance Gap through Uncertainty and Sensitivity Analyses
The uncertainty analysis followed and the probabilistic model of the heating demand was built, according to the thermal equations of the SIA380/1. The parameters of the model were fixed either by using the available measurements from the measurement campaign, either by determining a probability density function, in order to calculate the probabilistic heating demand. This allowed testing numerous combinations of different scenarios of the input parameters, using a small computational time.
Table 1 presents the model parameters and the defined probability density functions, as well as the parameters, defined using the measurement data. Ideally, Gaussian distributions should have been used. However, to determine them with confidence, more input data is needed to build such an empirical Gaussian which is not the case here. Uniform distributions were selected for the PDFs, with ranges, based on the default values of the SIA 380/1, or the pre-calculated deterministic values. For example, for the thermal transmittances, i.e., U-values, or psi-values, a 10% variation around the deterministic value was considered. Concerning the shading parameter, a variation between 0–100% was defined for each of the windows, meaning 0% or 100% shaded windows, respectively. In addition, the active air flow was varied between 0.3 and 0.7 m3/(h·m2ERA), which correspond approximately to the calculated value of the Minergie® (i.e., with a double-flow ventilation system) and the SIA 380/1 standard, respectively. In case measured data were available for the input parameters, they were used as deterministic values in the probabilistic simulation, e.g., the electricity consumption of other domestic uses. Finally, some of the input parameters were considered in the probabilistic model indirectly, as for example the infiltration rate and the efficiency of the heat recovery.
The total range of the probable values of the heating demand was calculated, using Monte Carlo simulations. The generated matrix N × M included the M parameters of the model as columns, which corresponded to N building scenarios, the lines of the matrix. Hence, 10,000 simulations were computed for each of the examined years (40,000 in total), using the R programming language [25]. In this way, the probabilistic heating demand was calculated and the mean value of the PDF was compared with the deterministic and the measured heating demand.
The probabilistic assessment led to the global sensitivity analysis, which allowed determining the parameters, whose uncertainty mostly influences the uncertainty of the probabilistic heating demand. The global sensitivity analysis considers a simultaneous variation of the inputs and additionally their possible interactions [26], contrary to one-at-a-time sensitivity analysis. According to [26,27], the global sensitivity analysis is used in order to rank variables, fix as constant the unimportant parameters, and limit the model dimensionality. The adopted method is a variance-based GSA, which allows the decomposition of the variance of the heating demand into different parts that can be attributed to inputs, i.e., the parameters of the heating demand, [28]. Precisely, the Sobol decomposition method was used, while the first order and the total effect Sobol Indices were calculated. The former, represents the main effect, i.e., the unique contribution of the individual parameters, Equation (1), while the latter, , represents the joint contribution, by taking into consideration possible interactions among the input parameters of the heating demand, Equation (2).
3. Results
3.1. Identifying the Energy Performance Gap
The annual normative heating demand, Qh, according to the Minergie® standard, is presented in Table 2. The results show that the normative simulation underestimates the heating demand for all the examined years. For 2016 and 2017, the measured useful energy was two times higher than the calculated energy. The relatively low-performance gap presented for 2014, compared to the other years, can be explained by the fact that there were unoccupied apartments during the first year of the operation of the building.
Table 2.
Comparison of the normative heating demand according to the energy-efficient label Minergie® and the measured heating demand for the first four years of operation (2014–2017).
Figure 3 shows the monthly measured heating demand for the four examined years, as well as the calculated heating demand. The former was calculated by aggregating the measured data for a monthly time step. It can be noticed that the calculated heating demand presents a shorter heating season than it actually happens in reality, where the heating stops in July and starts again in September. One reason for this trend could be the possible overestimation of the solar gains during spring and autumn (from April to June and from September to October) in the SIA 380/1 heating demand model.

Figure 3.
Normative calculated heating demand (SIA 380/1 and Minergie®) and measured heating demand of the building for the first four years of operational energy use.
3.2. Explaining the Performance Gap by Comparing the Model Assumptions and the Measured Data
In an attempt to explain the significant differences between reality and the simulation, the normative values and the measured data were investigated in detail. The investigation was first focused on the three parameters, considered by the practitioners as the reasons for the increased performance gap, see Table 3. The comparison of the climate data between the reference climate station (climate station in Payerne) and the station close to the building (climate station in Gland), revealed that the latter showed a slightly warmer climate than the reference climate station. As far as the internal temperature is concerned, the measured temperature during the winter months was 5–15% higher than the normative value. Concerning electricity consumption, the mean measured value for all the years was 18% lower than the normative value. This result shows that the SIA 380/1 model tends to slightly overestimate the internal gains, which could explain the results of the lower calculated heating demand, as well as the shorter heating period, given by the model.
Table 3.
Differences between the measurements and the normative values.
These three aforementioned parameters can be easily measured, during the assessments of the energy performance certifications (e.g., CECB in Switzerland) and the general procedure followed in practice that consists of replacing the normative values in the heating demand steady-state simulation of these parameters with the measured data, as a way to reduce the performance gap, in an ex-post evaluation. However, in the examined case study, including the real data of these parameters in the simulation resulted in an approximately 100% higher performance gap (see Table 4), which reveals that there is a limited understanding of the model and its parameters.
Table 4.
Evolution of the energy performance gap when measured values replace the normative ones in the building energy simulation (2014–2017).
The investigations concerning the mean air flow showed that the measures were 80% lower than the corresponding Minergie® value. However, the thorough examination of this result revealed that these measurements were not reliable, due to a problem in the monitoring system, observed at the end of the measurement campaign. Moreover, the heating system was configured at the end of 2014, while no control was performed until 2017, which could have led to a reduction in the system’s efficiency and thus increased heating demand values. These facts reveal that the monitoring system, as well as possible wrong adjustments of the heating systems, can be additional sources, increasing the performance gap.
In addition, using the available measurements, the energy signature of the building could be obtained in order to compare the calculated to the measured thermal response of the building. The heating slope of the regression model (R2 = 0.94) was small and 8% lower than the theoretical one, see Table 3. This result revealed, first, the high energy performance of the building and its low sensitivity on the variations of the external temperature and, second, the high quality of the construction of the building.
3.3. Reducing the Performance Gap, Using a Probabilistic Approach
The different aforementioned sources of uncertainty (climate data, internal gains, air flow, etc.) participate with different weights in the increase in the performance gap and can be taken into consideration in the heating demand model, through a probabilistic method. Hence, by attributing to the parameters of the SIA380/1 heating demand model, the PDFs of Table 1, the probabilistic model of the heating demand can be developed. The probability density function of the heating demand (min = 50 MJ/m2 ERA, mean = 101 MJ/m2ERA, max = 170 MJ/m2 ERA) is presented with the measured heating demand of the four examined years, as well as the deterministic Minergie® heating demand, in Figure 4.
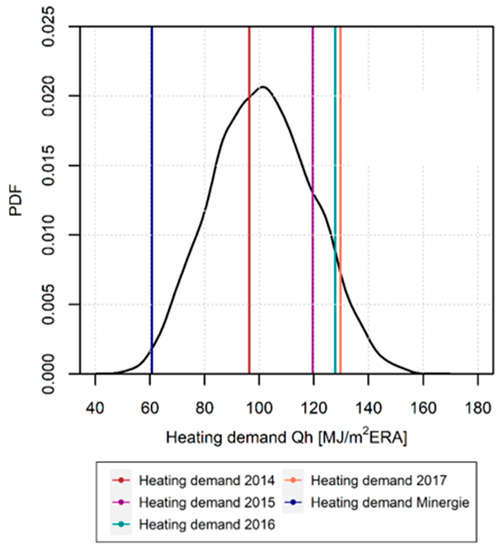
Figure 4.
Probability density function of the heating demand, deterministic heating demand (SIA 380/1 and Minergie®) and measured data period [2014–2017].
The results show that the uncertainty of the heating demand varies significantly, due to the uncertainty of the model parameters, i.e., coefficient of variation cv = 18%. The measured heating demand for all the examined years (except 2014, because of the apartment vacancies at the beginning of the building’s operation) is positioned in the higher part of the distribution (between the mean and the 3rd quartile). As far as the Minergie® heating demand is concerned, it is positioned in the lower part of the PDF (between the minimum value and the 1st quartile), while it is 40% lower than the mean of the probabilistic heating demand. The probabilistic model succeeds in capturing the real measurements, revealing that the hypotheses, concerning the limits of the distributions of the parameters, are relevant. Comparing the measured heating demand with the mean of the distribution, the performance gap is reduced significantly, i.e., between 20–30%, for the years 2015 until 2017, see Table 5. These results reveal that the probabilistic method, presents an efficient way to reduce the performance gap, both in an ex-ante and in ex-post evaluation, by taking into account the different uncertainties of the model.
Table 5.
Energy performance gap between the measurements and the median value of the probabilistic heating demand.
The analysis continued by comparing the deterministic and probabilistic heating demand to the measured data, on a monthly basis. Figure 5 presents these results for the four years of the monitoring campaign. The results show that for all the months the measured heating demand is positioned inside the PDF, with the majority of the times being inside 50% and 100% of the data. On the contrary, the deterministic normative heating demand can be found most of the times outside the whiskers of the boxplot or between the minimum value and the quartile Q1, which represents 25% of the data. Finally, the length of the heating period of the probabilistic model corresponds better to reality than that of the deterministic heating demand. Hence, the probabilistic model can more accurately predict the real heating demand, on a monthly basis, compared to the deterministic heating demand.

Figure 5.
Comparison of the deterministic and probabilistic heating demand to the measured data for the first four years of building operation.
3.4. Explaining the Performance Gap, Using a Global Sensitivity Analysis
Following the uncertainty analysis, two global sensitivity analyses (GSA) were conducted by varying all the model parameters simultaneously. The first GSA considered all the stochastic parameters of Table 1, as well as the climate parameter, by considering the four years of the real climate data stochastically. The results of the Sobol’ Indices are presented in Figure 6 (left). It is shown that the three model parameters explaining most of the variance of the heating demand are the climate, the active air flow, and the shading factor. The climate conditions explain approximately 70% of the variance of the model, which derives from the climate variability among the years, while no significant difference between the first and the total Sobol’ Indices is observed. However, this parameter cannot be refined or predicted easily by architects and engineers in an ex-ante evaluation since it constitutes an exogenous parameter to the model, for which the designer has no control. Thus, it was decided to consider the climate parameter deterministically.

Figure 6.
Sobol’ Indices for all the parameters of the model (left). Sobol’ Indices for all the parameters of the model, except for the climate (right).
In this manner, a second series of sensitivity analyses followed by treating the climate parameter deterministically. Hence, each of the four years of the real climate conditions were attributed separately for the climate parameter. The results of this second analysis, for the year 2016, are presented in Figure 5 (right) since no differences were noticed between the different years. In this case, the three parameters explaining 83% of the variance of the heating needs are the active air flow (60%), the shading (20%), and the internal temperature. No interactions among the parameters are noticed since there is no significant difference between the first and the total order index. It is interesting to note that 60% of the variance of the heating demand is explained by the uncertainty of the active thermal flow, which is a technical parameter not affected by the daily occupant behavior. The results of the heating demand can vary significantly if these parameters are not known with confidence during the building design. Thus, special attention should be given to the determination of the active thermal flow and the shading factor when calculating the heating demand or when setting their configuration in the real construction, since an eventual wrong adjustment of these two parameters increases the performance gap for this case study. However, all the other model parameters show a similar performance, meaning that their uncertainty is not critical for the magnitude of the performance gap for this specific case study of a Swiss energy-efficient residential building.
4. Discussion
The initial investigations of the performance gap revealed that the usual assumptions, concerning its causes, as it is generally defined during the energy audits in practice, i.e., climate data, internal temperature, and electricity consumption, do not explain the performance gap for this case study, since it concerns an energy-efficient building. Thus, through the second step of the research, which includes the probabilistic and global sensitivity analysis, the performance gap could be successfully explained and reduced. The probabilistic framework allowed the calculation of the probabilistic heating demand, by considering probability density functions for the parameters of the SIA 380/1 model. By comparing the measurements to the mean of the probabilistic heating demand, it was shown that the performance gap was significantly smaller than that of the deterministic heating demand. The results showed that the magnitude of the performance gap diminished by approximately 70% when the probabilistic framework was used.
The GSA showed that the two parameters explaining most of the variance of the heating demand are the shading factor and the active air flow. This result gives hints about the causes of the performance gap for the case of an energy-efficient building. It reveals the parameters that need to be further refined in the calculations, or measured with caution through a targeted on-site measurement campaign, since their influence on the variance of the heating demand increases the magnitude of the performance gap, too. Thus, the GSA can be a valuable method for the practitioners, both in the building planning process (ex-ante assessment), or during the building operation (ex-post assessment), since it allows a targeted control and re-evaluation of the parameters in question.
However, it should be noted that the application of the methodology used in this article (cf. Figure 1) will not certainly lead to the same conclusions concerning the parameters that mostly influence the variance for a different analyzed case study. For instance, an existing building built in the 1960s with poor thermal insulation and low thermal mass is more susceptible to external temperature variations. Similarly, if the probabilistic assessment is conducted in the design stage, during which all the input parameters are unknown, the results of the GSA will most probably not be the same, or even if the ranges of the variation of the parameters are different than those chosen in this study. Hence, no generalization of the results can be conducted. However, generalized hints of how to deal with the observed performance gap for an energy-efficient building can be given in the following.
4.1. Further Reduction of the Performance Gap by Adjusting the Shading Factor
Based on the results of the sensitivity analysis, targeted control of the most influential parameters followed. The normative values of the Minergie® calculations, concerning the active air flow and the shading factor, should be re-evaluated so that they correspond better to the most probable conditions of the building. In an ex-post evaluation, the representativeness of these normative values could be verified by a targeted measurement campaign. For this case study, first, the active air flow was determined through a technical procedure that allowed the retrieval of all the measurements of 2015. The measured active air flow was found to be higher than the Minergie® normative value, i.e., 0.43 m3/(m2ERA·h). Concerning the uncertain parameter of the shading factor, since a second measurement campaign was not possible for this building it could also be estimated numerically using a probabilistic approach. A performance gap limited to ±5% between the measurements and the SIA 380/1 probabilistic heating demand was defined, resulting in the determination of distributions for the shading factor for each month of the year. These distributions gave only indicative values in order to approximate the real conditions of the building by considering a ±5% performance gap. Hence, 100,000 probabilistic simulations were conducted using the statistical software R for 2015. All the other model parameters were kept as before (cf. Table 1). Figure 7 presents the boxplots for the shading factor for 2015 since real data for the active air flow were available only for this year.
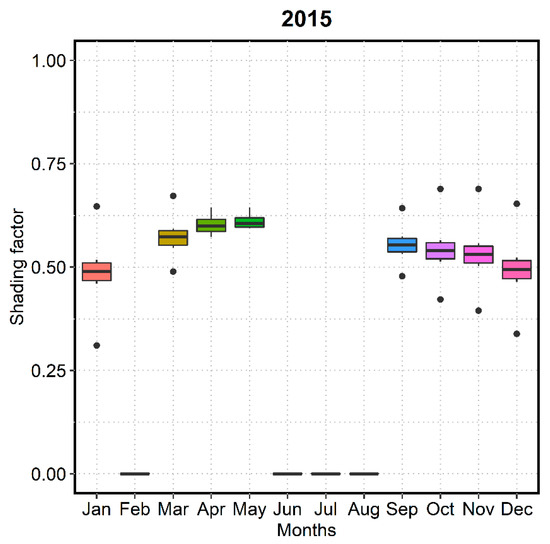
Figure 7.
Shading factor to limit the energy performance gap to ±5% (example for the year 2015).
The results show that for the heating season, 50% of the simulations show a shading factor between 50–60%. Concerning February, no results could be obtained for the shading factor. The reason lies in the fact that the probabilistic heating demand cannot predict well the deterministic heating demand when the real active air flow is used (i.e., a difference of more than ±5%) for this month. The normative Minergie® value for the shading factor is 0%, i.e., no shading at all, which means that according to the Minergie® requirements and the SIA 380/1 standard, the solar gains are overestimated, leading to a reduction in the heating demand. However, the reality is different, i.e., the windows are shaded and the solar gains are not efficiently valorized, leading to an increase in the heating demand. This behavior of the occupants to increase the shading of the windows and diminish the solar gains was also shown by a measurement campaign conducted in a nearby building of the same ecological district. Data were collected for a period between the 3 February 2016 and the 30 October 2017. The detailed analysis of the measurements [21] revealed that the stores were not systematically open during the day, limiting the maximization of the solar gains. Thus, in order to harmonize reality and simulations and reduce the performance gap, the shading factor should be redefined in the Minergie® and SIA 380/1 simulations to better reflect the real conditions.
4.2. Limitations of the Current Approach
The analysis of the shading factor in the previous section has several limitations due to the lack of precise measurements for the building under study. Indeed, there is a potential risk that the calculated stochastic value of the shading factor is in reality a bit different even if the measurements of a nearby building in the ecological district confirm it. This also goes back to the limits of the used heating demand model based on the SIA 380/1 steady-state calculation which is not for instance a dynamic model accounting in an accurate way of the transient effects such as the effects of the solar gains and shadings. Thus, further studies applying a similar stochastic approach but on a dynamic heating demand model and with more measurement data (including the shadings of the investigated building) would be needed to better understand and reduce the performance gap in energy-efficient buildings.
5. Conclusions
This research aimed to investigate the performance gap of the useful heating demand of an energy-efficient building, in Switzerland. The following conclusions could be drawn:
- (a)
- Among the reasons explaining the performance gap, we can find the overestimation of the solar and internal gains in the heating demand calculations, errors of the measurement system, wrong configurations of the technical system, the non-representativeness of the normative values included in the simulations, regarding the real conditions of the building or the uncertainty of the parameters controlled by the occupants.
- (b)
- The probabilistic analysis can be an efficient method for minimizing the performance gap both in ex-post and ex-ante evaluations, while the sensitivity analysis proved to be a straightforward method for the identification of the parameters that explained the variance of the probabilistic heating demand. This step allows a targeted investigation of these parameters, regarding their adjustment in the simulation or in the real construction and gives hints about the causes of the performance gap as well as solutions for its correction.
- (c)
- The results of the sensitivity analysis cannot be generalized since only one residential case study was analyzed. However, the analysis showed that increasing the percentage of the shading factor in the Minergie® simulations for this specific case study can lead to the minimization of the gap between the measurements and the simulation. Further studies are now needed that also includes the use of a more accurate building heating demand model using a dynamic calculation and more measurement data in sensitive parameters (e.g., shading factor).
Author Contributions
Conceptualization, P.P. and S.L.; Formal analysis, P.P.; Funding acquisition, P.P. and S.L.; Investigation, P.P., G.W., B.P. and S.L.; Methodology, P.P., K.G. and S.L.; Project administration, S.L.; Resources, P.P., G.W., B.P.; Software, P.P.; Supervision, P.P. and S.L.; Writing—original draft, K.G. and S.L.; Writing—review & editing, P.P., K.G., S.L. All authors have read and agreed to the published version of the manuscript.
Funding
This research was funded by the Swiss Federal Office for Energy (SFOE, UserGap Project No. SI/501520-01) and the Conférence Romande des Délégués à l’Energie (CRDE).
Institutional Review Board Statement
Not applicable.
Informed Consent Statement
Not applicable.
Data Availability Statement
The data used in this study are available upon request at eSMART which installed the building with smart metering systems and HEIG-VD for additional measurements on the air flow of the ventilation system.
Acknowledgments
The authors wish to acknowledge the financial support of this work by the Swiss Federal Office for Energy (SFOE, UserGap Project No. SI/501520-01) and the Conférence Romande des Délégués à l’Energie (CRDE). The authors would like, also, to thank Losinger Marazzi SA and eSMART for providing the necessary data for the building case study and the other UserGap partners (HES-SO Valais, EHE SA and TEP Energy GmbH) for their fruitful discussions.
Conflicts of Interest
The authors declare no conflict of interest.
References
- De Wilde, P. The gap between predicted and measured energy performance of buildings: A framework for investigation. Autom. Constr. 2014, 41, 40–49. [Google Scholar] [CrossRef]
- Shi, X.; Si, B.; Zhao, J.; Tian, Z.; Wang, C.; Jin, X.; Zhou, X. Magnitude, causes, and solutions of the performance gap of buildings: A review. Sustainability 2019, 11, 937. [Google Scholar] [CrossRef] [Green Version]
- Van Dronkelaar, C.; Dowson, M.; Spataru, C.; Mumovic, D. A review of the regulatory energy performance gap and its underlying causes in non-domestic buildings. Front. Mech. Eng. 2016, 1, 1–14. [Google Scholar] [CrossRef] [Green Version]
- Fokaides, P.A.; Maxoulis, C.N.; Panayiotou, G.P.; Neophytou, M.K.-A.; Kalogirou, S.A. Comparison between measured and calculated energy performance for dwellings in a summer dominant environment. Energy Build. 2011, 43, 3099–3105. [Google Scholar] [CrossRef]
- Menezes, A.C.; Cripps, A.; Bouchlaghem, D.; Buswell, R. Predicted vs. actual energy performance of non-domestic buildings: Using post-occupancy evaluation data to reduce the performance gap. Appl. Energy 2012, 97, 355–364. [Google Scholar] [CrossRef] [Green Version]
- Newsham, G.R.; Mancini, S.; Birt, B.J. Do LEED-certified buildings save energy? Yes, but…. Energy Build. 2009, 41, 897–905. [Google Scholar] [CrossRef]
- Haldi, F.; Robinson, D. On the behaviour and adaptation of office occupants. Build. Environ. 2008, 43, 2163–2177. [Google Scholar] [CrossRef]
- Korjenic, A.; Bednar, T. Validation and evaluation of total energy use in office buildings: A case study. Autom. Constr. 2012, 23, 64–70. [Google Scholar] [CrossRef]
- Niu, S.; Pan, W.; Zhao, Y. A virtual reality integrated design approach to improving occupancy information integrity for closing the building energy performance gap. Sustain. Cities Soc. 2016, 27, 275–286. [Google Scholar] [CrossRef]
- Miller, C.; Nagy, Z.; Schlueter, A. Automated daily pattern filtering of measured building performance data. Autom. Constr. 2015, 49, 1–17. [Google Scholar] [CrossRef]
- Yuming, S. Closing the Building Energy Performance Gap by Improving Our Predictions; Georgia Institute of Technology: Atlanta, GA, USA, 2014. [Google Scholar]
- Walker, W.; Harremoës, P.; Rotmans, J.; van der Sluijs, J.P.; Van Asselt, M.; Janssen, P.; Von Krauss, M.K. Defining Uncertainty: A Conceptual Basis for Uncertainty Management in Model-Based Decision Support. Integr. Assess. 2003, 4, 5–17. [Google Scholar] [CrossRef] [Green Version]
- Björklund, A.E. Survey of approaches to improve reliability in lca. Int. J. Life Cycle Assess. 2002, 7, 64–72. [Google Scholar] [CrossRef]
- Calì, D.; Andersen, R.K.; Müller, D.; Olesen, B.W. Analysis of occupants’ behavior related to the use of windows in German households. Build. Environ. 2016, 103, 54–69. [Google Scholar] [CrossRef] [Green Version]
- Tagliabue, L.C.; Manfren, M.; Ciribini, A.L.C.; DE Angelis, E. Probabilistic behavioural modeling in building performance simulation—The Brescia eLUX lab. Energy Build. 2016, 128, 119–131. [Google Scholar] [CrossRef]
- Cecconi, F.R.; Manfren, M.; Tagliabue, L.C.; Ciribini, A.L.C.; De Angelis, E. Probabilistic behavioral modeling in building performance simulation: A Monte Carlo approach. Energy Build. 2017, 148, 128–141. [Google Scholar] [CrossRef]
- Branco, G.; Lachal, B.; Gallinelli, P.; Weber, W. Predicted versus observed heat consumption of a low energy multifamily complex in Switzerland based on long-term experimental data. Energy Build. 2004, 36, 543–555. [Google Scholar] [CrossRef]
- Cozza, S.; Chambers, J.; Patel, M.K. Measuring the thermal energy performance gap of labelled residential buildings in Switzerland. Energy Policy 2020, 137, 111085. [Google Scholar] [CrossRef]
- Reimann, W.; Lehmann, M.; Bühlmann, E.; Bade, S.; Krämer, S.; Ott, W.; Montanari, D.; Ménard, M. Erfolgskontrolle Gebäudeenergiestandards 2014–2015, Schlussbericht; Swiss Federal Office for Energy: Bern, Switzerland, 2016. [Google Scholar]
- Minergie. Available online: https://www.minergie.ch/fr/ (accessed on 1 September 2021).
- Padey, P.; Wagner, G.; Périsset, B.; Lasvaux, S. Usergap, Partie HEIG-VD: Analyse de L’écart de Performance Lié à la Demande de Chauffage du Bâtiment B1.2 de L’éco-Quartier Eikenott à Gland (VD), Rapport Intermédiaire; Swiss Federal Office for Energy: Bern, Switzerland, 2019. [Google Scholar]
- eSmart Technologies, SA. Available online: https://www.myesmart.com/ (accessed on 6 January 2021).
- SIA 380/1. Besoins de Chaleur pour le Chauffage; Schweizerischer Ingenieur- und Architektenverein: Zürich, Switzerland, 2016. [Google Scholar]
- E4Tech. Lesosai Software webpage. Available online: https://lesosai.com/ (accessed on 1 September 2021).
- The R Project for Statistical Computing. Available online: https://www.r-project.org/ (accessed on 1 September 2021).
- Kucherenko, S.; Song, S. Different numerical estimators for main effect global sensitivity indices. Reliab. Eng. Syst. Saf. 2017, 165, 222–238. [Google Scholar] [CrossRef] [Green Version]
- Sobol, I.M.; Kucherenko, S.S. Global sensitivity indices for nonlinear mathematical models. Review. Wilmott 2005, 2005, 56–61. [Google Scholar] [CrossRef]
- Saltelli, A. Sensitivity Analysis in Practice: A Guide to Assessing Scientific Models; Wiley: New York, NY, USA, 2004. [Google Scholar]
Publisher’s Note: MDPI stays neutral with regard to jurisdictional claims in published maps and institutional affiliations. |
© 2021 by the authors. Licensee MDPI, Basel, Switzerland. This article is an open access article distributed under the terms and conditions of the Creative Commons Attribution (CC BY) license (https://creativecommons.org/licenses/by/4.0/).