Article

Biochar Stability in a Highly Weathered Sandy Soil under Four Years of Continuous Corn Production

by
Jeffrey Michael Novak
*,
Donald William Watts
*,
Gilbert C. Sigua
,
William Tillman Myers
,
Thomas F. Ducey
and
Hannah C. Rushmiller
Coastal Plain Soil, Water and Plant Research Center, United States Department of Agriculture (USDA), Agricultural Research Service (ARS), 2611 West Lucas Street, Florence, SC 29501, USA
*
Authors to whom correspondence should be addressed.
Energies 2021, 14(19), 6157; https://doi.org/10.3390/en14196157
Submission received: 12 August 2021 / Revised: 17 September 2021 / Accepted: 24 September 2021 / Published: 27 September 2021
(This article belongs to the Special Issue Biochar from Biomass)

Abstract

:
Biochar is being considered a climate change mitigation tool by increasing soil organic carbon contents (SOC), however, questions remain concerning its longevity in soil. We applied 30,000 kg ha−1 of biochars to plots containing a Goldsboro sandy loam (Fine-loamy, siliceous, sub-active, thermic Aquic Paleudults) and then physically disked all plots. Thereafter, the plots were agronomically managed under 4 years (Y) of continuous corn (Zea Mays, L.) planting. Annually, incremental soil along with corresponding bulk density samples were collected and SOC concentrations were measured in topsoil (down to 23-cm). The biochars were produced from Lodgepole pine (Pinus contorta) chip (PC) and Poultry litter (PL) feedstocks. An untreated Goldsboro soil (0 biochar) served as a control. After four years, SOC contents in the biochar treated plots were highest in the top 0–5 and 5–10 cm depth suggesting minimal deeper movement. Declines in SOC contents varied with depth and biochar type. After correction for SOC declines in controls, PL biochar treated soil had a similar decline in SOC (7.9 to 10.3%) contents. In contrast, the largest % SOC content decline (20.2%) occurred in 0–5 cm deep topsoil treated with PC biochar. Our results suggest that PC biochar had less stability in the Goldsboro soil than PL biochar after 4 years of corn grain production.

1. Introduction

Scientists, policy makers, sustainability advocates and industry personal concerned with determining suitable methods for atmospheric CO2 concentrations reductions are examining soil-based management practices that are linked to gains in organic carbon (OC) sequestration [1,2]. One of these potential strategies is the use of biochar as a soil amendment. Since biochar is a C-enriched material, its application to soil is reported to bolster SOC contents thereby off-setting atmospheric CO2 gas concentrations [3,4,5]. In addition to increasing SOC contents [6,7], previous research has shown that biochars have other complementary properties that advance additional agronomic and soil tilth characteristics as well. Examples include biochars improving soil fertility [8,9], raising soil water retention [10] and suppling critical plant macro- and micro-nutrients into soil nutrient pools [11,12]. For biochars to have a long-term impact at off-setting atmospheric CO2 concentrations, it has been suggested that the organic carbon (OC) structures supplied to soil through biochar addition should be persistent for at least 100 years [13,14] if not 1000 years [12,15].
Biochar is a solid product created by thermal pyrolysis of organic feedstocks in a closed system with little or no oxygen [16,17]. Many types of organic feedstocks can be used to produce biochars, including agricultural crop residues, forestry waste products and animal manures. Biochar feedstocks produced from hardwoods and manures vary differently in their plant nutrient composition. Biochar manufactured from hardwood-based material have lower P and K concentrations while manure-based biochars have higher concentrations of these critical plant nutrients [18,19]. Under pyrolysis conditions, these feedstocks will undergo structural rearrangement and functional group degradation depending upon the employed pyrolysis temperatures. Lower pyrolysis temperatures (350–400 °C) leaves many of the organic functional groups intact because of minimal losses of O- and H-containing volatile compounds [20]. Higher pyrolysis temperatures (>400 °C) in contrast, facilitates more loss of volatile compounds, functional group declines and a rearrangement of OC compounds into poly-condensed aromatic sheets [21,22]. It is at these higher pyrolysis temperatures that biochars have a greater amount of OC distributed in aromatic structures (50 to 82%; [18]) low H/C molar ratios (<0.4; [3]) and very low O/C molar ratios (<0.2; [15]). In addition to pyrolysis temperature as a determinant, biochar particle size will influence its mineralization dynamics in soils. For instance, mineralization was significantly higher when dust-sized (<0.42 mm) biochar was incubated in two Ultisols compared to application as a pellet (>2-mm; [23]). Thus, the literature has identified that these noted structural and size characteristics are important parameters for biochars persistence in soil because they impart a high degree of resistance to microbial oxidation and subsequent increase long-term stability [24,25].
Biochars can have other impacts on soil health properties. Biochars introduce a myriad of organic structures and inorganic compounds into soils that are reported to induce improvements in the micro- and macro-nutrient supply [11]; shifts in pH [12]; changes in chemical reactions [26]; adjustments in microbial community structure [27]; and modifications in enzyme production and reactions [28]. The mechanisms for shifts in soil pH and supplying plant nutrients are explained by feedstock quality, pyrolysis temperature, and ash content [12]. Biochars produced from animal manures are alkaline because the high ash content contains salts and other inorganic species excreted by the animal [12]. The additional nutrients and other inorganic materials react with minerals or oxides on mineral surfaces and promotes changes in their binding and release [26]. Additionally, biochars added to soil provides organic material that vary in their degree of microbial mineralization [29]. Some of the mineralized organic structures in biochar can influence enzyme production and catalyzation reactions resulting in the release of N, P and S [30]. Others have reported that biochar additions to soil can enhance microbial mineralization and release of plant nutrients [31,32].
Shifts in soil chemistry and microbial dynamics from biochar addition can assert a negative, positive, or neutral priming impact on the indigenous SOC pool [33]. Priming effects happen because biochars have characteristics that can modify mineralization dynamics of native SOC because of the addition of fresh substrates [34]. Positive priming has been linked to the accelerated mineralization of native SOC components when stimulated by the addition of biochar and subsequent reduction in native SOC contents [35]. Negative priming, in contrast, is defined as the retardation in SOC mineralization due to shifts in microbial decomposition dynamics (i.e., heterotrophic population swings, enzyme disfunction, etc., [33]). Blanco-Canqui et al. [6] recently reported a stunning doubling of SOC contents after a mixed wood-type biochar was applied to an Iowa field containing Mollisols that was attributed to negative priming. A neutral priming effect occurs when the addition of biochar has a non-detectable impact on SOC contents. Thus, to maximize a soils ability to store OC, a biochar amendment should promote either a negative or neutral priming effect.
The impact of biochar on SOC decomposition dynamics is usually determined through short term (<1 year) laboratory incubation studies where soil and environmental conditions (i.e., moisture, temperature, N source, etc.) are carefully controlled. By measuring CO2 concentrations and SOC contents in laboratory experiments, an assessment of biochar stability can be modeled and hence its influence on priming determined. Field studies examining biochar stability are more complex and it is an area that is not often reported in the literature. For example, Gurwick et al. [36] reported that only 3 studies estimating biochar stability in actual field experiments. Similarly, less than 10% of studies presented in a recent review of biochar effects on soil respiration were determined under actual field conditions [37]. As mentioned, determining priming effect under field conditions is a complex process because of multifaceted interactions between biochars, SOC mineralization dynamics from crop residue decompositions, enzyme production, climate conditions, N fertilizer and tillage management practices. Nonetheless, determining biochars stability in field soils under different agronomic and climate conditions is a vital piece of information for their acceptance as a climate change mitigation tool. We suggest that there is a need for more field evaluation of biochar as a SOC sequestration amendment particularly under typical agronomic, tillage and fertilizer management practices.
The objective of this study was to determine biochar stability in a highly weathered sandy soil by collecting annual soil samples, bulk density, and quantifying topsoil SOC concentration in 5-cm increments down to 23 cm depth in plots treated without biochar (controls) and treated with biochars produced from pine chips and poultry litter feedstocks. To further exemplify typical field and crop conditions, all plots were managed under 4-years of continuous corn production using typical reduced tillage and agronomic practices (e.g., fertilizer rates, corn stover returned to soil, etc.) for the Southeastern USA Coastal Plain region.

2. Materials and Methods

2.1. Site Characteristics and Soil Properties

This plot experiment was conducted at the United States Department of Agriculture, Agricultural Research Service, Coastal Plain Soil, Water, and Plant Research Center, Florence, South Carolina, USA (34°14’ 38” N and 79°48’45.3 W). The Goldsboro soil series is mapped within the experimental field. The Goldsboro soil series is a highly weathered Ultisol with marine sediment parent material [38]. Topsoil texture (0–15 cm deep) is a sandy loam using the hydrometer method [39] and consists of 67.8% sand, 21.9% silt and 10.3% clay. The field has been extensively used for row and vegetable crop experimentation over the past 60 years. The soil was tilled either with deep tilling (conservation tillage) using a deep shank to a depth of 40-cm deep or by disking (conventional tillage) to a 10-cm deep depth (Figure 1a).

2.2. Biochar Pyrolysis and Characterization

Biochar pyrolysis conditions and biochar properties have been previously reported [40]. Commercial operators supplied the PC and PL biochars for this experiment. The PC biochar was produced by pyrolysis of Lodgepole pine (Pinus contorta) flakes using a two-stage temperature process between 500 and 700 °C (low O2 conditions for 1 min) and then furthered carbonized between 300 to 500 °C (low O2 for 15 min, [41]). The PL biochar was produced from bedding house material using a propriety gasification process employing a fixed bed pyrolyzer. Both biochars were screened at the production facility using a 1-mm sieve to avoid dust issues associated with finer sized biochar material. The biochars were characterized for their chemical characteristics through Hazen Research (Golden, CO, USA; [42], Table 1). Biochar pH was measured using a 1:2 (w/w) ratio with deionized water [40]. Additional PL and PC biochar chemical characteristics have been previously published [40].

2.3. Field Plot Description

2.3.1. Establishing Plots and Soil Sampling

In December 2015, 12 research plots (four replicate plots for each of three treatments) were established with each being 40 m2 in area arranged in a randomized complete block design (Table 2). In January 2016, background (Y0) composite soil samples for SOC measurements were randomly collected from 8–12 sites within each plot at 0–5, 5–10, 10–15, and 15–23 cm depths. At the same time, soil bulk density measurements were collected at corresponding soil depths from one randomly selected location within each plot. Soil samples were collected using a 2.5-cm diameter sampling probe (Figure 1b), while soil bulk density samples were collected using methods outlined [43]. The soils for SOC measurements were then air-dried, 2-mm sieved and later transferred into sealable plastic bags for storage. Their SOC content was measured by dry combustion using a Elementar Variomax CNS analyzer (Elementar Americas, Inc.; Ronkonkoma, NY, USA). Their SOC contents were then expressed on a kg ha−1 basis. Soil sampling in all plots was repeated in a similar manner for year 1 (Y1; 2017), year 2 (Y2; 2018), year 3 (Y3; 2019) and year 4 (Y4; 2020; Table 2). While the plots were not under corn grain production during Y4, soil and bulk density samples in Y4 were collected in Spring 2020 prior to crop change to determine SOC contents at the end of this study.

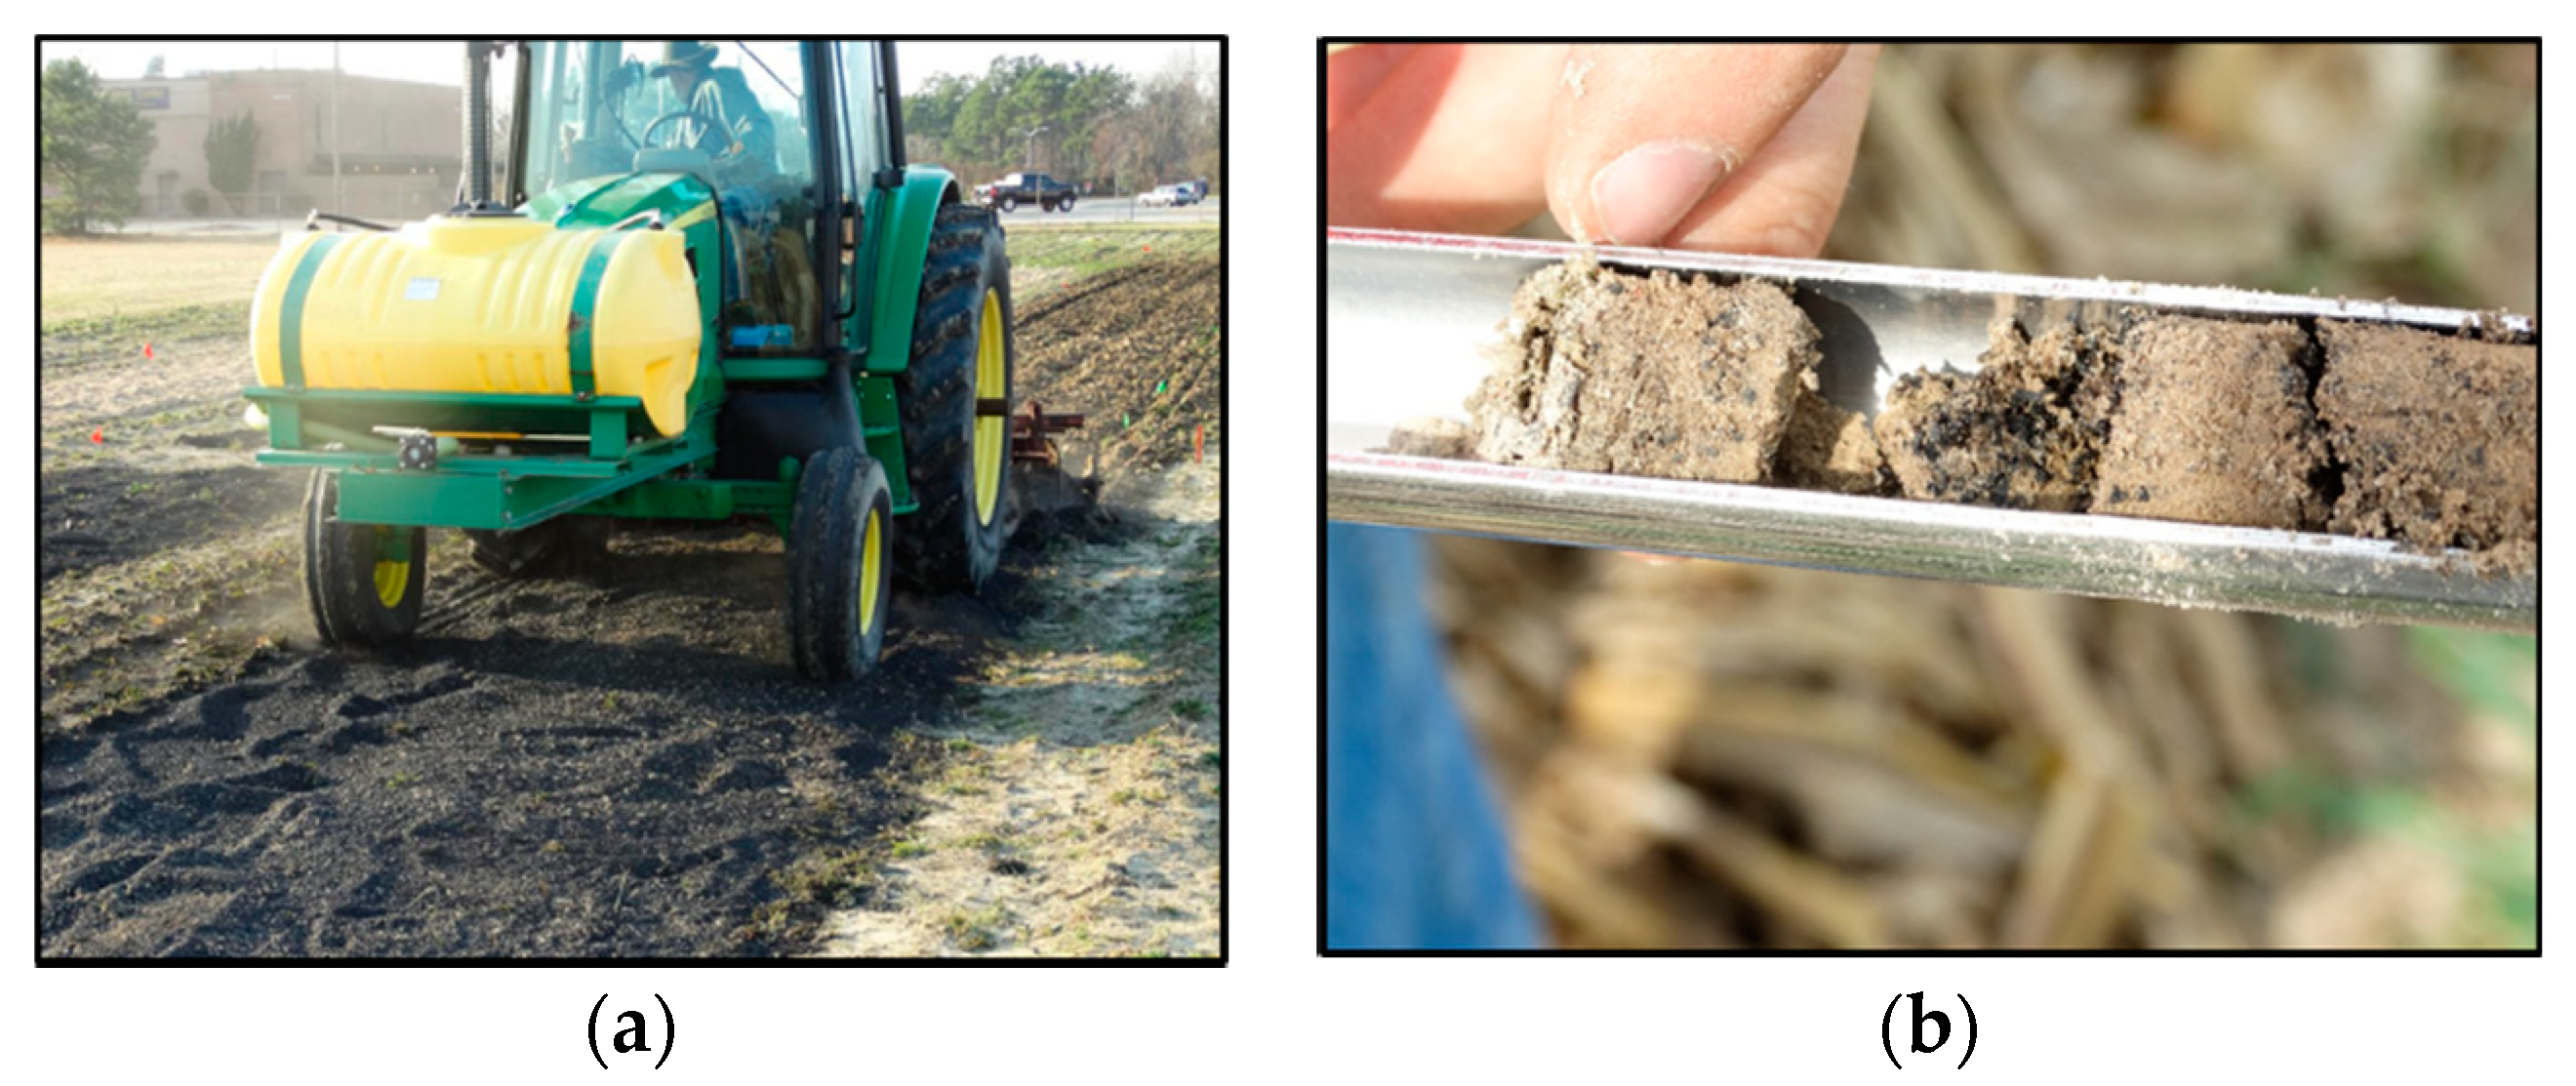
2.3.2. Biochar Application

The PL and PC biochar were hand applied to all plots except controls in February 2016 (Y0, Table 2). The biochars were then lightly raked into the topsoil. Biochar treated plots received the equivalent of 30,000 kg ha−1 of biochar (Table 3). This biochar application rate is within range of prior laboratory biochar incubation experiments that improved the organic carbon content [44] and reduced soil physical deficiencies [45] of sandy, highly weathered soils. Shortly after biochar application, the amendments were mixed to a depth of 10-cm using a field disk cultivator (Figure 1a). Four untreated plots of Goldsboro sandy loam soil were also disked tilled and they served as a control (no biochar applied). Biochar application was also expressed on an OC basis using the PL and PC biochars OC content and mass biochar applied (Table 3).

2.3.3. Agronomic Management and Precipitation Conditions

The agronomic management for the plots was typical for continuous corn grain farming practices in the South Carolina Coastal Plain region. This involved that each plot received inorganic N-P-K fertilizer as needed in late March to early April at rates described [40]. In early to mid-April, soil was tilled using conservation tillage equipment by pulling a steel shank to shatter soil down to 40 cm. Simultaneously, a DKC64-89 corn variety was planted with a stand count of 59,406 plants ha−1. Corn grain was harvested in early Fall of each year and stover material consisting of leaves, cobs, and husks was returned to the soil surface inside each plot as described [40]. Incremental soil and bulk density samples were collected in mid-Winter (Table 2) after grain and stover harvest which allowed between 5 to 6 months for crop stover mineralization and C contribution to the SOC pool. Delays caused by weather or scheduling irregularities contributed to the monthly variation in sample collection over the 4-year time course. Prior to soil sampling and bulk density collection, however, residual corn stover was physically removed from the soil coring site to ensure no inclusion of plant material in the collected soil samples. Monthly precipitation totals were collected from the nearest USDA weather station (10 km away) from 2016 to 2020 and reported [46]. No supplemental irrigation was applied to the plots.

2.4. Statistics

A two-way ANOVA was used on the annual mean SOC contents measured in the control, PL and PC biochar treated plots with fixed variables being depth, year (Y0 to Y4) and their associate interactions. SOC results from the control, PL and PC-treated plots were determined to be normally distributed and have equal variances, so no data sets were transformed. We also calculated relative fluctuations in annual mean SOC content for the 4-year field experiment on a mass SOC change, and as a relative % change in SOC by SOC Y1 minus SOC Y4/ SOC Y1 * 100. We corrected the relative % SOC change in the biochar treated plots by subtraction of the % SOC change in the control. Next, a two-sample t-test was used to compare SOC content changes in the 0–5 and 5–10 cm soil depth between Y1 and Y4. The top two soil depths were only used in this calculation because there were minimal SOC content changes determined at the two lower soil depths (10–15 and 15–23 cm). All statistical analyses were determined using Sigma Stat v. 13 (SSPS Corp., Chicago, IL, USA) at a p < 0.05 level of significance.

3. Results

3.1. Biochar Characteristics and Application

Chemical digestion of the PL and PC biochar samples revealed dissimilarities when their characteristics are compared (Table 1). As expected with wood-based feedstocks, the PC biochar had a much higher quantity of %C compared to the PL biochar. In fact, there is almost 3 times as much C in the PC compared to the PL biochar. The PL biochar, in contrast, had higher %H, %N, %ash and a lower Fixed C content than the PC biochar. The PL biochar also had a higher O/C molar ratio (0.094) compared to PC biochar (0.051; Table 1).
As shown in Table 2, biochar was applied in early February 2016 which is denoted as Y0. The dissimilar C compositional difference between the biochars resulted in much more C delivered to the PC treated plots compared to the PL treated plots (Table 3). In fact, applying 30,000 kg ha−1 of biochar delivered 9960 and 26,550 kg ha−1 of C, respectively, to the PL and PC biochar treated plots. Applying 30,000 kg ha−1 of biochar to the plots resulted in a few cm thick blanket of biochar across the entire plot (Figure 1a). As noted, this blanket of biochar was mechanically mixed into the top 10-cm topsoil depth (Figure 1a), with the depth of biochar incorporation observed in the topsoil core (Figure 1b).

3.2. Annual SOC Contents

The annual mean SOC contents for the control, PL- and PC-biochar treated plots by incremental soil depth is presented in Table 4. The mean SOC contents of the PL and PC treated plots are much higher than the control (0 biochar applied). However, the SOC contents for the Controls in T0 are highest in the top two soil depths (0–5 and 5–10 cm) with abrupt concentration declines at lower topsoil depth (10–15 and 15–23 cm). The SOC content distribution pattern in the Control plots was consistent for Y1 through Y4 that revealed steady declines with topsoil depth increments. In the 0–5 cm soil depth of the Controls, there was a significant mean SOC content decline measured especially by Y4 (Table 4).
Applying 30,000 kg ha−1 of PL and PC biochar in Y1 resulted in large SOC content increases compared to background SOC contents measured in Y0 (Table 4). It is interesting that the SOC contents measured in the top two soil depths (0–5 and 5–10 cm) of the PL and PC biochar plots were consistently higher than those measured at the two lower topsoil depths. We did note that the SOC contents measured in the top two soil depths of both biochar treated plots declined with time. In contrast, SOC contents measured in the two lower depths of the biochar treated plots remained similar between Y1 to Y4. These trends are consistent with the overall significant depth and year effects for all three treatments. There is also a significant depth * Y interaction for the PL- and PC-treated plots, but not for the control (Table 5).
Comparing SOC contents between Y1 and Y4 allowed for an estimate of biochar stability after 4 years of continuous corn grain production (Table 6). The SOC content measured in the 0–5 cm depth of the control soil was not significantly different, but we measured a −721 kg ha−1 SOC loss. In contrast, there was a significant SOC content decline at the 5–10 cm soil depth in the Control which accounts for a −2310 kg ha−1 loss. This larger SOC mass change in the Control translates to a 27.8% relative change. In the PL biochar treated plots there is a significant SOC decline at both soil depths with the 5–10 cm depth experiencing a larger SOC decline (−4079 vs. −2050 kg ha−1; Table 6). The relative % SOC change at the 0–5 and 5–10 cm soil depth in the PL biochar treated plots was between 18.7 and 35.5%. After correction, the SOC change in the PL treated plots declined to 10.3 and 7.9%. We noted in the pine chip biochar treated plots, there was no significant SOC change in the 0–5 cm soil depth, but significant changes occurred in the 5–10 cm soil depth. The PC biochar treated plots have the greatest mass SOC change between −4937 and −5213 kg ha−1. These mass SOC content changes for the two depths in the PC treated plots accounted for a 28.6 to 30.4% relative change. After correction, the %SOC contents declined to 20.2 and 2.6%.
Using the results from Table 6, we estimate that almost 90% of the PL biochar remained in the Goldsboro topsoil after 4-years under continuous corn production. The PC biochar treated plots experienced much larger SOC mass losses, but the SOC losses were more apparent in the 0–5 cm soil depth after SOC correction. Just examining the 0–5 cm soil depth, PC biochar had larger SOC mass and relative % change SOC losses suggesting that PC biochar had lower stability than the PL biochar in the Goldsboro soils under these agronomic conditions.

4. Discussion

For biochars to succeed as a tool for atmospheric CO2 mitigation, the material must deliver substantial quantities of OC to soil that correspondingly increases it’s SOC contents, next the added biochar should not negatively impact mineralization dynamics of indigenous SOC contents (positive priming), and has chemical, physical or morphological characteristics that imparts resistance to chemical weathering or to oxidation by microbial communities. In other words, for biochar to thrive as a tool for reducing atmospheric CO2 concentrations, the OC delivered to soil through a biochar amendment should be detectable/measurable as SOC after a few hundred [13,14] or 1000 years [12,15]. This study used the annual SOC contents measured in incrementally collected soil samples as a proxy for estimating PC and PL biochars stability and potential downward movement after weathering under a 4-year continuous corn crop.

4.1. SOC Stability in Control Goldsboro Soils

The Control plots experienced an 8.4 and 27.8% decline in mean SOC contents in the 0–5 and 5–10 cm soil depth, respectively, which was probably related to disking the soils in Y0 (2016). The SOC content declines were more severe in the 5–10 cm soil depth than the 0–5 cm soil depth. It could be argued that the lower SOC losses in the 0–5 cm depth was a result of returning between 5934 and 9430 kg ha−1 corn stover annually (2016 to 2018 measurements, [40]). After stover mineralization, OC would replenish the SOC pool at 0–5 cm soil depth resulting in lower SOC mass losses and smaller relative changes relative to OC dynamics occurring in the 5–10 cm soil depth. However, SOC reduction in the Goldsboro Control soil may be related to their being disked like the biochar treated plots. Thus, the effect of disking is evident on SOC declines in the Control plots in spite of 4-years of conservation tillage with stover returned. This is contrary to results from past field studies that have reported conservation tillage can increase SOC contents [47,48]. Although the conservation tillage effect is time dependent and takes a few decades for significant increases to occur [49].

4.2. Pine Chip Biochar Application and Stability

In our study, the PC-based biochar was C enriched (88.5% C; Table 1), had more Fixed C (85.7%) and a lower O/C ratio compared to PL biochar. The lower O/C ratio and higher %Fixed C characteristics suggests that pyrolysis of the pine chip feedstock was at a temperature that removed much volatile material and the remaining OC compounds probably occur in poly-condensed type structures. These characteristics are reported to be salient properties for biochar longevity in soils [14,15]. Pine chip biochar with higher %C content at the employed application rate (30,000 kg ha−1) delivered more C to the Goldsboro topsoil (26,550 kg ha−1; Table 3). This is a tremendous amount of C delivered to the Goldsboro soil, so correspondingly higher annual mean topsoil SOC contents were measured over the time course. In fact, the magnitude of the SOC increase from PC biochar application has resulted in nearly a 3-fold increase in Y1 when compared to background SOC contents measured in Y0.
It was important to sample topsoil in incremental depths down to 23 cm because the degree of vertical stratification and temporal variation in SOC contents was revealed. Over the course of this study, SOC contents in the incremental soil depth after PC biochar application mostly remained in the 0–5 and 5–10 cm soil depth (except in Y2; Table 4) reflecting the tillage disking depth used during initial incorporation (Figure 1a). The noted significant SOC content measured in Y2 between 0–5 and 5–10 cm soil depth may be an artifact of the large standard deviation about the mean at 5–10 cm (X = 9649, SD = 3555; Table 4). Here, the biochar was mixed using disk tillage to a 10 cm soil depth after its application (Figure 1a). It is plausible that different forms of soil inversion tillage (i.e., moldboard plowing, strip tillage, etc.) if used after biochar application could be adjusted to mix biochar to deeper topsoil depths (>10 cm). Incorporation of biochar into deeper topsoil depth could have a more favorable impact on soil nutrient dynamics in the crop’s root zone [50].
The finding of limited vertical depth stratification suggests that the PC biochar was physically stabilized in the top two soil depths and had minimal deeper SOC movement to 23 cm. This finding is consistent with others who reported minimal movement after biochar was applied to a temperate forest soil [51] and negligeable biochar movement below 0.3 m two years after biochar application to a sandy Oxisol [52]. In contrast to these reports, biochars do disintegrate in soils and can be translocated into the soil profile. For example, biochar can disintegrate and slake into sheets due to soil wet and dry cycles [53] can be translocated in soils through bioturbation or particulate transport [54,55] or by dissolution of soluble compounds from the biochar matrix structure [56]. Here, our results imply that the PC biochar remained near the 0–10 cm zone of physical incorporation. This doesn’t rule out, however, that an unknown soluble or slaked portion of the PC biochar moved into the Goldsboro soil profile. All the same, different analytical techniques using labeled biochar material or by collecting soluble leachate from the profile can be used to further examine soluble or slaked biochar movement phenomena.
There was a difference in the temporal trends for mean SOC contents measured at 0–5 and 5–10 cm in PC biochar treated plots (Table 4). There was no significant difference in SOC measured at 0–5 cm soil depth between Y1 to Y4. The annual mean had some changeability between these years, but the mean SOC variability was not significant. However, there was a significant mean SOC content decline measured at 5–10 cm depth between Y1 compared to annual means in Y2 to Y4.
Despite losing about 5000 kg ha−1 of SOC over the time course, PC biochar at the 0–5 cm soil depth was less persistent relative to results measured at the 5–10 cm soil depth. Corrected % change losses for PC biochar the 5–10 cm soil depth appears to stabilize with minimal gross losses. Mean SOC contents at the lowest two topsoil depth (10–15 and 15–23 cm) were not significantly different over the time course. The noted annual SOC soil depth effect, temporal trend, and their interaction in the PC biochar treated plots is consistent with the highly significant p value determined (<0.001 to 0.009; Table 5).

4.3. Poultry Litter Biochar Application and Stability

Adding 30,000 kg ha−1 of PL biochar delivered approximately 1/3 less C to the Goldsboro soil because of its lower %C content and higher ash content (Table 3). The addition of PL biochar increased SOC contents in the top two soil depths by a factor of only 1.5 (T0 vs. T1; Table 4), far below the SOC content increase delivered by PC biochar additions.
The vertical SOC stratification and temporal patterns were also evident in plots treated with PL biochar (Table 4). The annual SOC contents measured at the top 0–5 cm and 5–10 soil depth were significantly higher than that measured at the lower two topsoil depth. This condition is probably due to the mechanical mixing of the biochar in Y1 and also due to physical stabilization mechanisms of the PL biochar at the top two topsoil depth increments. The PL biochar morphology probably contributed to its physical stabilization since the material was about 0.5–2 mm diameter which limited physical movement through the sandy macro-pore structure. This was supported by the frequent observation of PL biochar material remaining at the immediate soil surface among the corn plants during this study.
While the solid portion of PL biochar was stable in the immediate topsoil depths, organic carbon solubilized from the PL biochar could have moved as dissolved organic carbon (DOC) through the soil profile [57,58]. Transport of DOC from biochar treated soil is influenced by variable parameters in biochars structure, bonding agents between aromatic sheets, and the soil hydrologic cycle [58,59]. Therefore, it would be beneficial to monitor DOC movement in future field biochar studies.
Over the 4-year study, SOC contents measured at the 0–5 cm soil depth of the PL biochar plots varied up/down with some significance about the annual mean measurements. However, it was at the 5–10 cm soil depth that significant SOC concentration declines occur in Y2 then again in Y4. In fact, by Y4, the mean SOC content at 5–10 cm soil depth is similar to that measured in the initial year of the study (Yo).
We estimated that −2050 and −4079 kg ha−1 of SOC was lost at the 0–5 and 5–10 cm soil depth, respectively, in the PL biochar treated plots. According to the literature, PL biochar with a higher O/C ratio (0.094; Table 1) should be less stable than the PC biochar (0.051; [15]). The SOC decline at the 0–5 and 5–10 cm soil depth suggests the opposite, in that, PL biochar was more stable in the Goldsboro soil than PC biochar. However, after correcting for SOC losses in the controls, PL biochar losses between the two topsoil depths were more closely matched (10.3 vs. 7.9%; Table 6).
At the two lower depths in the PL biochar treated plots, the annual mean SOC contents are similar implying no significant changes over the time course. The influence of soil depth, year, and their interaction are highly significant in the PL biochar treated plots which is consistent with the results presented in Table 5.

4.4. Comparing Biochar Stability

The SOC contents measured at the 0–5 and 5–10 cm soil depth for all treatments were compared between Y1 vs. Y4 (Table 6). This allowed for a computation of the mass SOC changes, a % relative SOC change and then a % SOC content change after correcting for SOC losses in controls. Mass SOC loses in the PC treated plots were higher than those measured in the PL treated plots. At both soil depth, almost 30% of the SOC mass changed in PC treated plots. After correction, PC biochar was not as stabile in the 0–5 cm soil depth because losses in SOC were 20%. PC biochar was more stable at the 5–10 cm soil depth. The relative %SOC change in the PL biochar treated plot was over 3-fold higher at the 5–10 cm soil depth. However, after correcting, the % SOC changes were near similar.
Comparing SOC contents between Y1 and Y4 revealed SOC content losses estimated to be 7.9 and 10.3 for PL biochar treated plots and 2.6 and 29% for PC biochar treated plots, respectively. The PL biochar has a high ash content and pH (54.1% and 9.1, respectively; Table 1), so it is possible that microbial degradation is reduced by the formation of organo-mineral layers [60]. These organo-mineral layers would form due to interaction between C, O and mineral elements. The higher pH value in the PL biochar would favor precipitation of Fe and Al oxides with organic structures on the biochar surface. Thus, microbes and enzyme breakdown of C compounds associated with the PL biochar would be slower. As the PL biochar ages in the sandy soil, the organo-mineral layer would enlarge and potentially coat the surface from further precipitation and redox reactions [61].
The SOC declines in the PC treated sandy soils may be due to physical degradation of the biochar material. Spokas et al. [53] reported that hardwood-based biochar disintegrated more readily in sandy soil than manure-based biochars. There are pores and fissures between the aromatic sheets of the PC structures which can be forced apart and fragment from soil wetting/drying cycles [53]. Microbial degradation of PC biochar probably also occurs, but at a reduced rate since the PC biochar has higher Fixed C content (85.7%) and a lower O/C molar ratio (0.051; Table 1). Both of these PC biochar characteristics contributes to a poor food source for soil microbes.
On the other hand, it could be argued that the PC biochar accelerated more SOC mineralization in the 0–5 cm soil depth than the PL biochar resulting in larger mass and corrected SOC declines. This finding suggests more positive priming from the PC biochar than PL biochar treated on native SOC contents in the Goldsboro topsoil. In contrast, the lower corrected %SOC change at 5–10 cm depth in the PC biochar treated soils suggest minimal positive priming since the SOC losses were about 1/10 relative to losses at the 0–5 cm depth.
We estimate that almost 90% of the PL biochar remained in the Goldsboro topsoil after 4-years of weathering under continuous corn production. About 80% of PC biochar remained in the 0–5 cm soil depth after the 4-year time course. This is corroborated by the PC biochar treated plots having much larger SOC mass losses and the SOC losses were more apparent in the 0–5 cm soil depth after correction.
This is a substantial finding because it suggests that 80 to 90% of the original PC- and PL-biochar was still accountable in the Goldsboro topsoil (0–5 and 5–10 cm deep) after 4-years of continuous corn production. Based on this persistence estimate, either PC- or PL-biochar can be used as a C sequestration agent. This finding is consistent with the meta-analysis review of biochar stability in the field [29].

Author Contributions

Conceptualization, J.M.N. and D.W.W., methodology, J.M.N. and D.W.W., formal analysis J.M.N.; investigation, J.M.N., D.W.W., G.C.S., T.F.D., W.T.M. and H.C.R., data curation, D.W.W.; writing—original draft preparation, J.M.N.; writing—review and editing, J.M.N. and D.W.W. All authors have read and agreed to the published version of the manuscript.

Funding

This research received no external funding.

Institutional Review Board Statement

Not applicable.

Informed Consent Statement

Not applicable.

Data Availability Statement

Data sharing is not applicable for this article.

Acknowledgments

Gratitude is expressed to the technical staff for their work and diligence with sample collection, field preparation, and analyses. This work was made possible through the United States Department of Agriculture-Agricultural Research Service (USDA-ARS) National Program 212 (Soil and Air) Project number 6082-12360-001-00D. It has been subject to peer review by USDA-ARS scientists and approved for journal submission. Approval does not signify that the contents of this paper reflect the views of the USDA-ARS nor does mention of a trade names or commercial products constitute endorsement or recommendation for their use. USDA is an equal opportunity provider and employer.

Conflicts of Interest

The authors declare no conflict of interests.

References

  1. Lal, R. Climate strategic soil management. Challenges 2014, 5, 43–74. [Google Scholar] [CrossRef] [Green Version]
  2. Sykes, A.J.; Macleod, M.; Eory, V.; Rees, R.M.; Payen, F.; Myrgiotis, V.; Williams, M.; Sohi, S.; Hillier, J.; Moran, D.; et al. Characterizing the biophysical, economic, and social impacts of soil carbon sequestration as a greenhouse gas removal technology. Glob. Chang. Biol. 2020, 26, 1085–1108. [Google Scholar] [CrossRef] [PubMed] [Green Version]
  3. Brassard, P.; Godbout, S.; Raghavan, V. Soil biochar amendment as a climate change mitigation tool: Key parameters and mechanisms involved. J. Environ. Manag. 2016, 181, 484–497. [Google Scholar] [CrossRef] [PubMed]
  4. Paustian, K.; Lehmann, J.; Ogle, S.; Reay, D.; Robertson, G.P.; Smith, P. Climate-smart soils. Nature 2016, 532, 49–57. [Google Scholar] [CrossRef] [Green Version]
  5. Amelung, W.; Bossio, D.; de Vries, W.; Kögel-Knabner, I.; Lehmann, J.; Amundson, R.; Bol, R.; Collins, C.; Lal, R.; Leifeld, J.; et al. Towards a global-scale climate mitigation strategy. Nat. Commun. 2020, 11, 5427. [Google Scholar] [CrossRef]
  6. Blanco-Canqui, H.; Laird, D.A.; Heaton, E.A.; Rathke, S.; Acharya, B.S. Soil carbon increased by twice the amount of biochar carbon applied after 6 years: Field evidence of negative priming. GCB Bioenergy 2020, 12, 240–251. [Google Scholar] [CrossRef]
  7. Han, L.; Sun, K.; Yang, Y.; Xia, X.; Li, F.; Yang, Z.; Xing, B. Biochar’s stability and effect on the content, composition and turnover of soil organic carbon. Geoderma 2020, 364, 114184. [Google Scholar] [CrossRef]
  8. Novak, J.M.; Busscher, W.J.; Laird, D.L.; Ahmedna, M.; Watts, D.W.; Niandou, M.A.S. Impact of biochar amendment on fertility of a southeastern coastal plain soil. Soil Sci. 2009, 174, 105–112. [Google Scholar] [CrossRef] [Green Version]
  9. Ding, Y.; Liu, Y.; Liu, S.; Li, Z.; Tan, X.; Huang, X.; Zeng, G.; Zhou, B. Biochar to improve soil fertility. A Review. Agron. Sustain. Dev. 2016, 36, 1–74. [Google Scholar] [CrossRef] [Green Version]
  10. Razzaghi, F.; Obour, P.B.; Arthur, E. Does biochar improve soil water retention? A systematic review and meta-analysis. Geoderma 2020, 361, 114055. [Google Scholar] [CrossRef]
  11. Spokas, K.A.; Cantrell, K.B.; Novak, J.M.; Archer, D.W.; Ippolito, J.A.; Collins, H.P.; Boateng, A.A.; Lima, I.M.; Lamb, M.C.; McAloon, A.J.; et al. Biochar: A synthesis of its agronomic impact beyond carbon sequestration. J. Environ. Qual. 2012, 41, 973–989. [Google Scholar] [CrossRef]
  12. Ippolito, J.A.; Liqiang, C.; Kammann, C.; Wrange-Mönnig, N.; Estavillo, J.M.; Fuertes-Mendizabal, T.; Cayuela, M.L.; Sigua, G.; Novak, J.; Spokas, K.; et al. Feedstock choice, pyrolysis temperature and type influence biochar characteristics: A comprehensive meta-analysis review. Biochar 2020, 2, 4. [Google Scholar] [CrossRef]
  13. Rasse, D.P.; Budai, A.; O’Toole, A.; Ma, X.; Rumpel, C.; Abiven, S. Persistence in soil of Miscanthus biochar in laboratory and field conditions. PLoS ONE 2017, 12, e0184383. [Google Scholar] [CrossRef]
  14. Woolf, D.; Lehmann, J.; Cowie, A.; Cayuela, M.L.; Whitman, T.; Sohi, S. Biochar for Climate Change Mitigation: Navigating from Science to Evidence-Based Policy. In Soil and Climate; Lal, R., Stewart, B.A., Eds.; CRC Press: New York, NY, USA, 2019; pp. 220–242. [Google Scholar]
  15. Spokas, K.A. Review of the stability of biochar in soils: Predictability of O:C molar ratios. Carbon Manag. 2010, 1, 289–303. [Google Scholar] [CrossRef] [Green Version]
  16. Antal, M.J.; Grønli, M. The art, science, and technology of charcoal production. Ind. Eng. Chem. Res. 2003, 42, 1619–1640. [Google Scholar] [CrossRef]
  17. Laird, D.A.; Brown, R.C.; Amonette, J.E.; Lehmann, J. Review of the pyrolysis platform for coproducing bio-oil and biochar. Biofuels, Bioprod. Biorefin. 2009, 3, 547–562. [Google Scholar] [CrossRef]
  18. Cantrell, K.B.; Hunt, P.G.; Uchimiya, M.; Novak, J.M.; Ro, K.S. Impact of pyrolysis temperature and manure source on physoiochemical characteristics of biochar. Bioresour. Tech. 2012, 107, 419–428. [Google Scholar] [CrossRef]
  19. Domingues, R.R.; Trugilho, P.F.; Silva, C.A.; De Melo, I.C.N.A.; Melo, L.C.A.; Magriotis, Z.M.; Sánchez-Monedero, M.A. Properties of biochar derived from wood and high-nutrient biomasses with the aim of agronomic and experimental benefits. PLoS ONE 2017, 12, e0176884. [Google Scholar] [CrossRef] [PubMed] [Green Version]
  20. Novak, J.M.; Busscher, W.J. Selection and use of designer biochars to improve characteristics of southeastern USA coastal plain degraded soils. In Advanced Biofuels and Bioproducts; Lee, J.L., Ed.; Springer: New York, NY, USA, 2012; pp. 69–96. [Google Scholar] [CrossRef]
  21. Keiluweit, M.; Nico, P.S.; Johnson, M.G.; Kleber, M. Dynamic molecular structure of plant biomass-derived black carbon (biochar). Environ. Sci. Technol. 2010, 44, 1247–1253. [Google Scholar] [CrossRef] [Green Version]
  22. Chia, C.H.; Downie, A.; Munroe, P. Characteristics of biochar: Physical and structural properties. In Biochar for Environmental Management, 2nd ed.; Lehmann, J., Joseph, S., Eds.; Earthscan, Routledge Publ.: New York, NY, USA, 2015; pp. 89–138. [Google Scholar]
  23. Sigua, G.C.; Novak, J.M.; Watts, D.W.; Cantrell, K.B.; Shumaker, P.D.; Szögo, A.A.; Johnson, M.G. Carbon mineralization in two Ultisols amended with different sources and particle sizes of pyrolyzed biochars. Chemosphere 2013, 103, 313–321. [Google Scholar] [CrossRef]
  24. Glaser, B.G.; Lehmann, J.; Zech, W. Ameliorating physical and chemical properties of highly weathered soils in the tropics with charcoal-a review. Bio. Fertil. Soils 2002, 35, 219–230. [Google Scholar] [CrossRef]
  25. Libra, J.A.; Ro, K.S.; Kammann, C.; Funke, A.; Berge, N.D.; Neubauer, Y.; Titirici, M.M.; Fühner, C.; Bens, O.; Kern, J.; et al. Hydrothermal carbonization of biomass residuals: A comparative review of the chemistry, processes and application of wet and dry pyrolysis. Biofuels 2011, 2, 89–124. [Google Scholar] [CrossRef] [Green Version]
  26. Joseph, S.D.; Camps-Arbestain, M.; Lin, Y.; Munroe, P.; Chia, C.H.; Hook, J.; van Zwieten, L.; Kimber, S.; Cowie, S.; Singh, B.P.; et al. An investigation into the reactions of biochar in soil. Aust. J. Soil Res. 2010, 48, 501–515. [Google Scholar] [CrossRef]
  27. Ducey, T.F.; Novak, J.M.; Johnson, M.G. Effects of biochar blends on microbial community composition in two coastal plain soils. Agriculture 2015, 5, 1060–1075. [Google Scholar] [CrossRef] [Green Version]
  28. Gascó, G.; Paz-Ferreiro, J.; Cely, P.; Plaza, C.; Méndez, A. Influence of pig manure and its biochar on soil CO2 emissions and soil enzymes. Ecol. Eng. 2016, 95, 19–24. [Google Scholar] [CrossRef]
  29. Lehmann, J.; Rilling, M.C.; Theis, J.; Masiello, C.A.; Hockaday, W.C.; Crowley, D. Biochar effects on soil biota-a review. Soil Biol. Biochem. 2011, 43, 1812–1836. [Google Scholar] [CrossRef]
  30. Lehmann, J.; Joseph, S. Biochar for Environmental Management: Science and Technology; Earthscan: London, UK, 2009. [Google Scholar]
  31. Demisie, W.; Liu, Z.; Zhang, M. Effect of biochar on carbon fractions and enzyme activity of red soil. Catena 2014, 121, 214–221. [Google Scholar] [CrossRef]
  32. Zhao, R.; Coles, N.; Wu, J. Carbon mineralization following additions of fresh and aged biochar to an infertile soil. Catena 2015, 125, 183–189. [Google Scholar] [CrossRef]
  33. Zimmerman, A.R.; Gao, B.; Ahn, M.-Y. Positive and negative carbon mineralization priming effects among a variety of biochar-amended soils. Soil Biol. Biochem. 2011, 43, 1169–1179. [Google Scholar] [CrossRef]
  34. Kuzyakov, Y.; Friedel, J.K.; Stahr, K. Review of mechanisms and quantification of priming effects. Soil Biol. Biochem. 2000, 32, 1485e1498. [Google Scholar] [CrossRef]
  35. Wang, J.; Xiong, Z.; Kuzyakova, Y. Biochar stability in soil: Meta-analysis of decomposition and priming effects. GCB Bioenergy 2015, 8, 512–523. [Google Scholar] [CrossRef] [Green Version]
  36. Gurwick, N.P.; Moore, L.A.; Kelly, C.; Elias, P. A Systematic Review of Biochar Research, with a Focus on Its Stability in situ and Its Promise as a Climate Mitigation Strategy. PLoS ONE 2013, 8, e75932. [Google Scholar] [CrossRef] [Green Version]
  37. Sagrilo, E.; Jeffery, S.; Hoffland, E.; Kuyper, T.W. Emission of CO2 from biochar-amended soils and implications for soil organic carbon. GCB Bioenergy 2014, 7, 1294–1304. [Google Scholar] [CrossRef] [Green Version]
  38. Daniels, R.B.; Buol, S.W.; Kleiss, H.J.; Ditzler, C.A. Soil Systems in North Carolina, Technical Bulletin 314; North Carolina State University: Raleigh, NC, USA, 1999. [Google Scholar]
  39. Gee, G.W.; Bauder, J.W. Chapter 15—Particle Size Analysis: Hydrometer Method. In Methods of Soil Analysis. Part 1-Physical and Mineralogical Methods; Book Series No. 5; American Society of Agronomy, Soil Science Society of Agronomy and Crop Science Society of America: Madison, WI, USA, 1984. [Google Scholar]
  40. Novak, J.M.; Sigua, G.C.; Ducey, T.F.; Watts, D.W.; Stone, K.C. Designer biochars impact on corn grain yields, biomass production, and fertility properties of a highly-weathered Ultisol. Environments 2019, 6, 64. [Google Scholar] [CrossRef] [Green Version]
  41. Ippolito, J.A.; Berry, C.M.; Strawn, D.G.; Novak, J.M.; Levine, J.; Harley, A. Biochar reduce mine land soil bioavailable metals. J. Environ. Qual. 2017, 46, 411–419. [Google Scholar] [CrossRef] [PubMed]
  42. ASTM (American Society of Testing and Materials). Petroleum Products, Lubricants, and Fossil Fuels: Gaseous Fuels, Coal, and Coke; ASTM International Conshohocken: Conshohocken, PA, USA, 2016. [Google Scholar]
  43. Grossmann, R.B.; Reinsch, T.G. Bulk density and linear extensibility: Core method. In Methods of Soil Analysis: Part 4 Physical Methods; Dane, J.H., Topp, G.C., Eds.; SSSA Book Series 5.4; Soil Science Society of America: Madison, WI, USA, 2002; pp. 208–228. [Google Scholar]
  44. Novak, J.M.; Busscher, W.J.; Watts, D.W.; Laird, D.L.; Ahmedna, M.A.; Niandou, M.A.S. Short-term CO2 mineralization after additions of biochar and switchgrass to a Typic Kandiudult. Geoderma 2010, 154, 281–288. [Google Scholar] [CrossRef]
  45. Busscher, W.J.; Novak, J.M.; Watts, D.W.; Laird, D.L.; Niandou, M.A.S.; Ahmedna, M. Influence of pecan biochar on physical properties of a Norfolk loamy sand. Soil Sci. 2010, 175, 10–14. [Google Scholar] [CrossRef] [Green Version]
  46. Novak, J.M.; Frederick, J.R.; Watts, D.W.; Ducey, T.F.; Karlen, D.L. Corn stover removal responses on soil test P and K levels in Coastal Plain Ultisols. Sustainability 2021, 13, 4401. [Google Scholar] [CrossRef]
  47. Hunt, P.G.; Bauer, P.J.; Matheny, T.A.; Quisenberry, V.L. Changes in carbon content of a Norfolk loamy sand after 14 years of conservation or conventional tillage. J. Soil Water Conserv. 1996, 51, 255–258. [Google Scholar]
  48. Novak, J.M.; Bauer, P.J.; Hunt, P.G. Carbon dynamics under long-term conservation and disk tillage management in a Norfolk loamy sand. Soil Sci. Soc. Am. J. 2007, 71, 453–456. [Google Scholar] [CrossRef] [Green Version]
  49. Novak, J.M.; Watts, D.W.; Bauer, P.J.; Karlen, D.L.; Hunt, P.G.; Mishra, U. Loamy sand soil approaches organic carbon saturation after 37 years of conservation tillage. Agron. J. 2020, 112, 3152–3162. [Google Scholar] [CrossRef] [Green Version]
  50. Guo, M. The 3R principals for applying biochar to improve soil health. Soil Syst. 2020, 4, 9. [Google Scholar] [CrossRef] [Green Version]
  51. Singh, N.; Abiven, S.; Maestrini, B.; Torn, M.S.; Schmidt, M.W. Transformation and stabilization of pyrogenic organic matter in a temperate forest field experiment. Glob. Chang. Biol. 2014, 20, 1629–1642. [Google Scholar] [CrossRef]
  52. Major, J.; Lehmann, J.; Rondon, M.; Goodale, C. Fate of soil-applied black carbon: Downward migration, leaching and soil respiration. Glob. Chang. Biol. 2010, 16, 1366–1379. [Google Scholar] [CrossRef]
  53. Spokas, K.A.; Novak, J.M.; Masiello, C.A.; Johnson, M.G.; Colosky, E.C.; Ippolito, J.A.; Trigo, C. Physical disintegration of biochar: An overlooked process. Environ. Sci. Technol. Lett. 2014, 1, 326–332. [Google Scholar] [CrossRef]
  54. Skjernstad, J.O.; Taylor, J.A.; Smernik, R.J. Estimation of charcoal (char) in soils. Comm. Soil Sci. Plant Anal. 1999, 30, 2283–2298. [Google Scholar] [CrossRef]
  55. Ameloot, N.; Graber, E.R.; Verherijen, F.G.; De Neve, S. Interaction between biochar stability and soil organisms: Review and research needs. Eur. J. Soil Sci. 2013, 64, 379–390. [Google Scholar] [CrossRef]
  56. Gaskin, J.; Steiner, C.; Harris, K.; Das, K.C.; Bibens, B. Effect of low-temperature pyrolysis conditions on biochar for agricultural use. Trans. ASABE 2008, 51, 2061–2069. [Google Scholar] [CrossRef]
  57. Smebye, A.; Alling, V.; Vogt, R.D.; Gadmar, T.C.; Mulder, J.; Cornelissen, G.; Hale, S.E. Biochar amendment to soil changes, dissolved organic matter content and composition. Chemosphere 2016, 142, 100–105. [Google Scholar] [CrossRef] [PubMed]
  58. Liu, C.; Wang, H.; Li, P.; Xian, Q.; Tang, X. Biochars impact on dissolved organic matter (DOM) export from cropland soil during natural rainfalls. Sci. Total Environ. 2019, 650, 1988–1995. [Google Scholar] [CrossRef] [PubMed]
  59. Jaffé, R.; Ding, Y.; Niggemann, J.; Vahatalo, A.V.; Stubbins, A.; Spencer, R.G.; Campbell, J.; Dittmar, T. Global charcoal mobilization from soils via dissolution and riverine transport to the oceans. Science 2013, 340, 345–347. [Google Scholar] [CrossRef] [PubMed] [Green Version]
  60. Joseph, S.; Kammann, C.I.; Shepard, J.G.; Conte, P.; Schmidt, H.P.; Hagemann, N.; Rich, A.N.; Marjo, C.E.; Allen, J.; Munroe, P.; et al. Microstructural and associated chemical changes during the composting of a high temperature biochar: Mechanisms for nitrate, phosphate and other nutrient retention and release. Sci. Total Environ. 2018, 618, 1210–1223. [Google Scholar] [CrossRef] [PubMed] [Green Version]
  61. Joseph, S.; Cowie, A.L.; van Zwieten, L.; Bolan, N.; Budai, A.; Buss, W.; Cayuela, M.L.; Graber, E.R.; Ippolito, J.A.; Kuzyakov, Y.; et al. How biochar works, and when it doesn’t: A review of mechanisms controlling soil and plant responses to biochar. CGB Bioenergy 2021, 1–34. [Google Scholar] [CrossRef]
Figure 1. (a) Physical mixing of biochar using disk; (b) soil core into top 0–10 cm soil depth.
Energies 14 06157 g001
Table 1. Biochar characteristics (results previously published [40]).
CharacteristicPoultry Litter BiocharPine Chip Biochar
%C33.288.5
%H2.231.64
%N4.210.49
%O3.65.91
%Ash54.13.46
%Fixed C16.585.7
O/C molar ratio0.0940.051
pH9.17.8
Table 2. Dates of plot creation, biochar application, soil incorporation, soil core collection and bulk density (BD) measurements during years (Y) of field project.
DateEventYear
11 December 2015Plot Boundaries EstablishedY0
4 to 8 January 2016Soil Cores Collected and BD MeasuredY0
1 to 2 February 2016Biochars AppliedY0
3 February 2016Plots Disked to Incorporate BiocharY0
12 to 18 January 2017Soil Cores Collected and BD MeasuredY1
15 January to 16 February 2018Soil Cores Collected and BD MeasuredY2
26 February to 18 March 2019Soil Cores Collected and BD MeasuredY3
30 March to 8 April 2020Soil Cores Collected and BD MeasuredY4
Table 3. Estimates of carbon (C) delivered by each treatment to the Goldsboro sandy loam soil.
TreatmentBiochar C ContentBiochar AppliedTotal C Applied as Biochar
%-------------------------- kg ha−1 ----------------------
Control (0 Biochar)000
Poultry Litter Biochar33.230,0009960
Pine Chip Biochar88.530,00026,500
Table 4. Annual mean soil organic carbon contents (kg ha−1) by depth in Controls (0 biochar), in Poultry litter and Pine chip biochar treated plots (n = 4, standard deviations in parentheses, 2016 results represent background contents and not used in statistical comparison).
TreatmentsDepth (cm)Y0 (2016)Y1 (2017) 1Y2 (2018)Y3 (2019)Y4 (2020)
Control (0 Biochar)0–57584 (1655) a, A8560 (743) a, A8254 (1543) a, A7681 (520) a, A7838 (680) a, A
5–108062(1105) a, A8307 (826) a, A6751 (824) ab, B6845 (468) ab, A5998 (1078) b, B
10–154293 (499) a, B5123 (807) a, B4068 (787) a, CD4350 (420) a, B4324 (459) a, CD
15–234589 (1173) a, B4105 (353) a, B4217 (755) a, D4294 (789) a, B3948 (367) a, D
Poultry Litter Biochar0–57368 (525) a, A10,968 (952) b, A9794 (716) bd, A10,810 (1077) b, A8918 (562) cd, A
5–107754 (580) a, A11,429 (2052) b, A7315 (794) a, B9209 (622) c, B7350 (780) a, B
10–154608 (740) a, B5873 (1204) a, B3921 (1007) a, CD4391 (636) a, CD4136 (615) a, CD
15–234409 (617) a, B4660 (354) a, B4619 (542) a, D4945 (824) a, D4262 (815) a, D
Pine Chip Biochar0–57149 (987) a, A18,279 (4533) b, A12,491 (1760) b, A15,784 (4313) b, A13,066 (2760) b, A
5–107813 (1782) a, A16,246 (3118) b, A9649 (3355) c, B13,149 (3521) c, A11,309 (2473) c, A
10–153762 (1203) a, A8920 (5777) a, C4406 (833) a, C5252 (525) a, B4668 (657) a, B
15–235383 (1026) a, A4370 (484) a, D4458 (615) a, C4660 (608) a, B4462 (1092) a, B
1 Lower-case letter indicates significant differences among means values between years, while capital letter indicates significant differences among mean values between soil depth using a two-way ANOVA with a p < 0.05 level of significance.
Table 5. Level of statistical significance for each source of variation (i.e., depth, year, and depth * year) for annual mean soil organic carbon content.
Source of VariationTreatments
Control (0 Biochar)Poultry Litter BiocharPine Chip Biochar
---------------------------------------- p -----------------------------------------
Depth<0.001<0.001<0.001
Year (Y)0.021<0.001<0.001
Depth * Y0.229<0.0010.009
Table 6. Relative changes in mean soil organic carbon (SOC) contents measured in Controls and in plots treated with Poultry litter and Pine chip biochar (means from n = 4, standard deviations in parentheses, nd = not determined, ∆ = change).
SOC (kg ha−1)% ∆
TreatmentDepth (cm)Y1 (2017) 1Y4 (2020)Mass ∆Relative 2Corrected 3
Control (0 Biochar)0–58560 (743) a7838 (680) a−7218.4nd
5–108307 (826) a5998 (1078) b−231027.8nd
Poultry Litter Biochar0–510,968 (952) a8918 (562) b−205018.710.3
5–1011,429 (2052) a7350 (780) b−407935.77.9
Pine Chip Biochar0–518,279 (4533) a13,066 (2760) a−521328.620.2
5–1016,246 (3118) a11,309 (2473) b−493730.42.6
1 Means followed by a lower-case letter are significantly different using a two-sample t-test at a p < 0.05 level of significance. 2 Relative % ∆ calculated by (1-SOC2020/SOC2017 *(100)). 3 Corrected % ∆ calculated by subtraction between treatments and control.
Publisher’s Note: MDPI stays neutral with regard to jurisdictional claims in published maps and institutional affiliations.

