1. Introduction
Biomass energy is the oldest energy source for humans. Bioenergy is a key factor in a low-carbon future, and its demand is projected to increase significantly, accounting for 17% of global energy by 2060 [
1]. At this rate, the energy from biomass will contribute to an increasing carbon-saving of 20% by the year 2060, cutting “greenhouse” releases comprehensively. The utilization of biomass, such as rice husks, presents a huge potential for increasing the quota of bioenergy in the power sector [
2]. According to the Food and Agriculture Organization (FAO) statistics, estimated global rice husk production is approximately 156.4 million tons. This is distributed among Africa (6.6 million tons), the Americas (7.8 million tons), Asia (141.0 million tons), and Europe (4.0 million tons) [
3]. The increasing world population increases the demand for more food and, consequently, has a greater environmental impact. Therefore, it is of great importance to explore the possibility of introducing a metal honeycomb catalyst in biomass combustion systems to reduce future environmental impacts and climate change effects. Pyrolysis of rice husk (separating the bio-oil from the ash) combustion has been performed to minimize particulate matter (PM) emissions [
4]. However, the particulate matter and gaseous emissions such as carbon monoxide (CO), nitrogenous oxide (NOx), and sulfur dioxide (SOx), from these systems are significant and there is less infrastructural investment compared to direct combustion. In addition, rice husk ash has been used in cement-based materials for environmental benefits and performance improvement [
4,
5,
6]. This is an additional advantage of direct combustion. The production of solid biofuels, such as rice husk briquettes, can substitute wood fuel utilization. Rice husk briquettes are advantageous in terms of handling, storage, transportation, and calorific value compared to direct rice husks.
Biomass incineration is the easiest technique for producing biomass energy, either through direct combustion or as co-combustion with other fuels such as poultry litter and natural gas co-combustion to generate electricity using a sterling engine [
7] and hot water using shells and a tube heat exchanger [
4]. However, it has been plagued with the release of toxic pollutants, such as PM, CO, NOx, and SOx. PM forms a key part of air pollution and is responsible for many deaths globally. Although biomass combustion is characterized by toxic emissions, it is still used in many developing economies and small industries. This has led researchers to attempt to find ways to reduce the emissions. Studies have been conducted to investigate the best-case scenarios for low PM emissions considering the combustion temperature, secondary air-/primary air-to-fuel ratio, excess air ratio, primary and secondary measures [
8,
9], nature of the biomass feedstock, and particle morphology [
10].
However, the desired level of emission reduction is yet to be achieved. Therefore, further studies are required to control these emissions [
11]. The nitrogen, sulfur, and carbon contents of biomass fuels are converted into gaseous emissions as flue gases during reduction [
12]. Studies have investigated ways to reduce these gaseous emissions using fuel particle size and density [
13]. There is a great concern for “climate change” moderation and the likely risk of energy shortages have increased the acceptance of biomass utilization [
14]. However, combustion emissions remain high and require further study. Air-quality management and the conservation of sources of biomass utilized primarily for incineration necessitates comprehensive and systematic examination, with a focus on practical applications. For sustainability enhancement, future emission decreasing procedures, with an emphasis on airborne contaminants such as carbon monoxide (CO), methane, oxides of nitrogen (NO
x), polycyclic aromatic compounds, and particulate matter, must be studied and verified in practical environments. These emissions can be considerably reduced using catalyst exhaust systems. Exhaust flue treatment to prevent pollutant emissions is essential in greenhouses and depends on the type and quality of the chosen methods and biomass source. The environmental advantage of biomass utilization compared to fossil fuels, can only be competitive and preferred because of its low emissions. Biomass, such as rice husk, has been used as an auxiliary to study the combustion behavior of sewage sludge biomass [
15].
The catalytic combustion of biomass involves the use of a catalyst before or during combustion. The catalyst effect during the heterogeneous combustion of the air–fuel mixture is based on the contact of the fuel particles with the superficial oxygen of the catalyst and the serial regeneration of the catalyst surface by oxygen from the gas phase [
16]. Depending on the characteristics of the catalyst, it is possible to achieve complete oxidation of many fuels, even at 250–300 °C. The use of a catalyst significantly decreases the combustion temperature of organics. The ability of a chemical catalyst to reduce the temperature required for the complete combustion of biomass, such as rice husk, is important for amorphous silica production with a porous structure, high surface area, increased densification, and reduced Si-O-Si band angles. This can ease the needs for thermo-chemical balance, boiler construction-materials, and component wear, and can reduce heat loss from the boiler-wall and increase the explosion-safety for heat-producing installations.
The merit of catalysts compared to other optional secondary equipment such as filters or electrostatic precipitators is their ability to effectively reduce gaseous and PM emissions [
17,
18,
19]. Moreover, they function during the non-efficient phases, such as the ignition, combustion, and “burn-out phases”. They are also used for key operational situations due to user behavior. Generally, they do not require electricity for their operation, although a specific level of temperature is essential for the catalytic process. Furthermore, oxidizing catalysts work efficiently when they operate at about 300–450 °C, specifically for converting the emissions of gaseous organic-compounds for wood combustion [
20]. Catalytic converters in the automobile industry have been used for decades to reduce exhaust emissions [
21]. Metallic honeycomb catalysts are primarily used because of their outstanding low pressure drop at high mass flow and high cell density compared to ceramic foam or structures [
22]. Metallic honeycomb catalysts are produced through corrugation, mostly containing iron as a support material and platinum, chromium, aluminum, and rare metals [
23]. Honeycomb catalysts are used for the catalytic combustion and CO oxidation. All studies on catalysts have been conducted using simulation models and exhaust experiments from automobiles. Thus, very few monolithic catalyst studies have been applied to the agricultural sector, especially the catalyst exhaust system for flue purification from the biomass industry. The importance of exhaust gas purification and particulate removal from biomass power plants has become critical for evaluating the performance and environmental sustainability of biomass combustion. Biomass is used to heatup greenhouse farms and produce the hot air required for drying agricultural crops such as paddy rice. Research has been conducted to develop a platinum-based catalyst with iron oxide as a co-catalyst for methane combustion in the automobile industry to control air pollution [
24].
Investigating the performance and suitability of such catalysts is important for the biomass combustion industry. The conservation of air quality and sustainability of agricultural production and processing are crucial as technology advances. Previous research on the catalytic combustion of rice husk specifically, has been on the use of chemicals for rice husk fuel pretreatment to achieve energy efficiency [
25], such as mineral acid pretreatment for the removal of impurities [
26,
27]. Studies have been conducted on specific gas emissions, such as NOx reduction through oxy biomass combustion technology [
28]. However, studies on metallic honeycomb catalysts have been used to reduce emissions from vehicles in the automobile industry [
21,
24] and very few studies have investigated the performance of a metallic honeycomb catalyst on PM, CO, and SO
2 emission reduction from biomass combustion systems such as rice husks. It is important to evaluate the environmental sustainability of a biomass combustion system integrated with a metal honeycomb catalyst. Abah et al. (2020) reported low NOx emissions from rice husk combustion (2.84 ppmv at 600 °C), but high PM (30.2 mg/g) and CO (72.66 ppmv) emissions. PM
2.5, SO
2, and CO were the most potent emissions from rice husk combustion [
13,
29].
The catalytic characteristics of platinum has been one of the most interesting topics of research [
30]. Because the oxidic species have low attraction for CO adsorption and the enhancement of the conversion requires high temperatures, platinum was marked as the active surface for CO oxidation [
31,
32,
33]. The platinum–iron catalyst supported by y-alumina is designed to convert CO; therefore, it does not increase the emission of other harmful substances. However, emission control by catalysts has been well studied. Most of these studies have focused on modeling and theoretical simulations. Practical use studies have focused on exhaust from the automobile industry during the combustion of fossil fuels. However, pollution from biomass combustion poses a significant risk to public health, especially in developing countries. Therefore, the practical adaptation and application of monolithic catalysts in the bioenergy industry is imperative. There have been no attempts to investigate the application of this catalyst in a rice husk combustion system.
Previous catalytic investigations have proved that CO exposure to surfaces coated with oxygen (O
2) causes CO
2 to be rapidly formed. On the other hand, O
2 (oxygen) exposed to CO-coated surfaces does not lead to the rapid formation of CO
2 in the Eley–Rideal and Langmuir–Hinshelwood models [
34]. Dubien et al. (1998) reported that O
2 coverage does not hinder CO adsorption; however, O
2 adsorption is hindered by adsorbed CO [
35]. Other studies employed “surface exclusion models” to investigate CO adsorption on surfaces coated with oxygen. In these studies, oxygen coverage was restricted to below a monolayer, though CO could be adsorbed at the “unfilled-sites”. Nievergeld (1998) described that CO and O
2 “coverage can become unity” [
36]. In this research, the Eley–Rideal mechanism was proposed to examine the detected phenomena and referred to the findings of Zhou et al., 1986 [
37], who suggested that CO can “chemisorb on sites” previously coated with O
2 [
38].
Therefore, the purpose of the present study was to evaluate the performance of an adapted platinum–iron–alumina (Pt–Fe–alumina) monolith catalyst on PM2.5, CO, and SO2 reduction from the exhaust system of a rice husk combustion system. The specific objective was to compare emissions from the catalyzed and non-catalyzed combustions. The research hypothesis was to test the performance of the platinum–iron–alumina honeycomb catalyst on exhaust flue gas from rice husk and rice husk briquette combustion, specifically for lower PM2.5 emissions and 100% CO and SO2 conversion. The novelty of the present study is that it applies an adapted catalyst integrated into the exhaust system of a biomass combustion system for a practical flue gas directly from rice husk combustion.
3. Results and Discussion
3.1. Ultimate Analysis of the Samples
The ultimate analysis of JPN and RB samples are reported in
Table 2. The calculated volume measurements for RB and JPN are shown in
Table 3. The amount of matter out of which char is produced during incineration is referred to as the carbon content. High carbon content biofuels are considered to require an extended char combustion phase. JPN’s carbon content was 37.53 wt.%db., and that of RB was 39.37 wt.%db. Therefore, the RB fuel was anticipated to require extended char incineration. This can lead to more emitted emissions. Therefore, the workload of the catalyst inside the exhaust would increase. Moreover, JPN had a higher t-plot and Langmuir surface area (
Table 4).
3.2. TGA of the Samples
The head start and end temperatures of the samples were assessed applying the curve from the TGA assessment. The preliminary combustion stage for biomass such as rice husk is moisture removal (drying). The moisture content of the samples was lost at about 150 °C. This is in agreement with the results of a previous study [
26]. The next incineration phase is the decomposition of volatiles. The beginning temperature for volatiles decomposition was the temperature where volatile combustion started. The volatiles’ combustion commenced at 150 °C. The final decomposition temperature refers to the temperature before carbonization. The volatiles combustion terminal temperature for the fuel was 388.4 °C and 376.3 °C for RB and JPN fuels, in that order. Dynamic thermal analyses (TG and DTG) data were generated for the RB and JPN fuels. The rate of the decomposition of volatiles and total TG loss was considerably different. RB and JPN had a two-stage degradation. RB samples had a higher TG loss of 5.4% at 151.2 °C than JPN (5.0%). This loss occurred principally because of moisture removal. Therefore, the RB volatile decomposition rate occurred slowly compared to JPN. Partial decomposition of volatiles leads to a higher emission of particulates. The TG curves for the two fuels (
Figure 3) underwent a slow mass loss at increasing temperatures. JPN fuel had better volatile decomposition (51.1%) compared to RB fuel (48.8%), indicating that JPN experienced efficient thermal degradation compared to RB. Hence, JPN fuel had a greater TG loss of 63.6% compared to that of RB fuel (61.2%). The density of JPN fuel was lower, and the drying process began before (54.1 °C) that of RB fuel (70.0 °C). Consequently, the total drying and combustion of JPN fuel was better.
3.3. Mechanism of the Metal Honeycomb Catalyst Surface Oxidation Reaction and Flue Combustion from the Arrhenius Collision Theory Perspective
The collision theory states that the chemical reaction rate is proportional to the number of collisions between the reactant particles/molecules. The increase in the frequency of collisions of the reactant particles results in a faster reaction rate. Temperature is a key factor affecting the reaction rate, as given by the Arrhenius theory in Equation (3).
Figure 4 shows the important exhaust parameters for the heat-treated catalyst (hot HC) and non-heat-treated catalyst (cold HC) combustion of rice husks. The flue gas velocity, stack temperature, and percentage oxygen availability of the hot catalyst were significantly higher than those of the non-heat-treated catalyst combustion. Therefore, the oxidative reaction on the surfaces of the heat-treated catalyst proceeded faster, resulting in more CO conversion into CO
2. The higher flue temperature indicated that the PM was thermally oxidized as it encountered the hot catalyst surface.
As seen in
Figure 4, the flue temperature varied significantly, and the combustor had a constant air intake of 1.5 m/s for both the preheated and non-preheated catalysts. Therefore, the oxygen molecules from the heat-treated catalyst combustion moved faster and readily collided with carbon monoxide and SO
2 gas on the surface of the catalyst, resulting in the conversion of CO to CO
2 and the chemisorbed SO
22−. The additional heat helped activate the active sites on the surface of the catalyst and aided the flue gas to overcome the energy barrier for the oxidation reaction. At lower temperatures, the individual particles could barely overcome the energy barrier; however, at higher temperatures, the particles easily overcame the energy barrier to collide more frequently. In addition, as shown in
Figure 4, the exhaust temperature of the heat-treated catalyst was significantly higher than that of the non-heat-treated catalyst. Therefore, the potential flue particle emissions (PM
2.5) were further combusted, reducing their volumes just before leaving the exhaust. From the Arrhenius equation, the activation energy represents the sensitivity of the oxidation to temperature changes. Therefore, the oxidation rates with large activation energies progress rapidly with additional temperature. The SO
2 conversion proceeds slowly compared to the CO conversion owing to competition for the absorbed oxygen on the catalyst surface. SO
2 gained electrons from oxygen to become chemisorbed (SO
22−). As illustrated in
Figure 5, the PM (C
xH
y) underwent further combustion as they diffused through the heated catalyst surface, forming CO
2.
Figure 5 and
Table 5 illustrate the platinum–iron alumina (Pt–Fe) honeycomb catalyst flue oxidation, surface reactions, and the effect of temperature on the emission conversion on the catalyst surface. As predicted, the heat-treated catalyst combustion emitted lower amounts of gaseous and PM
2.5 emissions. This was because the additional heat supplied to the catalyst energized the individual molecules/particles, causing them to move faster and react with the absorbed oxygen molecules on the activated active sites of the catalyst to form new products. Carbon monoxide reacts with chemisorbed oxygen to form CO
2. The catalyst chemisorbed CO on its active sites, which at high temperatures enhanced CO oxidation to CO
2. However, chemisorbed CO inhibits CO oxidation at low temperatures. At low catalyst temperatures, almost the entire surface of the catalyst is covered by CO, and oxidation occurs between the molecular oxygen physically absorbed on top of an absorbed CO layer.
As the catalyst temperature increases, CO oxidation proceeds through the reaction between absorbed oxygen atoms and gas phase CO, according to the Eley–Rideal reaction [
39]. As CO oxidation proceeds, active sites initially occupied by chemisorbed CO become available for oxygen and SO
2 adsorption. Therefore, the CO conversion rate increases because of the improved balance of adsorbed CO and oxygen, considering the stoichiometry of the surface reaction.
3.4. Carbon Monoxide (CO) and Sulfur Dioxide (SO2) Concentration Analysis from the Combustion of JPN Samples
Catalytic oxidation is dependent on the interaction between the active sites and reactants. The reactants express themselves through several chemisorption/desorption reactions.
Figure 6 shows the effect of the catalyst temperature on CO and SO
2 concentrations from the combustion of JPN samples. As shown in
Figure 4 and
Figure 5, when the temperature of the catalyst was low, the activation of the active sites of the catalyst was also low. As the low-temperature flue approaches the surface of the low-temperature catalyst, less CO is adsorbed, with no associative desorption of molecularly absorbed oxygen, leading to a low oxidation reaction. Salomons et al., 2006 [
40] reported that significant associative desorption of oxygen was detected at 426.85 °C. The adsorbed oxygen can exist as chemisorbed oxygen and oxides. One of the surface reaction pathways is the combination of adsorbed oxygen atoms and molecularly adsorbed CO. Therefore, the ability of the catalyst to significantly convert CO to CO
2 is greatly limited. Hence, CO emissions were high due to the limited oxidation caused by the reduced adsorption of CO and the low associative desorption of oxygen.
The temperature of the (non-detachable) catalyst at the base of the exhaust pipe was slightly higher than that of the detachable catalyst causing the temperature of the flue to drop further after contact with the detachable catalyst. This results in a poor flue particle (PM) combustion phase. At temperatures below 260 °C, the activity of the catalyst is reduced [
41], indicating low performance. However, as the temperature of the detachable catalyst increases, it creates a large temperature difference between the two catalysts in a reverse order and CO adsorption increases. Similarly, oxygen desorption increased and the inhibitory effect of CO on its oxidation decreased. Consequently, CO conversion and SO
2 chemisorption were enhanced. Thus, more CO can be adsorbed, and the combustion of flue particles is optimized. In addition, the increased catalyst temperature led to an increase in the average kinetic energy of the constituent particles, thereby increasing the collision rate of the particles and the readiness to form new products.
At a constant velocity and pressure, the CO conversion rate of the catalyst increased as the preheated temperature of the catalyst increased until it reached its optimum temperature of 427.4 °C. The high catalyst temperature increases the flue combustion intensity and increases the chances of CO on the surface of the catalyst to react with oxygen and be oxidized. Beyond this point, a further increase in the catalyst temperature resulted in increased CO emission because of CO agglomeration and loss of balance between oxygen desorption and CO and SO2 adsorption. The balance between the CO level and adsorbed oxygen molecules is dependent on temperature and excess air. When excess air is constant, as was the case in the present experiment, the temperature increases beyond the equilibrium point lead to a higher CO concentration owing to its inhibition effects due to the overcrowded active sites of the catalyst. As the CO generated by the rapid combustion of the rice husk in the combustion chamber approaches the preheated catalyst, it undergoes slow oxidization to form CO2. A high combustion temperature consumes more oxygen, and, because CO correlates with the percentage of oxygen in the exhaust gas, low excess oxygen results in increased CO formation.
The small error bars (% error bars) indicate high reliability and low variability. For the catalytic temperature effect on SO2 concentration, the catalyst temperature did not significantly affect the SO2 concentration, similarly to that of CO. The catalyst material consisted of a fraction of platinum and iron oxide as co-catalysts. Platinum-based catalysts readily react with CO to form CO2. Therefore, the SO2 concentration was relatively steady, even at different catalyst temperatures. The lowest SO2 concentration (78 mg/L) was obtained at a catalyst temperature of 427.4 °C. A possible explanation is that SO2 gained electrons from oxygen to become chemisorbed SO22− on the catalyst. Oxygen-assisted combustion, which generally improves exhaust oxidation, is limited at higher furnace combustion temperatures and constant airflow. Therefore, the exhaust combustion efficiency decreased.
The optimum catalyst temperature for the lowest SO2 concentration was 427.4 °C. The order in which CO and O2 adsorption is performed is important. If CO is adsorbed first and covers more than one-third of the surface, subsequent O2 adsorption will be blocked. Therefore, at lower CO coverages, dissociative O2 adsorption occurs. However, these two groups formed distinct domains on the catalyst surface. Oxidation can then occur at the boundaries between the domains at a relatively low rate. However, in a mixed domain, adsorbed CO and O2 come into immediate contact with the oxygen atoms at twice the surface concentration, possibly in the absence of CO. Therefore, stoichiometry is required for the oxidation reaction.
Figure 7 compares the CO and SO
2 concentrations from the catalytic and non-catalytic combustion of JPN samples. Catalytic combustion significantly decreased the CO and SO
2 concentrations compared to non-catalytic combustion. During catalytic combustion, oxygen and unburnt organic substances are adsorbed on the catalyst, activating the oxidative decomposition reaction. The adsorption of CO on an oxygen-covered surface triggers an oxidation reaction. In addition, the increased catalyst temperature eases the burn-out process of particulates and the full conversion of CO to CO
2. The CO on the metal surface readily reacts with oxygen at the metal-support boundary [
42,
43]. However, the catalyst used in the present study has a high oxygen kinetic order because CO and O
2 are competitively adsorbed at the platinum–iron oxide boundary [
24]. The catalytic effect is most felt during the initial combustion phase, in which the temperature of combustion is low and characterized by high CO emissions. The catalytic effect can be applied in the design and construction of biomass boiler systems to decrease emissions during the boiler start-up and initial combustion phases.
3.5. Carbon Monoxide (CO) and Sulfur Dioxide (SO2) Concentration Analysis from the Combustion of RB Samples
From the TGA analysis and particle size distribution, RBs are high-density fuels that require a longer combustion duration than JPN samples. RB combustion is dominated by the smoldering combustion phase and generally emits more PM and less gaseous emissions [
13]. The reverse is the case for JPN combustion. Therefore, the catalytic combustion of RB samples was expected to significantly reduce PM and gaseous emissions.
Figure 8 presents the heat treatment effects of the catalyst on CO and SO
2 concentrations from the RB samples. A low catalyst temperature resulted in almost zero CO concentration at a combustion temperature of 600 °C but a moderate SO
2 concentration. SO
2 concentration decreased as the catalyst temperature increased with the combustion temperature. A further increase in the catalyst temperature increased CO emission because the surface of the catalyst was already covered with adsorbed CO, and its exposure to gas phase oxygen did not result in the formation of CO
2. The easy possibility of the molecules of the CO to alter their location indicates that the activation energy for the surface transfer in the “chemisorbed” phase is low, and that CO is an extremely mobile gas under catalytic situations. Oxygen adsorption is dissociative, and its atoms are less mobile on the surface of the catalyst than molecules of CO. As the temperature of the reaction reached its optimum value, the SO
2 conversion rapidly increased to 100%. This is an important result, as previous studies have not obtained 100% conversion [
15].
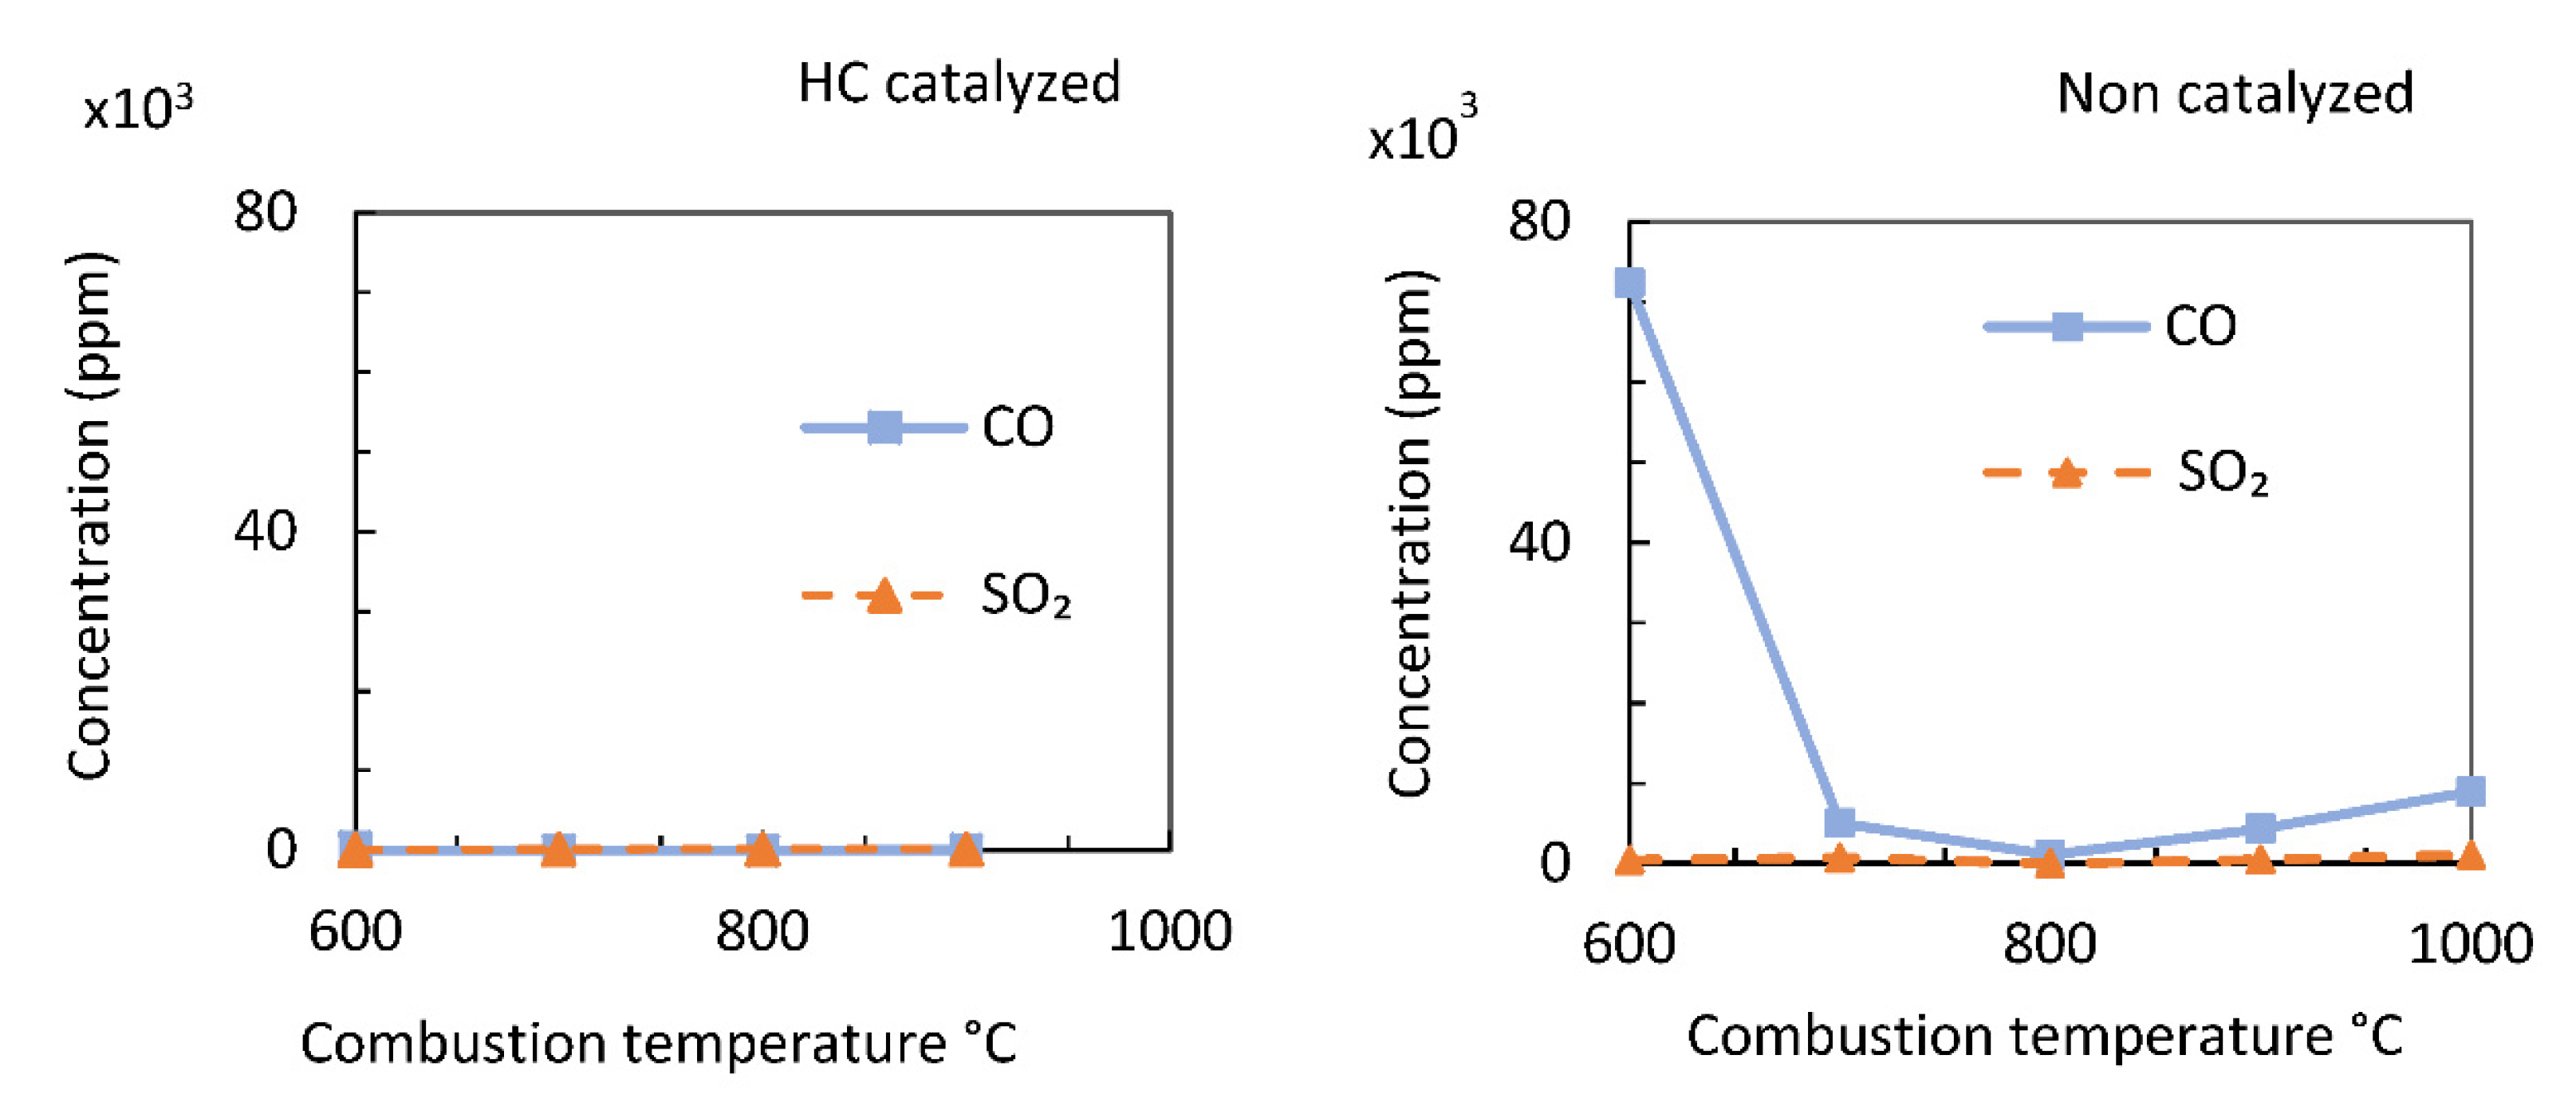
Figure 9 compares the gaseous CO and SO
2 concentrations from the catalyzed and non-catalyzed combustion of RB samples. The CO and SO
2 concentrations from the catalytic combustion were significantly lower than those from the non-catalytic combustion. Specifically, a 100% conversion of CO and SO
2 emissions was obtained from catalytic combustion at 700–900 °C combustion temperatures. The SO
2 concentration from the catalytic combustion was significantly reduced at all levels of the combustion temperature compared to the non-catalytic combustion. Specifically, 100% SO
2 conversion was achieved from catalytic combustion at 700–800 °C. Therefore, both CO and SO
2 concentrations were completely avoided in the catalytic combustion of RB samples at combustion temperatures of 700–800 °C. The iron redox phase took part in the reaction, even at lower temperatures. Consequently, molecules of CO combined with the supplied O
2 at the boundary surface with low energy of activation, which was significantly lower than those of other catalysts. The low activation energy arises because the iron oxide forms a thin layer on the alumina surface.
Generally, SO
2 can be chemically adsorbed on any surface. However, from the results of the present study, the oxidation of SO
2 by the catalyst was less compared to CO. The structural shape of the catalyst made it more attractive for CO oxidation. The temperature effects on the CO and SO
2 conversion efficiencies are summarized in
Figure 10. At lower temperatures, the catalyst slowly converted CO; however, at higher temperatures, CO and SO
2 conversion was sustained, and complete conversion was achieved, which agrees with the study by Salomons et al. (2007).
The exposure of a surface to oxygen and CO with no initialized reaction leads to a complete oxygen-covered surface. Therefore, all active sites became filled with oxygen, making it difficult for CO or SO2 to be adsorbed. CO contact with an oxygen-covered surface leads to the rapid formation of CO2, whereas oxygen exposed to a CO-covered surface does not. However, Dubien et al. (1998) reported that the adsorption of CO was not suppress by O2 coverage, although oxygen adsorption was subdued by the CO adsorbed. Therefore, at high temperatures, the chemisorption decreased with increasing temperature and decreased the inhibition effect of CO.
3.6. Catalytic Temperature Effect on PM2.5 Emission
Figure 11 presents the total concentration of PM
2.5, from the incineration of RB and JPN fuels. It compares the PM
2.5 concentration from non-catalyzed, cold-catalyzed, and hot-catalyzed combustion experiments. In cold-catalyzed combustion, the catalyst was not preheated before the experiments. For the JPN combustion, the non-catalytic combustion recorded the highest concentration of PM
2.5 concentration (826.6 mg/m
3) as expected. The PM
2.5 concentration from the cold catalyst was significantly higher than that from the preheated catalyst. This is because the preheated catalyst further combusts the particles as they come in contact, thereby reducing their total concentration. The preheated catalyst generally increases the flue gas temperature, thus aiding the flue burn-out phase.
PM2.5 from the combustion of RB samples was similar to that from the JPN samples; however, there were notable differences. PM2.5 from the RB samples was significantly higher than that from JPN samples because of its higher density and less interparticle space (Abah et al., 2020). This is especially true when combusted at lower temperatures. The non-catalyzed combustion of the RB samples recorded the highest PM2.5 concentration (1572.2 mg/m3), and the concentration decreased as the temperature increased. The PM2.5 concentration from the hot-catalyzed combustion was significantly lower than that from the cold-catalyzed combustion, especially at a combustion temperature of 600 °C. This is because the hot catalyst further combusts the particles as they come in contact and aids the flue burn-out.
Generally, the hot-catalyzed combustion emitted the lowest PM
2.5 at a combustion temperature of 600 °C for both JPN and RB samples (22.5 mg/m
3 and 19.0 mg/m
3, respectively). This is a significant result because previous studies have recorded higher concentrations at 600 °C for JPN and RB samples [
9,
13]. The PM emission increased with increasing combustion temperature due to inadequate excess air caused by the increased combustion temperature, thus leading to insufficient combustion. Therefore, the integration of this catalyst in a biomass combustion system will allow the combustion of biomass at lower combustion temperatures with low particulate emissions. The catalyst can be easily maintained because it can be detached from the exhaust. To avoid clogging, the catalyst was cleaned periodically using catalyst cleaners. The clogging rate is minimized by the heat treatment of the catalyst, which ensures that the unburnt carbon and gases from the combustion chamber are combusted during their movement through the exhaust.
Table 5 summarizes the performances of the catalysts.
4. Conclusions
The present study evaluated the performance of the integration of a platinum catalyst with iron oxide as a co-catalyst in the exhaust system of a fixed-bed electric furnace. The effects of preheating the catalyst on the PM2.5, CO, and SO2 emission profiles were investigated. JPN and RB samples were combusted between 600 and 1000 °C, at catalyst temperatures of 100–600 °C. The preheated catalyst significantly reduced CO, SO2, and PM emissions at the optimum catalyst temperature of 427.4–490.3 °C and varied rice husk combustion temperature of 600 °C and 1000 °C. Our previous studies recorded higher emissions at these combustion temperatures, particularly at 600 °C. Hence, this is a significant result. The RB sample, is a denser fuel and emitted higher emissions from our previous studies; however, the preheated catalyst significantly stabilized and reduced the emissions that could have been emitted at high temperatures due to reduced chemisorption and, consequently, lower CO inhibition. When the catalyst temperature was low, the CO conversion rate was low because of the low oxidation rate caused by the inhibition effect of the chemisorbed CO and the low average kinetic energy of the particles as they met the surface of the catalyst.
Therefore, this study further explains the inhibition effect of CO on its own oxidation on the surface of the catalyst, at low catalyst temperatures, since more CO is chemisorbed, thus inhibiting its conversion into CO2. At catalyst temperatures below 400 °C, the performance of the catalyst was reduced, and the oxidative reaction occurred. A further temperature increase optimized the flue gas oxidation, increasing the flue combustion intensity, specifically the reaction rate. The catalyst had a 100% CO conversion rate at a preheated temperature of 427.4–490.3 °C for JPN samples and 481.3–534.1 °C for RB samples. Further temperature increases distorted the equilibrium of the oxidative reactants, such as adsorbed oxygen, CO, and SO2.
The exhaust catalyst system used in the present study showed excellent performance and could be integrated into the exhaust systems of large- or small-scale biomass combustion systems. The energy required for preheating can be easily obtained from the biomass fuel. Regardless of the effect of fuel particle size on emissions, this system can effectively reduce gaseous and PM emissions from any biomass combustion plant. The catalyst system was significantly effective in reducing PM emissions from the combustion of RBs. For the JPN samples, it was significant for CO conversion. The catalyst was composed of 99.75% iron oxide and 0.25% platinum supported by alumina, with a total weight of 0.155 kg. Therefore, the energy required for heating the catalyst to the desired temperature of 427.4 °C was calculated to be 0.0183 MJ. As seen in the present study, biomass combustion was less efficient than fossil fuel combustion. Therefore, the introduction of catalytic converters is necessary to control emissions, especially those resulting from air-to-fuel ranges. A wide range is advantageous for catalytic emission control as it reduces the necessity of increasing the air-to-fuel control of the system. The strategy of the three-way catalyst is to simultaneously remove CO, HC, and NOx. Hence, the optimum condition for low emission is a preheated catalyst temperature of 427.4 °C and a 600 °C combustion temperature.
This study has significantly reduced emissions from rice husk combustion, more so than at previously worse combustion temperatures, creating more opportunities for energy generation through biomass combustion. The novelty of this study is its methodology, combining real time PM measurement techniques and flue gas analysis into an experimental set up consisting of an integrated catalyzed exhaust for emission control in a rice husk combustion system. This study was limited to lab-based experimentation. Therefore, environmental impact assessment is required to present this result in a practical perspective and its environmental impact on the general ecosystem and energy input and output relationship.


