1. Introduction
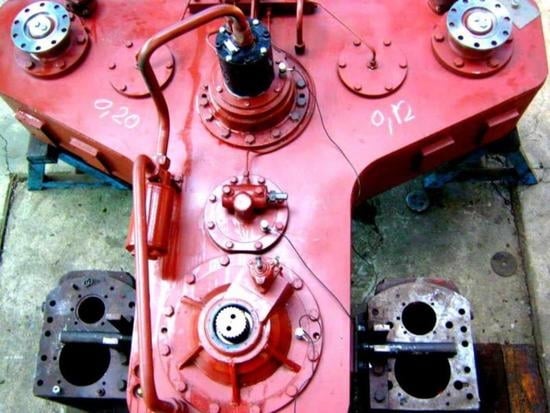
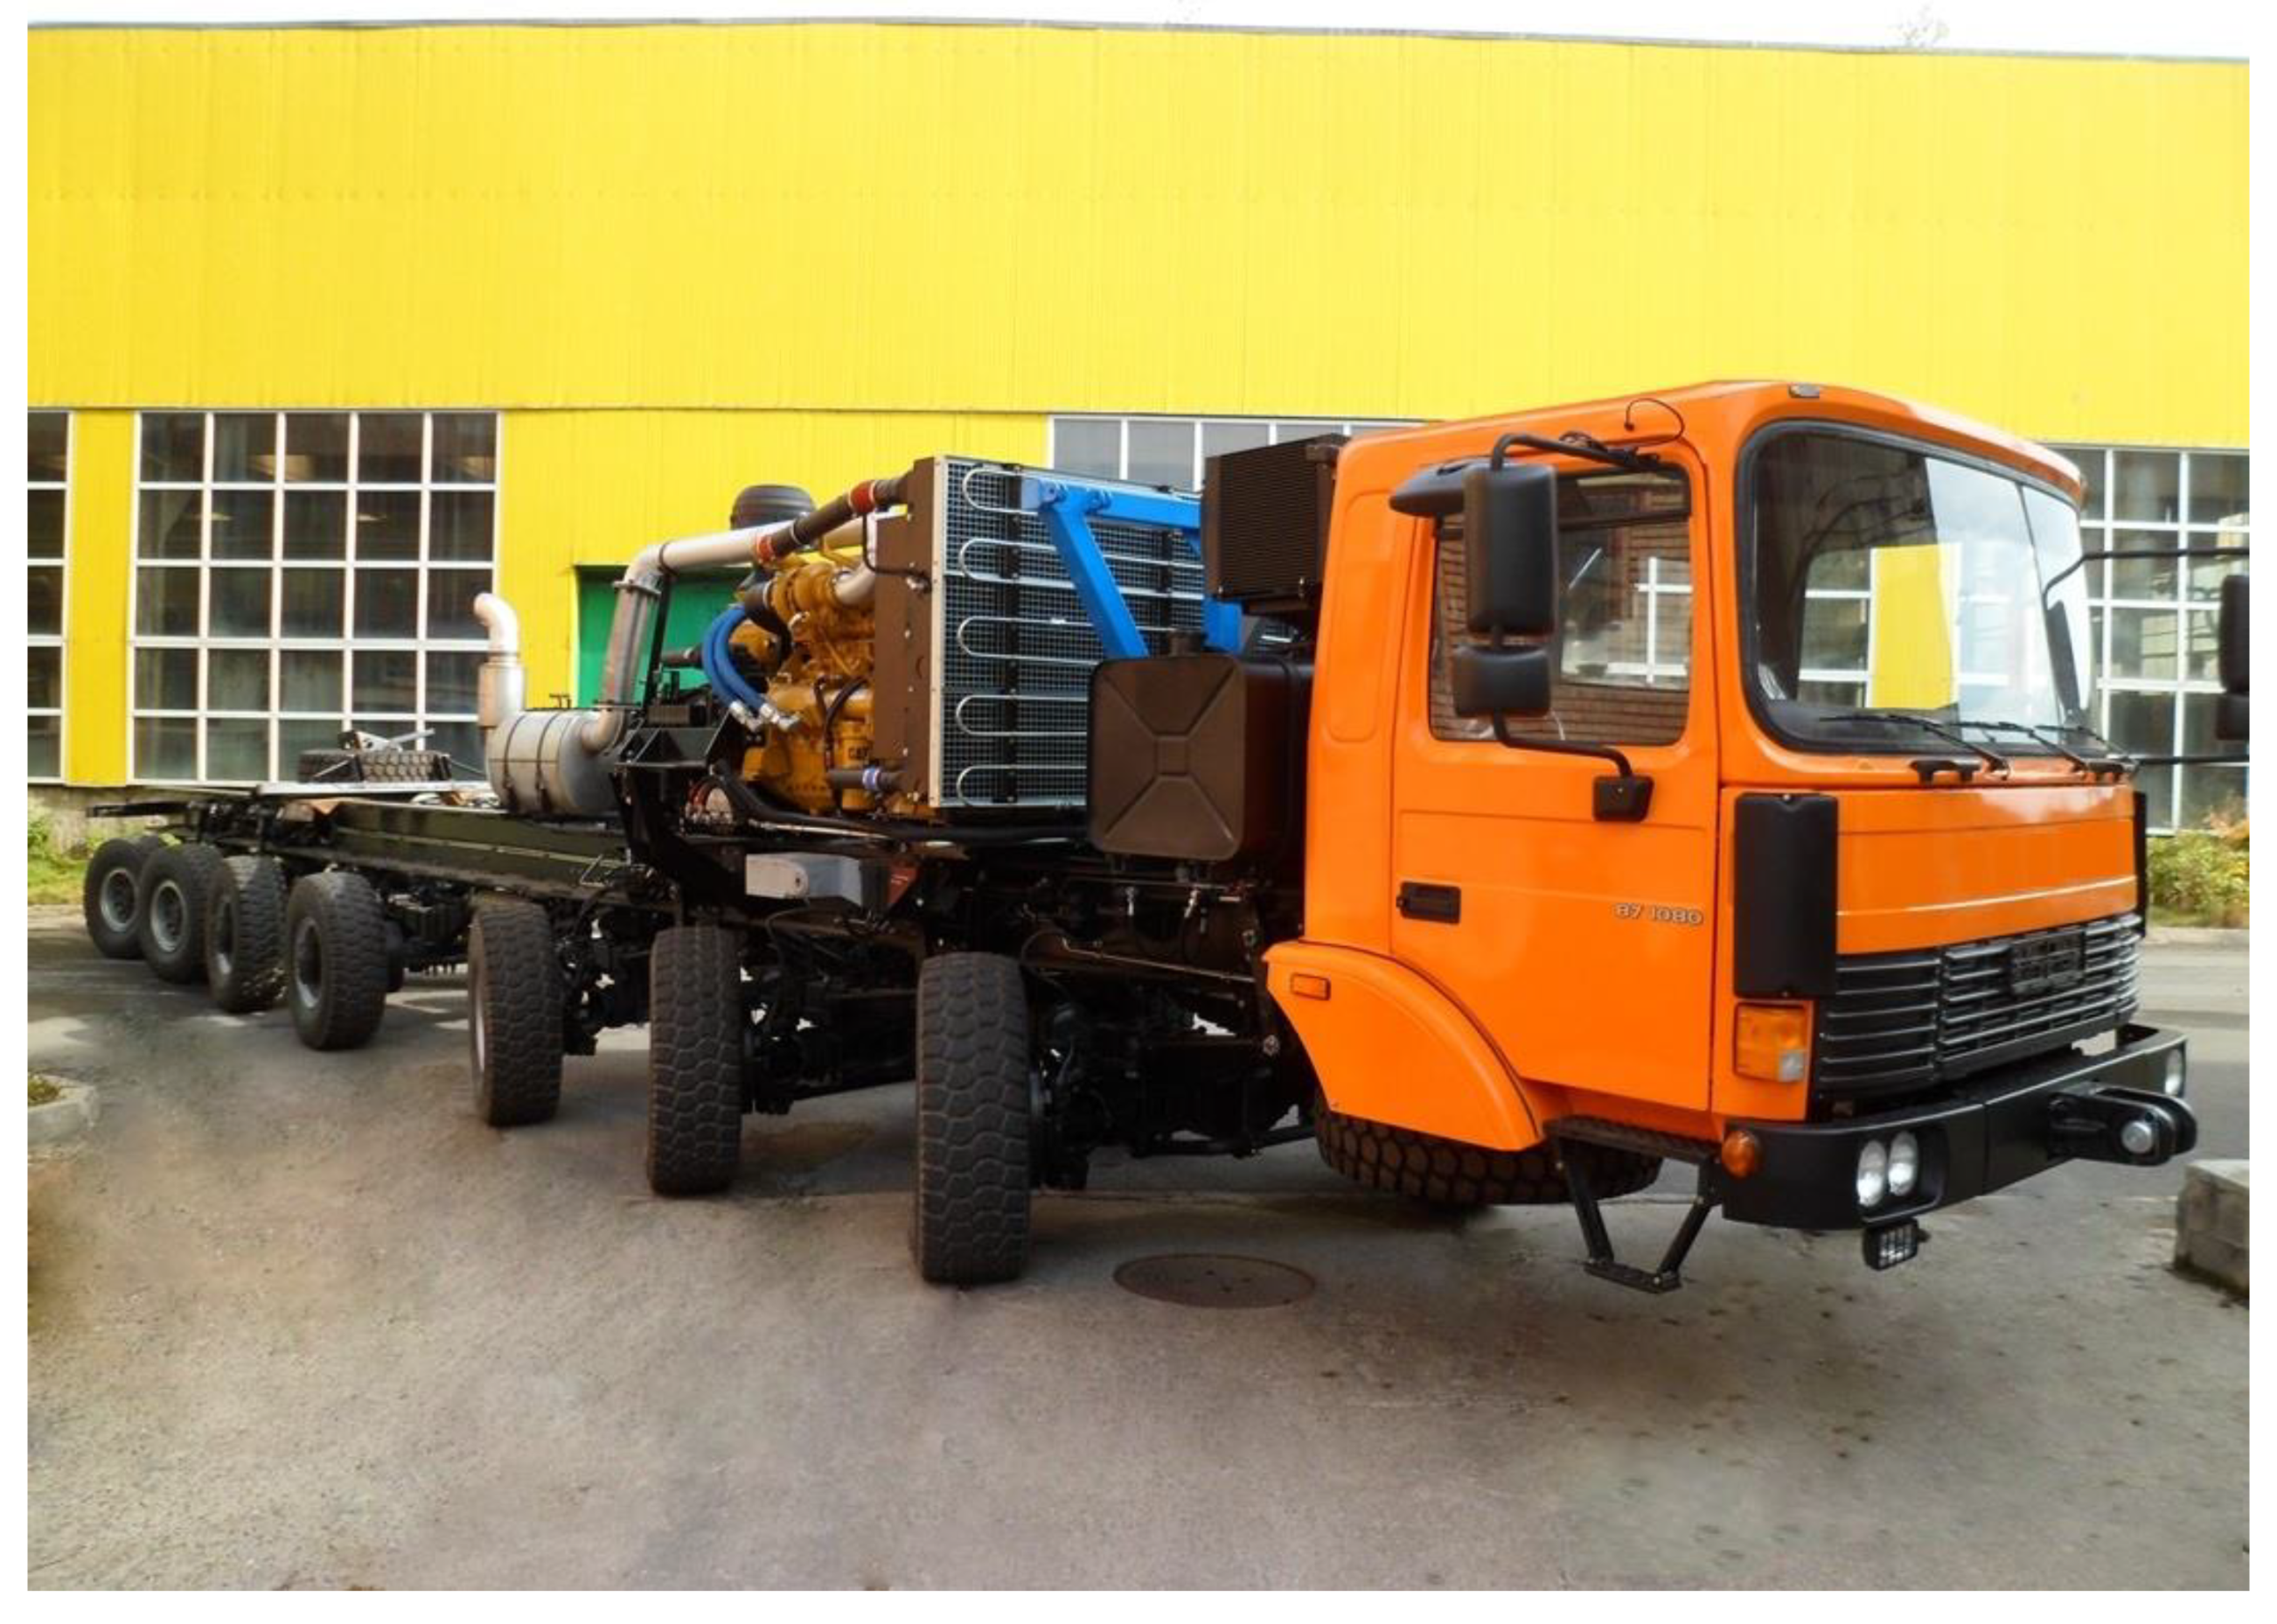
Oil drilling rigs are complex assemblies intended mainly for the controlled penetration of the terrestrial layers under which the hydrocarbon reserves are accumulated. A secondary objective of these installations is the repair of the wells. The mechanical stresses that occur during the digging of the wells are particularly high, due both to the resistance of the layers of soil and hard rocks, and the length of the columns of the drilling pipes. The optimal solution to meet these goals was to build a truck with two engines (
Figure 1 and
Figure 2). During transport one of the motors works and during the operation of the drilling rig both motors work, to obtain the necessary higher power. The adder box, which equips these installations, whose experimental study is made in the work, is a complex mechanical assembly, which must work accurately and safely, in the conditions of high efficiency and a low-cost price. Consequently, modeling is needed that leads to a leveling of operation practically identical to the real phenomena. At the same time, the sizing of all components must be ensured at the degree of safety and economy required by the profile market.
There is a lot of research on the common problems that arise in these heavy vehicle transmissions. The main problem that has to be studied very carefully is the problem of vibrations, which leads, implicitly, to the problem of noise produced by such a transmission [
1,
2]. Any defect, even minor, that can occur in one of the engines has to be eliminated [
3]. To reduce maintenance costs, careful monitoring is always desired. The conclusions that will be presented in this paper show that the vibrations of the components of a transmission are extremely important for the early detection of possible defects. Deviations from normal behavior must be identified in advance.
If we analyze the vibrations that occur in a gearbox, we find that there are two types of vibrations important for applications. These two types of vibrations are due to two types of excitation sources. The first type is due to the internal excitation of the gears and the second type is represented by the external one due to the motor torque. There are established models for the study of vibrations that occur in such systems [
4] using multibody dynamic systems. In the mentioned work, the elastic deformation of the wheelset and the deformation of the gearbox housing are taken into account. The software used to perform the numerical calculations is MATLAB/Simulink and non-experimental measurements confirmed the accuracy of the model.
A gearbox or an adder gearbox that equips a heavy truck is a massive aggregate, with a major impact on both the operation and the price of the vehicle as a whole. The vibrations generated by such an aggregate will determine the conformity of the truck and the durability of the transmission. This paper [
5] aims to improve the design of this unit and reduce weight, in addition to adequate vibration behavior. A dynamic model [
6] for the gearbox is proposed to provide data for the designers for the realization of a properly functioning product with a low-cost price. The results are validated by experimental tests. As mentioned earlier, vibration is one of the main problems and causes of noise in the case of gearboxes [
7]. This is the reason why there are numerous researchers in the field, who have proposed different models to study these vibrations. The results obtained on account of these models were verified experimentally [
8,
9]. Thus, they established the equations of motion for the dynamic analysis [
10,
11] and the finite element method was used intensively [
12,
13]. As a consequence, the use of modal analysis in vibration analysis is widely presented [
14,
15]. Interesting models are presented in [
16,
17]. The involvement of active control in problem-solving is addressed in [
18,
19].
Due to the time-variable character of the loads, produced in cylinders by the working process, the crankshaft is subjected both to bending and torsional vibrations. The bending vibrations (considering the relatively short distances between the crankshafts’ bearings) are less dangerous than the torsional ones, where nearly the entire length of the crankshaft is involved in this process (
Figure 2). By superposing the torques offered by the cylinders of the engine during a complete working cycle (720° rotation of the crankshaft), the end of the crankshaft will obtain the resulted torque moment
with its fluctuation (between
and
) and small shocks, which will finally produce the mentioned torsional vibration of the crankshaft. In spite of that, the used flywheel and other damping devices can reduce the effect of the torque moments’ fluctuation; in practice, they will also be observed. Their final effect, the induced torsional vibrations, has to be reduced to obtain better reliability and to protect the engines. When the obtained/generated frequencies during the working process become equal with the crankshaft’s eigenfrequencies, the resonance phenomenon will appear, which are very dangerous due to their unexpected high amplitudes. In this case, the total angular displacements
of the crankshaft showed such non-acceptable amplitudes. The vibrations are associated with very dangerous fatigue solicitations which are, in the present case, some constant-sign types (between
and
, having the same sign). Taking into consideration both of the above-mentioned effects it can be concluded that a high-accuracy theoretical analysis (usually including a Finite Element Method (FEM) simulation) carried out by an experimental investigation represents a great challenge for the engine designers. From the author’s point of view, the experimental investigations attract interest because they are useful tools in FEM validations, too. The applied experimental method has to be high-accuracy, reproducible (without altering the original phenomenon), and with accessible prices.
By utilizing such a complex experimental method, not only a high-fidelity monitoring of the phenomenon (here, the torsional vibrations) with the corresponding frequencies but also a high-accuracy evaluation of the amplitudes became possible. The usual stroboscope is not able to offer this information.
Video Image Correlation (VIC) has proven to be an excellent method for analyzing the deformations and stresses that occur in a structure and there is a rich literature that develops the method and the range of applications [
20,
21,
22].
The facilities of a contactless optical measurement method (VIC), in high-accuracy quantitative linear and angular vibration analysis, are presented. The system is able to substitute a high-performance stroboscope and to quantitatively evaluate the vibration amplitudes. In this respect, the authors designed and tested an angular vibration system. This consists of a small stepper motor, powered with alternating current (by small shocks/impulses, using an asymmetric cyclic feeding) and a small plastic disk (a CD disk), fixed on its shaft. Due to the non-uniformity power supply from the stepper motor, a resonance phenomenon will occur in the plastic disk, which leads to high angular amplitudes. The VIC measurement method offers, based on a frontal viewing of the disk during the resonance phenomenon and by simple calculus on the monitored linear displacements, the corresponding angular amplitude. The software enables a quantitative evaluation of these angular vibrations (their amplitude, respectively, their precise frequency). Similarly, the phenomenon can be observed at the crankshaft (where the rotary speed is not perfectly uniform, requiring a flywheel and supplementary damping device). In the authors’ opinion, the VIC-3D could be used as a powerful, relatively cheap, simple, and also high-accuracy investigation tool in the analysis of the torsional vibrations in combustion engines [
23,
24,
25].
2. Materials and Methods
In the following, the authors illustrate the advantages of such an adequate experimental investigation system, namely the Video Image Correlation (VIC), known also as Digital Image Correlation (DIC), which represents a very powerful full-field contactless optical method. Its 3D version (VIC-3D v7) [
26,
27,
28,
29], used in the 3D displacement field’s high-accuracy evaluation, is suitable not only in static loading conditions but also in quasi-dynamic and dynamic ones. Furthermore, the periodic phenomenon can be easily monitored even if they show some fluctuations.
Other aspects of the VIC-3D system are:
- -
it is a contactless optical method and, consequently, the measurement does not influence the analyzed phenomenon as well as when applied to a large range of materials (homogeneous, non-homogeneous, isotropic, orthotropic as well as anisotropic ones);
- -
it is not necessary to use expensive, consumable, only water-soluble white and black paint for grounding and for painting the dots;
- -
it is able to eliminate the rigid body movements from the achieved values and, consequently, can be applied in normal working (industrial) conditions;
- -
it shows good accuracy in 3D investigations of the field’s displacement components (in usual cases up to approximately );
- -
it can alter not only the displacement field but also the corresponding strains too;
- -
it allows a large range for the measured values of the displacements (starting from some microns up to several cm);
- -
it allows a superposing of a metric nod mapping similar to the FEM-analysis ones;
- -
it allows to superpose a desired density meshing over the area of interest and so became possible to verify the Finite Elements simulations’ results (the numerical model’s validation);
- -
it allows to re-analyze the acquisition dates (set of images) as many times as one wishes, with desired accuracy by redefining the area of interest for the same phenomenon;
- -
it shows good stability, allowing high-accuracy measurements in operating/working/industrial conditions.
The system can be completed with several very useful post-processing tools such as:
- -
strain and strain tensor’s evaluation;
- -
velocity and in-plane rotation calculus;
- -
applying arbitrary user-defined or own/implemented functions from VIC-3D;
- -
mapping external data (e.g., temperature field imported from a thermo-vision or IR camera);
- -
extracting data (in specified points, along lines, curves, grids, points/nodes);
- -
VIC Gauge 3D TM module offers the facilities of real strain gauges, respectively, of several high-accuracy and removable optical extensometers;
- -
exporting data (all data, pixel grid data, metric node data for FEM comparison, statistical data in CSV or ASCII formats);
- -
in VicSnap software, the Real-time 3D Analysis module offers real-time monitoring (only visualization at the first stage, but the information can be stored for later processing);
- -
the Strobo-module offers all of the facilities of a high-speed stroboscope, supplemented with a high-accuracy displacement evaluation.
The system consists of two (not necessarily high-resolution) video cameras, fixed on a very rigid (highly-stiffened) aluminum profile (see
Figure 3), mounted on a very stable tripod.
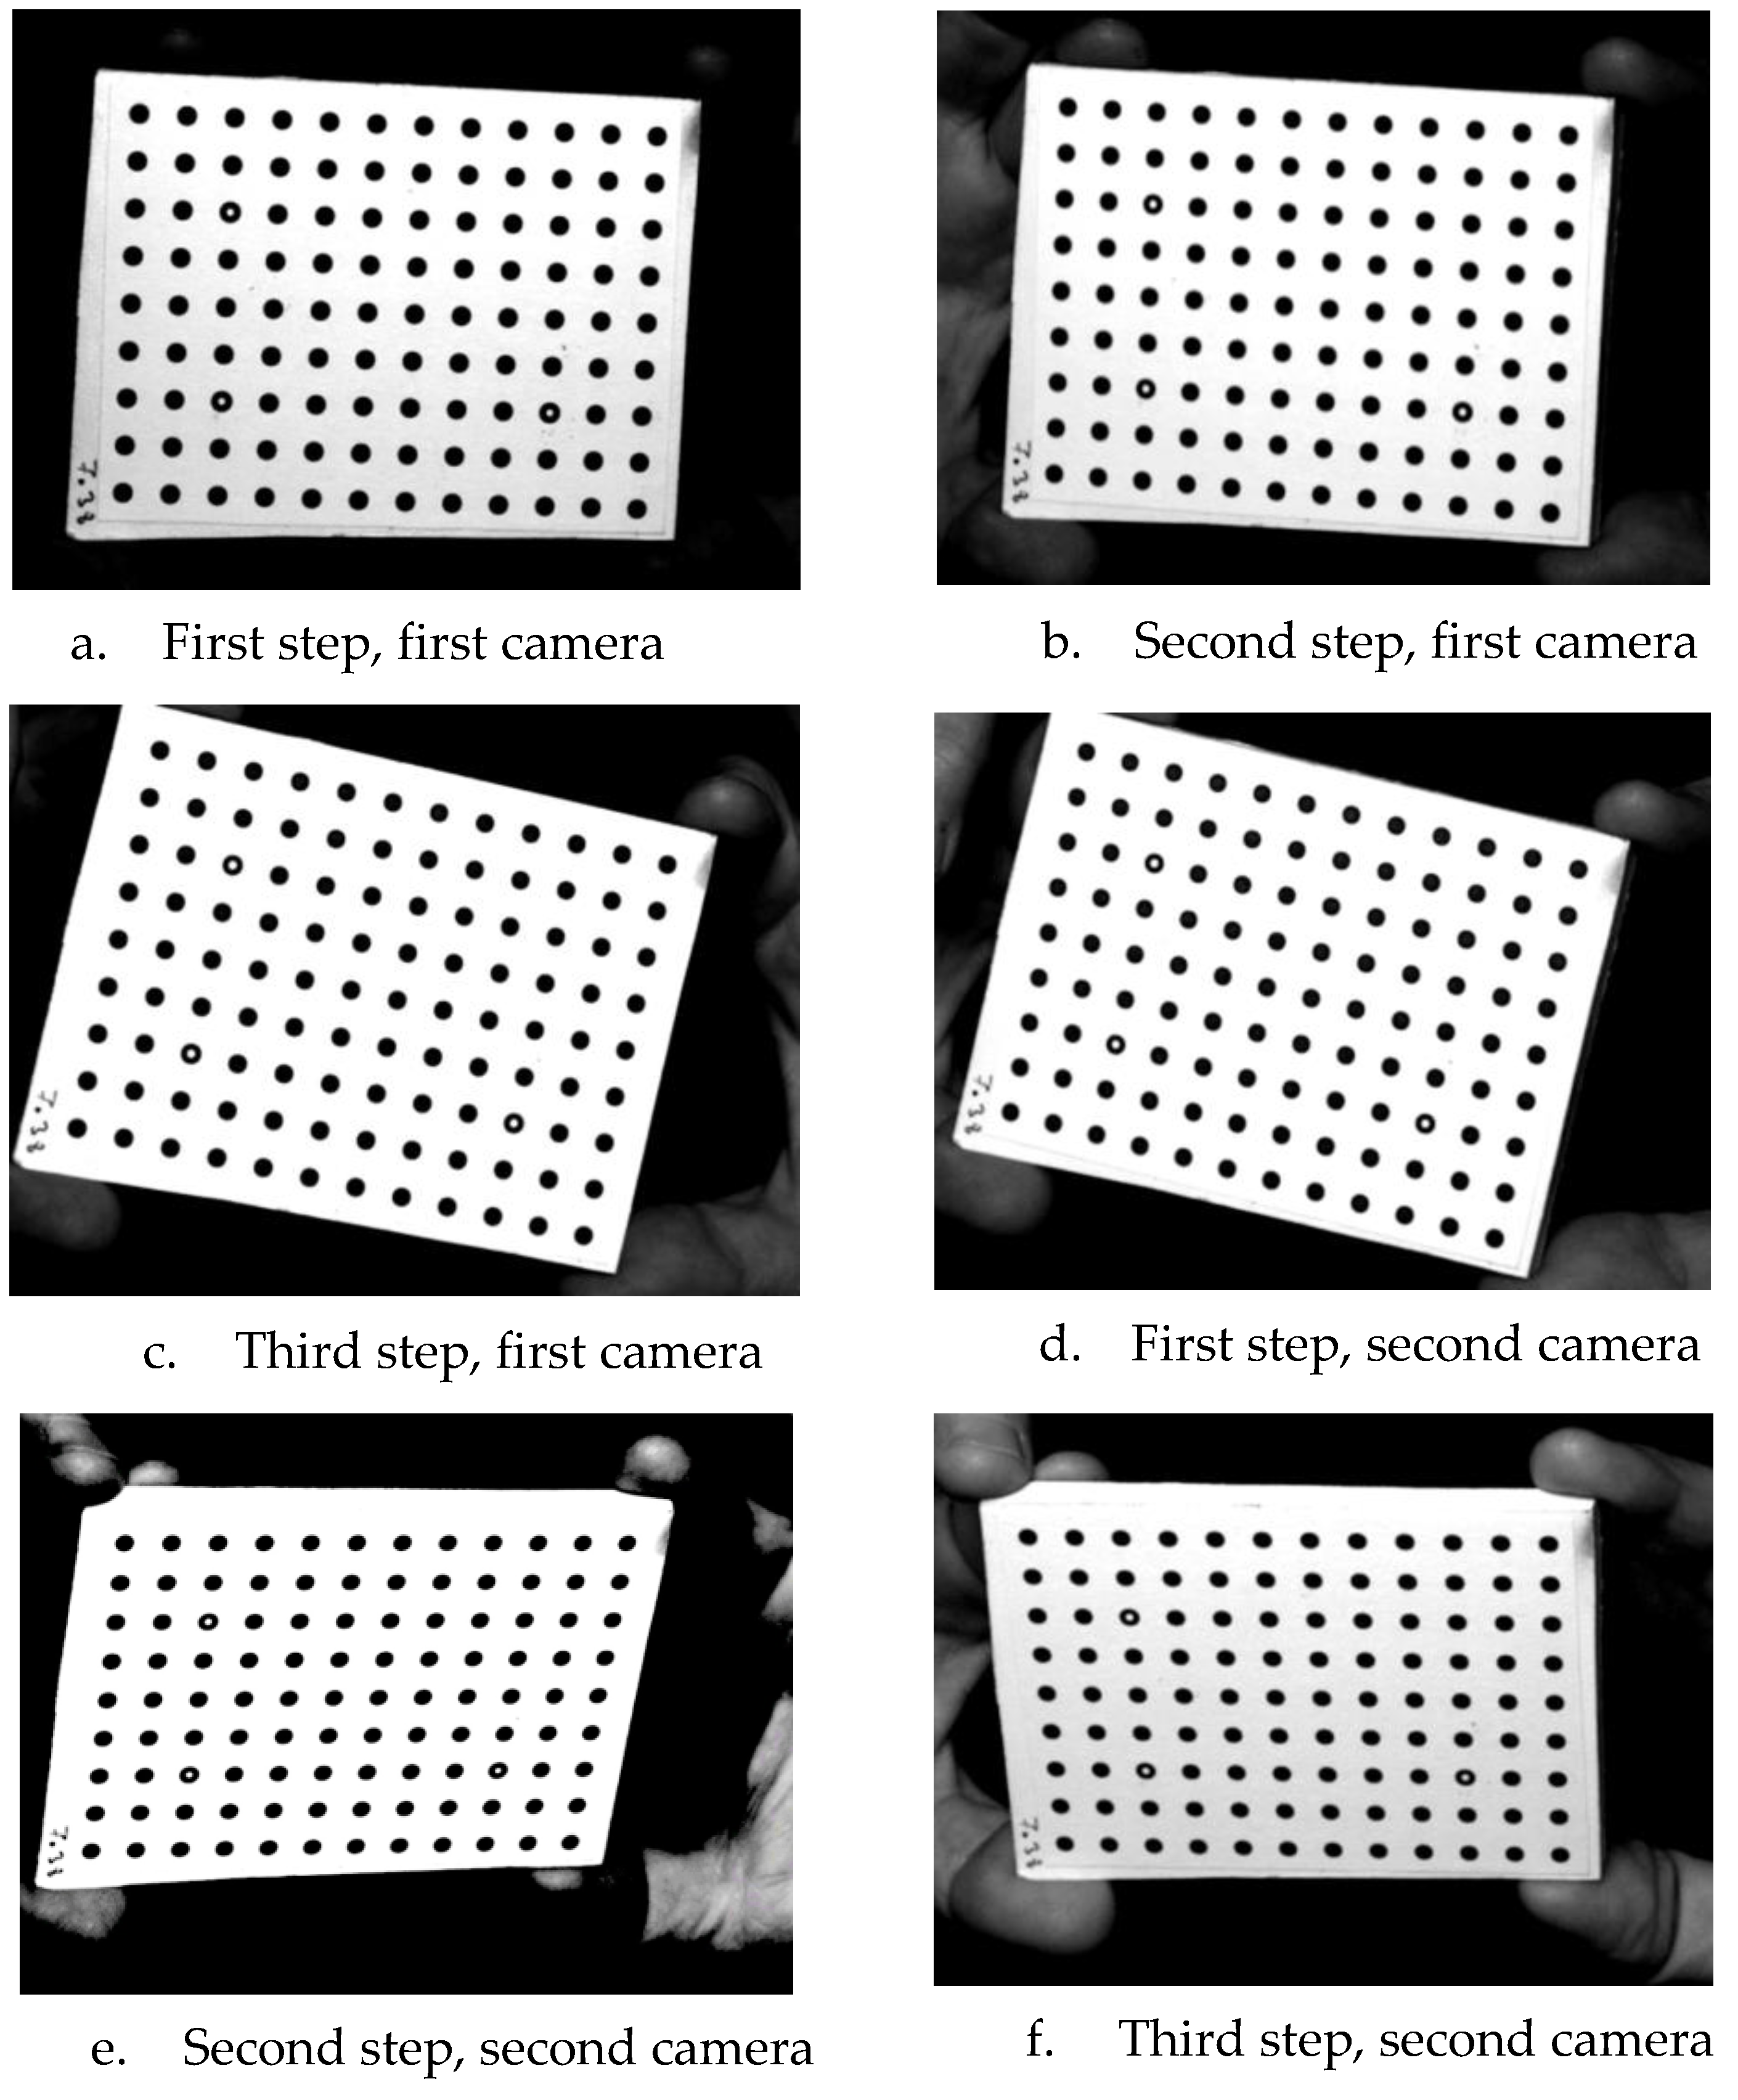
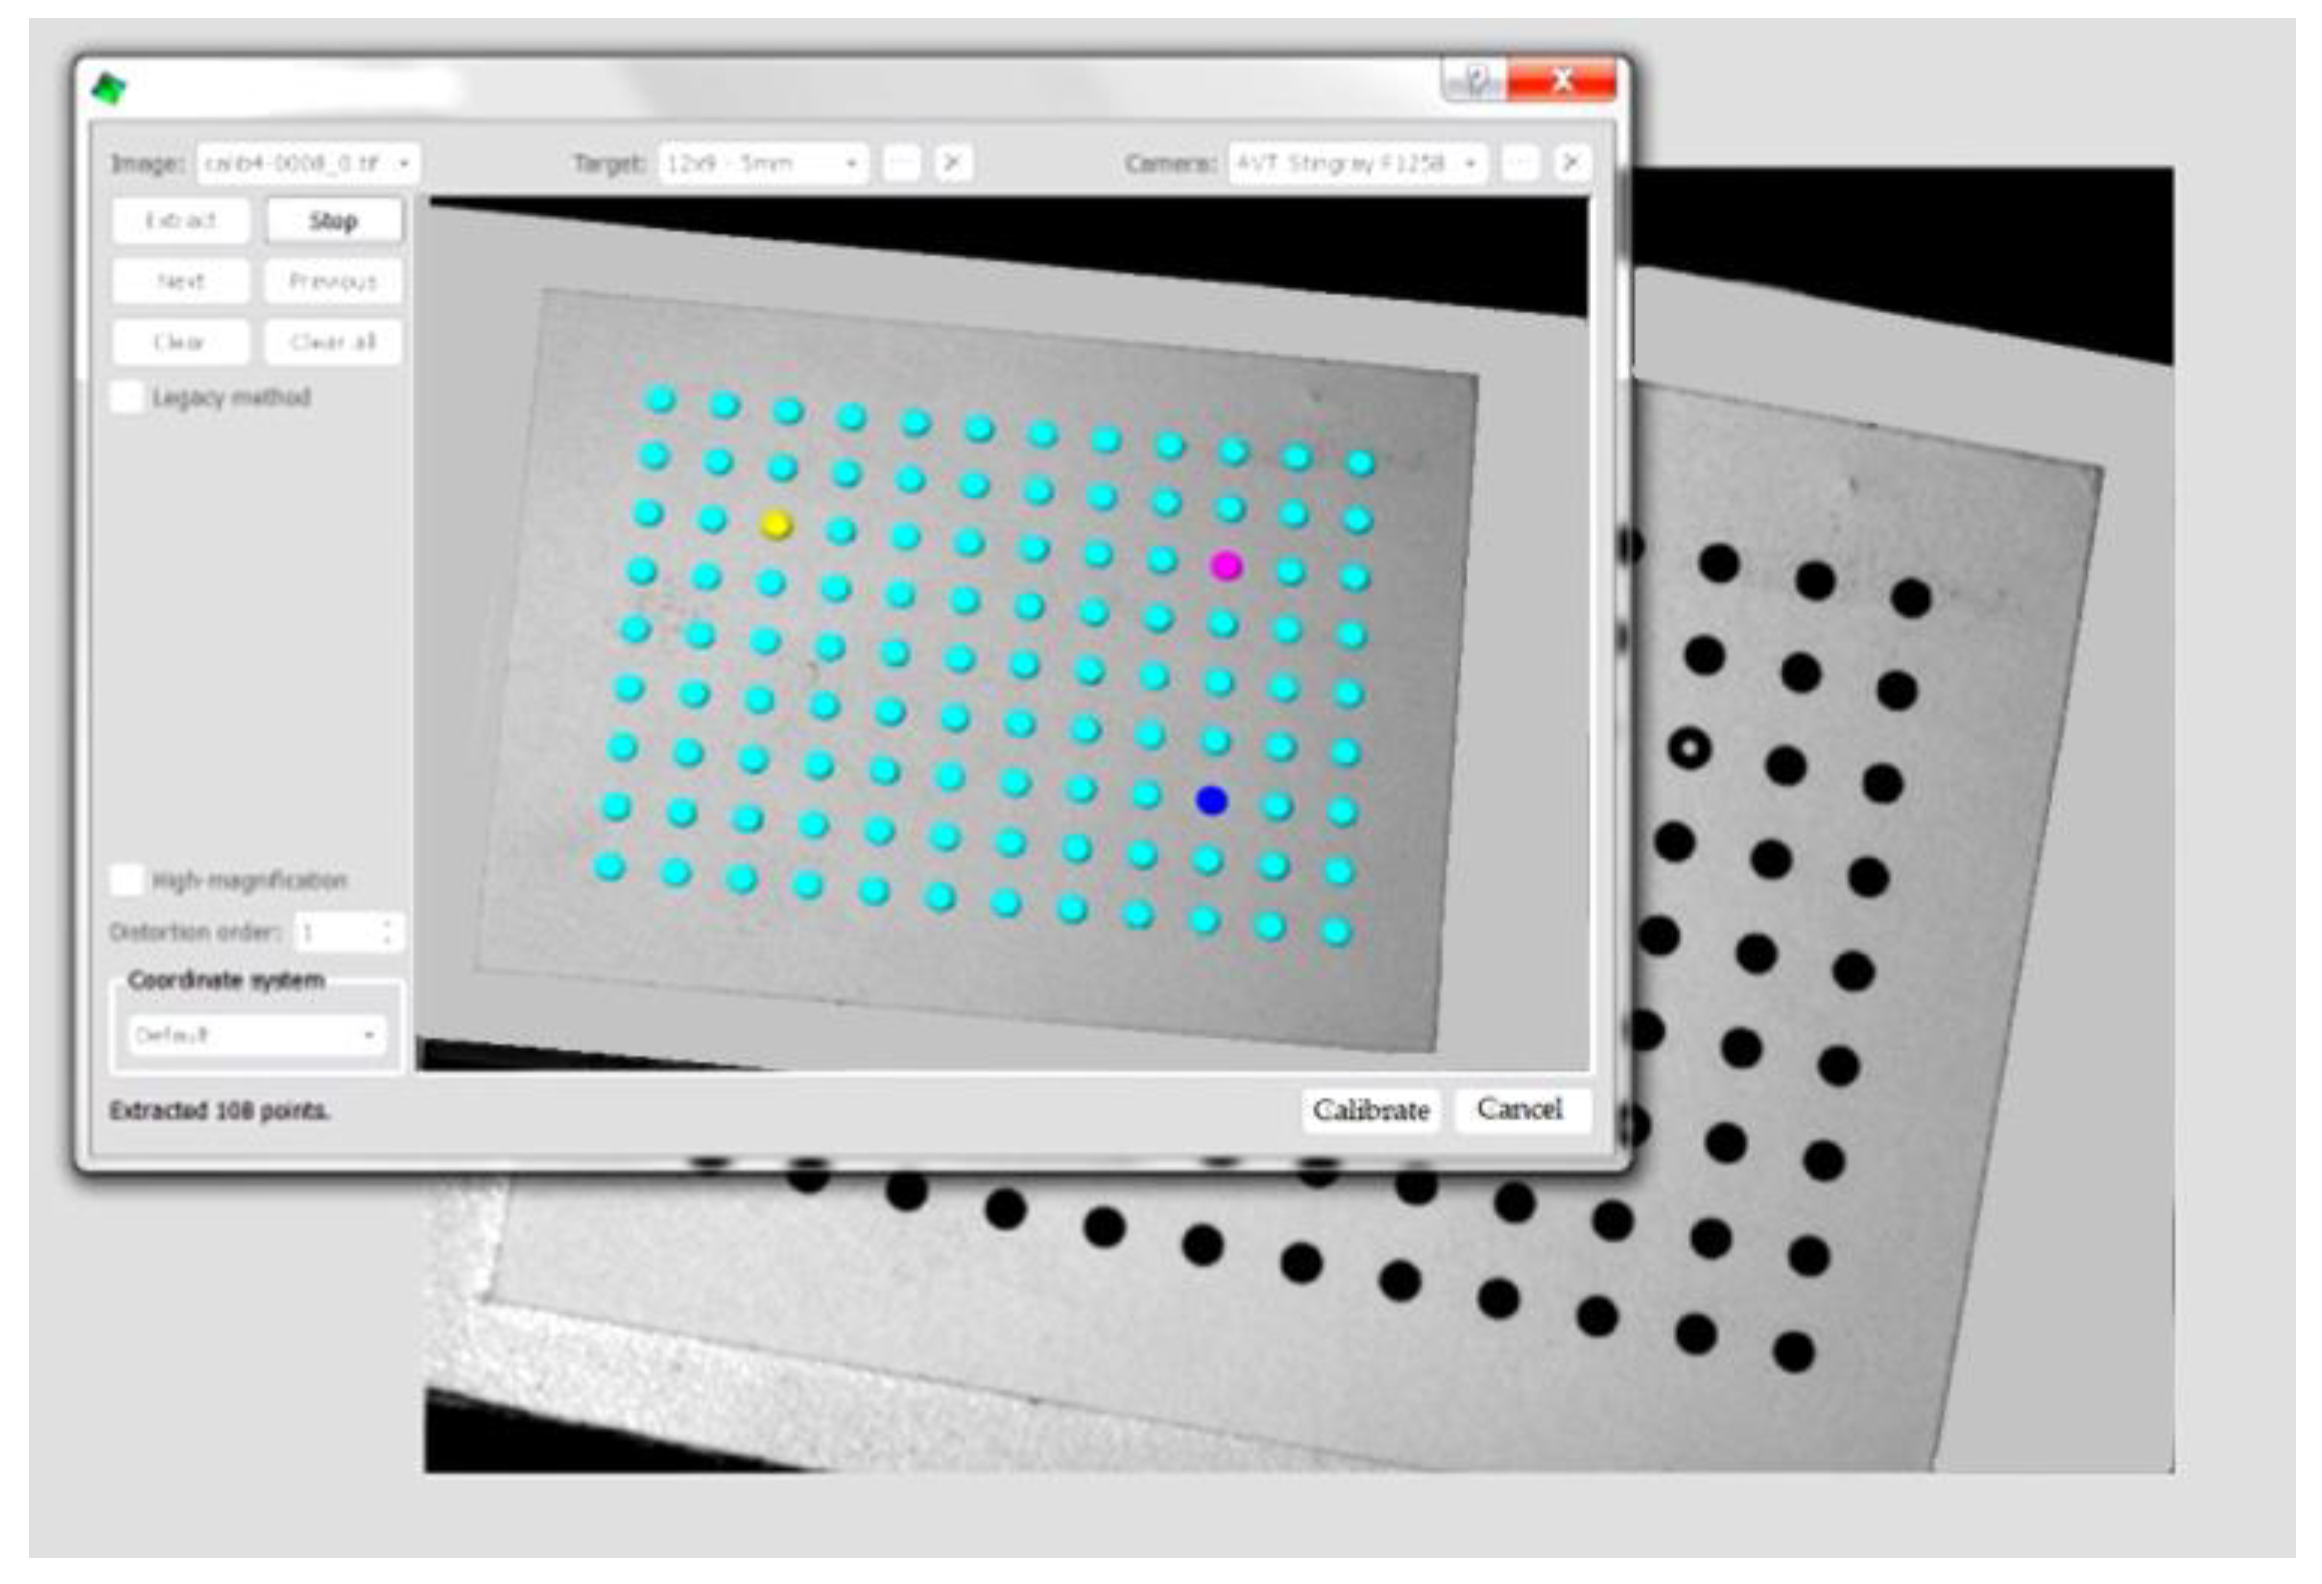
To perform experimental investigations, the surface of the investigated object in advance is sprayed with a water-soluble paint, which assures obtaining a non-uniform dotted surface; the sizes of dots depends on the tested/investigated surface magnitude/size/dimension. In this way, one can assure a different intensity of grey for each representative (equivalent) pixel from the analyzed surface. One has to perform the calibration with some special targets, namely some plates foreseen with a number of some high-accuracy sets of dots (
Figure 4 and
Figure 5), which are disposed/printed with a special 2D high-accuracy on the target’s surface. During the calibration process, this special target is disposed in the plane corresponding to the predictable median plane of the tested object’s surface. The target is rotated in the horizontal and vertical plane (in the predictable tested object’s plane) to allow the VIC-3D program high accuracy in recognizing the 3D displacements of the significant points (dots) of the target, which are colored by the software in yellow, pink, and blue (
Figure 5).
One has to underline the important fact, that in this case, the calibration supposes only the hereby described process, without any special calibration of the lighting sources, it is only required that there is a uniform distribution of the incident light on the tested object’s surface. Calibration requirements of the lighting sources one can meet in some other optical methods cases such as Electronic Speckle Pattern Interferometry (ESPI) or others, can differ. For example, in the case of ESPI, together with a symmetrical disposition of the lighting sources, it is also required that there are equal-lighting conditions for them on the tested surface. If the lighting-source pair is disposed in the horizontal plane, it will assure a high-accuracy measurement of the vertical in-plane displacements, when the vertical disposed lighting-source pair will be suitable for the horizontal in-plane displacements’ evaluation. In the case of the coexistence of both lighting-source pairs (both of the horizontal and vertical ones), having the same lighting intensity on the tested surface, then all of the displacement components (in-plane on horizontal, as well as on vertical directions, together with the out-of-plane one, too) will be obtained with the same nanometers’ accuracy. This out-of-plane displacement represents/means the displacement along the normal direction to the tested object’s surface. In the case of the VIC-3D system, one has to impose only uniform lighting of the tested object’s surface, offered/assured usually by means of a normal direction disposed central (between the two video cameras) white light source, but also some oblique-incidental lighting sources (both of them with respect to the normal direction to the tested surface) can be involved, which also has to assure uniform lighting of the investigated surface; other special requirements for the lighting source there are not imposed.
After a calibration process, using some special targets, the cameras will perform the image acquisition in an matrix of pixels, firstly, for the unloaded specimen (where one has to define the area of interest of the investigation) and, secondly, for the loaded one.
Figure 4 shows some phases of the calibration process and
Figure 5 a step of the processing by the VIC-3D software of these captured images.
Figure 6, according to the same works [
26,
27,
29], presents the principle of analysis of these images captured by both video cameras.
Each captured image by the two video cameras, corresponding to the initial unloaded stage of the tested object, especially on the predefined area of interest, will be analyzed in the following manner:
- -
in the first stage, the software asks the user to define the dimensions/sizes of a Subset (Primarily Cell) (here: ), as well as its step’s magnitude (i.e., with how many pixels have to be translated/moved in this Subset along the captured image from left to right, respectively, and down from the previous line to the next one);
- -
then, for the predefined Subset, starting from the upper left corner, the software will establish/determine a unique grey-code, correlated with its median pixel’s (marked in
Figure 6 with/on black) high-accuracy 3D coordinates; this representative pixel will be the equivalent pixel of the analyzed Subset;
- -
for the first, so-evaluated Subset, the software will perform/do its substitution with the forementioned equivalent/representative median pixel (i.e., instead of these previous 25 pixels of this Subset the software will consider in the following only one: its representative/equivalent median pixel);
- -
then, the software will perform the translation of the Subset in right, with the predefined step, (in the same first upper line) and, similarly, will substitute this next Subset with one other representative/equivalent median pixel, a.s.o.;
- -
finally, by analyzing the whole left and right first captured images of the initial unloaded stage of the object, having several Mpxs, these images will be substituted by means of a finite number of representative pixels, correlated with their high-accuracy 3D coordinates and also having some unique, easy-recognizable grey-codes;
- -
after performing the loading of the tested object, together with a predefined image-capturing frequency, finally one will obtain a number of left and right images, which will be analyzed, similarly, with those first ones; one has to underline that the mentioned image analysis will be performed only/strictly in the predefined area of interest in order to diminish the analysis’ time/duration;
- -
finally, one has obtained for each captured left and right images, the same number of equivalent median pixels, having the same initial grey-codes, but with modified 3D coordinates (due to the object’s deformation or/and its rotation and translation);
- -
to evaluate these equivalent pixels’ 3D displacements (which can be considered as some 3D-disposed/spatial vectors), their 3D components , as well as the corresponding linear and angular strains , the software has to perform a high-accuracy and uniquely-defined identification of the newly positioned equivalent pixels;
- -
this identification, thanks to the software manufacturing Correlated Solution Co., will be performed quickly (see
Figure 7) because the software will compare only once the left and right images, corresponding to Time 0 of the unloaded stage of the object (named the reference stage), after this, the succeeding left images will be compared with the left reference, the succeeding right images with the right reference one. The software allows the user to perform corrections, based on an identification of the initial reference point, marked by the user in advance with a small cross, for all captured images;
- -
consequently, the software requests only the identification of a single point (assisted by the user’s intervention) of the left and right first captured images, and based on this, all captured images (by means of their equivalent/representative pixels) will be correlated.
Finally, the software will offer the corresponding image analysis, delivering a high-accuracy 3D displacement field of the whole monitored structure and the corresponding strain field.
In the case of the vibration analysis, the first image acquisitions correspond to the static, unmoved object and the ones next to the vibrating object.
The above-described VIC-3D v7 system was used to put in evidence its advantages in a complete/full vibration analysis process, which can be applied to the crankshaft of the combustion engine.
There is a rich literature that develops the method and the range of applications. How, is mentioned in several references, such as [
20,
21,
22]. Video Image Correlation (VIC) has proven to be an excellent method for analyzing the deformations and stresses that occur in a structure.
How, mentioned before, as the aspects of a contactless optical measurement method (VIC), in high-accuracy quantitative linear and angular vibration analysis, are incontestable; the system can substitute a high-performance stroboscope and quantitatively evaluate the vibration amplitudes.
To put in evidence the mentioned advantages, the authors designed and tested an angular vibration system. This consists of a small stepper motor, powered with an alternating current (by small shocks/impulses, using an asymmetric cyclic feeding) and a small plastic disk (a CD disk), fixed on its shaft. Due to the non-uniform power supply from the stepper motor, a resonance phenomenon will occur in the plastic disk, which leads to high angular amplitudes. The VIC measurement method offers, based on a frontal viewing of the disk during the resonance phenomenon and by simple calculus on the monitored linear displacements, the corresponding angular amplitude. The software enables a quantitative evaluation of these angular vibrations (their amplitude, respectively, their precise frequency). Similarly, the phenomenon can be observed at the crankshaft (where the rotary speed is not perfectly uniform, requiring a flywheel and supplementary damping device). In the authors’ opinion, the VIC-3D could be used as a powerful, relatively cheap, simple, and high-accuracy investigation tool in the analysis of the torsional vibrations in combustion engines [
23,
24,
25].
3. Experimental Setup of the Demo-Bench
In order to be able to put in evidence the angular displacements using a common VIC system (having two relatively low-accuracy CCD cameras with only 1.4
Mpx), the authors designed both an original testing bench presented in
Figure 8 and an adequate original electronic driving circuit (see
Figure 9). On the end of the shaft from the small unipolar stepper motor
1 is fixed the cylindrical Aluminum support
3 by means of the very elastic rubber cylinder
2. In this support is fixed (and precisely centered) the small plastic disk
4, by means of fixing disk
5 and screw
6. The small plastic disk
4 is foreseen with two diametrically-disposed screws
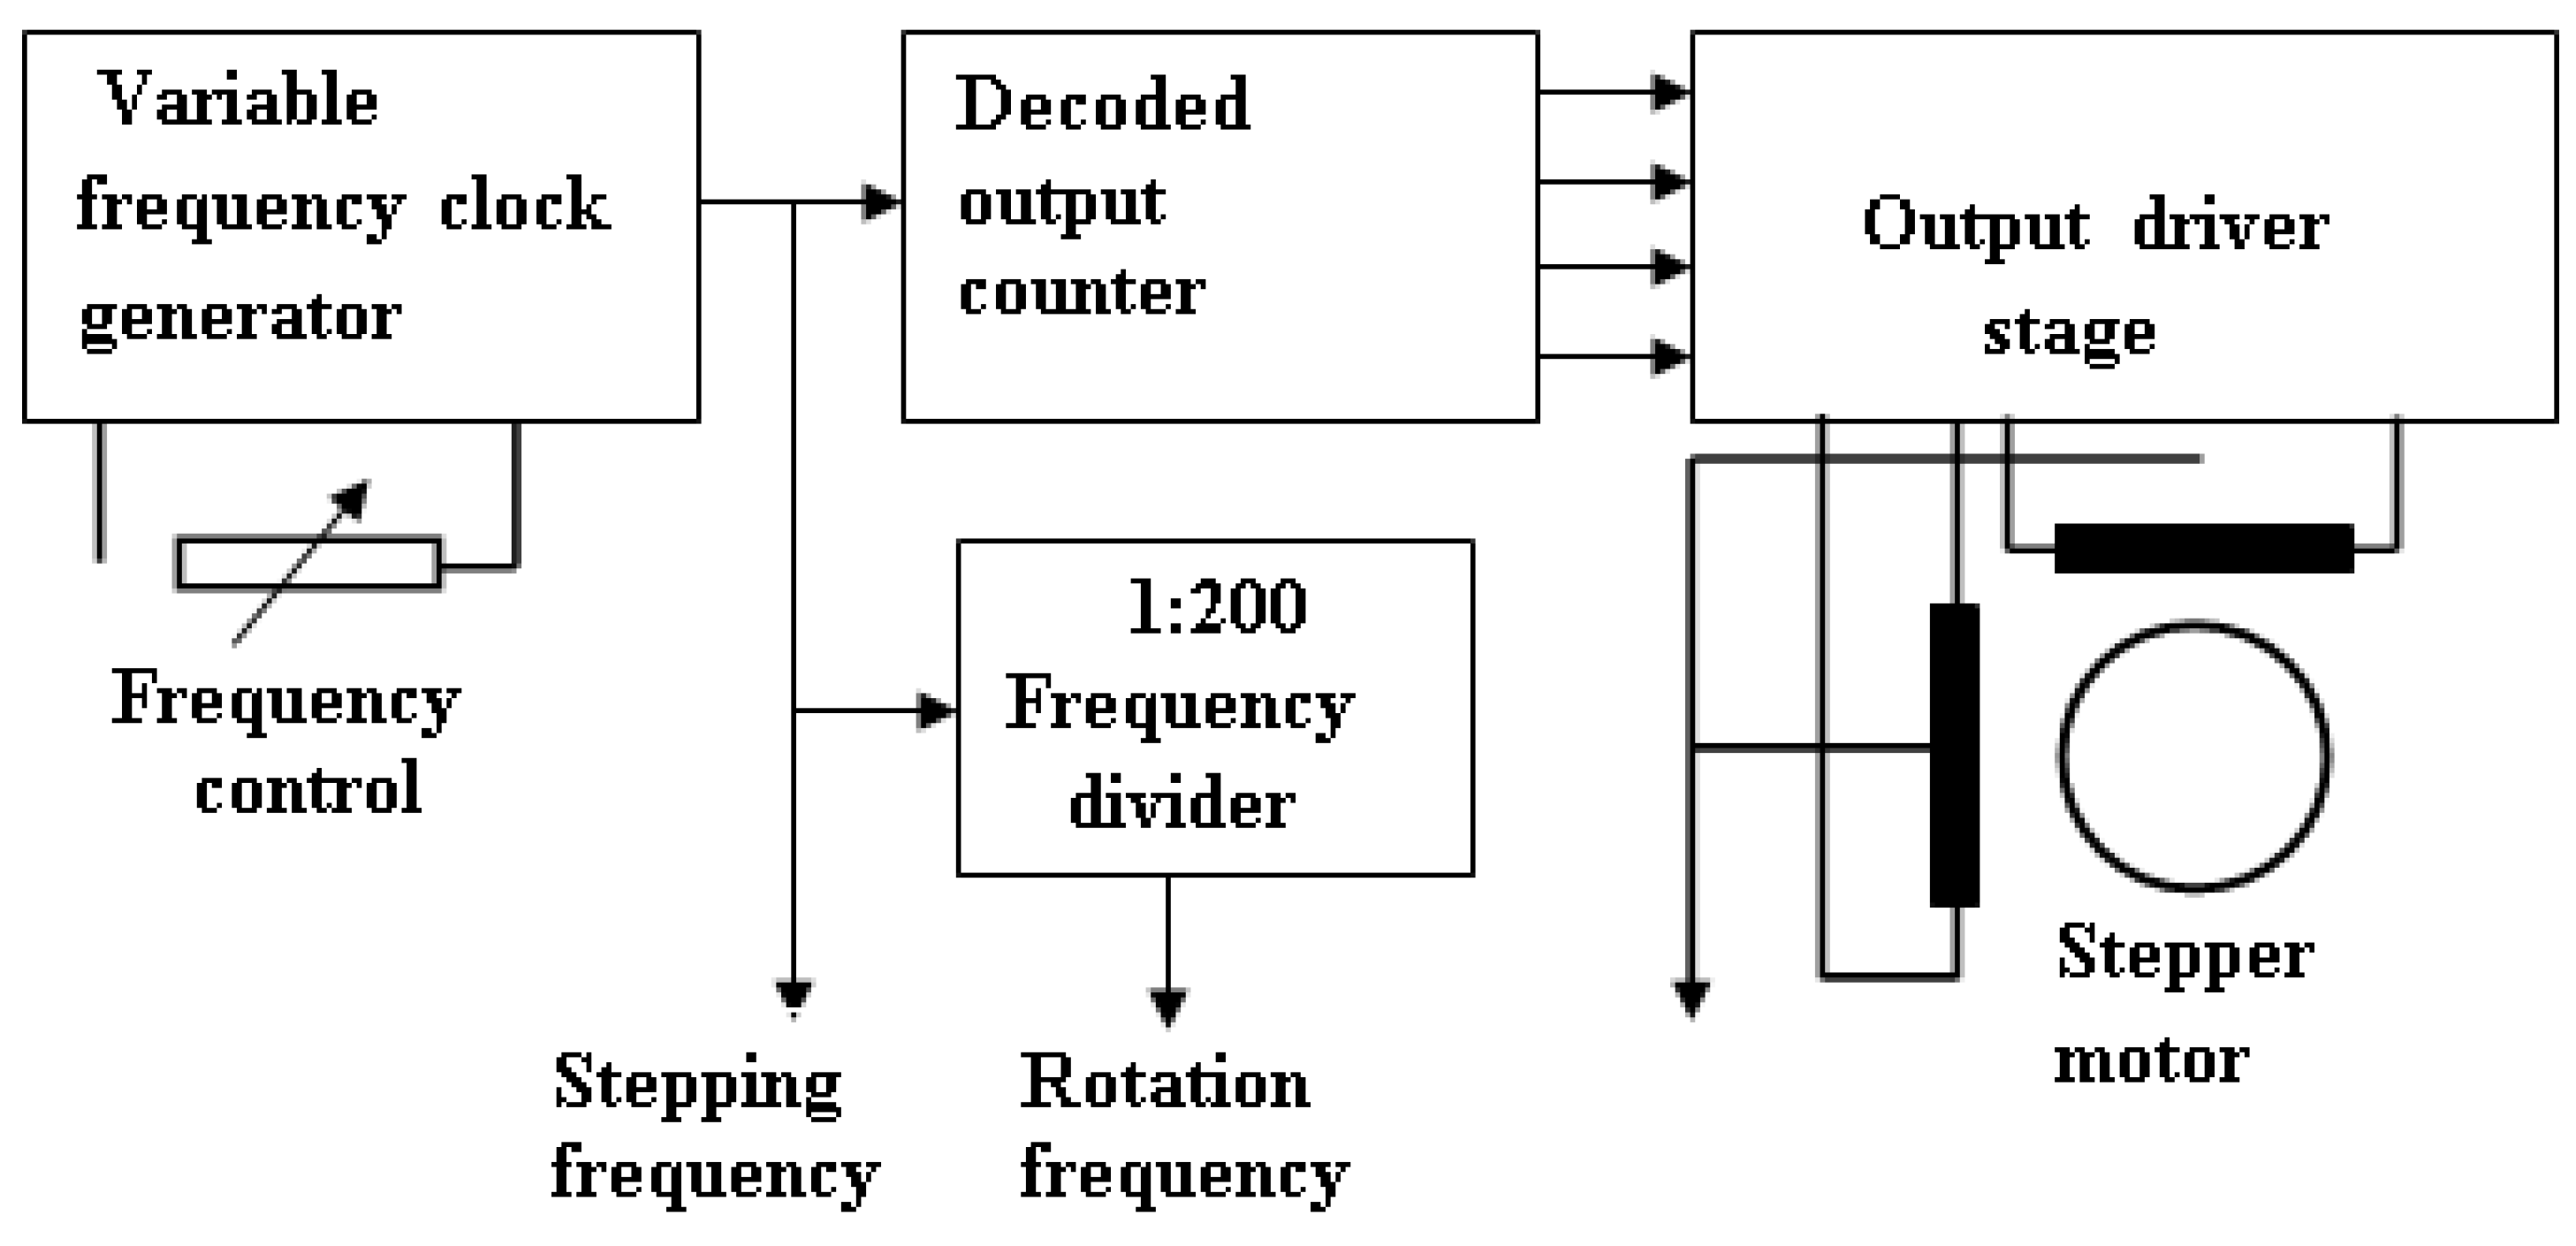
7, to obtain a bigger polar mass moment of inertia. In order to obtain a non-uniform supply (by small shocks/impulses) of the stepping motor
1, the authors designed a special electronic driving system (see
Figure 9). A variable frequency RC pulse generator determines the stepping frequency, and so the rotational speed of the stepping motor. The maximum frequency of about 1.2
kHz is enough for the experiment; above 700
Hz the stepping motor loses the mechanical synchronization in our set-up. The exact speed can be modified by a precision multi-turn potentiometer.
The value of the clock (stepping) frequency can be measured by an external digital frequency meter. For this purpose, an APPA 99 digital multi-meter was used. The clock pulses get to two counter circuits. A digital divide-by-200 counter is used to obtain the rotation frequency (because the motor has 200 steps for a complete rotation), and to a divide-by-4 counter with decoded outputs, to obtain four shifted pulses, necessary to control the stepping motor. These signals get to the output driver circuits which provide enough power to drive the motor. Due to the non-uniform supply of the stepper motor (by small shocks), the torsional resonance phenomenon will occur in the plastic disk, which leads to high angular amplitudes . These angular/torsional vibrations will be superposed on the regular/nominal rotations of the shaft. Thanks to the soft rubber cylinder 2, the magnitude of became much greater than when directly fixed on the steel shaft. Similarly, with the crankshaft (where the rotation is not perfectly uniform, requiring a flywheel), here the torsional vibrations of the stepper motor’s shaft can be monitored together with the fixed small plastic disc.
Based on the above-described methodology, the authors prepared the small disk by spraying it with water-soluble paint (see
Figure 10).
After the calibration, using a special target, how, was presented afore, in frontal viewing the first images of the disk in standstill/static condition were captured.
Further, the stepper motor was started and due to its special supply conditions allowing non-uniform rotation, were monitored in its first resonance regime. The area of interest and several significant points (
P0, …,
P7), presenting symmetrical positions (see
Figure 11), were selected and the following point coordinates are mentioned:
;
;
;
.
For the vertically disposed points,
P0, …,
P3, presented interest mainly due to their horizontal displacements
, and for the horizontally disposed ones (
P4, …,
P7) their vertical displacements
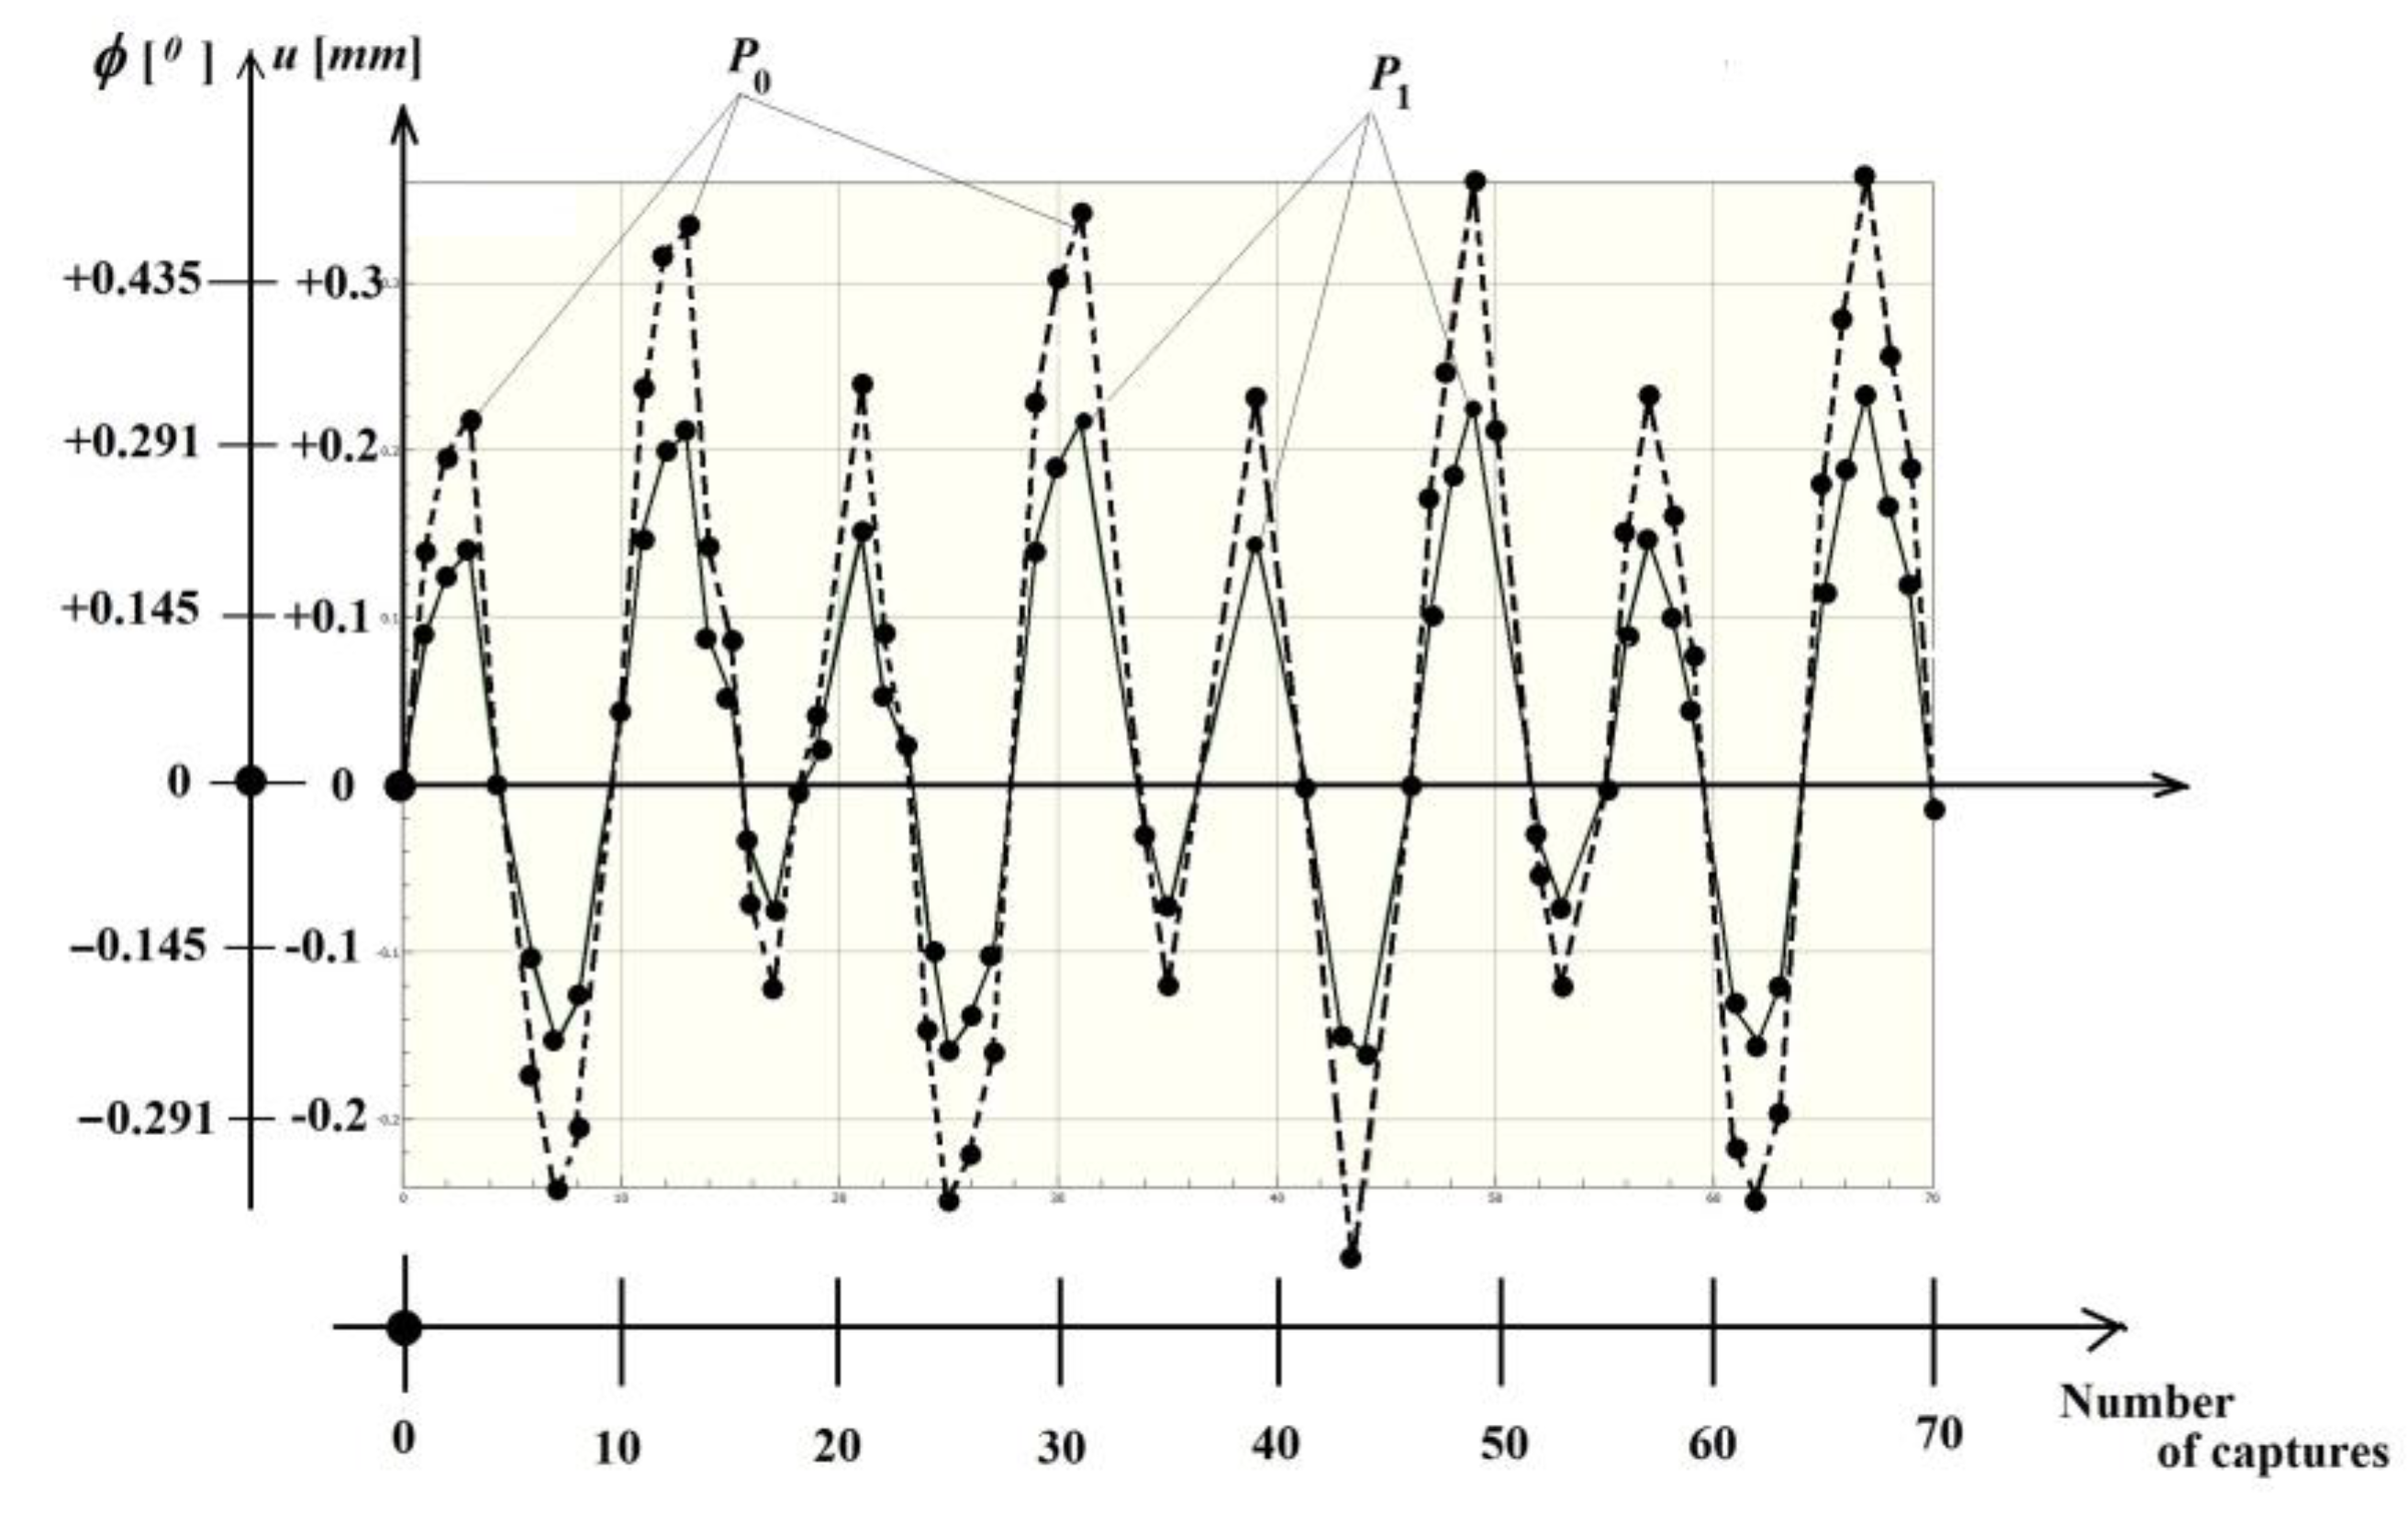
. In
Figure 12 is offered, as illustration, the graphs for
P0 and
P1.
On the horizontal axis are the number of the captured images and on the vertical one are the obtained horizontal direction’s displacements , having amplitudes up to approx. 0.38 mm, as well as their correspondent angular (torsional) displacements with their amplitudes up to .
Taking an
magnitude value (better/it is recommended) of
of the point
, the corresponding
angular amplitude will be:
or:
It is known [
7] the correlation between the angular displacement
, shaft’s length
, torsional modulus of stiffness
, which for the circular or tubular cross sections becomes
and the corresponding torque moment
, i.e.,
Respectively, for the circular/tubular cross-sections:
Became possible to evaluate the corresponding tangential (shear)
stress state:
where:
We have: the conventional second-order of moment inertia for torsion; —the polar moment of inertia; —the polar strength modulus; —the shaft’s radius, respectively —the torsional strength modulus in the general case.
Even the used/involved CCD cameras had a relatively low resolution and the results prove the VIC system’s accuracy and efficiency. Based on [
3], the VIC is typically accurate to
. If one has to monitor a viewing field of
, using the same cameras with 1.4
Mpx, a correspondence factor of
results; taking a smaller viewing field, i.e., in this case of approx.
, one obtains
times higher accuracy. Under normal conditions, the lighting system is usually room-light and the recommended maximal frequency is
. Using halogen lighting, this becomes
, and in the case of common stroboscope lighting becomes
. Finally, in the case of the ultra-bright stroboscope, it can achieve
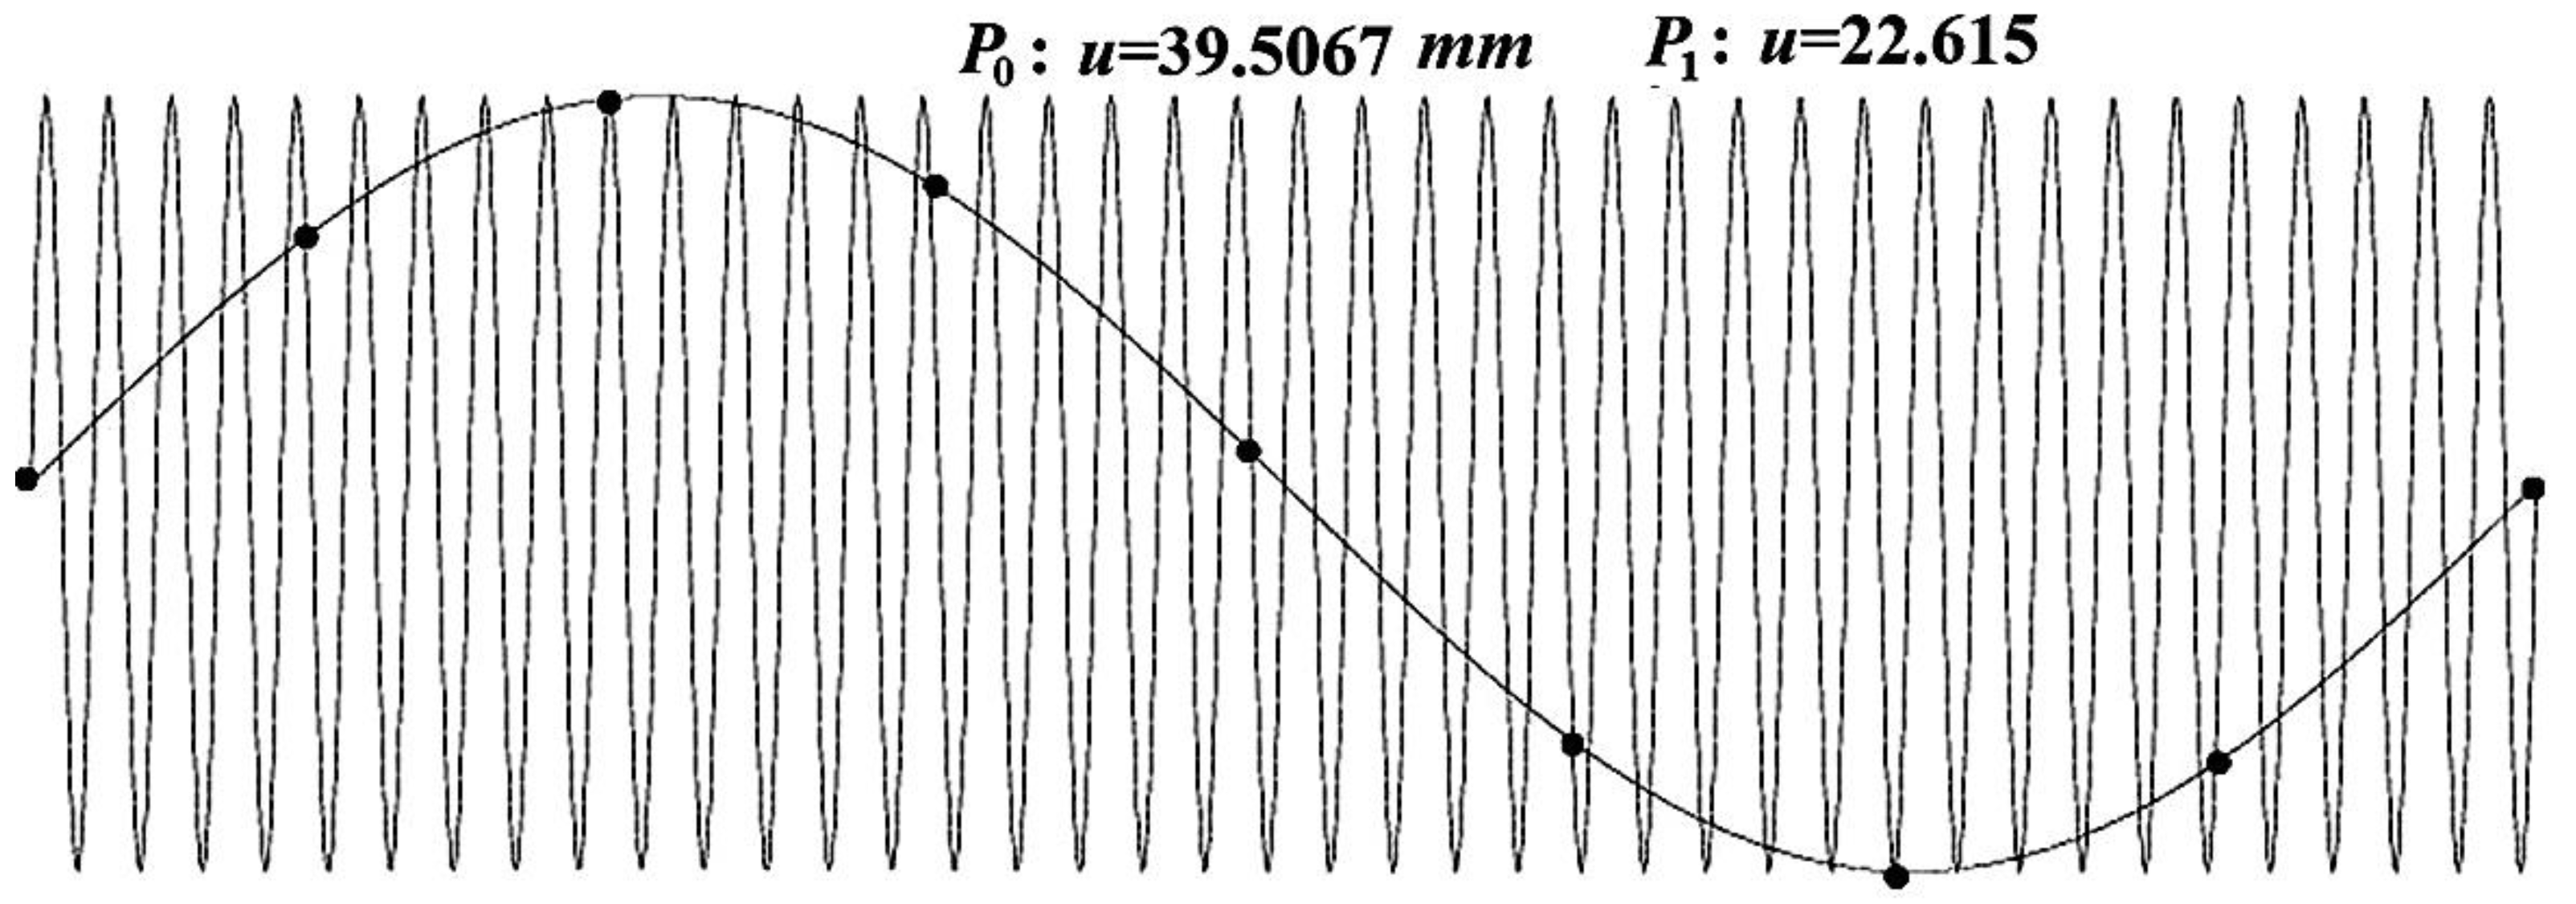
. As a conclusion, under normal (continuous) lighting and by triggering (with a high-accuracy timing device included in the VIC system) corresponding images are captured in strobo-mode (see
Figure 13, red-marked points) with very high-fidelity results. In the horizontal axis is offered the time, and in the vertical one, the real oscillation’s phenomenon; the red points correspond to the captured images momentums. Consequently, the CCD cameras will capture images only after a well-defined time (with a relatively low frame rate), but with very high-accuracy timing. This capturing protocol will successfully substitute the high-speed cameras (thanks to the system’s high-accuracy timing), even if one skips several cycles before advancing to the next phase (next image capturing), because the signal tracking is highly accurate due to the phase-locking logic.
In order to use this facility correctly and efficiently, the operator must follow these steps:
- -
Before starting the experimental measurements, the VIC software asks us to specify from how many points we want to reconstruct a complete rotation (from 10, 15, or 50 measuring points/sampling rate);
- -
After this information is provided, the internal timer (of very high precision of the order of a few ps = picoseconds) will divide the angle 360° into as many equal parts ;
- -
Additionally, with the help of the internal stroboscopic system of the VIC-3D system, the frequency of oscillations in stationary mode can be adjusted very precisely, when (as is well-known) the image of some pre-marked signs on the disc becomes stationary;
- -
The precise establishment of this working frequency (the stabilized regime of the system) follows the capture of the first image during the rotation (see the first red dot on the diagram in
Figure 13);
- -
Then the software allows the system to perform a well-defined number of complete oscillation cycles and the next image acquisition is made on this last cycle, at a very precise angular offset, corresponding to that angular interval that has been set;
- -
For the third point, the system is also allowed to perform the same complete number of oscillations, plus an additional angular offset .
This feature of the very precise internal timer gives the VIC-3D system the great advantage of tracking vibrational phenomena up to without requiring excessive spaces/memories on the computer, which, in the case of capturing images with the size of several Mpxs at these frequencies would lead to the rapid blocking of the acquisition system.
After completing the capture of the n images, the software signals the complete realization of the acquisition and, thus, a system with a stabilized working regime will be able to be analyzed in conditions of maximum precision and with a minimum volume of stored data.
In
Figure 13, this number was
, therefore, from eight images captured at very precise angular shifts
, was necessary to reconstruct the vibrating phenomenon.
4. Experimental Measurements on the Flange of the Truck’s Adder Box Disc
Based on what was analyzed in the previous chapters, the flange of the disc of the adder box was properly prepared, ie., on a well-defined area was applied water-soluble paint (black primer and white stains), also delimiting the area of interest (area of interest).
Figure 14 shows the principle drawing of this flange, together with the significant coordinates.
Figure 15 shows the assembly prepared for VIC-3D measurements, where you can also see the six LEDs, which provided uniform illumination of the area of interest. From the constructive solution of the summing box the dimensions
and
, respectively, are known. This last dimension
is indicative, because, on the first set of captured images, related to the rest state of the disk, the point
had data coordinates with submicron precision, later used by software in calculating angular displacements, according to relation (1, b).
The measurement protocol involved the following steps:
- -
The spray was applied in the area of interest to obtain those stains with random distribution and dimensions;
- -
With the help of the special plate, mentioned before, the calibration of the VIC-3D system was performed; the calibration plate is chosen according to the distance between the cameras and the analyzed objective (ie., the observation distance), the size of the spots applied, as well as the optical system used (the objectives and the type of video cameras used);
- -
The first set of images of the disc at rest is recorded;
- -
The left engine is started, and after identifying the nominal working speed and setting, the number of images to form the cycle of oscillations, make the capture of the appropriate number of images while the engine is running at the set operating mode. Here, instead of strobe lighting, the internal system of the VIC-3D system, presented above, is used, which ensures the same function, but is much more precise;
- -
This set of measurements is repeated, both for the right engine running and for both engines in operation;
- -
The analysis of the sets of images is performed, where the points of interest are positioned for the first time (in this case, from these points it was chosen, for which the software calculates the linear displacements, followed, based on the relation (1, a) to determine the angular oscillations as well.
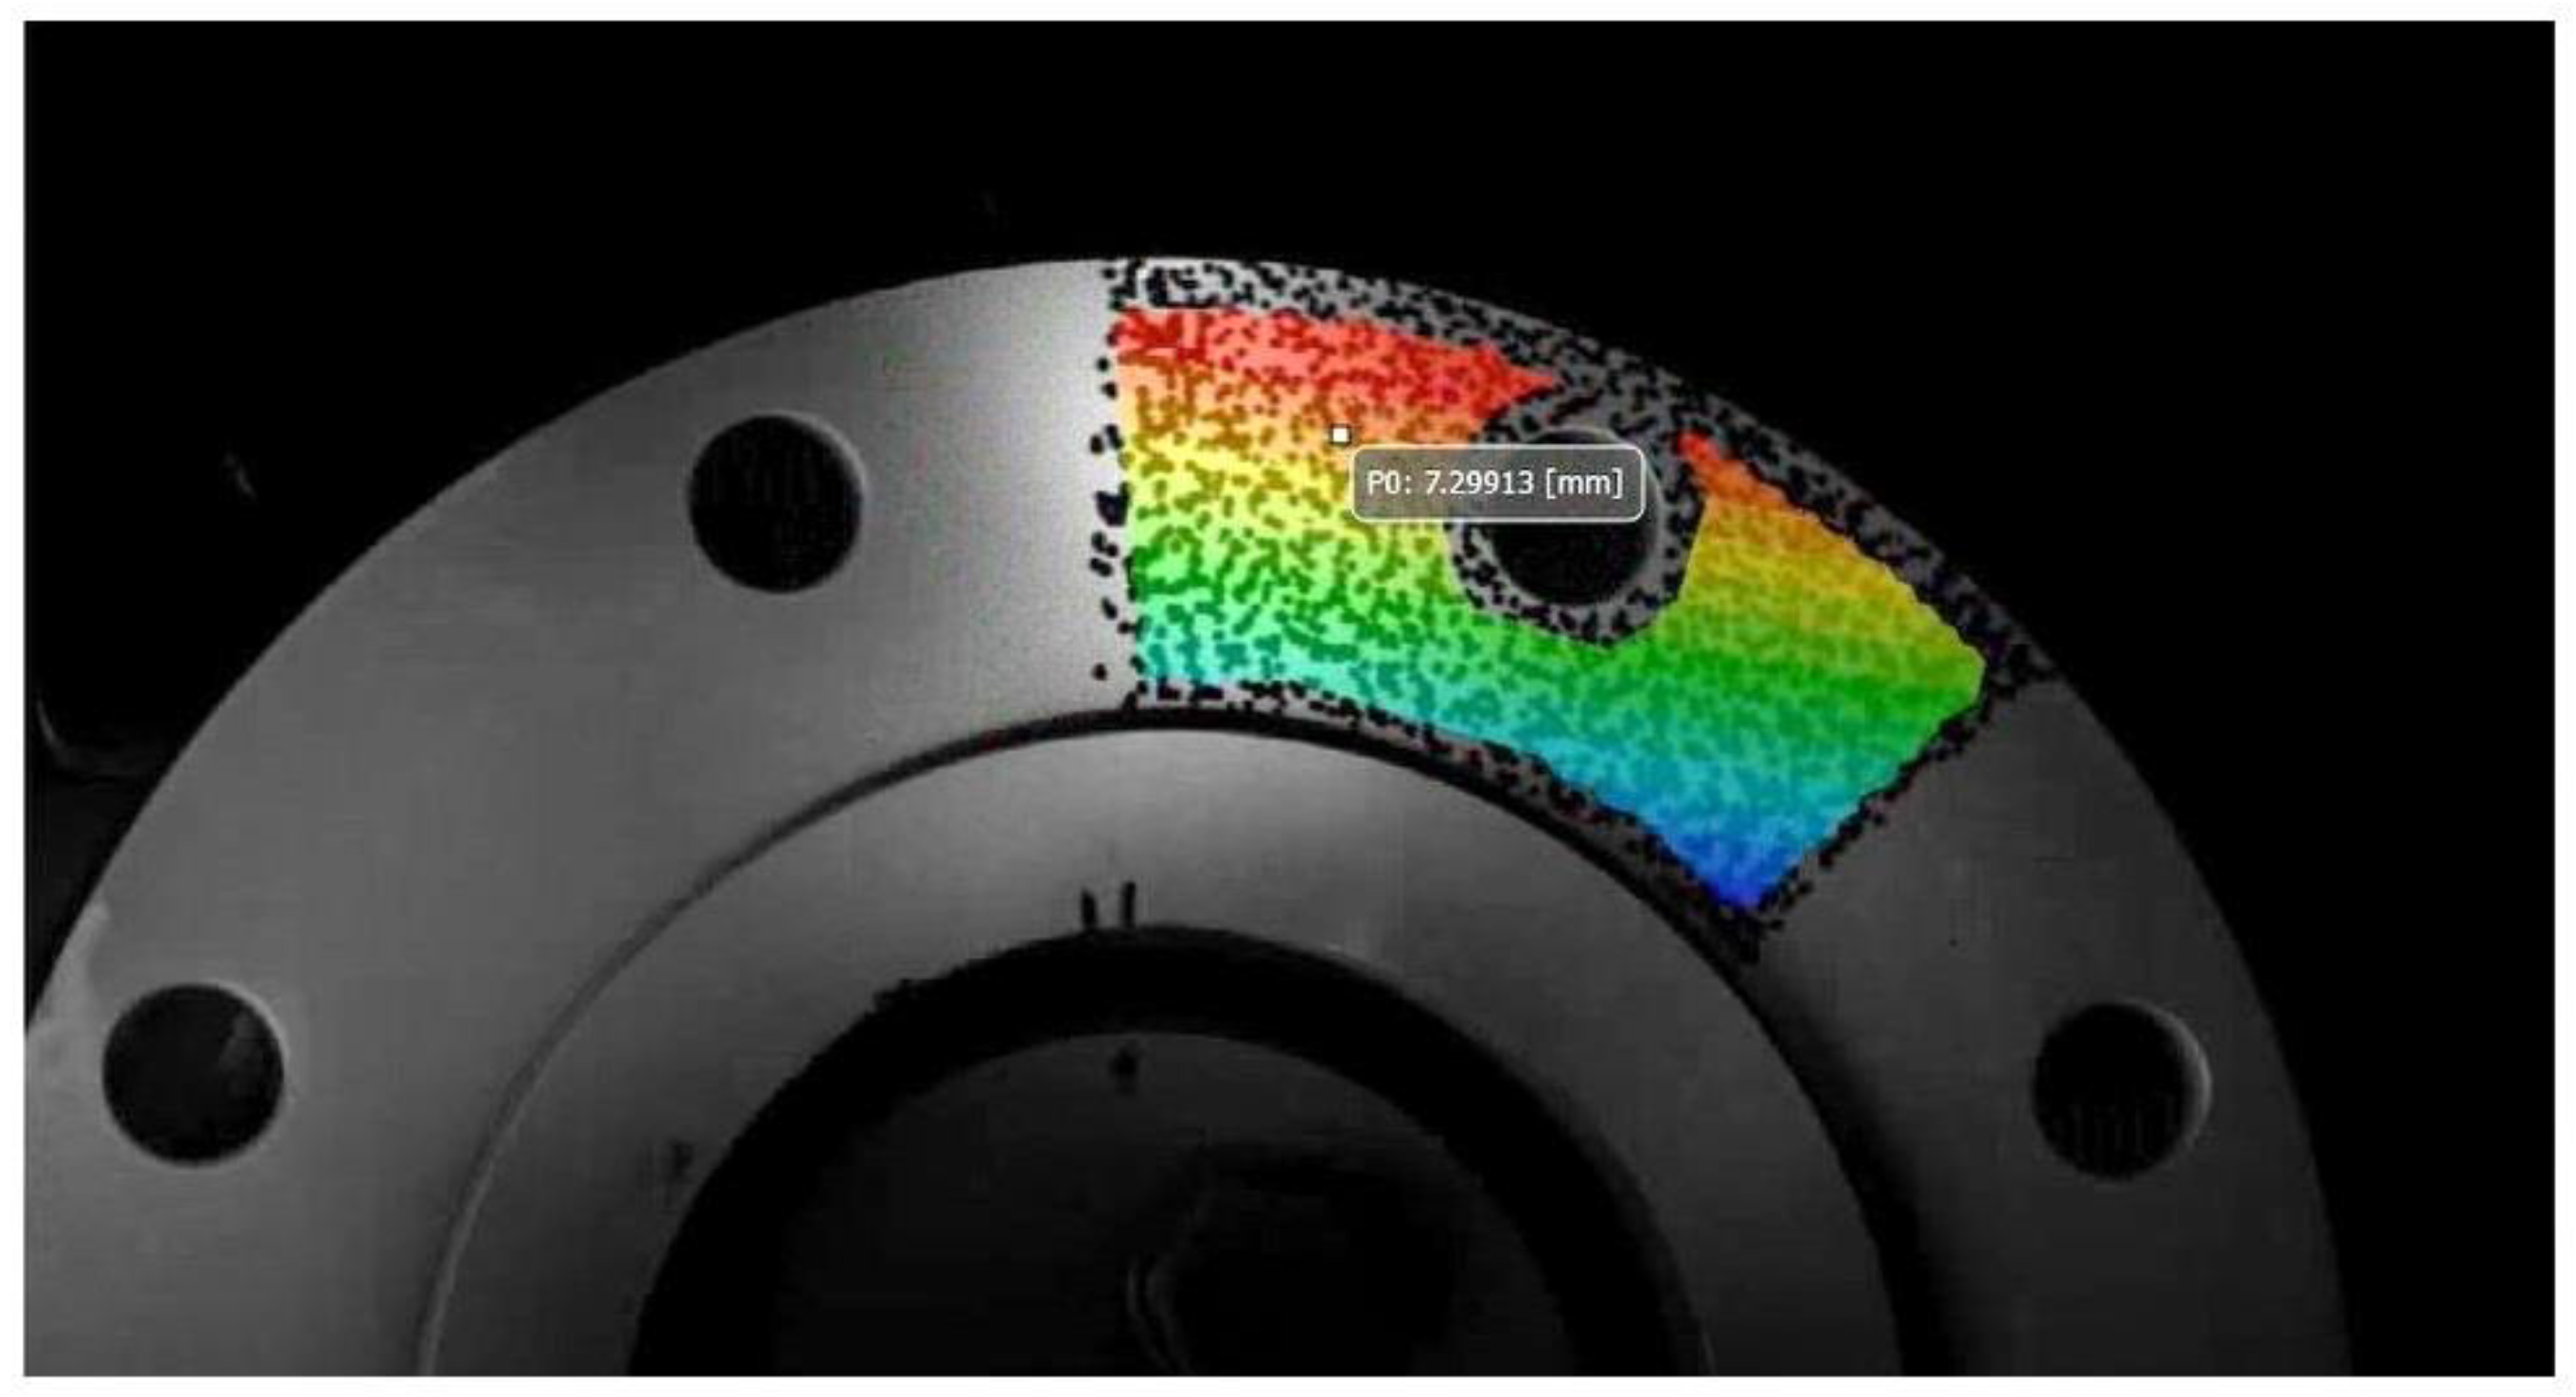
Figure 16 shows the analyzed flange, with the area of interest (area of interest) marked, as well as the magnitude of the linear displacement of the representative point
.
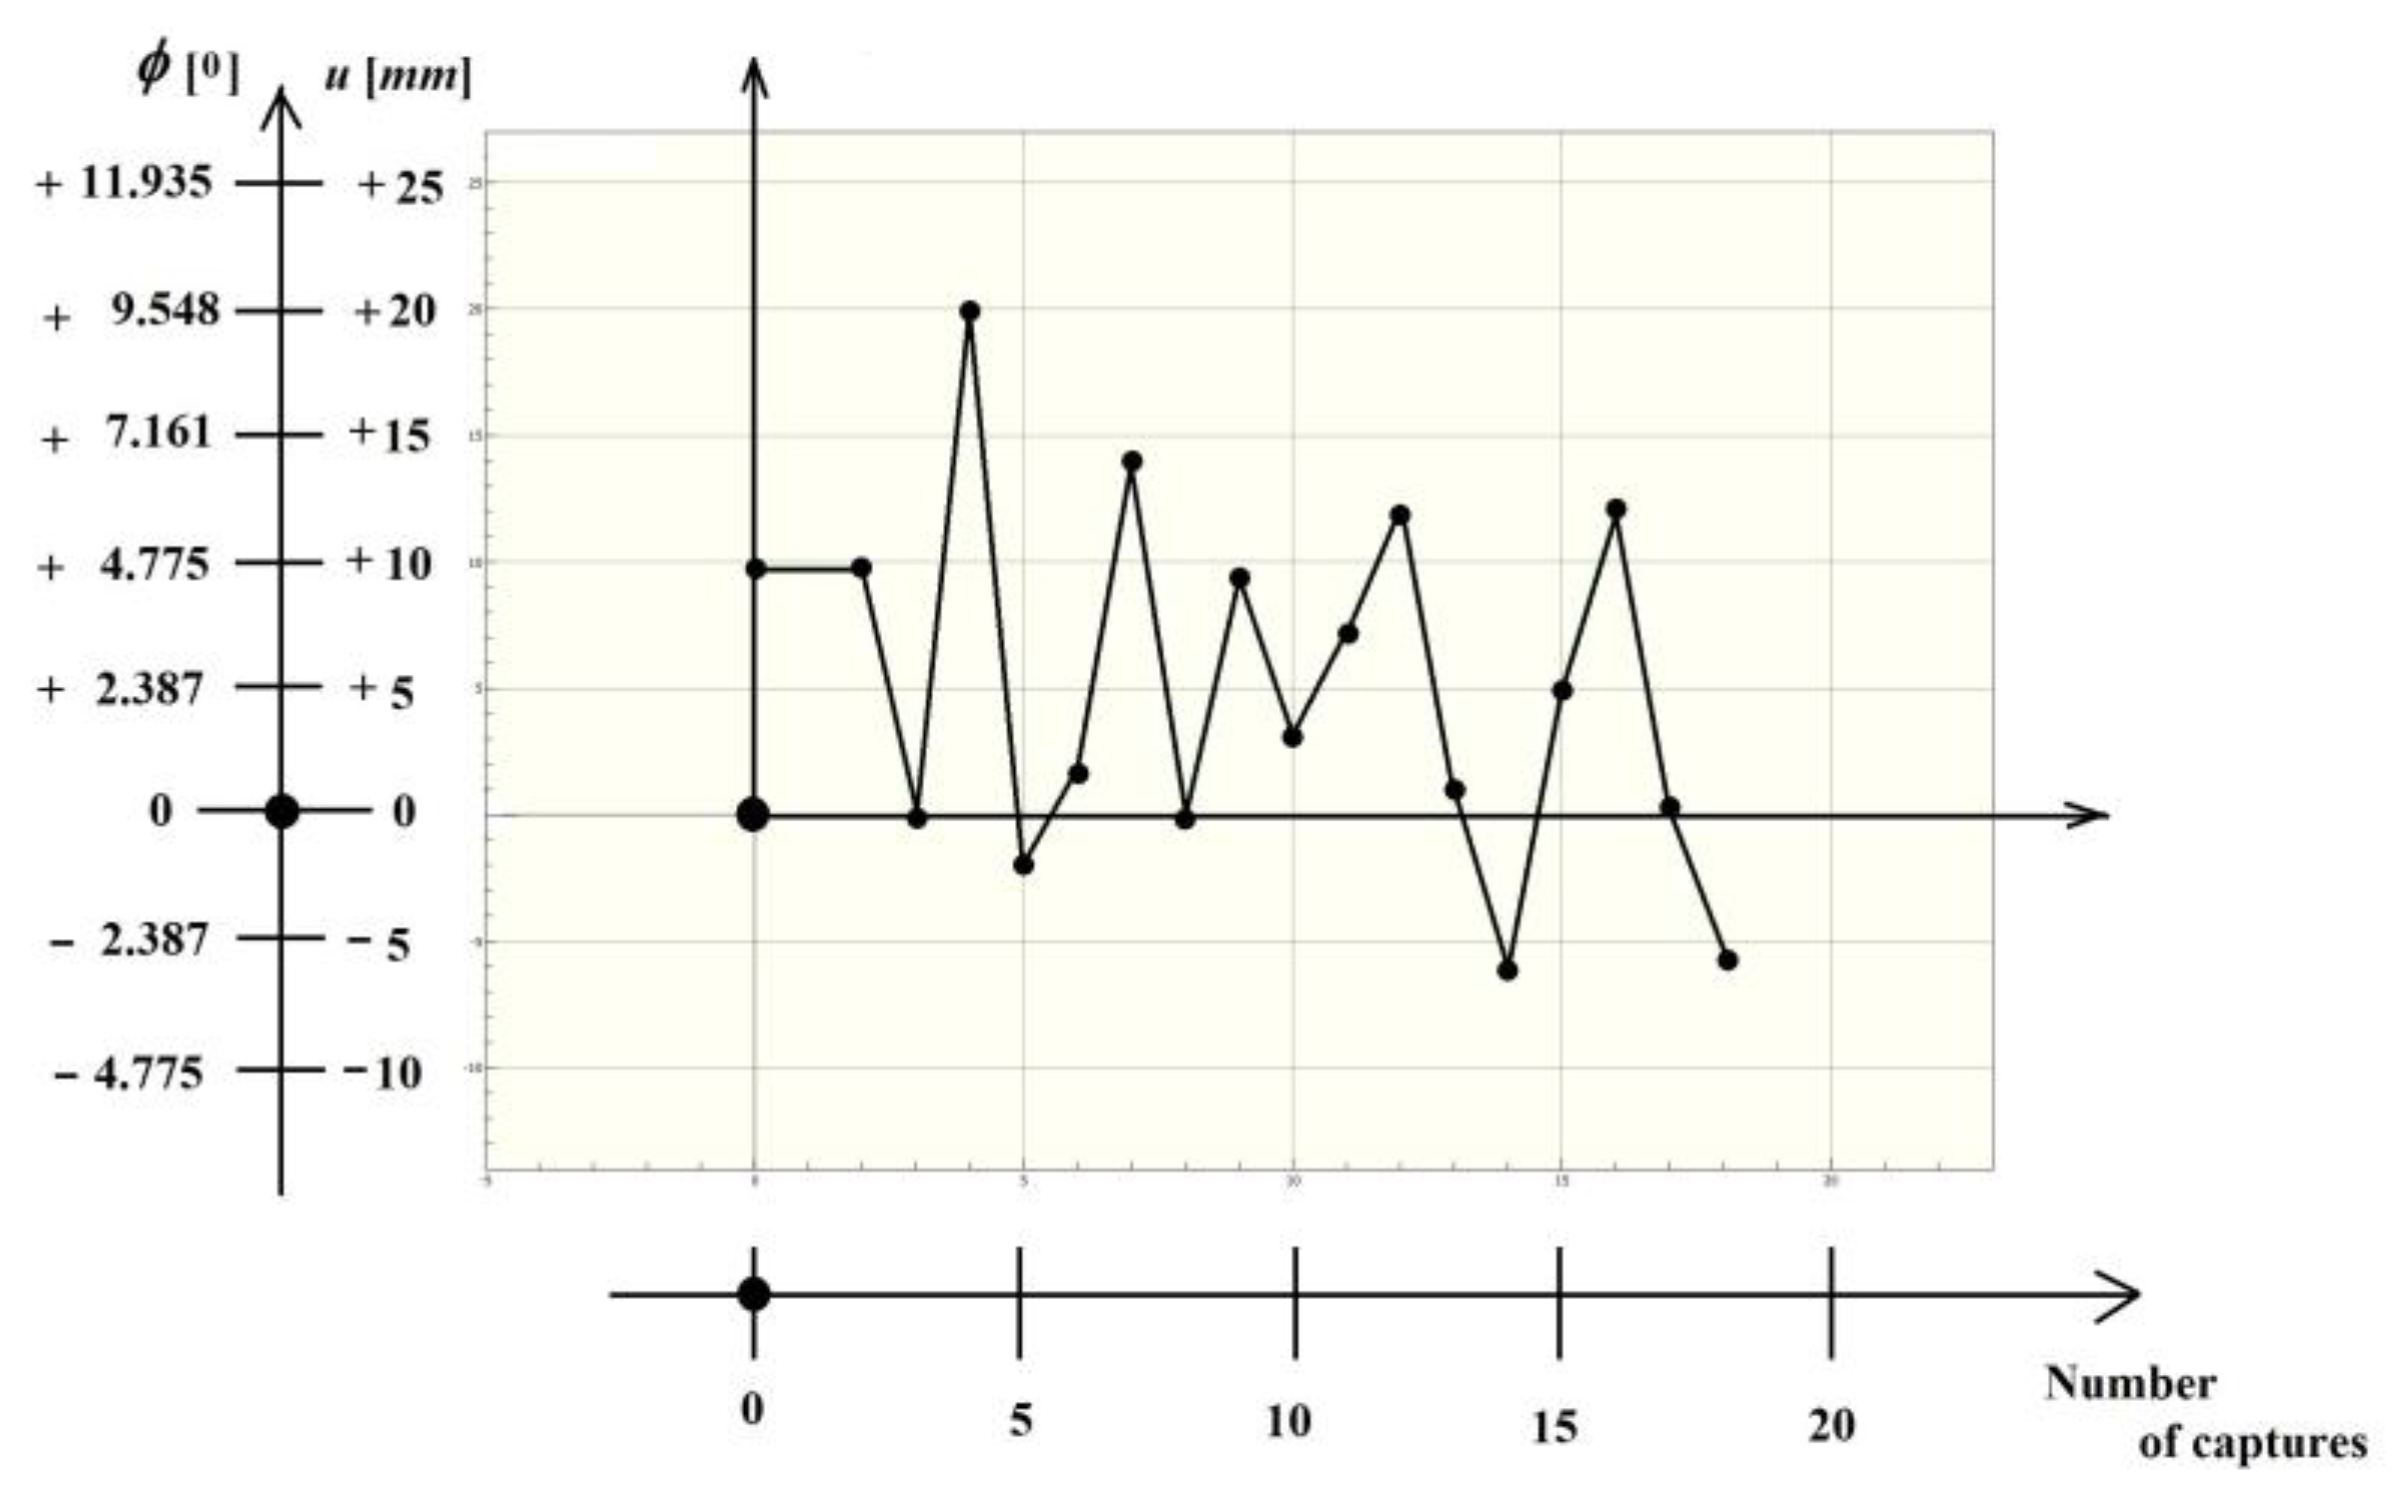
Figure 17 gives the diagram of the variation of both the linear displacement
and the corresponding torsion angle
.
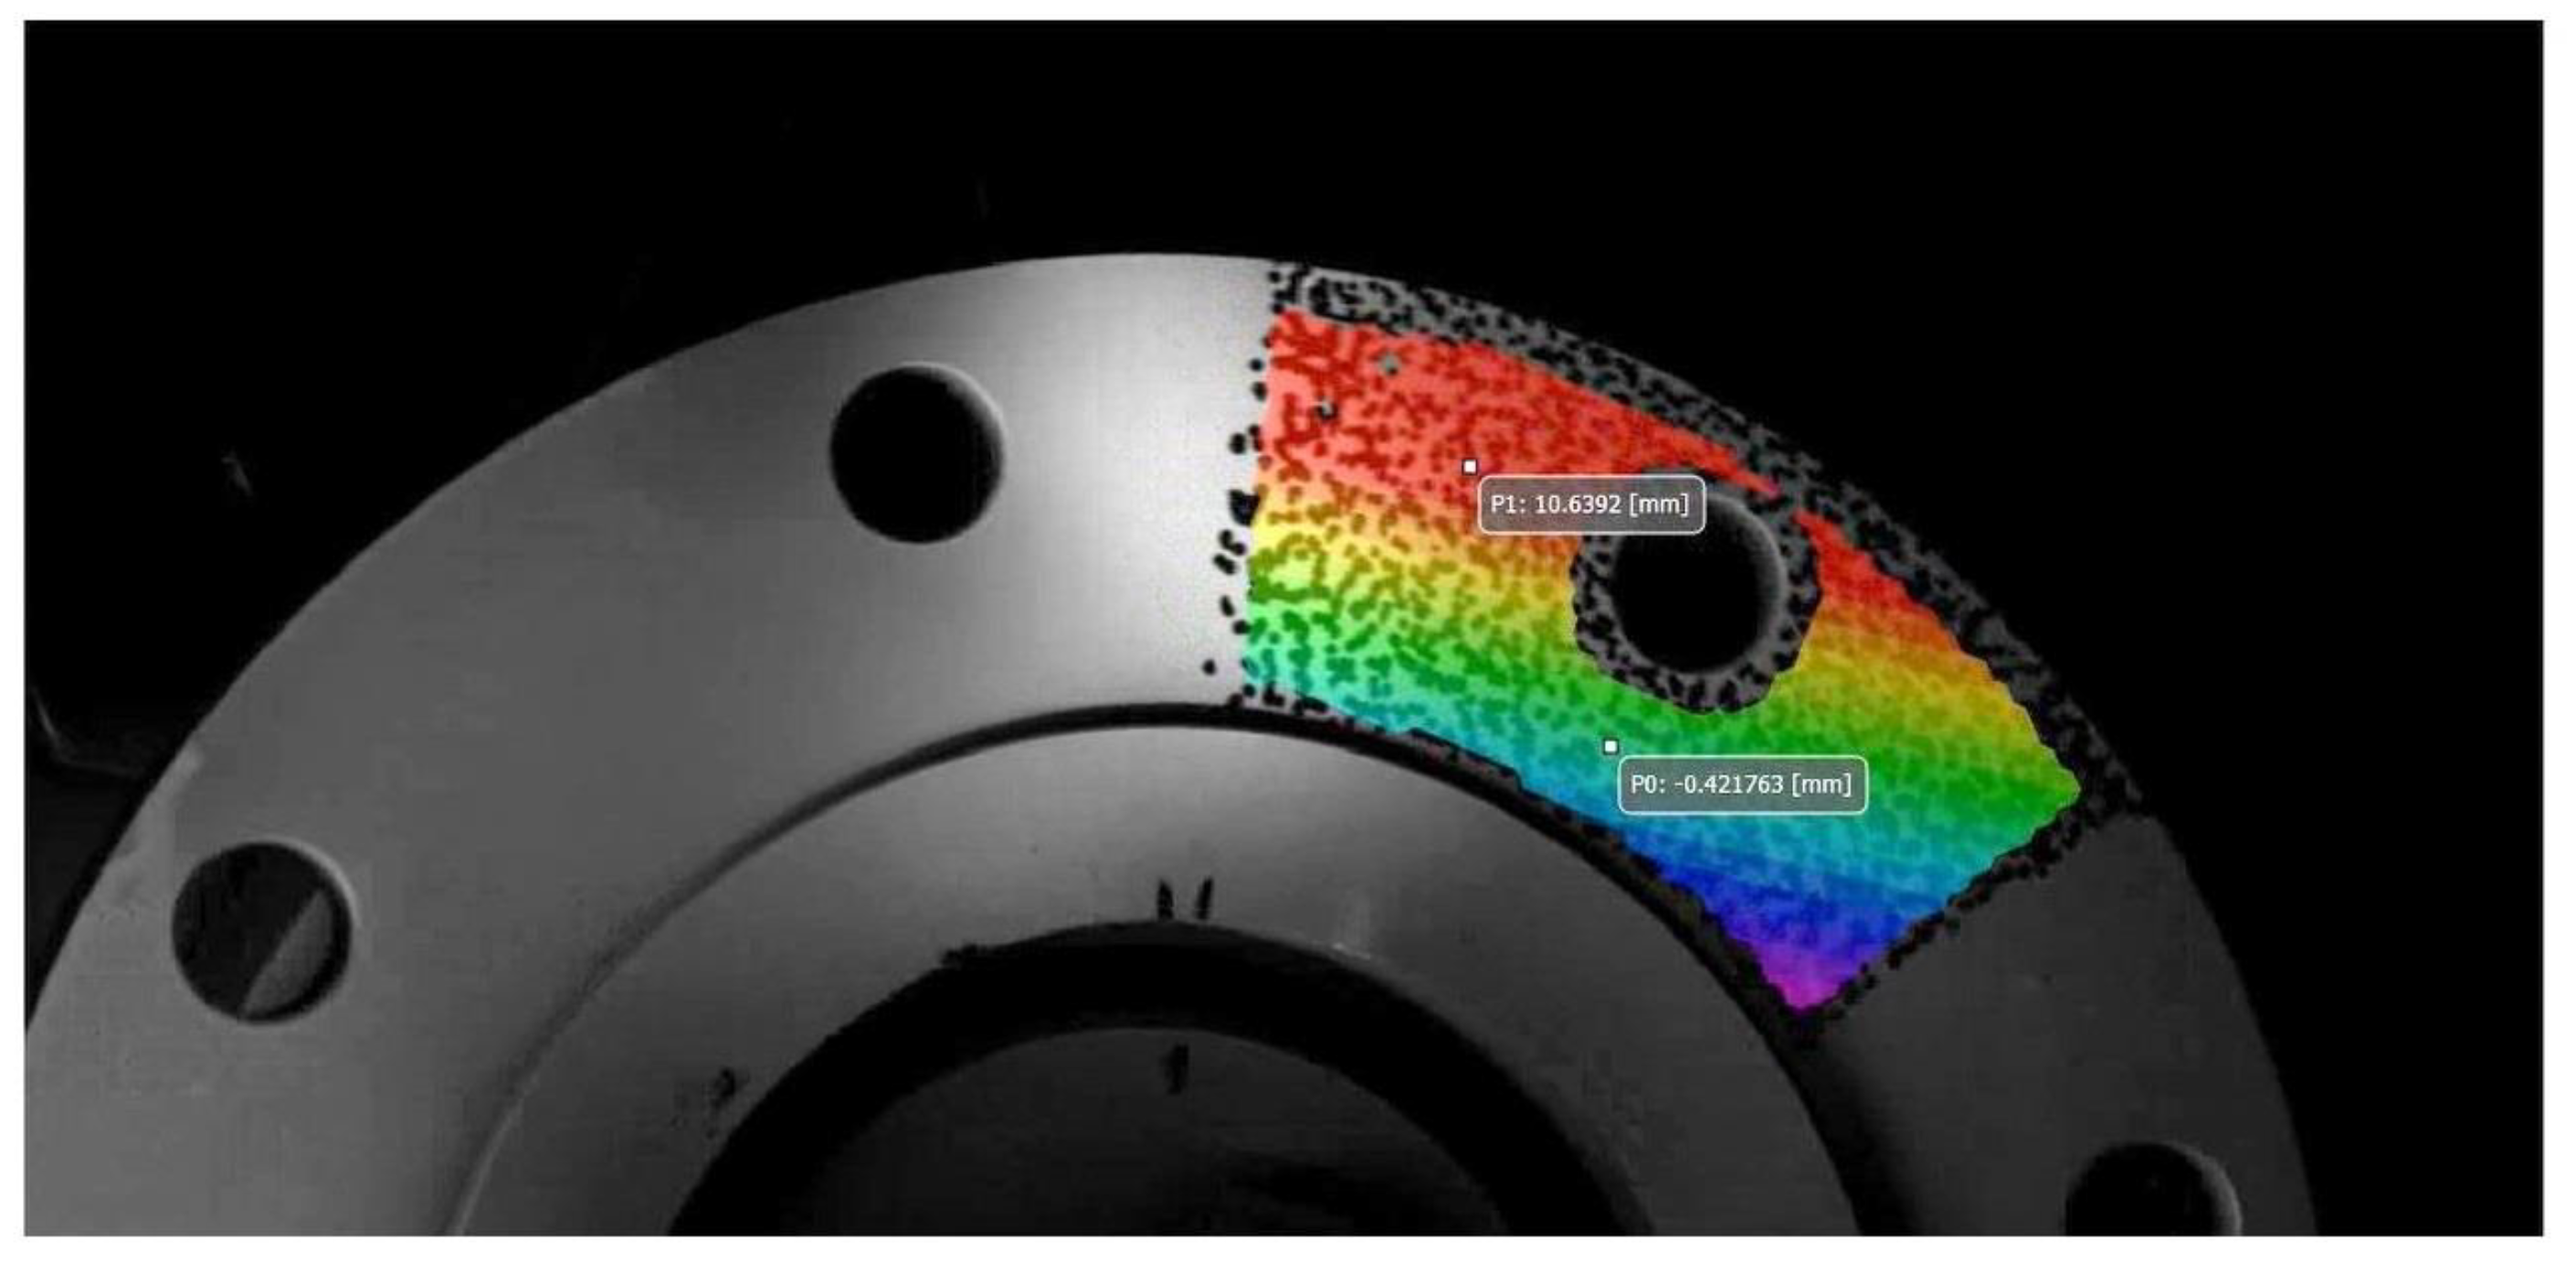
Similarly,
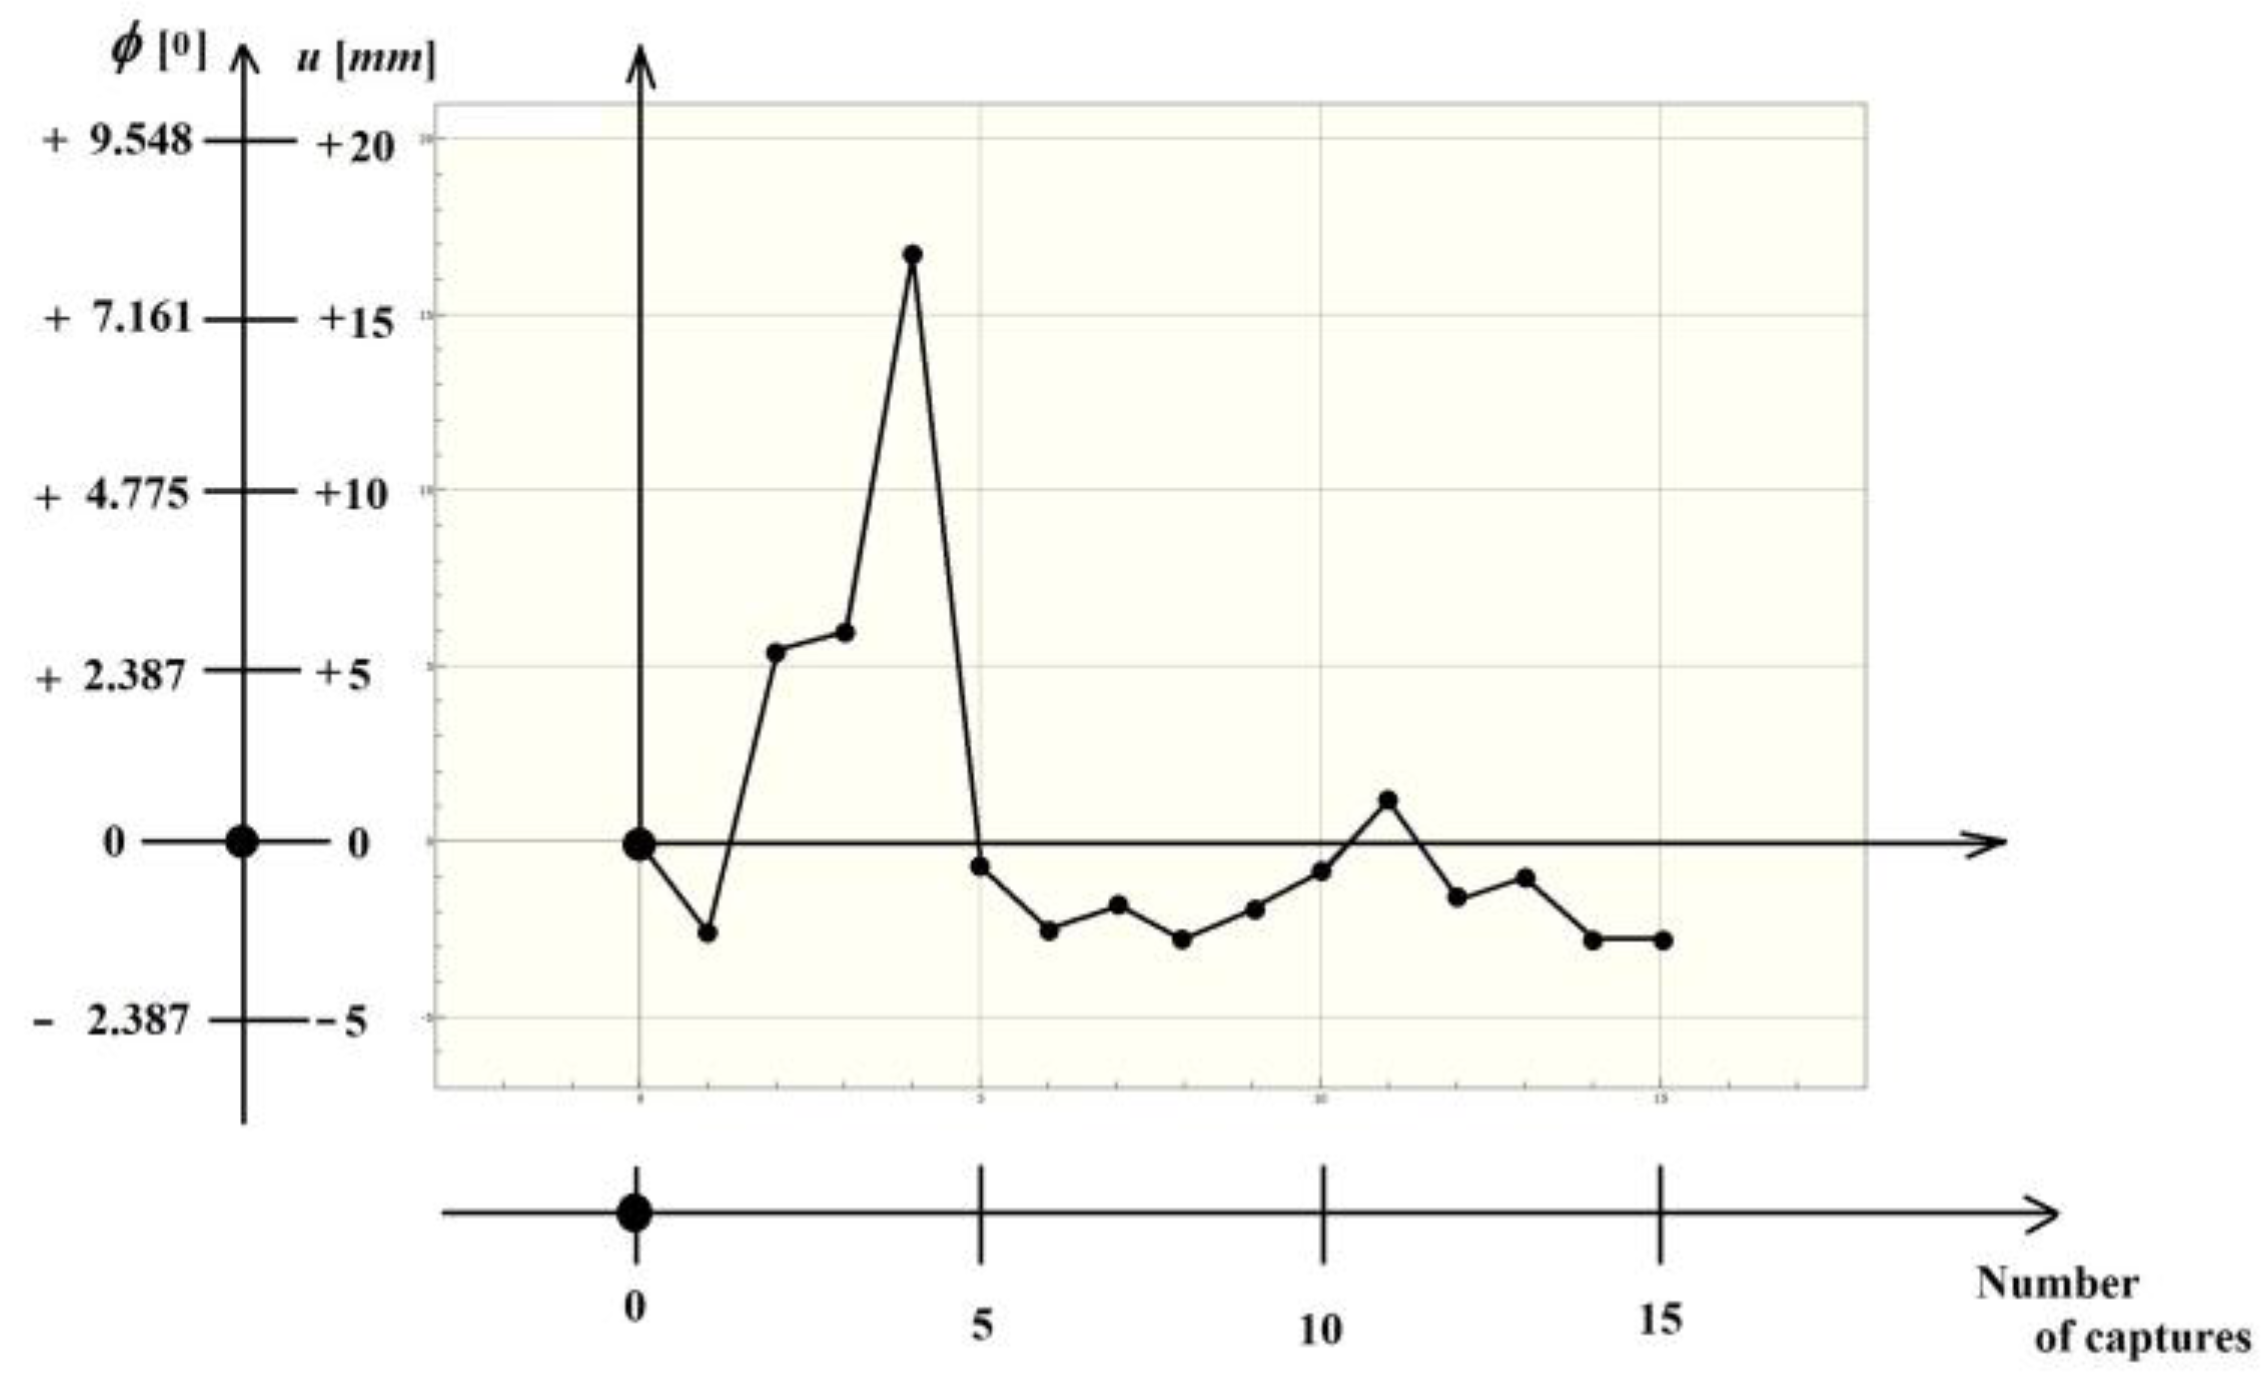
Figure 18 shows the flange analyzed, with the area of interest (area of interest) marked, as well as the magnitude of the momentary linear displacement of the points of area of interest, for the case of solitary operation of the right engine.
Figure 19 provides the variation diagram of both the linear displacement and the corresponding torsion angle, and for the case of the right-hand engine with solitary operation.
Finally, when both engines were running, the image of the area of interest (
Figure 20), respectively, the variation of the linear displacement
and the corresponding torsion angle
(
Figure 21) were obtained.
6. Conclusions
Careful analysis of these graphs shows that these probable cycles are not unitarily defined.
For example, in the case of the single-engine operation on the right, the oscillations are closer to small shocks, while in the other two cases, more periodic effects can be seen. These can be partially explained by the fact that, during operation, the uniformity of the speeds was not perfectly similar in the three cases, there being small deviations in this respect, even if an identical operating regime was imposed (hence, a uniform speed).
These Equations (1)–(3) can be extended for the analysis of some phenomena with angular variations, , of an elastic drive system (which exists before the analyzed flange).
Conclusions can be drawn regarding the more or less uniform operation of the above-mentioned system, depending on the coupling of one or other of the drive motors.


