
Reliability-Based Design Optimization for Reducing the Performance Failure and Maximizing the Specific Energy of Lithium-Ion Batteries Considering Manufacturing Uncertainty of Porous Electrodes


Abstract
:1. Introduction
2. Electrochemical Model-Based on Manufacturing Uncertainty
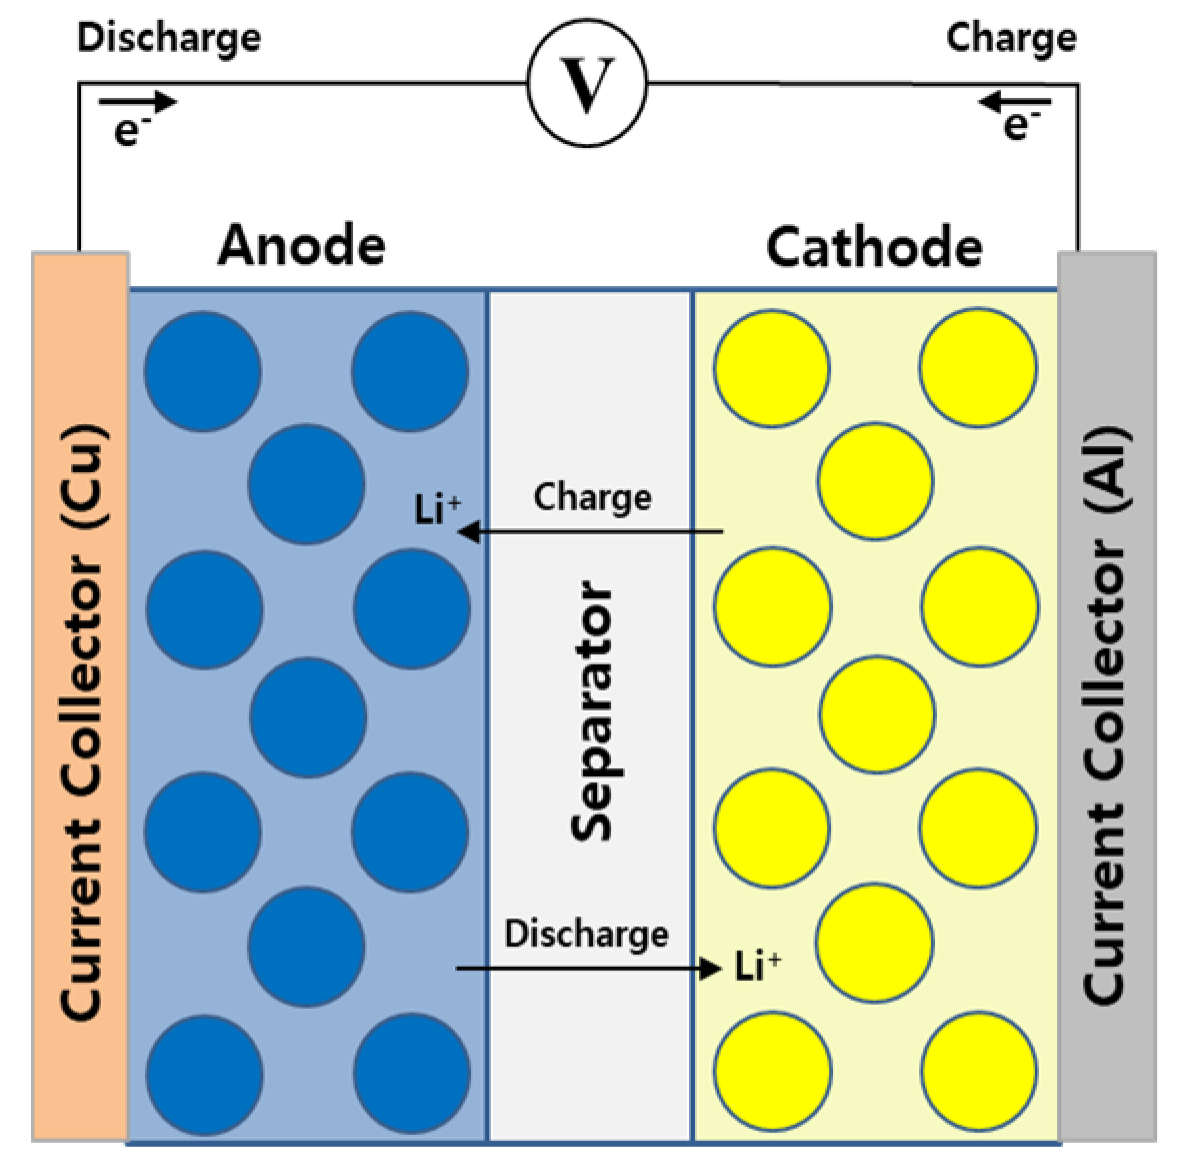
2.1. Electrochemical Model for LIBs
2.2. Manufacturing Uncertainties of LIBs
3. Reliability-Based Design Optimization of LIB
3.1. Reliability Analysis
3.2. Design Variables
3.3. Formulation of Reliability-Base Desgin Optimization (RBDO)
4. Discussion
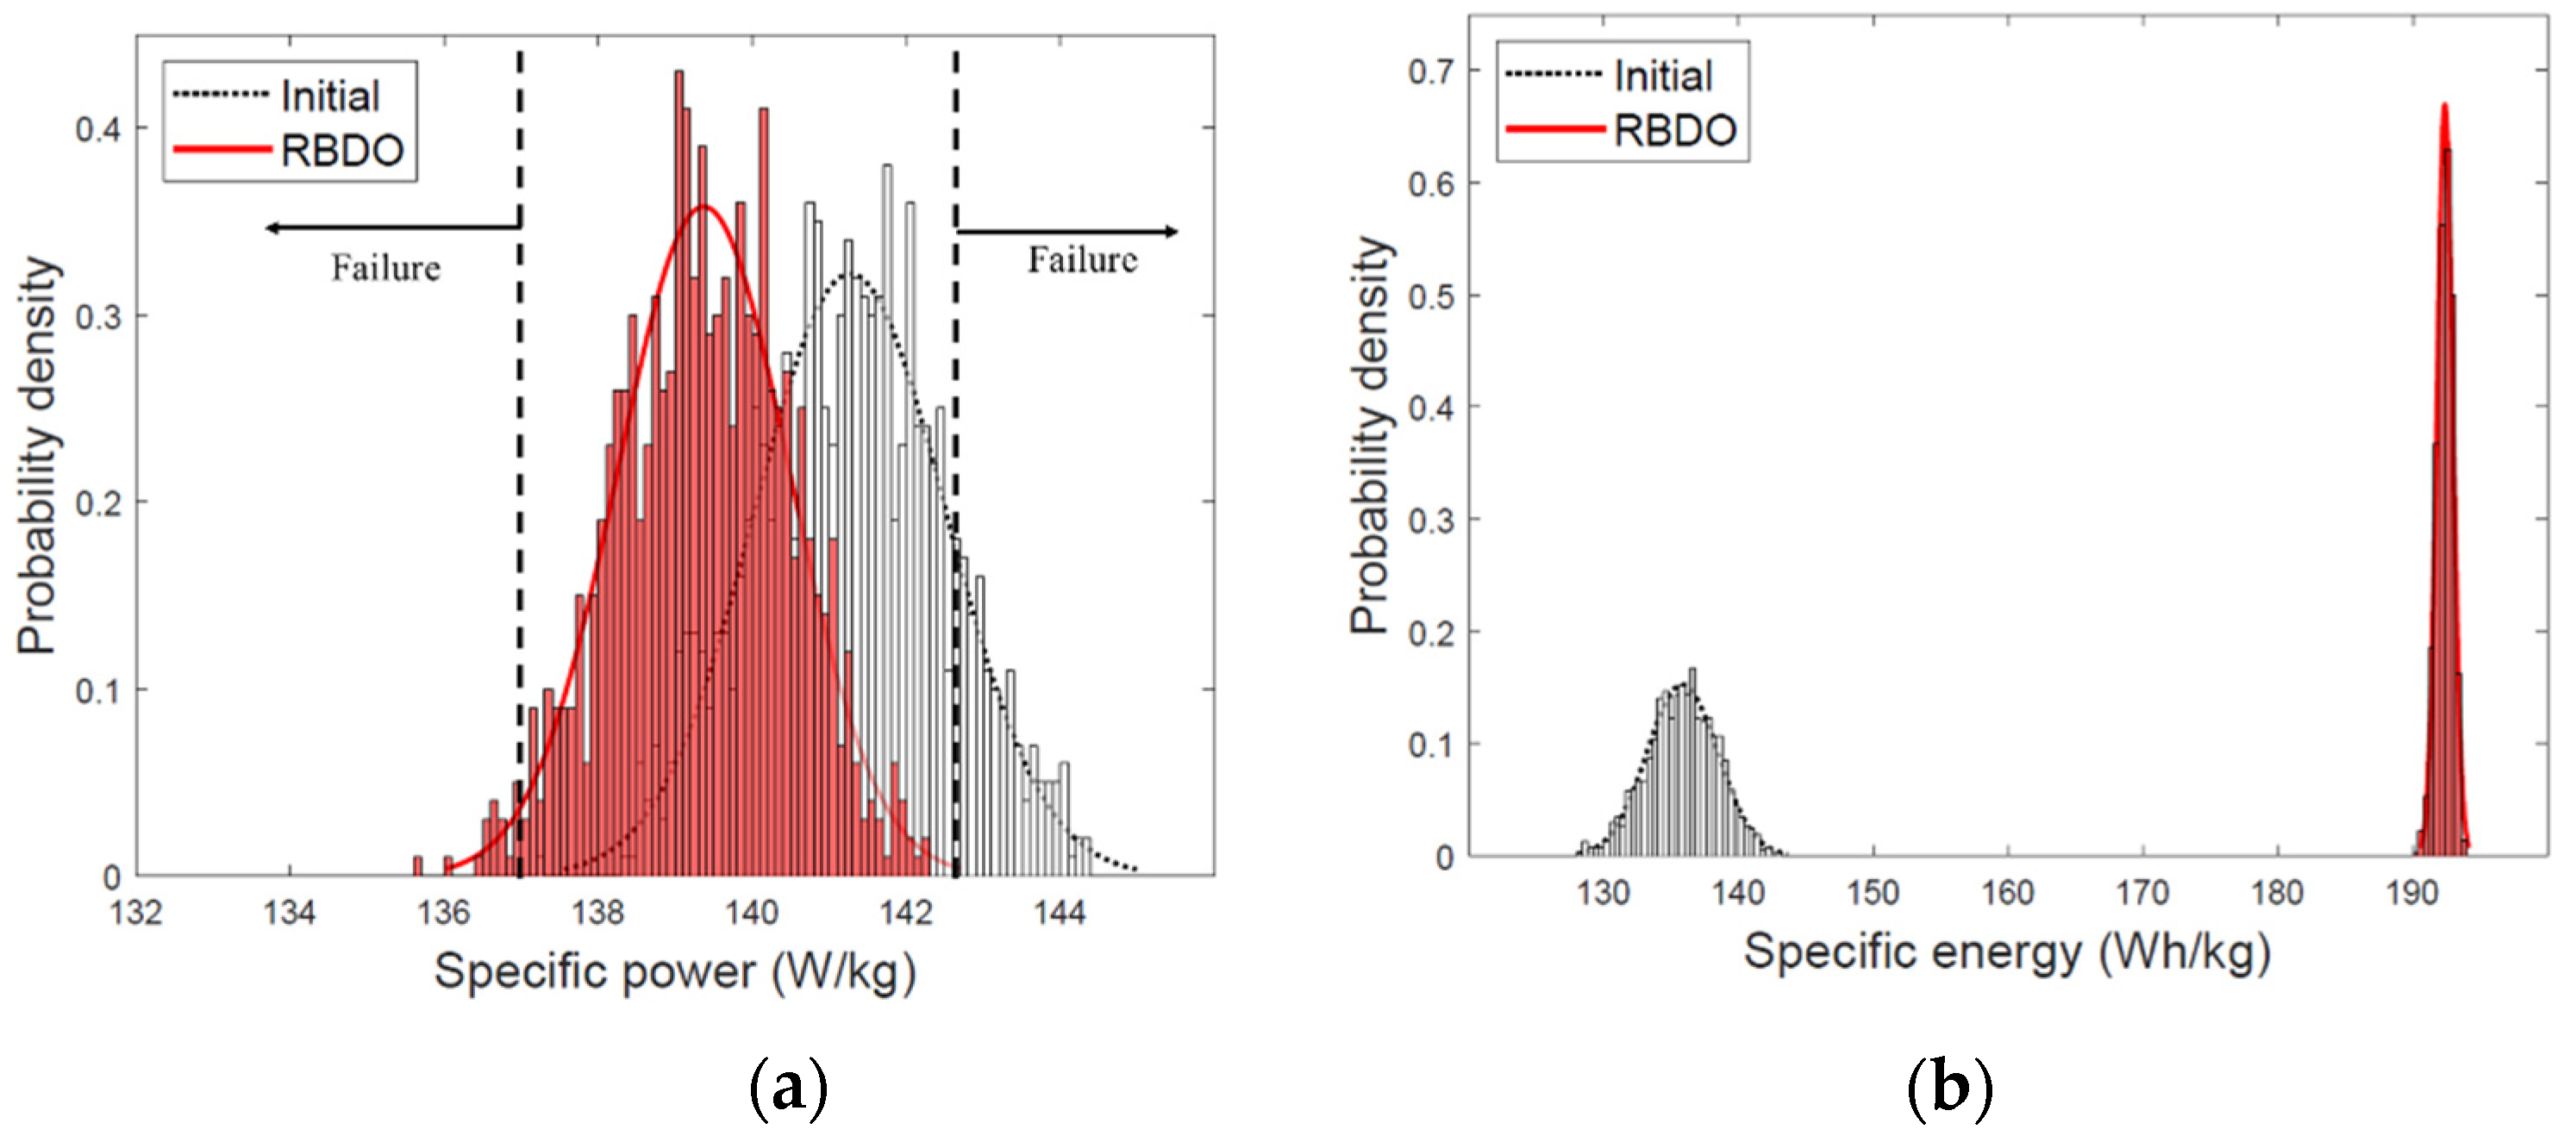
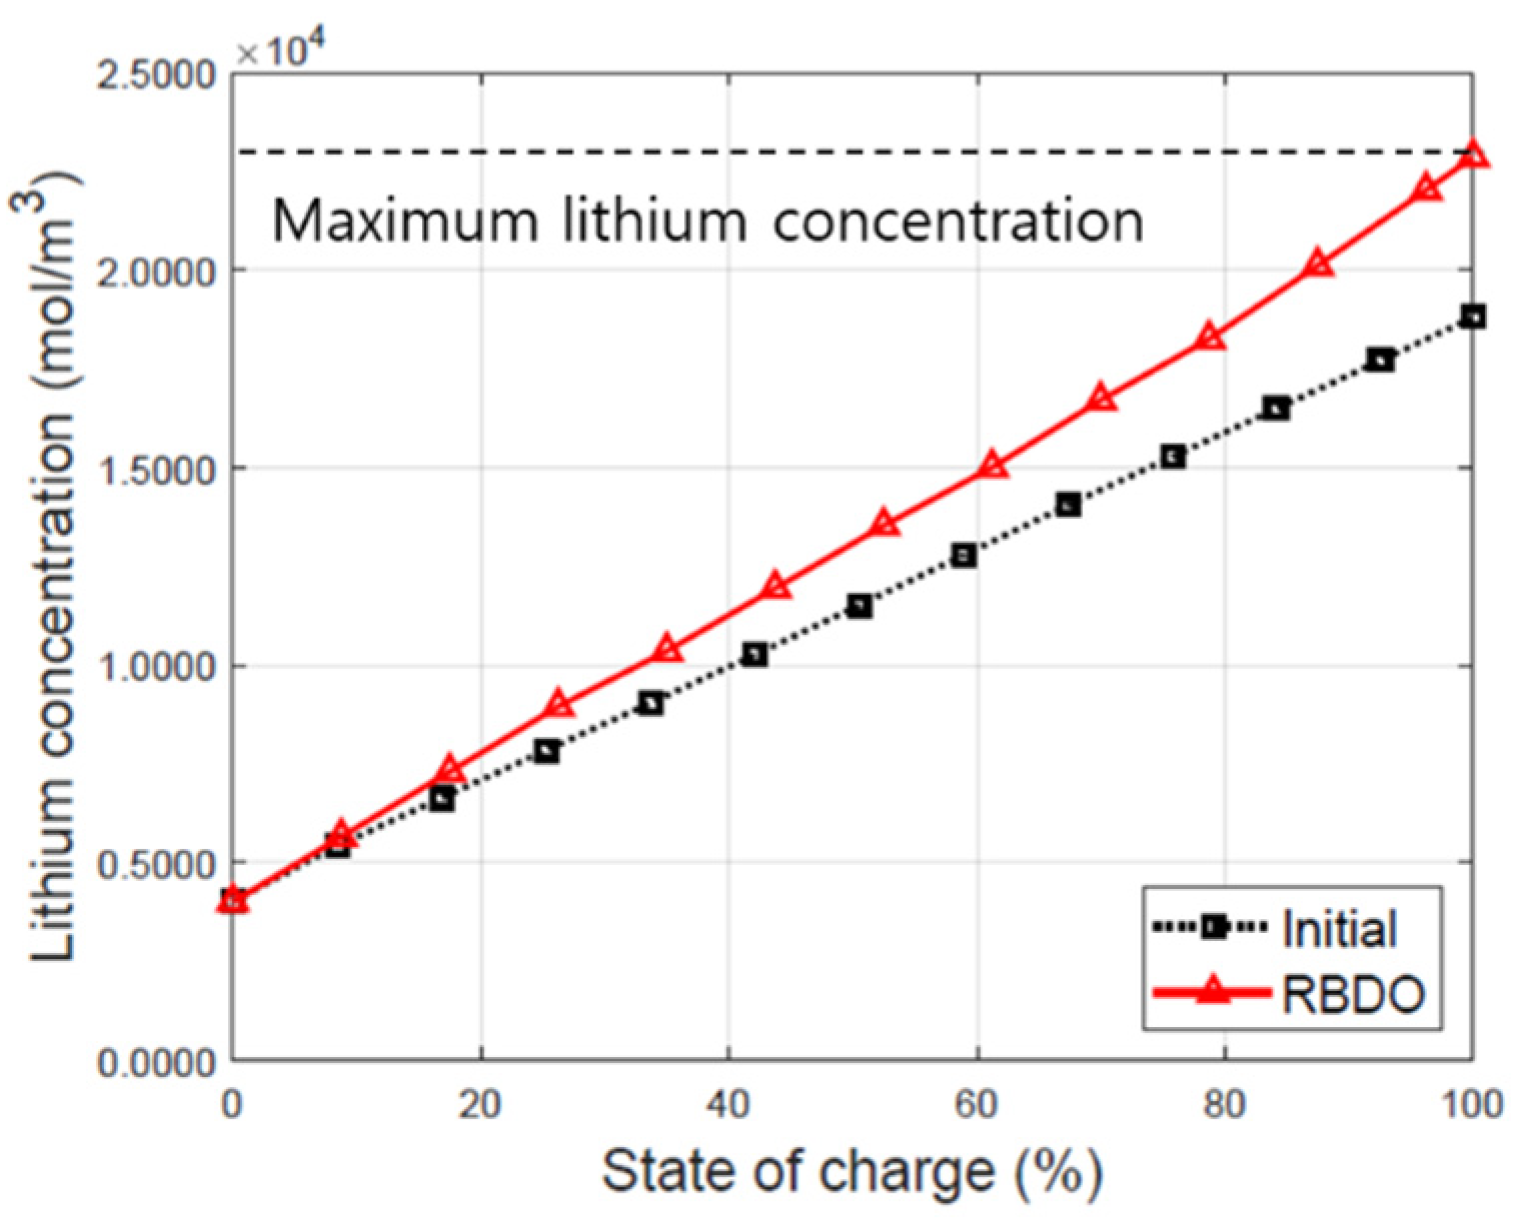
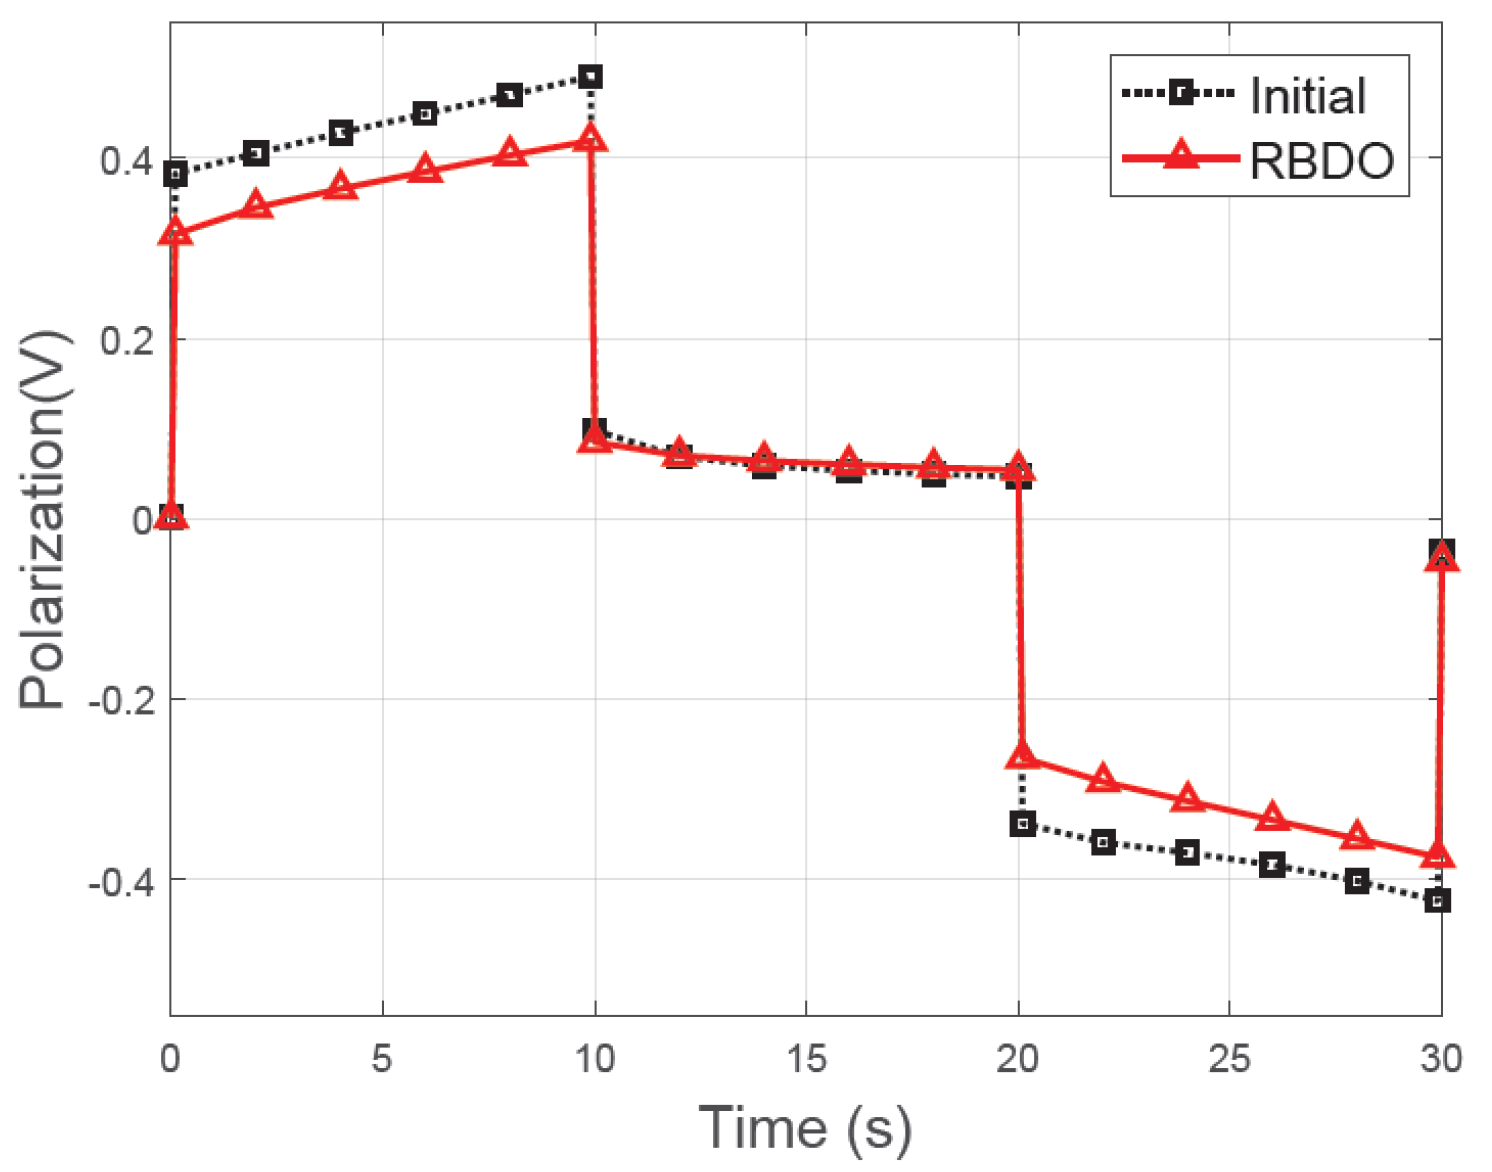
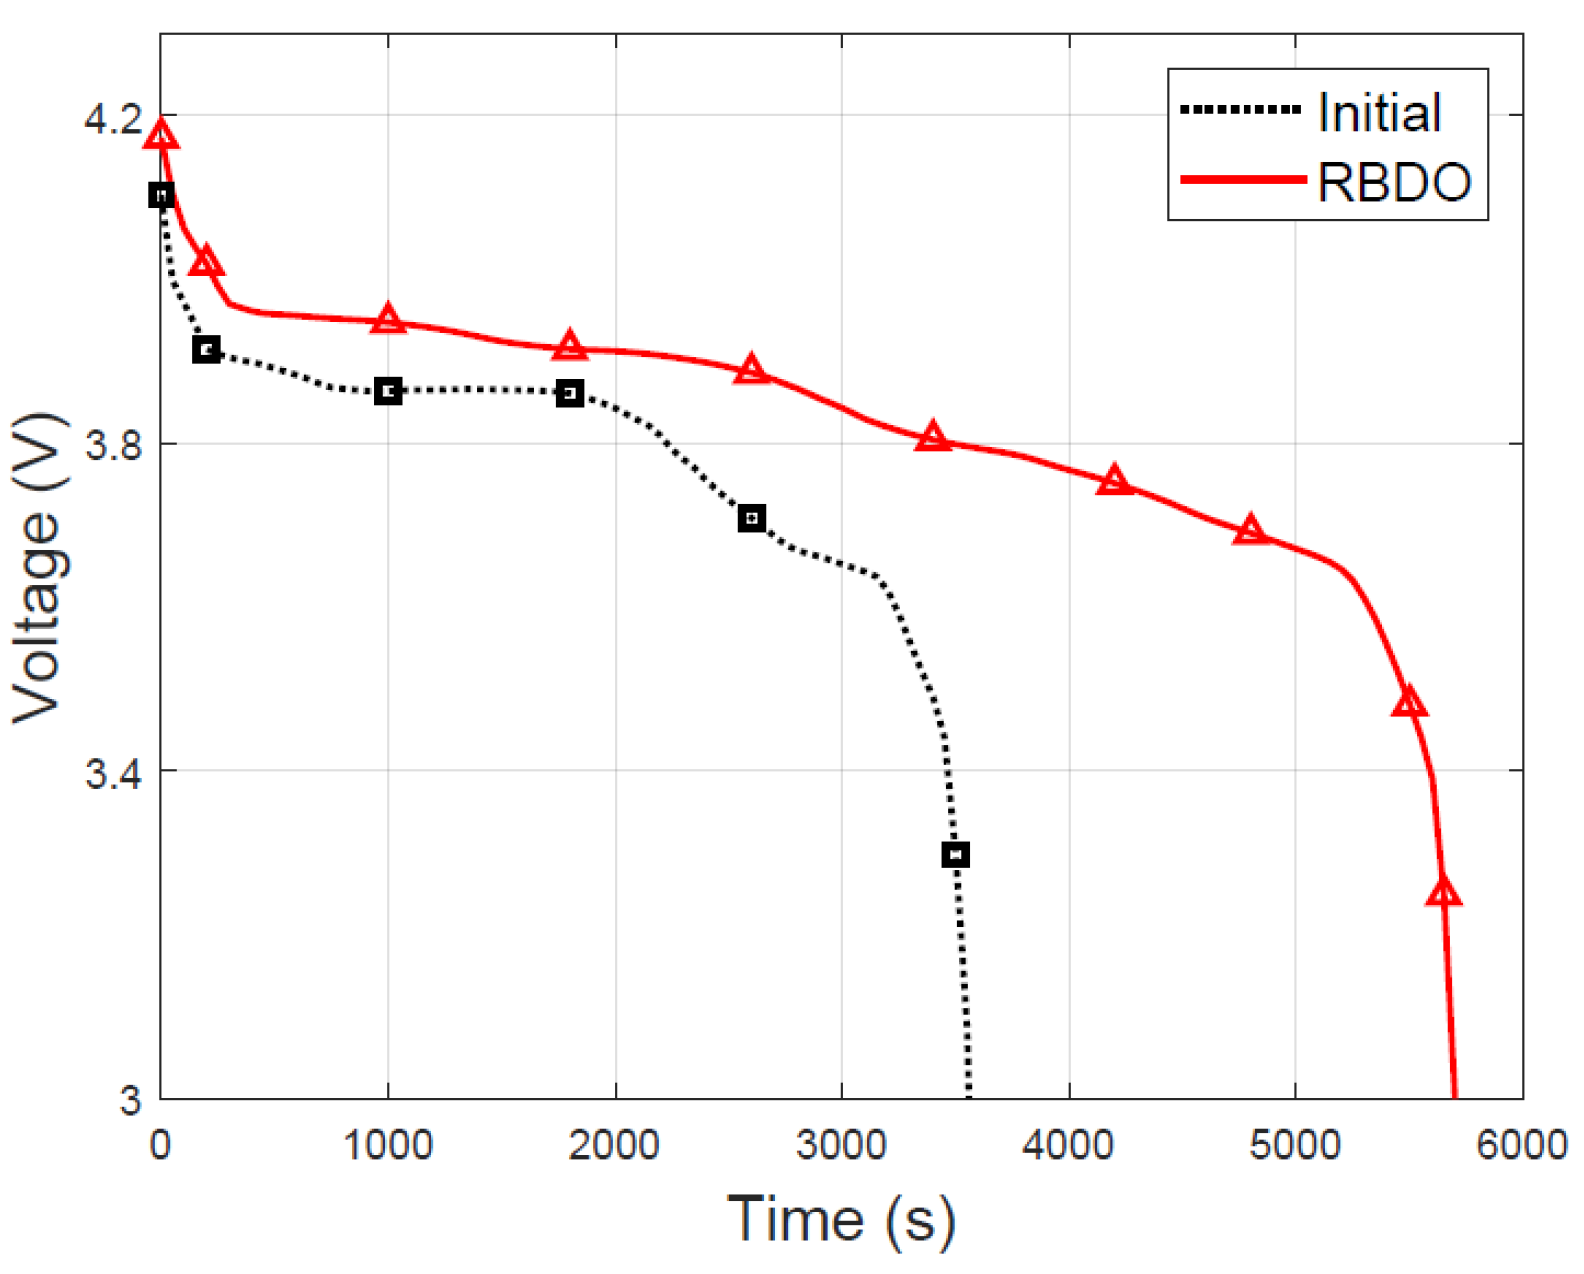
4.1. RBDO Results
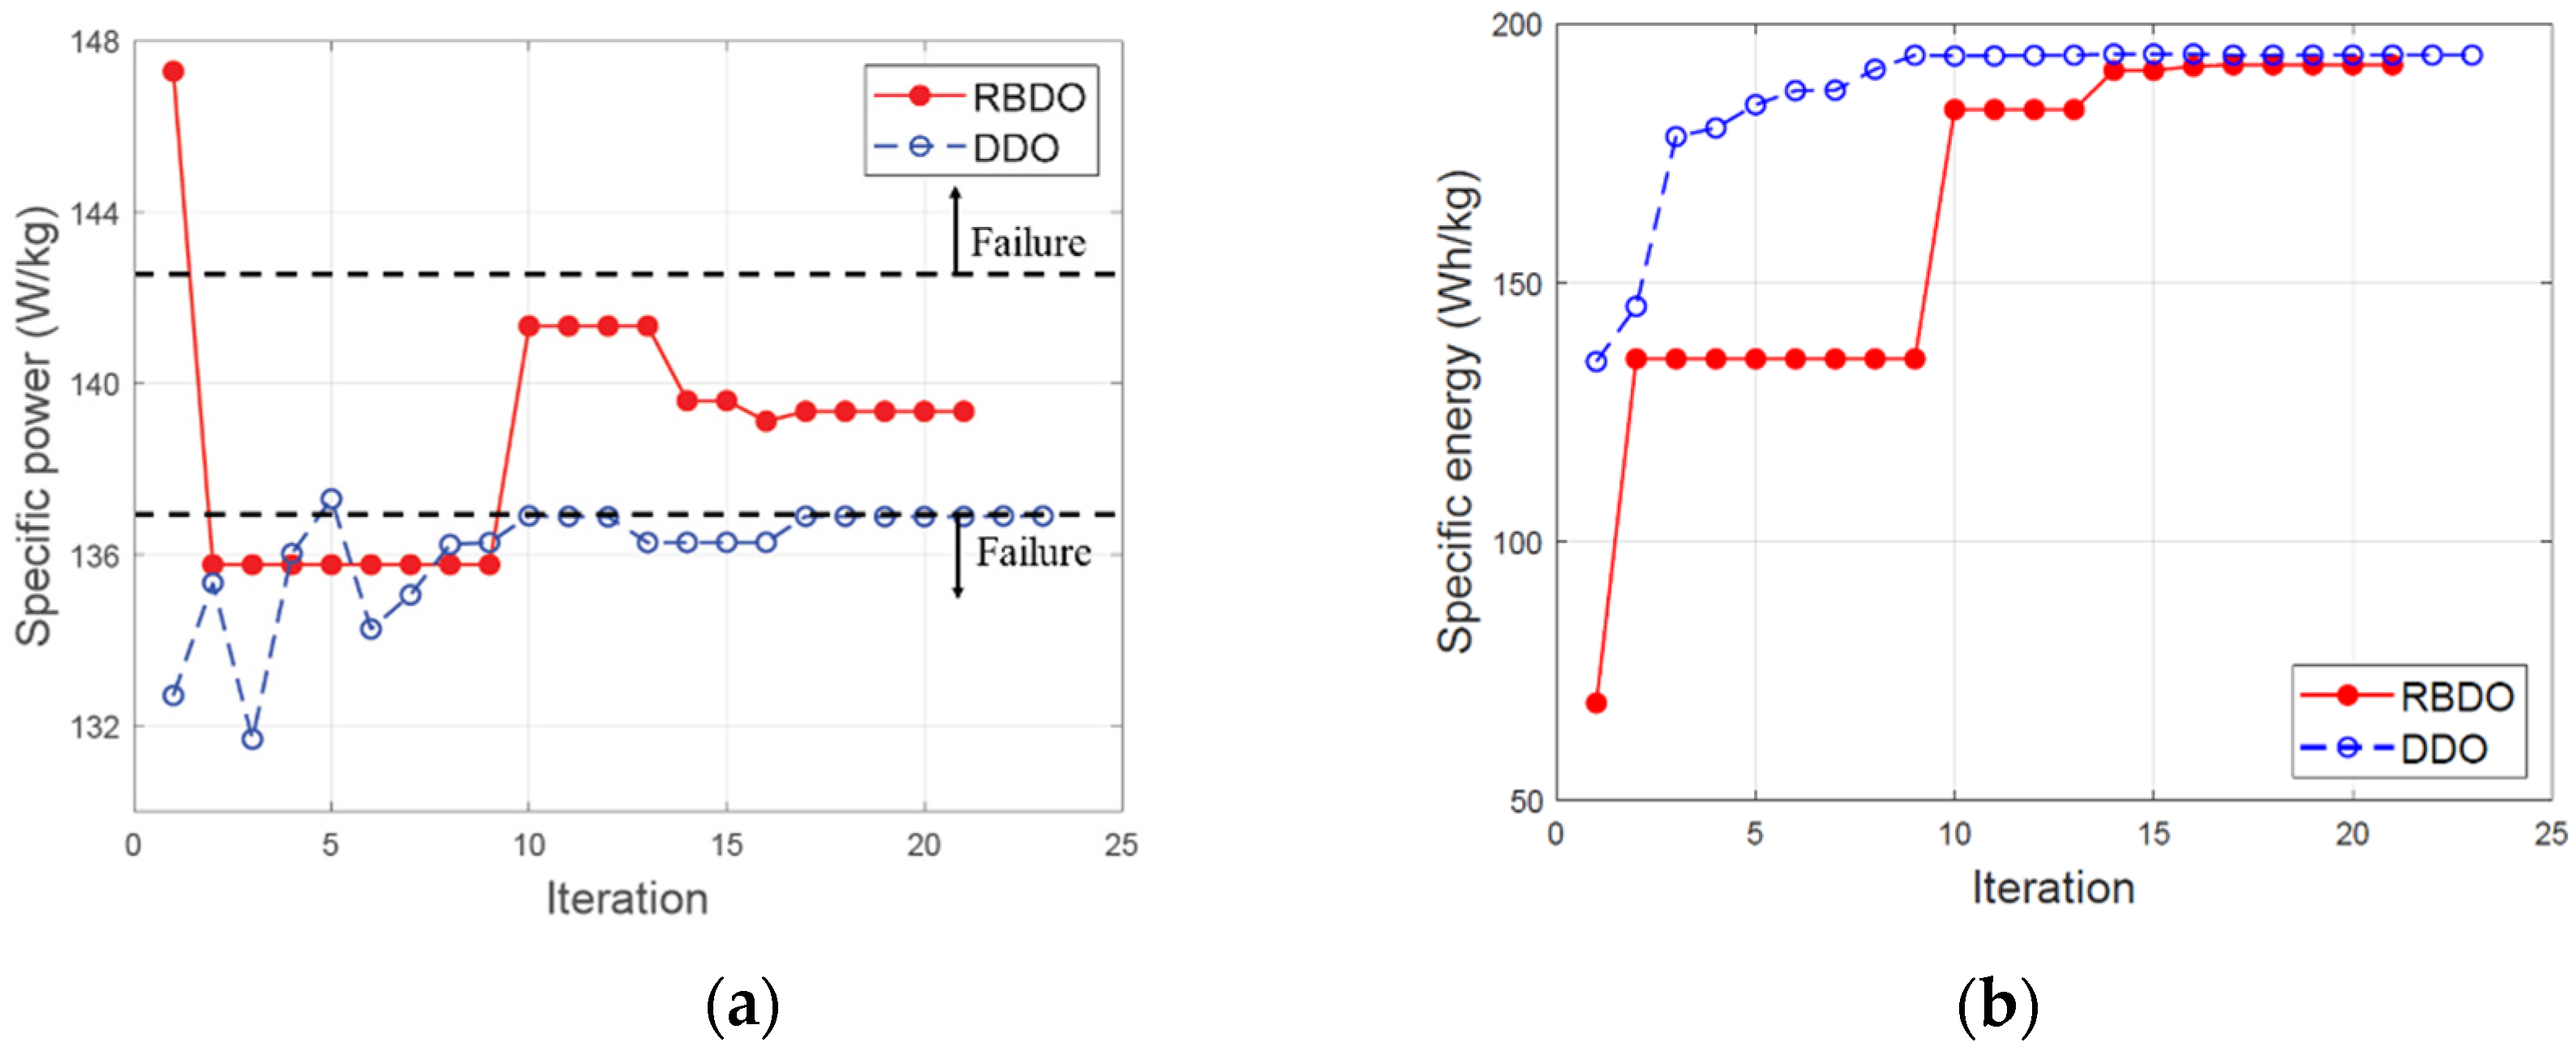
4.2. Comparison between RBDO and DDO Results
5. Conclusions
Author Contributions
Funding
Institutional Review Board Statement
Informed Consent Statement
Data Availability Statement
Conflicts of Interest
List of Symbols
| mean of design variables | |
| deviation of design variables | |
| specific energy (Wh/kg) | |
| specific power (W/kg) | |
| mass of cell (kg) | |
| electric potential of cell | |
| discharge time | |
| design variable | |
| response at design variable | |
| mean of the response at sampling points | |
| deviation of the response at sampling points | |
| probability of reliability | |
| number of total points obtained from the metamodel | |
| probability constraint | |
| objective function | |
| constraint function | |
| ion number | |
| electrical potential (V) | |
| local surface overpotential (V) | |
| density (kg/m3) | |
| porosity | |
| significance level | |
| li concentration (mol/m3) | |
| diffusivity (m2/s) | |
| average molar activity coefficient | |
| Faraday’s constant, 96 487 (C /mol) | |
| exchange current density (A/m2) | |
| local current density (A/m2) | |
| electronic conductivity (S/m) | |
| li+ flux (mol/m2s) | |
| radial distance from the center of active particle (μm) | |
| gas constant, 8.314 (J/mol-K) | |
| transport number of Li+ | |
| absolute temperature (K) | |
| Subscripts and Superscripts | |
| applied | |
| effective value | |
| electrolyte | |
| current Collector | |
| lithium-ion battery | |
| negative electrode | |
| positive electrode | |
| separator | |
| solid phase | |
| liquid phase | |
| lower bounds | |
| upper bounds | |
References
- Curry, C. Lithium-Ion Battery Costs and Market, Bloomberg New Energy Finance 2017. Available online: https://data.bloomberglp.com/bnef/sites/14/2017/07/BNEF-Lithium-ion-battery-costs-and-market.pdf (accessed on 23 August 2021).
- Sun, X.; Hao, H.; Zhao, F.; Liu, Z. Global Lithium Flow 1994-2015: Implications for Improving Resource Efficiency and Security. Environ. Sci. Technol. 2018, 52, 2827–2834. [Google Scholar] [CrossRef]
- Kim, C.-W.; Yang, H.-I.; Lee, K.-J.; Lee, D.-C. Metamodel-Based Optimization of a Lithium-Ion Battery Cell for Maximization of Energy Density with Evolutionary Algorithm. J. Electrochem. Soc. 2019, 166, A211–A216. [Google Scholar] [CrossRef]
- Xue, N.; Du, W.; Gupta, A.; Shyy, W.; Marie Sastry, A.; Martins JR, R.A. Optimization of a Single Lithium-Ion Battery Cell with a Gradient-Based Algorithm. J. Electrochem. Soc. 2013, 160, A1071–A1078. [Google Scholar] [CrossRef] [Green Version]
- Liu, C.; Liu, L. Optimal Design of Li-Ion Batteries through Multi-Physics Modeling and Multi-Objective Optimization. J. Electrochem. Soc. 2017, 164, E3254–E3264. [Google Scholar] [CrossRef]
- Kim, J.S.; Lee, D.C.; Lee, J.J.; Kim, C.W. Optimization for maximum specific energy density of a lithium-ion battery using progressive quadratic response surface method and design of experiments. Sci. Rep. 2020, 10, 1–11. [Google Scholar] [CrossRef]
- Omariba, Z.B.; Zhang, L.; Sun, D. Review of Battery Cell Balancing Methodologies for Optimizing Battery Pack Performance in Electric Vehicles. IEEE Access 2019, 7, 129335–129352. [Google Scholar] [CrossRef]
- Lenze, G.; Bockholt, H.; Schilcher, C.; Froböse, L.; Jansen, D.; Krewer, U.; Kwade, A. Impacts of Variations in Manufacturing Parameters on Performance of Lithium-Ion-Batteries. J. Electrochem. Soc. 2018, 165, A314–A322. [Google Scholar] [CrossRef]
- Kenney, B.; Darcovich, K.; MacNeil, D.D.; Davidson, I.J. Modelling the impact of variations in electrode manufacturing on lithium-ion battery modules. J. Electrochem. Soc. 2012, 213, 391–401. [Google Scholar] [CrossRef]
- Doyle, M.; Fuller, T.F.; Newman, J. Modeling of Galvanostatic Charge and Discharge of the Lithium/Polymer/Insertion Cell. J. Electrochem. Soc. 1993, 140, 1526–1533. [Google Scholar] [CrossRef]
- Doyle, M.; Newman, J.; Gozdz, A.S.; Schmutz, C.N.; Tarascon, J. Comparison of Modeling Predictions with Experimental Data from Plastic Lithium-Ion Cells. J. Electrochem. Soc. 1996, 143, 1890–1903. [Google Scholar] [CrossRef]
- Doyle, M. Design and Simulation of Lithium Rechargeable Batteries. Ph.D. Dissertation, University of California, Berkeley, CA, USA, 1 August 1995. [Google Scholar]
- Schmidt, O.; Thomitzek, M.; Röder, F.; Thiede, S.; Herrmann, C.; Krewer, U. Modeling the Impact of Manufacturing Uncertainties on Lithium-Ion Batteries. J. Electrochem. Soc. 2020, 167, 060501. [Google Scholar] [CrossRef]
- DuBeshter, T.; Sinha, P.K.; Sakars, A.; Fly, G.W.; Jorne, J. Measurement of Tortuosity and Porosity of Porous Battery Electrodes. J. Electrochem. Soc. 2014, 161, A599–A605. [Google Scholar] [CrossRef]
- Santhanagopalan, S.; White, R.E. Modeling Parametric Uncertainty Using Polynomial Chaos Theory. ECS Trans. 2019, 3, 243–256. [Google Scholar] [CrossRef]
- Baumhöfer, T.; Brühl, M.; Rothgang, S.; Sauer, D.U. Production caused variation in capacity aging trend and correlation to initial cell performance. J. Power Sources 2014, 247, 332–338. [Google Scholar] [CrossRef]
- Harris, S.J.; Harris, D.J.; Li, C. Failure statistics for commercial lithium-ion batteries: A study of 24 pouch cells. J. Power Sources 2017, 342, 589–597. [Google Scholar] [CrossRef] [Green Version]
- Shin, D.; Poncino, M.; Macii, E.; Chang, N. A statistical model-based cell-to-cell variability management of Li-ion battery pack. IEEE Trans. Comput.-Aided Des. Integr. Circuits Syst. 2015, 34, 252–265. [Google Scholar] [CrossRef]
- Mohanty, D.; Li, J.; Born, R.; Maxey, L.C.; Dinwiddie, R.B.; Daniel, C.; Wood, D.L. Non-destructive evaluation of slot-die-coated lithium secondary battery electrodes by in-line laser caliper and IR thermography methods. Anal. Methods 2014, 6, 674–683. [Google Scholar] [CrossRef]
- Oliveira, L.; Pinho De Sousa, J.; Claro, J. Dealing with uncertainty in modern supply chains: Vulnerability and risk management. In Proceedings of the 24th Anual Production and Operations Management Conference, Denver, CO, USA, 3–6 May 2013. [Google Scholar]
- Li, H.; Cho, H.; Sugiyama, H.; Choi, K.K.; Gaul, N.J. Reliability-based design optimization of wind turbine drivetrain with integrated multibody gear dynamics simulation considering wind load uncertainty. Struct. Multidiscip. Optim. 2017, 56, 183–201. [Google Scholar] [CrossRef]
- Lee, Y.S.; Choi, B.L.; Lee, J.H.; Kim, S.Y.; Han, S. Reliability-based design optimization of monopile transition piece for offshore wind turbine system. Renew. Energy 2014, 71, 729–741. [Google Scholar] [CrossRef]
- Song, X.; Sun, G.; Li, Q. Sensitivity analysis and reliability-based design optimization for high-strength steel tailor welded thin-walled structures under crashworthiness. Thin-Walled Struct. 2016, 109, 132–142. [Google Scholar] [CrossRef]
- Hu, W.; Choi, K.K.; Cho, H. Reliability-based design optimization of wind turbine blades for fatigue life under dynamic wind load uncertainty. Struct. Multidiscip. Optim. 2016, 54, 953–970. [Google Scholar] [CrossRef]
- Wang, Z.; Almeida JH, S.; St-Pierre, L.; Wang, Z.; Castro SG, P. Reliability-based buckling optimization with an accelerated Kriging metamodel for filament-wound variable angle tow composite cylinders. Compos. Struct. 2020, 254, 112821. [Google Scholar] [CrossRef]
- Landau, D.P.; Binder, K. A Guide to Monte Carlo Simulations in Statisticalphysics, 2nd ed.; Cambridge University Press: New York, NY, USA, 2005. [Google Scholar]
- Helton, J.C.; Johnson, J.D.; Sallaberry, C.J.; Storlie, C.B. Survey of sampling-based methods for uncertainty and sensitivity analysis. Reliab. Eng. Syst. Saf. 2006, 91, 1175–1209. [Google Scholar] [CrossRef] [Green Version]
- Hadigol, M.; Maute, K.; Doostan, A. On uncertainty quantification of lithium-ion batteries: Application to an LiC6/LiCoO2 cell. J. Power Sources 2015, 300, 507–524. [Google Scholar] [CrossRef] [Green Version]
- Khorshidi, H.A.; Gunawan, I.; Ibrahim, M.Y. Investigation on system reliability optimization based on classification of criteria. In Proceedings of the IEEE International Conference on Industrial Technology (ICIT), Cape Town, South Africa, 25−28 February 2013; pp. 1706–1711. [Google Scholar]
- PIAnO Introduction. Available online: http://pidotech.com/en/product/piano.aspx (accessed on 22 September 2021).
- Drezen, T.; Kwon, N.H.; Bowen, P.; Teerlinck, I.; Isono, M.; Exnar, I. Effect of particle size on LiMnPO4 cathodes. J. Power Sources 2007, 174, 949–953. [Google Scholar] [CrossRef]
- Heubner, C.; Nickol, A.; Seeba, J.; Reuber, S.; Junker, N.; Wolter, M.; Schneider, M.; Michaelis, A. Understanding thickness and porosity effects on the electrochemical performance of LiNi0.6Co0.2Mn0.2O2-based cathodes for high energy Li-ion batteries. J. Power Sources 2019, 419, 119–126. [Google Scholar] [CrossRef]
- Zhao, R.; Liu, J.; Gu, J. The effects of electrode thickness on the electrochemical and thermal characteristics of lithium-ion battery. Appl. Energy 2015, 139, 220–229. [Google Scholar] [CrossRef]
- Wu, X.; Song, K.; Zhang, X.; Hu, N.; Li, L.; Li, W.; Zhang, L.; Zhang, H. Safety issues in lithium-ion batteries: Materials and cell design. Front. Energy Res. 2019, 7, 65. [Google Scholar] [CrossRef] [Green Version]
- Bischoff, C.; Fitz, O.; Schiller, C.; Gentischer, H.; Biro, D.; Henning, H. Investigating the Impact of Particle Size on the Performance and Internal Resistance of Aqueous Zinc Ion Batteries with a Manganese Sesquioxide Cathode. Batteries 2018, 3, 44. [Google Scholar] [CrossRef] [Green Version]
- Belt, J.R. Battery Test Manual for Plug-In Hybrid Electric Vehicles; Idaho National Engineering & Environmental Laboratory: Idaho Falls, ID, USA, 2010. [Google Scholar]


| Parameters | LixC6 | LiyMn2O4 | Separator | Electrolyte |
|---|---|---|---|---|
| Density (kg/m3) | 2270 | 4140 | 900 | 1210 |
| Particle size (µm) | 12.5 | 8.5 | - | - |
| Porosity | 0.357 | 0.444 | 0.46 | - |
| Thickness (µm) | 100 | 174 | 52 | - |
| Diffusivity (m2/s) | 3.9 × 10⁻¹⁴ | 1.0 × 10⁻¹³ | - | 7.5 × 10⁻¹¹ |
| Max. concentration (mol/m−3) | 26,390 | 22,860 | - | - |
| Performance | Initial design | |||
| Specific energy (Wh/kg) | 138.5 | |||
| Specific power (W/kg) | 139.7 | |||
| Random Design Variable | Distribution | Design Space | Standard Deviation |
|---|---|---|---|
| Anode particle size (µm) | Normal | 5 < x1 < 50 | 0.42 |
| Cathode particle size (µm) | Normal | 2 < x2 < 20 | 0.42 |
| Anode porosity | Normal | 0.2 < x3 < 0.6 | 0.013 |
| Cathode porosity | Normal | 0.2 < x4 < 0.6 | 0.0025 |
| Anode thickness (µm) | Normal | 40 < x5 < 250 | 1.27 |
| Cathode thickness (µm) | Normal | 40 < x6 < 250 | 2.57 |
| Design Variable | Initial Design | RBDO Design | Rate of Change |
|---|---|---|---|
| Anode particle size (μm) | 12.5 | 5.17 | −58.6% |
| Cathode particle size (μm) | 8.5 | 3.05 | −64.1% |
| Anode porosity | 0.357 | 0.246 | −31.1% |
| Cathode porosity | 0.444 | 0.201 | −54.7% |
| Anode thickness (µm) | 100 | 126 | +26.0% |
| Cathode thickness (µm) | 174 | 130 | −25.3% |
| Probability of failure | Mean (±deviation) | Mean (±deviation) | Rate of change |
| Specific energy (Wh/kg) | 135.81 (±2.7113) | 193.39 (±0.5958) | +42.4% (−77.2%) |
| Specific power (W/kg) | 141.27 (±1.5386) | 139.37 (±1.1142) | −1.34% (−10.04%) |
| Probability of failure | 64.05% | 1.53% | −62.5% |
| RBDO | DDO | |
|---|---|---|
| Objective | Maximize mean of Ecell (xi) | Maximize mean of Ecell (xi) |
| Constraint | P[Pcell(xi) > 136.9 W/kg] ≥ 0.99 P[Pcell(xi) > 142.5 W/kg] ≥ 0.99 | 136.9 W/kg < Pcell(xi) < 142.5 W/kg |
| Design Variable | RBDO Design | DDO Design |
|---|---|---|
| Anode particle size (µm) | 5.17 | 5.0 |
| Cathode particle size (µm) | 3.05 | 2.21 |
| Anode porosity | 0.246 | 0.248 |
| Cathode porosity | 0.201 | 0.200 |
| Anode thickness (µm) | 126 | 125 |
| Cathode thickness (µm) | 130 | 132 |
| Probability of failure | Mean (±deviation) | Mean (±deviation) |
| Specific energy (Wh/kg) | 193.39 (±0.5958) | 193.58 (±0.5557) |
| Specific power (W/kg) | 139.37 (±1.1142) | 137.02 (±1.0988) |
| Probability of failure | 1.53% | 44.91% |
Publisher’s Note: MDPI stays neutral with regard to jurisdictional claims in published maps and institutional affiliations. |
© 2021 by the authors. Licensee MDPI, Basel, Switzerland. This article is an open access article distributed under the terms and conditions of the Creative Commons Attribution (CC BY) license (https://creativecommons.org/licenses/by/4.0/).
Share and Cite
Yoo, D.; Park, J.; Moon, J.; Kim, C. Reliability-Based Design Optimization for Reducing the Performance Failure and Maximizing the Specific Energy of Lithium-Ion Batteries Considering Manufacturing Uncertainty of Porous Electrodes. Energies 2021, 14, 6100. https://doi.org/10.3390/en14196100
Yoo D, Park J, Moon J, Kim C. Reliability-Based Design Optimization for Reducing the Performance Failure and Maximizing the Specific Energy of Lithium-Ion Batteries Considering Manufacturing Uncertainty of Porous Electrodes. Energies. 2021; 14(19):6100. https://doi.org/10.3390/en14196100
Chicago/Turabian StyleYoo, Donghyeon, Jinhwan Park, Jaemin Moon, and Changwan Kim. 2021. "Reliability-Based Design Optimization for Reducing the Performance Failure and Maximizing the Specific Energy of Lithium-Ion Batteries Considering Manufacturing Uncertainty of Porous Electrodes" Energies 14, no. 19: 6100. https://doi.org/10.3390/en14196100
APA StyleYoo, D., Park, J., Moon, J., & Kim, C. (2021). Reliability-Based Design Optimization for Reducing the Performance Failure and Maximizing the Specific Energy of Lithium-Ion Batteries Considering Manufacturing Uncertainty of Porous Electrodes. Energies, 14(19), 6100. https://doi.org/10.3390/en14196100