Article

Web-Based Simulation Environment for Vehicular Electrical Networks

by
Xavier Dominguez
1,*,
Paola Mantilla-Pérez
1,2,
Nuria Gimenez
3,
Islam El-Sayed
1,
Manuel Alberto Díaz Millán
2 and
Pablo Arboleya
1
1
Department of Electrical Engineering, University of Oviedo, 33003 Oviedo, Asturias, Spain
2
SEAT S.A., 08760 Martorell, Barcelona, Spain
3
Ruecker Lypsa, 08760 Martorell, Barcelona, Spain
*
Author to whom correspondence should be addressed.
Energies 2021, 14(19), 6087; https://doi.org/10.3390/en14196087
Submission received: 26 August 2021 / Revised: 19 September 2021 / Accepted: 21 September 2021 / Published: 24 September 2021

Abstract

:
For the validation of vehicular Electrical Distribution Systems (EDS), engineers are currently required to analyze disperse information regarding technical requirements, standards and datasheets. Moreover, an enormous effort takes place to elaborate testing plans that are representative for most EDS possible configurations. These experiments are followed by laborious data analysis. To diminish this workload and the need for physical resources, this work reports a simulation platform that centralizes the tasks for testing different EDS configurations and assists the early detection of inadequacies in the design process. A specific procedure is provided to develop a software tool intended for this aim. Moreover, the described functionalities are exemplified considering as a case study the main wire harness from a commercial vehicle. A web-based architecture has been employed in alignment with the ongoing software development revolution and thus provides flexibility for both, developers and users. Due to its scalability, the proposed software scheme can be extended to other web-based simulation applications. Furthermore, the automatic generation of electrical layouts for EDS is addressed to favor an intuitive understanding of the network. To favor human–information interaction, utilized visual analytics strategies are also discussed. Finally, full simulation workflows are exposed to provide further insights on the deployment of this type of computer platforms.

1. Introduction

As part of product design in the industry, computer simulation nowadays plays a major role given its benefits such as high analysis capacity, prototyping reduction, improved product quality and attractive cost-efficiency [1]. This is the case of automotive manufacturing where specialized simulation platforms are being employed to meet current performance standards, newest environmental policies, superior product reliability and higher user demands. Conventionally, the majority of simulation tools in this sector have mostly focused in aerodynamics, computed-aided design, vehicle collision, autonomous driving, communication systems, electric drive-train and energy management [2]. The latest simulation trends in automotive systems deal with advanced functionalities such as scalable models for autonomous-driving cars [3], energy-efficient networking for electric vehicles networks [4] and internet of vehicles for automation and orchestration [5]. However, regarding the on-board Electrical Distribution Systems (EDS), which are responsible for delivering power supply to the different consumers within a vehicle, only few commercial tools (such as Harness Studio and Saber RD) and a few sustained research related to tailored simulation platforms have been exposed [2,6,7]. Vehicular EDS (in blue color in Figure 1) are intricate networks composed of a vast number of protections, splices, couplings, Electronic Control Units (ECUs) and loads that are interconnected with several wire harnesses enclosing thousands of cables, representing up to 3 km of cabling [7]. Every wire harness, hereafter only referred as harness for simplicity, is basically an assembly of bundled cables protected by tapes, fittings and plastic coatings capable to maintain safe electrical operation of the network for the demanding conditions that may exist in the surroundings. Independently of the type of vehicle (e.g., Internal Combustion Engine (ICE) propelled, hybrid, electric or other), on-board EDS are deployed in a similar manner. This is interconnecting different harnesses intended to supply energy to the different consumers within a vehicle, except by those related with electrified traction (e.g., inverter), which in turn are fed by a separate higher-voltage network having its own battery. Therefore, the approach proposed here to analyze in-car EDS can be applied to all kind of vehicle. Owing to assembling requirements, the entire on-board EDS are typically formed by a primary harness which delivers, through couplings, power supply as well as communication and control signals to different secondary harnesses such as those related with the bumpers, doors, seats or engine.
Considering all the aforesaid, the design and prototyping of the vehicular electrical network represent a highly defiant stage in a car model development process. To cope these challenges and permit vehicle design engineers an early detection of unsuitable configurations, such as those leading to undesired voltage drops, excessive temperatures or mistaken components sizing, the development of versatile simulation methods and platforms is compelling. In this respect, recent research has proposed frameworks to perform EDS power flow simulations considering the specific data format employed in the automotive industry and using algorithms based on backward/forward sweep [6] and current-injections methods [8]. In [2], the relevancy to include Visual Analytics tactics in EDS simulation environments is highlighted to facilitate human–data interaction. Additionally, relevant software development cornerstones to deploy EDS visualization and simulation is exhibited in [7]. On this issue, when talking about key pillars that can significantly enhance the capabilities of simulation tools, web and cloud-based architectures are currently an accelerating trend given their capacity to boost collaboration, increase flexibility and tackle complex product-oriented designs [9]. Moreover, these web-based deployments present advantages not only for end users, but also for applications developers given the convenience of remote access, usage of any operative system and simplified software installation and upgrading. Therefore, web and cloud-based computing have been recognized as the third revolution in the Information Technology (IT) industry [10]. Due to these benefits, in the last years different simulation tools from the electrical engineering field have been developed or updated to include web-based functionalities. This tendency has been applied with varying architecture complexity depending on the magnitude of the projects, going from electric-electronic circuits schematics [11,12,13,14] and arriving to power system analysis, cost optimization and state estimation as reference [15] elaborates. This gives us an insight of the relevance of web-based technologies to develop a flexible, scalable, collaborative and easy-to-maintain simulation tools to face the challenging design demands of vehicular EDS.
Within this context, to complement the aforementioned vehicle EDS research and also propose a functional architecture for other industry web-based simulation environments, the main contribution of this work is the development of a methodology to deploy an industry-oriented web-based computer platform intended for the visualization and simulation of in-car EDS. This kind of initiative represents a novelty contribution for the automotive sector to the best of the authors’ knowledge. Moreover, the functionality of the implemented software environment has been validated considering a real electrical harnesses from a commercial vehicle. In this respect, Section 2 elaborates on the proposed web-based computational architecture along with the required data preprocessing. Hereafter in the document, the implementation of the presented functionalities is discussed and then exemplified considering the main harness of the SEAT Ibiza car model as a case study. Specifically, Section 3 addresses the automatic generation of electrical diagrams for EDS interfaces. Satisfactory harness and wire-by-wire schematics are accomplished to support an intuitive understanding of the vehicular electrical network. To increase user experience and enhance human–information interaction, tailored functionalities and Visual Analytics strategies have been included, these are mentioned in Section 4. Then, Section 5 exhibits in detail the complete simulation workflow for typical user duties in a step-by-step manner. Section 6 makes a concise discussion about the visualization and simulation outcomes that were attained in the previous sections given the considered case study. Finally, some conclusions are exhibited in Section 7.

2. Simulation Engine Architecture

2.1. Web-Based Framework

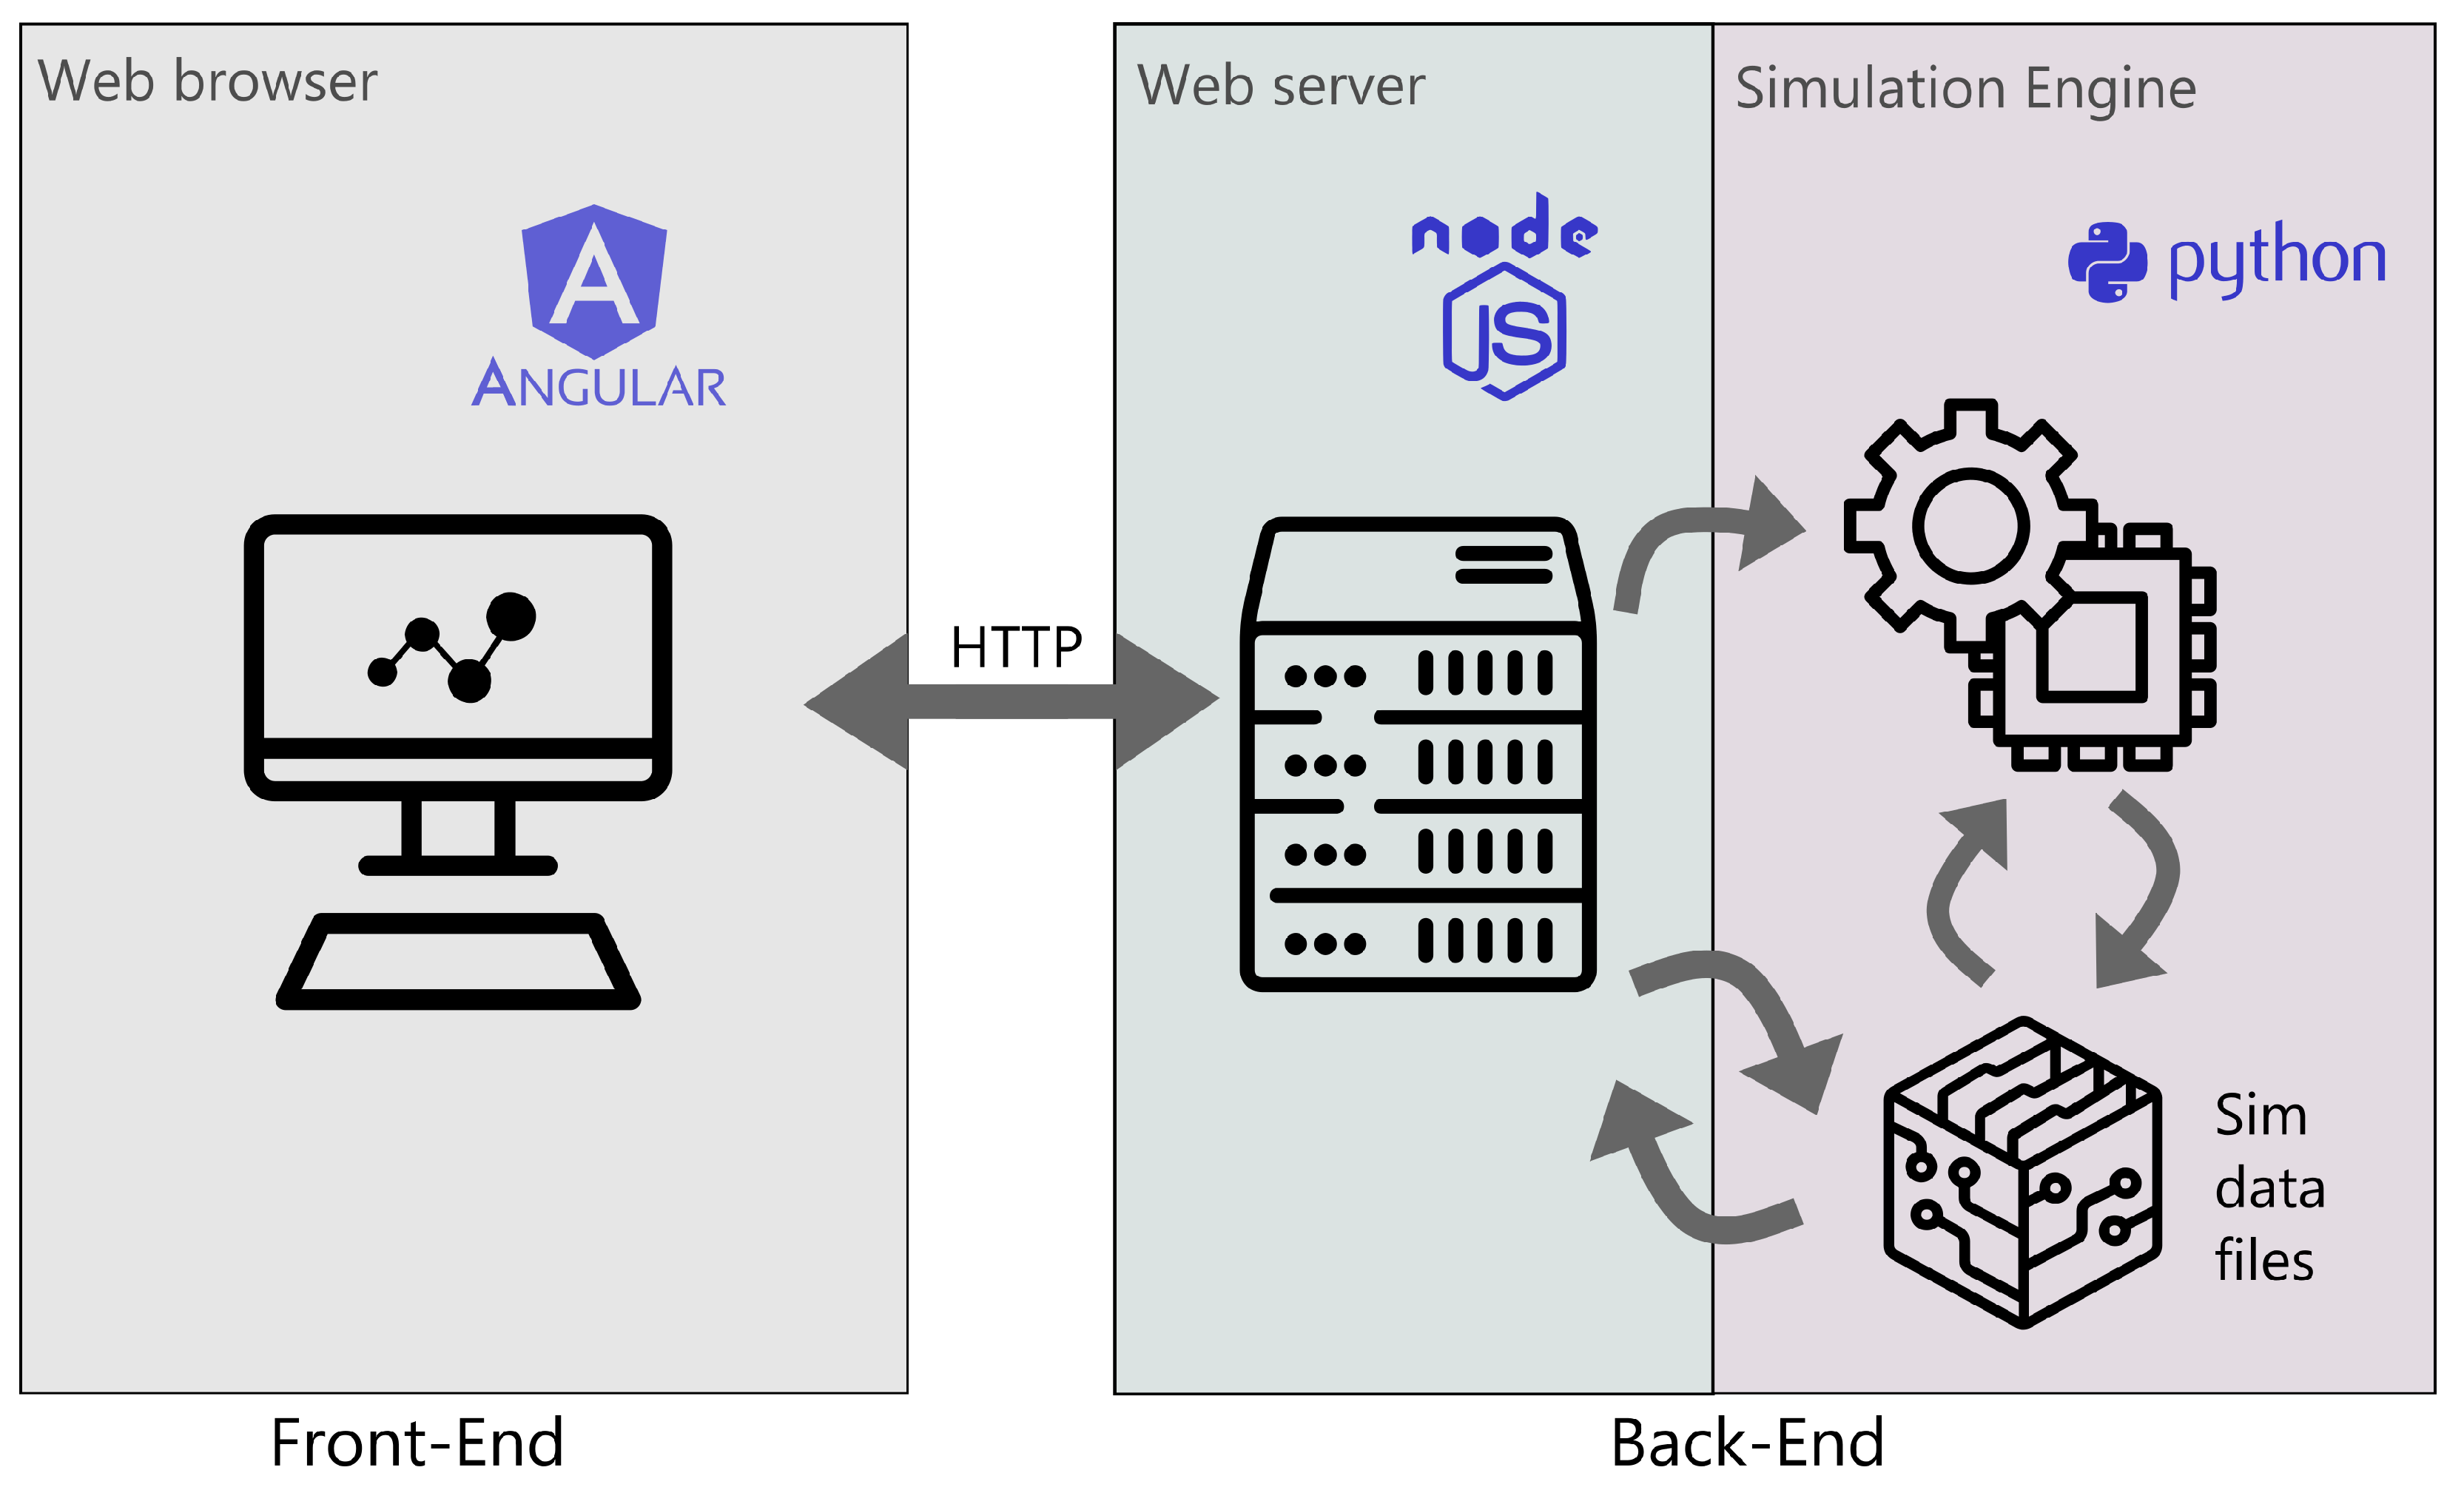
In the conventional paradigm of traditional simulation tools, each user has an individual software copy installed in his own computer. Under this approach, the software and the computing resources are confined and scalability is not possible. On the other hand, in cloud and web schemes, an IT service provider supplies computing resources to clients on-demand. This allows the stringent modeling and simulation tasks to run on robust vendor servers (Back-End) while the clients’ workstation (Front-End) mainly focuses on the user input and the interface display duties. This alleviates hardware upgrading in final users who are only required modest computational capabilities and a rapid reliable Internet or proprietary network connection which is becoming easier and more affordable day by day. Therefore, users and programmers can remotely access the application for its use or debug, respectively, and thus simplifying software licensing, maintenance and updating [16].
Taking advantage of the former benefits, web-based simulation software and research have been carried out to conduct electrical network studies. Most of these initiatives have primarily focused within the power systems analysis scope. In this field, some open source and commercial tools have reported to include web-based architectures. For instance, we have InterPSS [17], MatPower [18], Neplan [19] and Simulink from Matlab [20]. With respect to web/cloud-based research in this ambit, a few works have been reported. The initial contributions dealt with power flow and contingency examinations [21], dynamic transient assessment [22], distributed generation allocation and dispatch [23], cost optimization by the use of cloud-computing [24] and PMU-based estate estimation [25]. On the other hand, the latest studies are associated with a PHP-language application library [26], planning analysis for the ISO New England system operator [27,28] and a hybrid AC/CD network cloud-based simulation [29].
The most common architecture in the aforesaid web-based simulation platforms is a 3-tier scheme (web browser, web server and simulation engine). Given its maturity [26], this was also the architecture implemented in the present project as Figure 2 exhibits. Note that only open-source web development tools have been employed to do so. At the client side, the user access the application with a web browser. Here, the Front-End interface was deployed using the Angular framework [30]. The latter permits a rapid and well-documented design of aesthetic, dynamic, single-page applications by means of hierarchically integrated components, templates and services [31]. Additionally, Javascript-based D3 library [32] has been used to generate customized Scalable Vector Graphics (SVGs) for the interface. When the client inserts the corresponding URL, the browser requests the page (via HTTP) from the web server that hosts the page. Then, using the Node.js environment [33], the server returns the page to the requesting IP address so that the browser renders and displays the interface. Later, when computing intense data preprocessing or simulation is needed by the user at the Front-End, a new particular request is made again to the web server which now passes this specific petition to the simulation engine. In this work, this latter is settled on the same Back-End server but it can be hosted in another remote server if needed. It was deployed using Python language given its convenient libraries for data preprocessing and development of custom-made power flow analysis. In this stage, the simulation engine executes the necessary scripts and returns the corresponding data to the Front-End via the web server. For further insights on the entire process, a complete simulation workflow is exhibited in Section 5.

2.2. Data Preprocessing

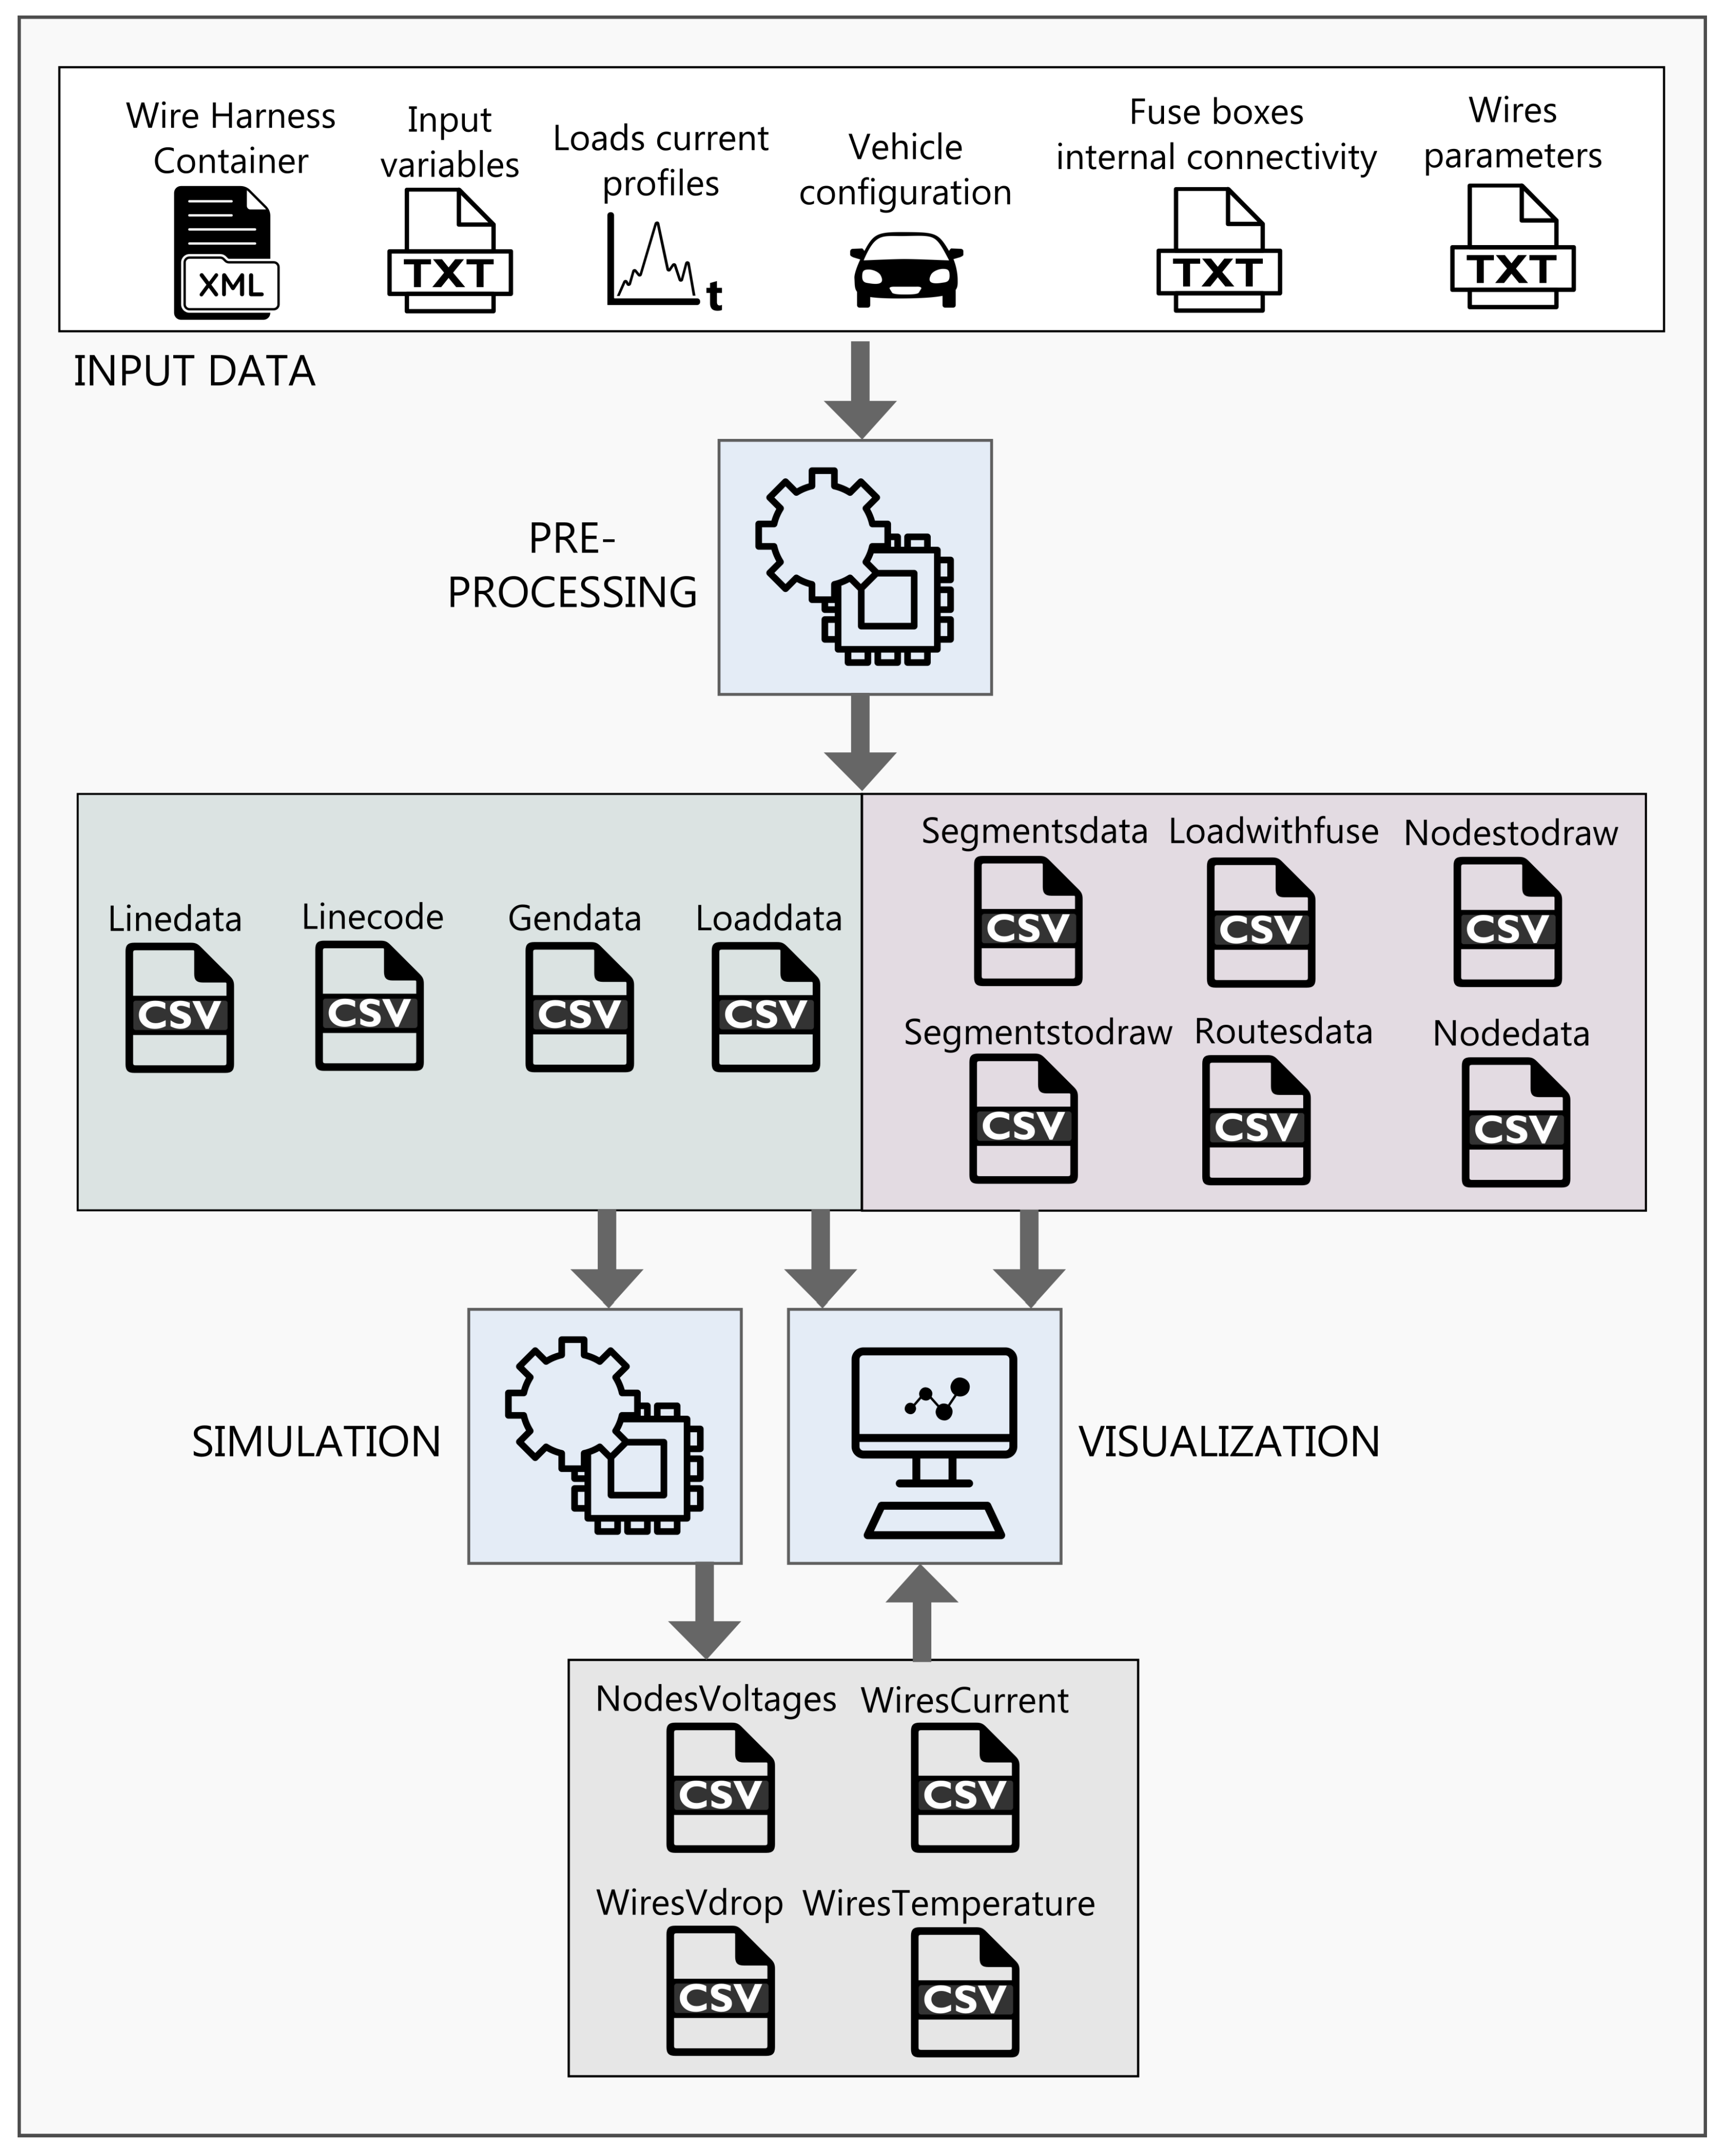
Prior to the visualization and simulation of the on-board electrical system, a preprocessing stage over different input data files is needed as Figure 3 exhibits. As a first step, the user inserts the following input information in the Front-End via the web browser: (i) the factory wire harness .XML data container which is different for every harness in the vehicle according to its corresponding car model; (ii) input variables values such as the nominal voltage of the battery, the ambient temperature, the need to perform static or time-profiles simulation, the type of car harness under study (main or secondary) among others; (iii) time-current profiles of the loads; (iv) the vehicle equipment configuration; (v) the fuse boxes internal connectivity; and (vi) the parameters of the different wires in the harness such as their cross section area, thermal conductivity and maximum/minimum temperature. Then, at the Back-End, by means of Python scripts, the simulation engine conveniently extracts, arranges and correlates all the required electrical information from the nodes and lines in the network. Now, the execution of visualization and simulation duties are possible as the information is suitably organized in a set of Comma-separated Values (.CSV) files (e.g., Gendata, Linecode, Linedata, Nodedata, Segmentsdata and Loaddata) having a data structure similar than the one employed in [34] which is common within the power systems domain to perform power flow studies. Further details on the aforementioned process are described in reference [8].

3. Automatic Generation of Electrical Layouts for Vehicular EDS

For a proper representation of the electrical network under study, two types of visual schematics have been implemented: the General View and the Detailed View. Before elaborating on this schematics, note that hereafter in this document, the implementation of the presented functionalities are discussed and then exemplified considering as a case study the main harness from an ICE-propelled sedan car; the SEAT Ibiza model. To provide an idea about the characteristics of this harness, Table 1 details its attributes such as the number of nodes, lines and consumers.

3.1. The General View

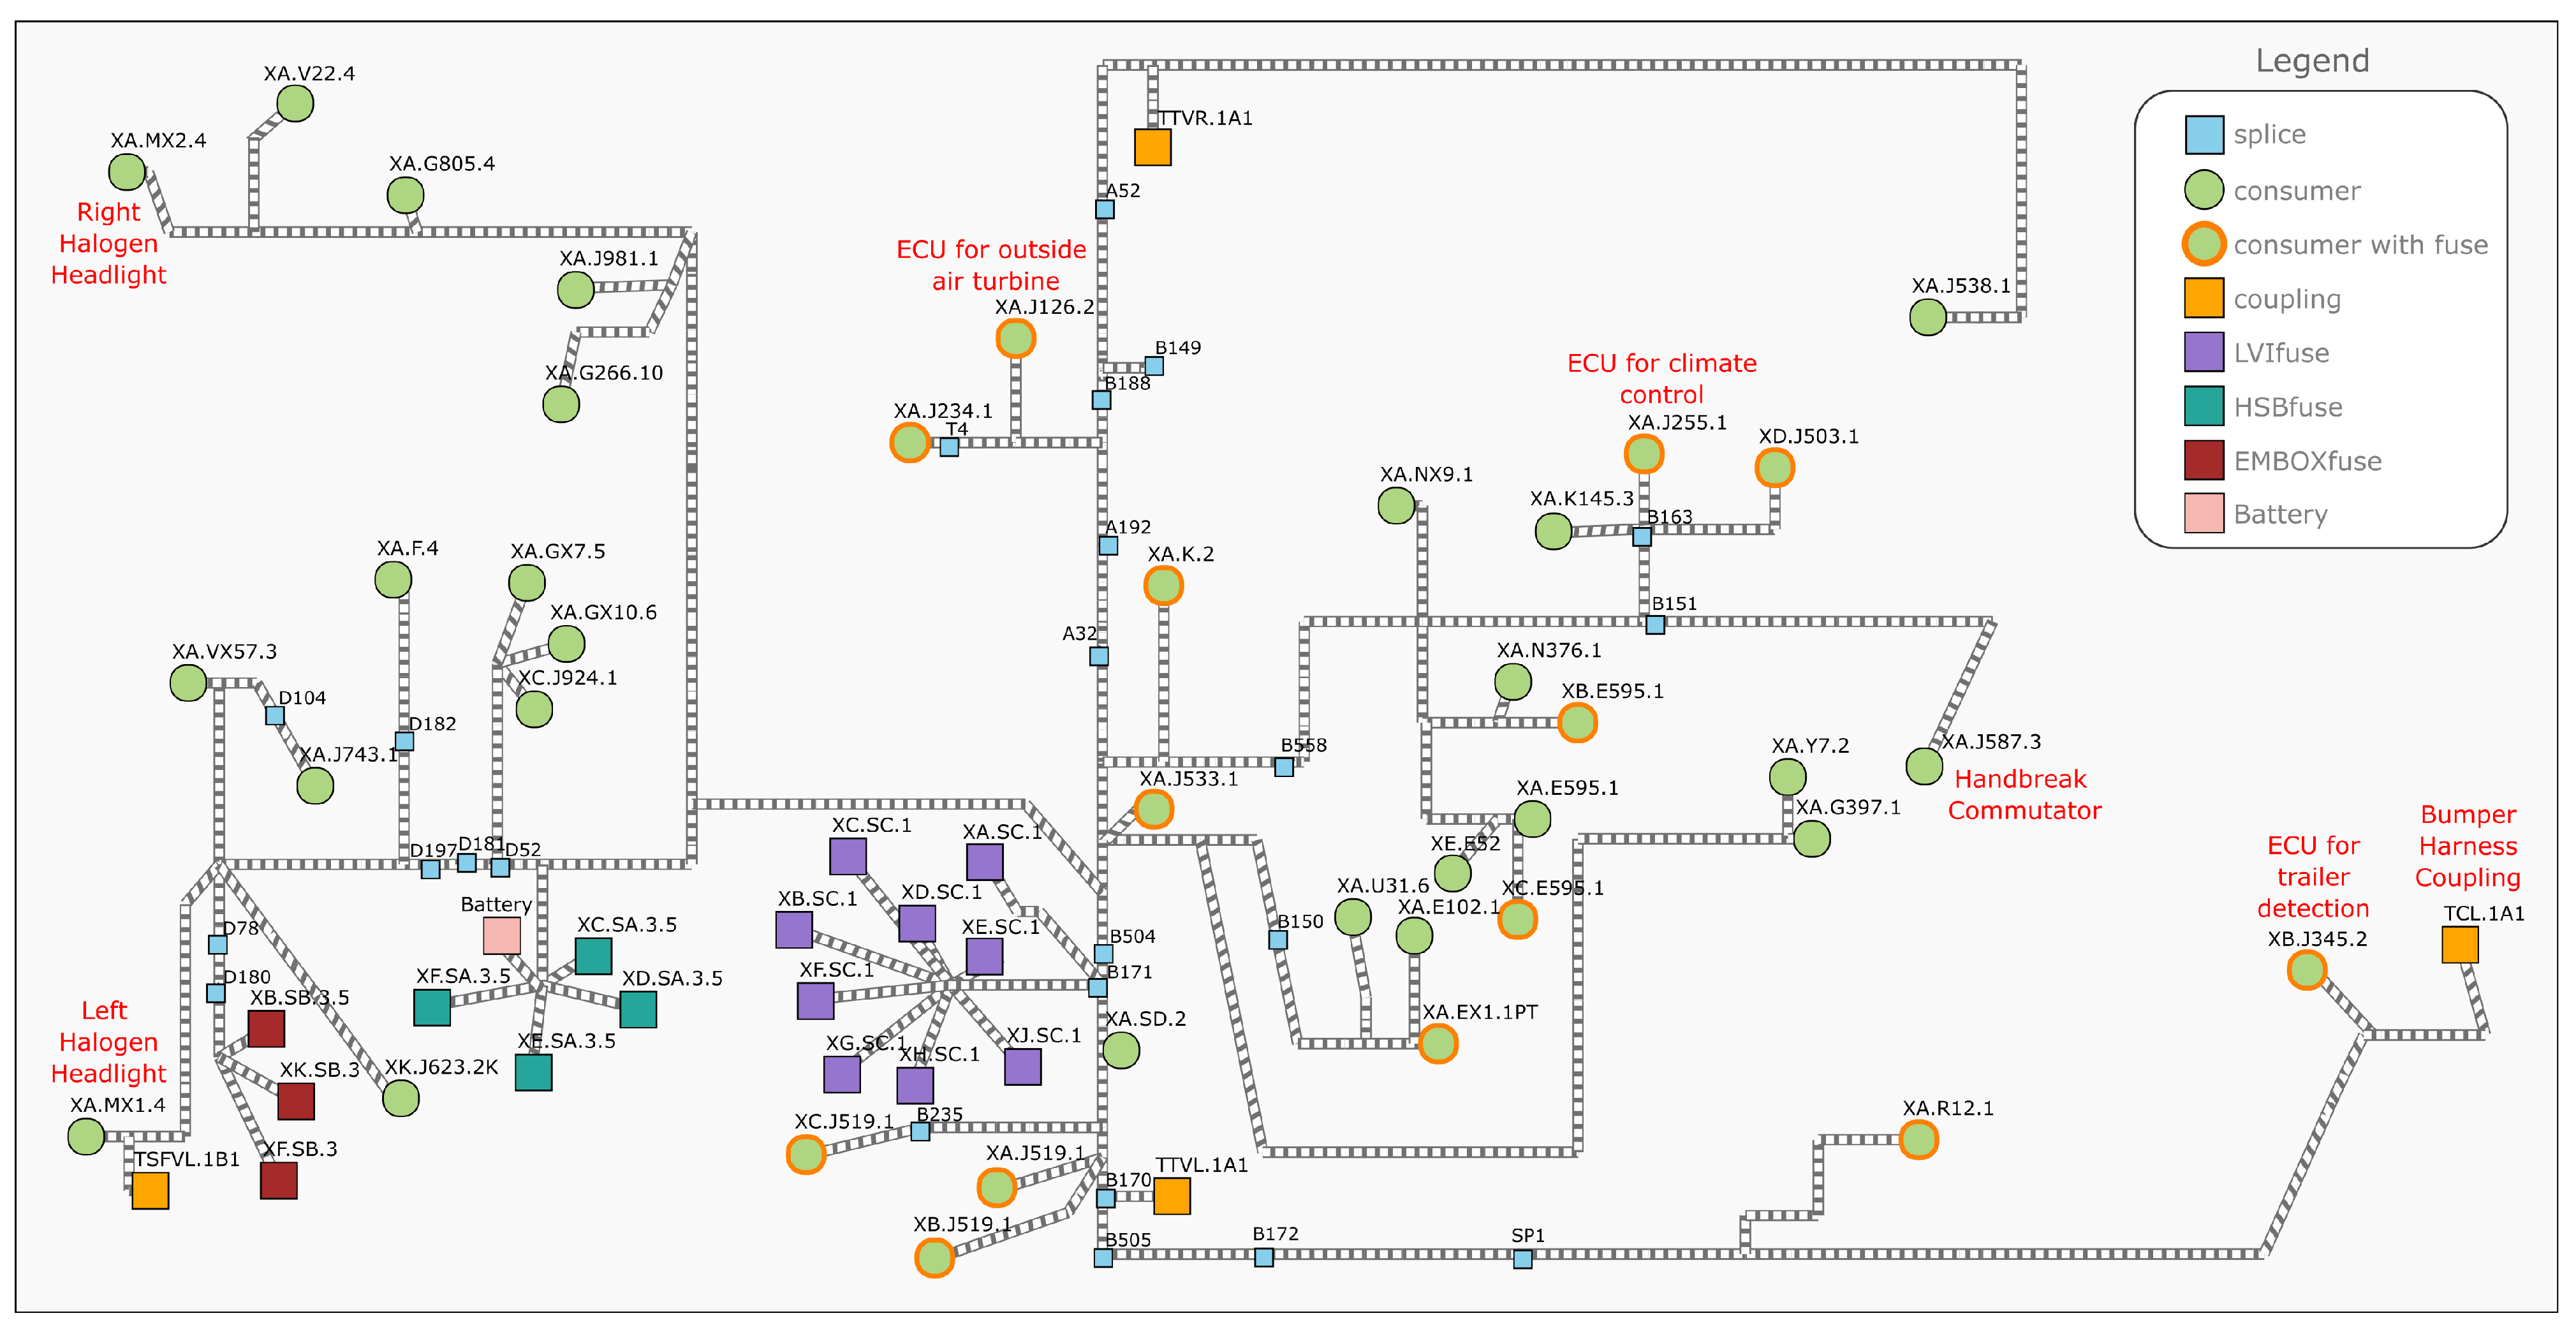
This view presents a broad level outlook of the nodes and the harness segments that interconnect them. These segments are drawn according to their from-to nodes that were previously tabulated in the Segmentsdata. Not all the nodes are related to electrical needs. That is the case of mechanical fixations, which stand for a high number of nodes that are relevant for the harness construction but negligible for the power flow simulation. It also must be noticed that every segment represents a bundle section containing different cables whose characteristics are defined in the Linecode. Therefore, a single wire may have a number of segments from one edge to the other. To correlate the specific path of every cable in the Linedata, the Routesdata file contains for each wire the different segments it goes through. For the General View, the positioning of the elements is obtained scaling down the XY coordinates of the Nodedata according to the available screen size in pixels. To facilitate a cleaner visualization, only the electrical nodes and segments present in the studied vehicle configuration are shown, leaving aside the nodes related to mechanical events. This is achieved by means of the Nodestodraw and Segmentstodraw files. Among the type of electrical nodes, we have (i) battery, (ii) main fuse box (HSBfuse), (iii) interior fuse box (EMBOXfuse), (iv) engine fuse box (LVIfuse), (v) coupling, (vi) splice and (vii) consumer. The power characteristics and the description/protection of the consumers are inferred from the Loaddata and Loadwithfuse, correspondingly. The pseudocode in Algorithm 1 elaborates on the overall process to create the broad General View and the wire-by-wire Detailed View. As it can be seen, both views share the initial stages and the last coding phase which are related to make meaning of the .CSV files and setup the interface functionalities, respectively. There, the description of selected power consumers has been added. It also can be observed that the XY factory assembling coordinates of the nodes and segments are evidenced as the generated layout can be associated to a top-view of the vehicle, where in the left side of the graph, we have the front headlights, and in the most-right part, we have the coupling to a secondary harness related to the bumper.

3.2. The Detailed View

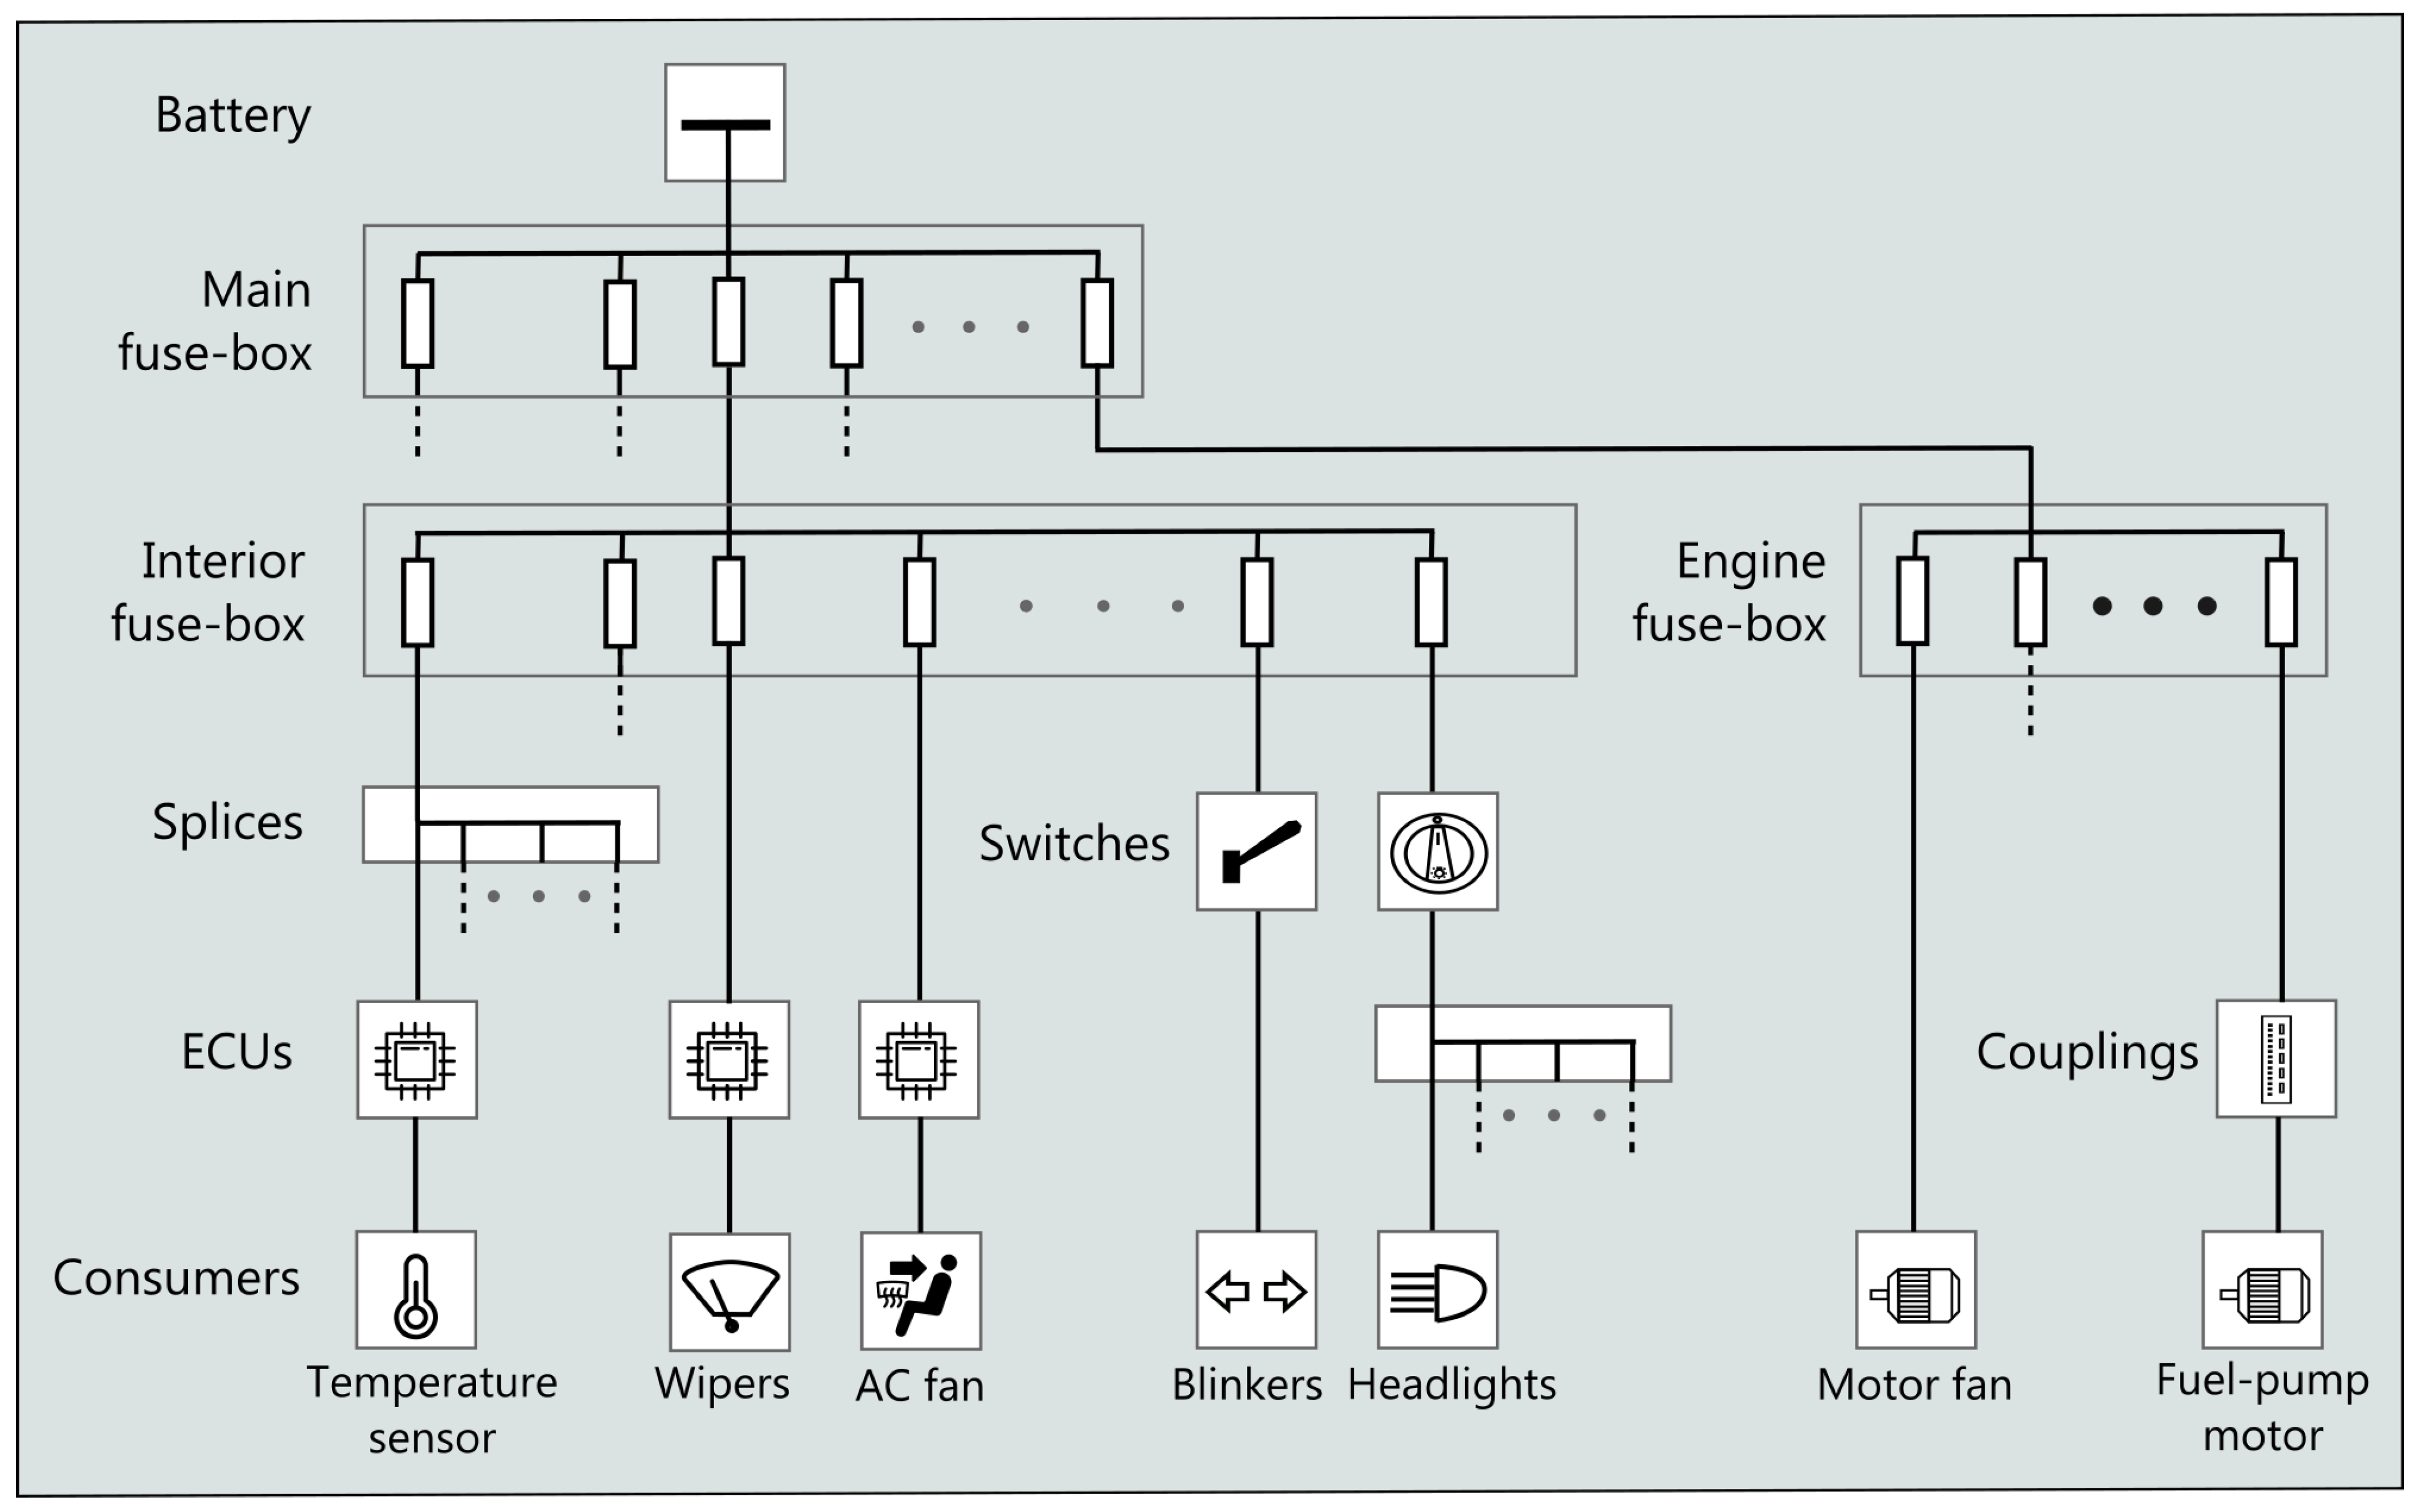
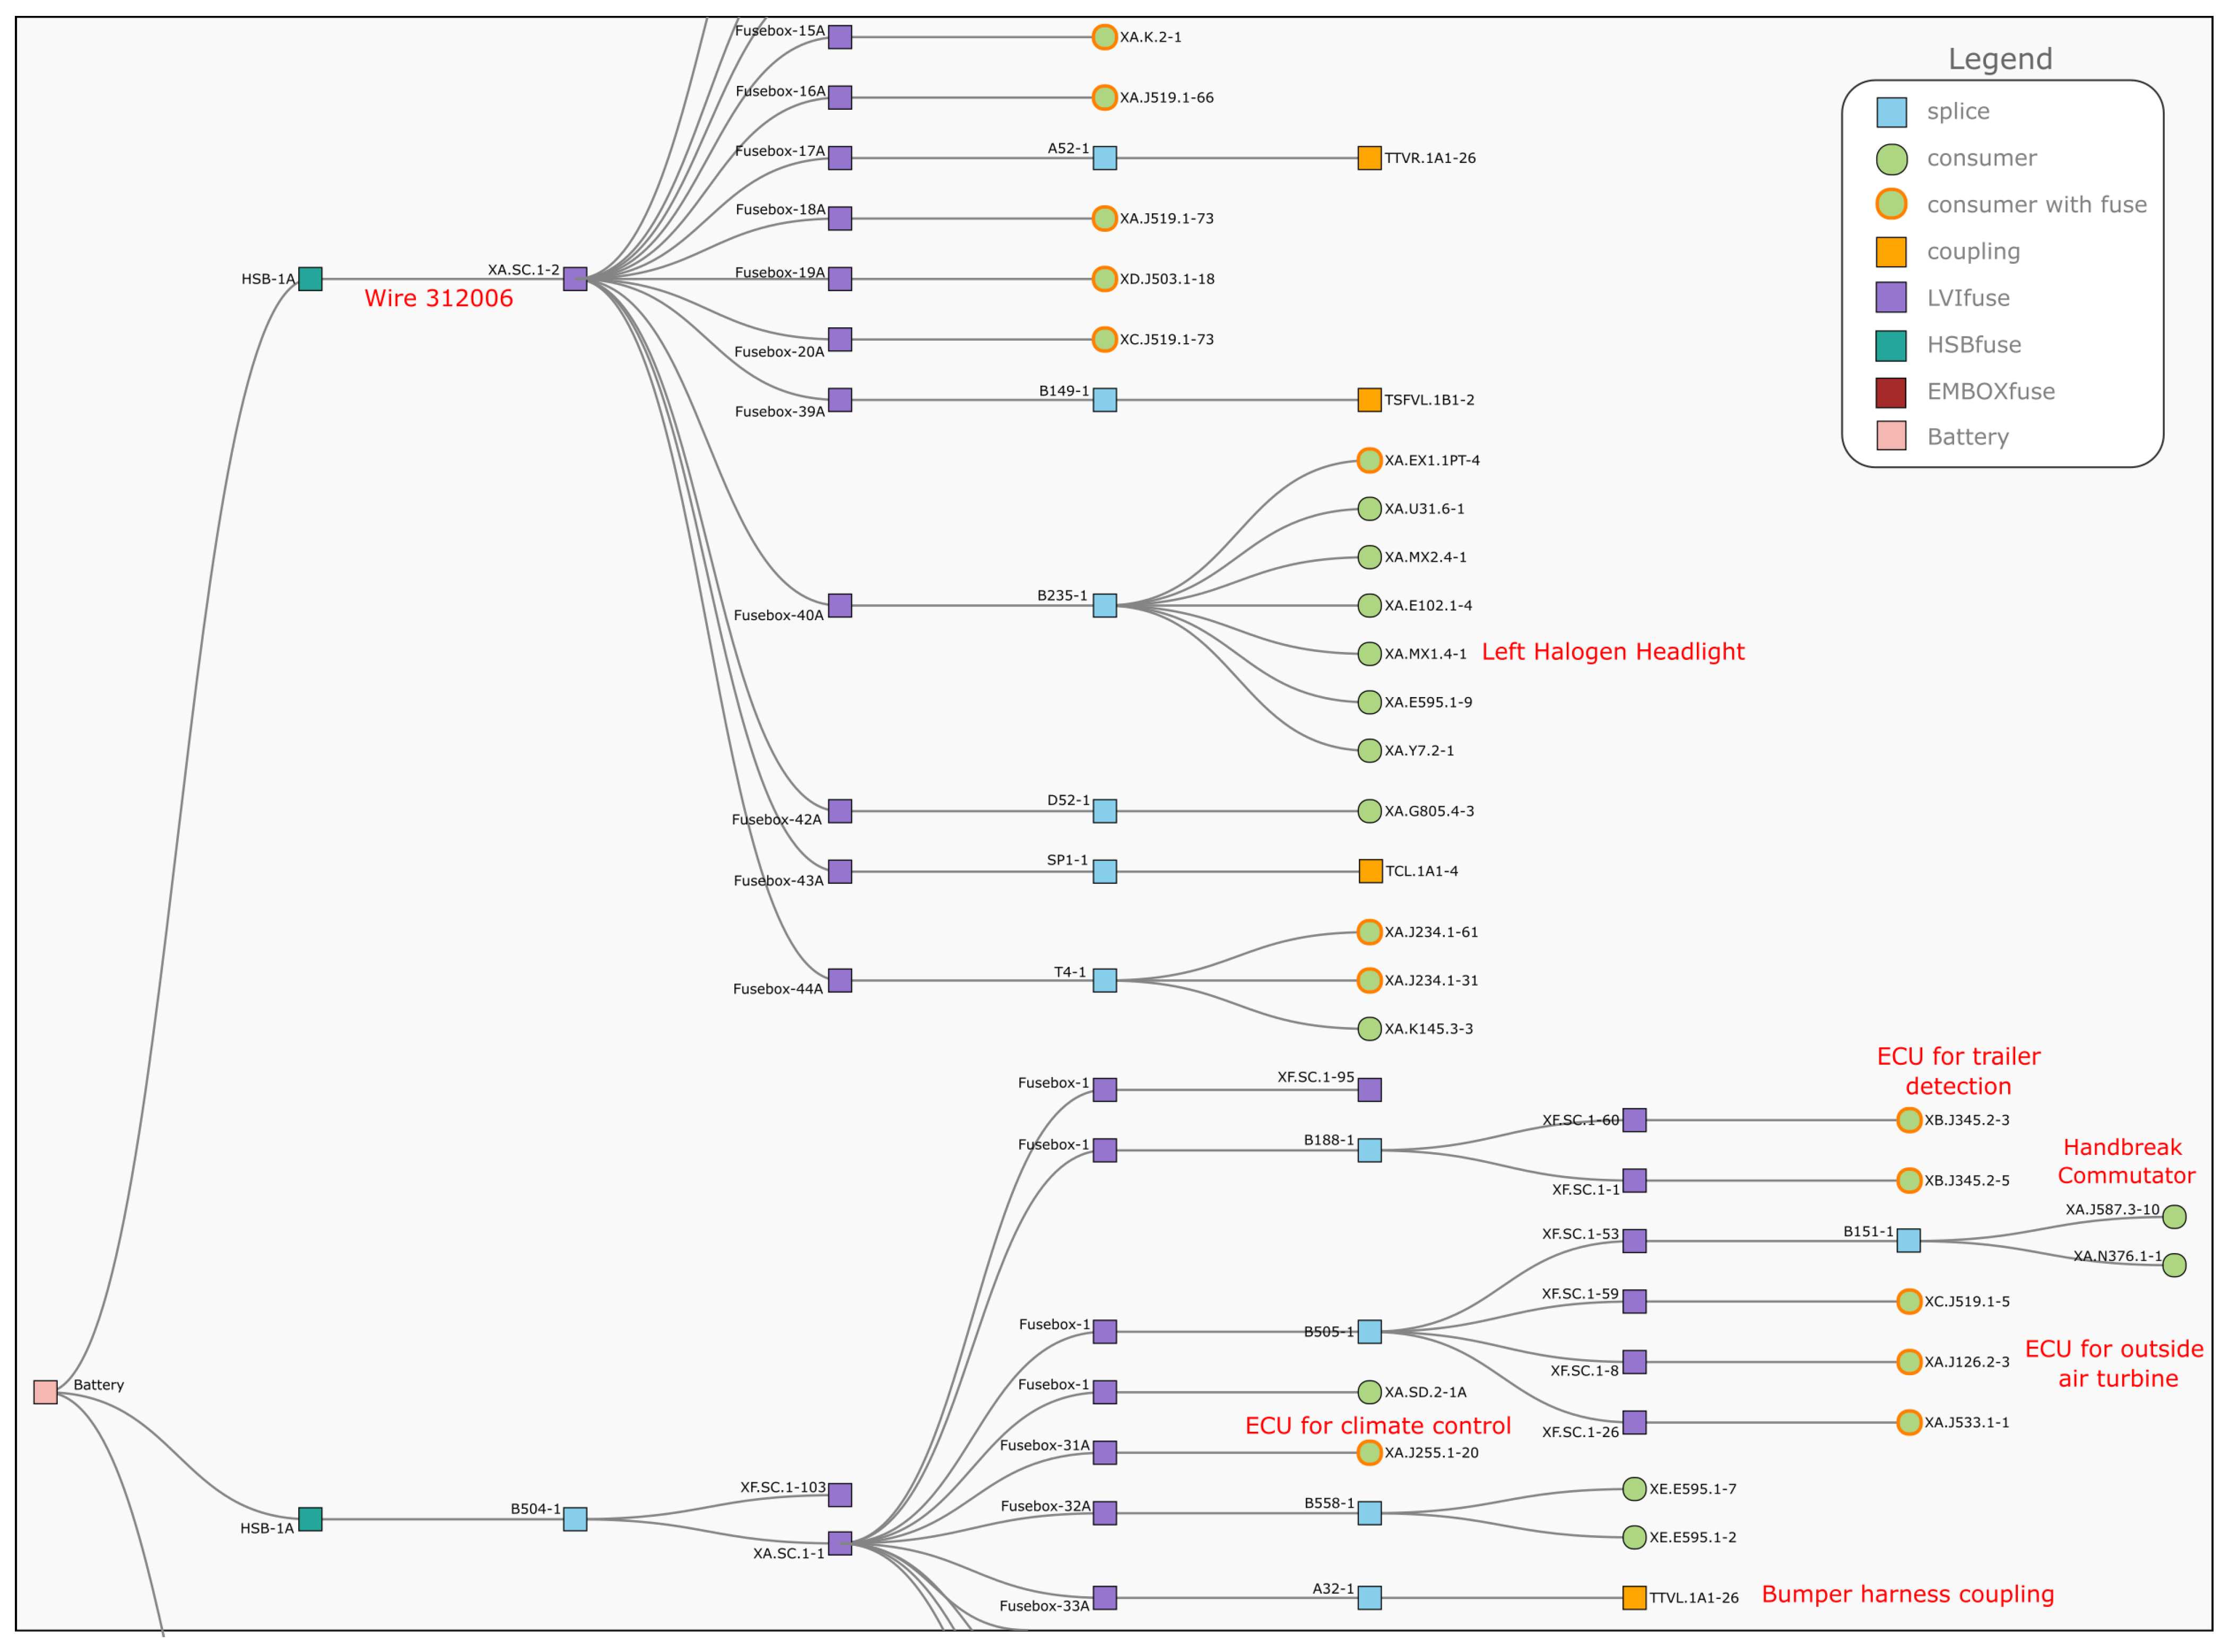
Regarding the second view type, the Detailed View, it aims to create a hierarchically wire-by-wire representation of the network to easily understand its connectivity. In on-board EDS, the power distribution is mostly radial, beginning from the battery and passing downstream through various electrical elements (e.g., fuses, splices, ECUs and switches) to finally arrive to the consumers. This scheme is represented in a simplified manner in Figure 4. This path, from the battery to a load, can be accomplished with the main harness itself or, in turn, using a coupling to add a secondary harness. Nevertheless, discarding elements related to communication and instrumentation purposes, hundreds of electrical nodes and lines are commonly present in a main harness. Additionally, making electrical meaning from manufacturing data that is not designed for electrical studies also represents a challenge. These factors add complexity to the creation of an algorithm that is able to automatically position all the nodes in a coherent manner to then create aesthetic wire routing paths favoring a clean, intuitive scheme of the electrical network.
In the literature, a few works report research on the automatic generation of electrical diagrams [2]. These are encompassed in the power systems domain. Some references address one-line diagrams creation considering XY coordinate constraints related to the nodes geographic information [35,36], while in other references restrictions in the nodes positioning are not a requirement [37,38]. In the case of vehicular EDS, the factory XY coordinates of the nodes are not determinant for a proper wire-by-wire hierarchical understanding of the network. Therefore, an ad hoc approach based on a tree-like scheme was implemented for satisfactory forming aesthetically functional drawings. This was achieved using as a base the Javascript-powered D3.tree library which generates node-link diagrams that lay out the connectivity between nodes in a parent–child correlation considering the tree representation algorithm exhibited in [39]. Under this approach, every child element is expected to have only one parent element. However, as earlier mentioned, on-board EDS are not purely radial but slightly meshed and some cross-feedings may exist in some cases to procure supply redundancy. Therefore, redundant links existing when a child node has two or more parent nodes are detected and individually generated. The stages for the creation of this wire-by-wire representation are presented in Algorithm 1. On the other hand, Figure 5 and Figure 6 present the resulting General View and Detailed View for the main harness of the SEAT Ibiza car model, respectively. In the Detailed View, to procure easier user navigation in the diagram, the nodes hierarchy is displayed horizontally, from left to right.
Algorithm 1: General and Detailed Views Generation.
Require: .CSV files resulting from the preprocessing stage (e.g.: Gendata, Nodedata, Nodestodraw, Segmentsdata, Loaddata, Linedata ...)
Ensure: Harness General and Detailed Views
 1. Create the web-interface elements and components using the Angular framework
 2. Parse input .CSV files
 3. Convert input files into data objects (e.g.: NodedataObj, LinedataObj, SegmentsdataObj... )
 4. Correlate nodes with consumers and their protection fuses matching LoaddataObj, LoadtitlewithfuseObj and NodedataObj
 5. Correlate harness segments with the wires and their routing using SegmentsdataObj, RoutesdataObj and LinedataObj
 6. Infer nodes and segments to draw considering NodestodrawObj and SegmentstodrawObj
 7. Create the SVG containers and configure their functionalities such as zoom and panning
 8. if The General View is required then
 9.  Scale down the XY positioning of nodes from NodedataObj considering the available screen size
 10.  Use D3 library to draw nodes, segments, patterns, texts and others
 11. end if
 12. if The Detailed View is required then
 13.  Infer child-parent correlation in LinedafirstneighObj for main harnesses and LinedaObj for secondary harnesses
 14. Use D3.tree to give tree-hierarchy structure to the data
 15. Use base D3 library to draw nodes, links, texts and others
 16. Detect and individually draw redundant links
 17. end if
 18. Assign colors and styles to the different elements
 19. Create and setup additional elements and interface functionalities (e.g.: interactive
    legend, tooltips, mouse-over highlighting, elements search-box, contextual menus,
    draggable nodes, correlation between views, simulation results export)

4. Visual Analytics Strategies

To improve user experience and ease human–information interaction, visual analytics (VA) strategies have been enclosed into the implemented web-based simulation environment. The VA precept lies in “combining automated analysis with interactive visualizations for effective understanding, reasoning and decision-making on the basis of a very large and complex datasets” [40]. Similarly to other engineering fields, VA has been also denoted as a relevant tool for software deployment in the transportation and automotive sectors for applications related to urban mobility patterns inference [41], urban congestion control [42] and in-car communication networks [43,44]. To adjust on-board EDS designs, engineers are nowadays demanded to consider isolated pieces of information related to construction guides, standards, electrical layouts and elements datasheets. Thus, some software platforms are typically used in parallel and thus further increasing the design complexity of EDS which are already complex systems. Under this approach, understand the network topology and infer the consequences in the modification of components and their sizing exhibits a significant challenge.
1
Automate the integration of all the necessary information. Once the user inserts the necessary factory input data files, the platform preprocess, derives and organizes all the information required for visualization and electrical simulation of the harness as the previous section elaborated.
2
Provide the user with a functional user-friendly interface. This was fulfilled by means of the following features:
  • 2a   Intuitive electrical diagrams via the already mentioned broad (General View) and wire-by-wire (Detailed View) schematics.
  • 2b   Elements highlighting and tooltips on mouse-over actions to ease the visualization and understanding of the selected items.
  • 2c   Interactive nodes legend to highlight in the schematic all the elements of the selected node type.
  • 2d   Preprocessing and simulation pop-up messages to keep the user informed along the process.
  • 2e   Pan and zoom options for a proper navigation into the electrical diagrams.
  • 2f   Shape and color coding of nodes, wires and harness segments to favor a prompt distinction of elements and risky simulation outcomes such as excessive temperatures.
  • 2g   Elements search box to rapidly locate specific wires and nodes in the network. When the desired element is found, it is highlighted and the screen is zoomed close to it.
  • 2h   Contextual menus via right-click over elements to download datasheets (consumers) or see troublesome temperature conditions after simulation (harness segments). On the latter, once the user clicks the contextual menu related to the problematic wire in the General View, the tool automatically shifts to the Detailed View to represent the risky condition in a wire-by-wire basis.
  • 2i   Draggable consumer nodes in the General View to permit the user a cleaner visualization of the network.
  • 2j   Option to export simulation results in a spreadsheet.
Some of the above functionalities have been exemplified in Figure 7 as well as in Figure 5 and Figure 6.
3
Facilitate the understanding of the electrical behavior of the network via simulation, including the following:
  • 3a   Static or time-dependent power flow simulations where the user can add personalized current profiles for the loads.
  • 3b   Simulation logs exposing undesired conditions (wires over temperatures and fuses mismatches) as well as different tables detailing all the simulation results regarding voltages, currents and temperatures in wires.
  • 3c   Simulations with parameters variations where the user can modify the length, section and ambient temperature of wires.
  • 3d   Time plots to visualize electrical variables when consumers current profiles are inserted.

5. Simulation Workflow

This section elaborates on the entire workflow to perform a power flow simulation for the main harness of the commercial vehicle that has been considered so far, the SEAT Ibiza model. The full on-board EDS of the SEAT Ibiza vehicle is deployed using one main harness that feeds four secondary harnesses by means of couplings. The simulation has been devised to take place in single harnesses. Therefore, if the user assigns a current profile to a consumer present in a secondary harness, it is first required to perform a simulation in this harness in order to obtain the corresponding current consumption for each pin of the coupling as this element would be assumed as a load when simulating the main harness. A detailed explanation regarding the simulation numerical methods, considerations and algorithms can be found in [8]. There, simulation results are compared against experimental data in a real test scenario, exposing satisfactory results.
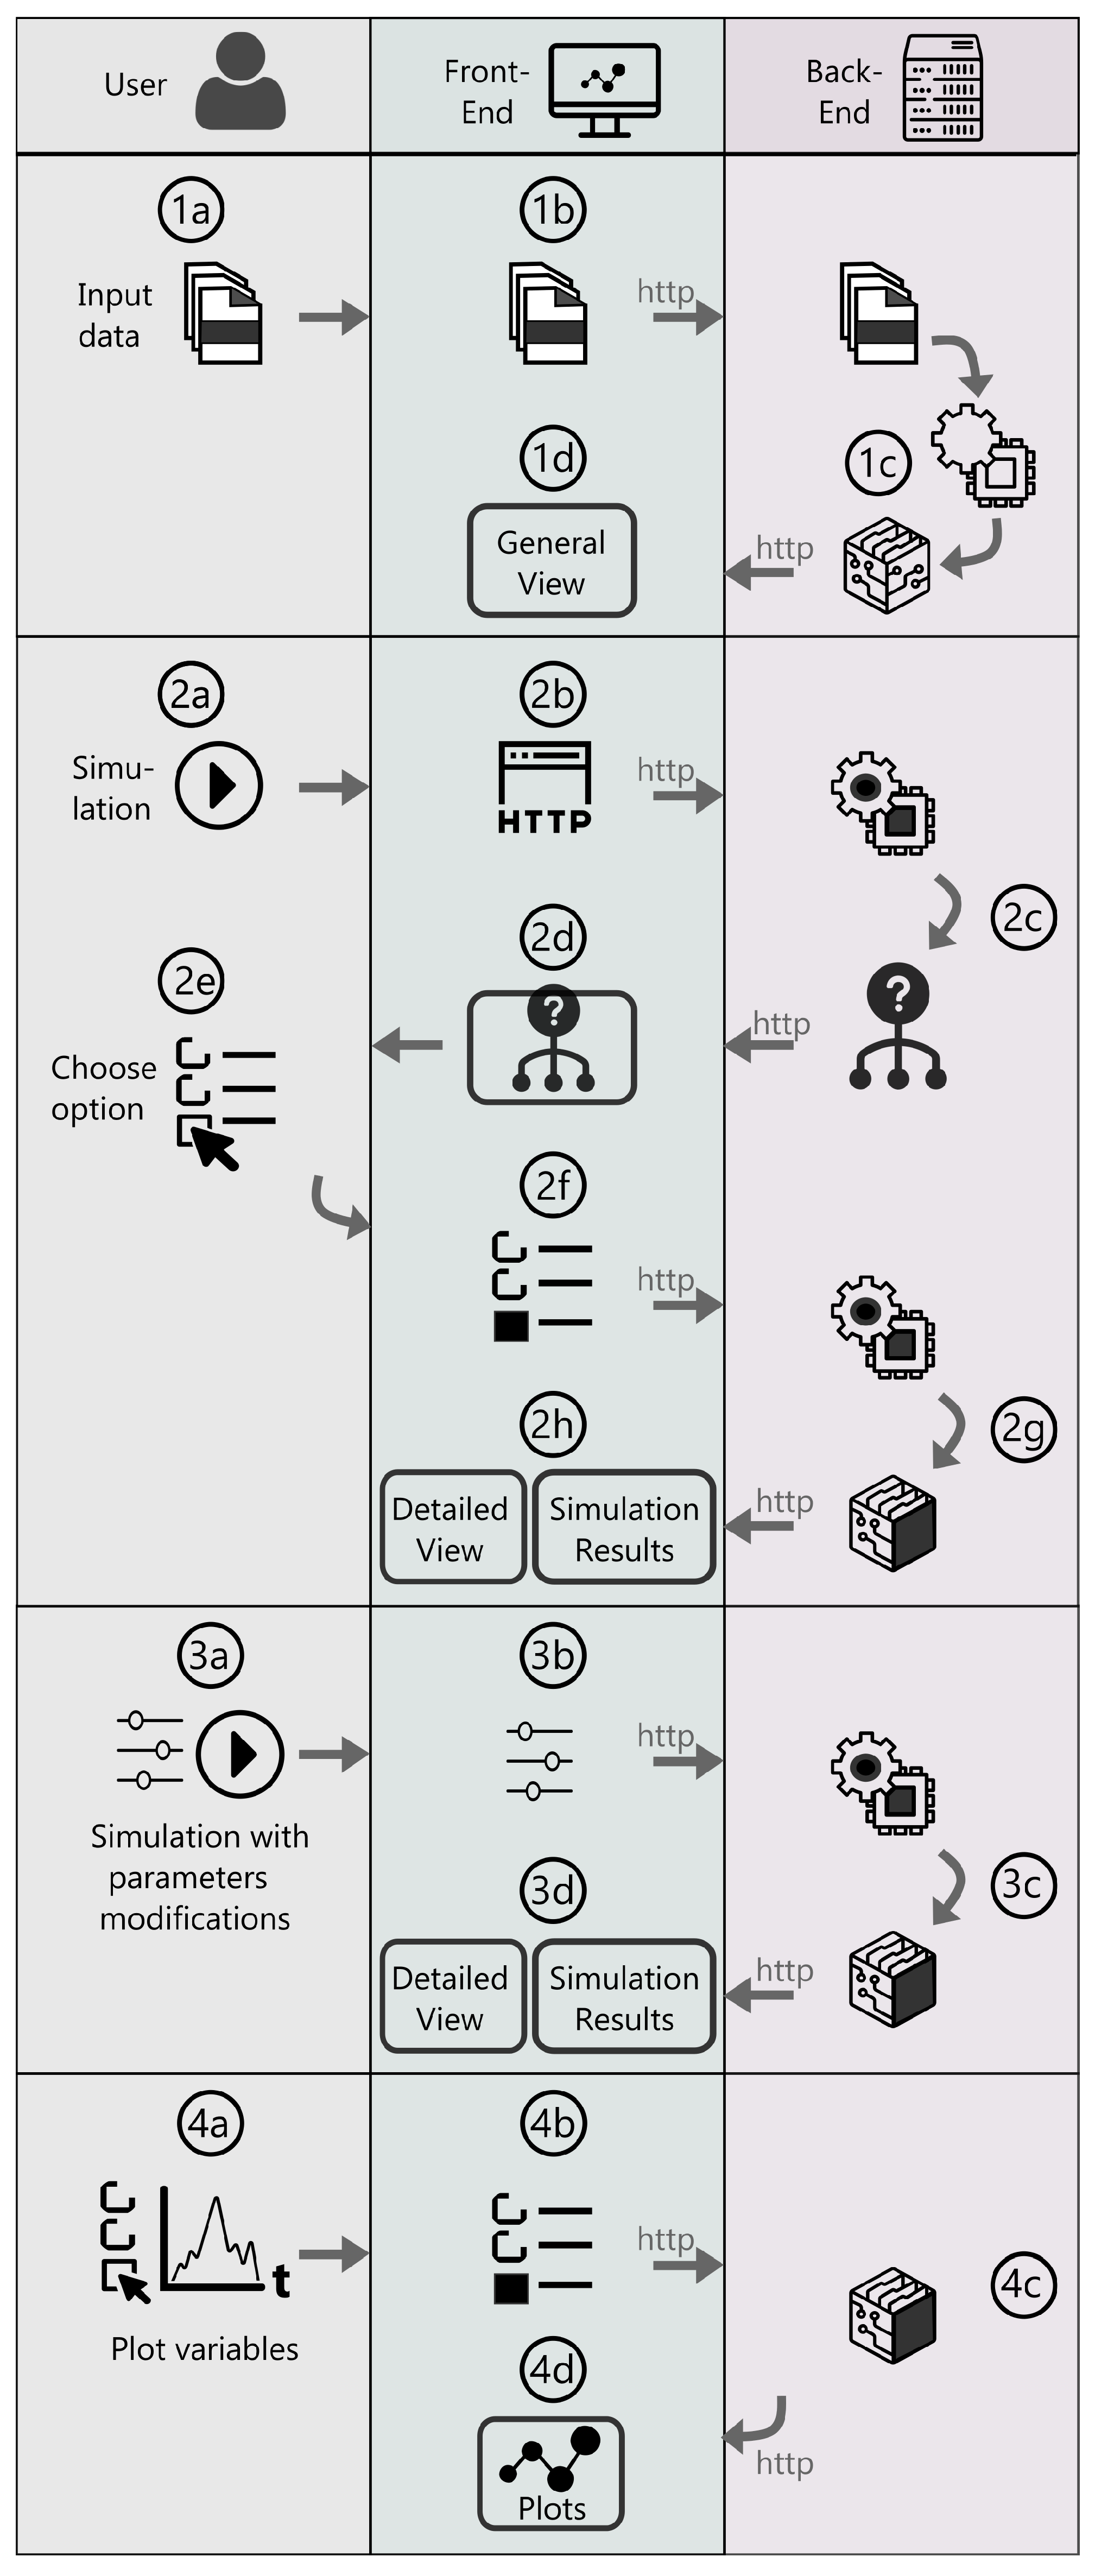
The simulation process (see Figure 8) and the execution of basic functionalities of the platform are described below.
  • 1a   The user inserts the corresponding input data files as specified in Section 3, for this case study this is the data related to the SEAT Ibiza main harness. As a time-dependent simulation will be conducted, the consumers have been assigned different time-varying current profiles.
  • 1b   The web-browser packs the information and send it to the Back-End attached to the HTTP request.
  • 1c   As detailed in Section 3, the preprocessing takes place over the input data executing different Python scripts that extract and arrange the electrical information in CSV files. The latter are now sent to the Front-End via an HTTP response.
  • 1d   The General View is generated as in Algorithm 1 and the user can interact with it.
Now, to perform the power flow analysis, these are the necessary steps:
  • 2a   The user clicks the corresponding simulation button.
  • 2b   An HTTP request is sent to the Back-End with the simulation demand.
  • 2c   A first stage of the power flow simulation, related to connectivity analysis, takes place. As in some cases the use of the input data itself is not enough to determine all the connection paths lying downstream from the main fusebox, the possible connectivity options for the isolated nodes are sent to the Front-End.
  • 2d   The interface displays a pop-up dialog that lists the connectivity alternatives.
  • 2e   The user chooses the corresponding connectivity options for the isolated nodes.
  • 2f   The interface sends the selected items to the Back-End.
  • 2g   The second part of the power flow algorithm is executed. The simulation results are organized in different CSV files, some of these are related to voltages and currents in the consumers, while the others are associated to the nodes and lines in the network. The latter (see Figure 3) are sent to the Front-End.
  • 2h   The interface shows a pop-up dialog exposing the simulation log where troublesome conditions (such as fuses mismatches and over temperatures in wires) are highlighted. The new incoming files are then processed to create the Detailed View and an additional tab containing all the simulation results related to voltages in nodes as well as currents, voltage drops and temperatures in wires.
To assist the user to fine-tune vehicle EDS designs, there is an specific option to perform power flow simulation including modifications in length, section and ambient temperature of wires. In this respect, note the following.
  • 3a   The required modifications are selected by the user in a tab designed for this purpose.
  • 3b   The modifications list is sent to the Back-End.
  • 3c   The entire power flow simulation takes place as the main fusebox connectivity was already given by the user in the former process. The new simulation files are issued to the Front-End.
  • 3d   The electrical schematics and tables are updated according to the new incoming files.
To favor the visual comprehension of the behavior of the electrical variables in the network, time plots can be displayed. To do so, note the following.
  • 4a   In the corresponding tab, the user selects the variables to plot for the consumers (voltage, current, power) as well as for the wires (voltage drop, current).
  • 4b   The list of variables to plot are sent to the Back-End.
  • 4c   The server sends back the simulation files related to the selected variables. This approach was employed to make the process more fluid by delivering on-demand only the desired simulation results. Given the large amount of electrical variables that can exist in a harness simulation, delivering all the results at once would be counterproductive.
  • 4d   At the web-browser, after parsing the received files, time-plots like in Figure 9 are generated using the D3 library. There we can see, for a given simulation scenario, that when the Left Halogen Headlight (see down-left part of Figure 5) is demanding power according to a profile predefined by the user, its voltage correlates with the current flow in an upstream cable that feeds this consumer’s branch, namely wire 312006 (see top-left part of Figure 6).

6. Case Study Discussion

In the previous sections, the different outcomes of the visualization and simulation functionalities have been illustrated taking as a reference the main harness from the SEAT Ibiza car model which encompasses hundreds of electrical nodes and tens of power consumers. Those results are now concisely discussed. The visual understanding of the harness network was fostered with the automatic generation of custom-made broad level (General View) and single-line level diagrams (Detailed View). The General View resembled the physical configuration of a harness in a vehicle, in a top-view disposition; while the Detailed View favored the visualization of the connectivity in the elements of the system in a hierarchical manner like in traditional one-line diagrams. Aesthetic yet interactive representations of the network were accomplished considering Visual Analytics strategies. For instance, different colors and symbols were employed to represent the different elements and ease their recognition. Moreover, the user is able to drag the nodes in the screen to procure a cleaner network visualization if needed. Mouse-over tooltips, contextual menus, interactive legends, search-box elements among other tools, permitted to provide the user with helpful information derived from the modeling and simulation embedded in the computer platform. Indeed, the network conditions encountered via simulation are conveniently remarked and provided to the user by means of elements coloring for unwanted states, opportune pop-up informative messages, tables with the electrical variables and time plots. In addition, the user can perform further simulations with wire parameters modifications and witness the effects in the network for those new conditions.
Last, the reported simulation workflow demonstrated flexibility and modularity by means of the mature 3-tier scheme which encompasses the web browser, the web server and the simulation engine. The roles and complete interaction between the 3-tier elements was described in detail to favor a concise understanding about the implementation of this strategy. The use of tailored Python-based data preprocessing at the Back-End allowed to make electrical meaning from factory datasets that are not intuitive as they are mostly intended for manufacturing purposes. By doing so, the electrical network topology of the wire harness was inferred and conveniently organized into different CSV files considering typical data formats from the power systems field. These files were then employed for visualization purposes at the Front-End using the Angular framework for web interface development. When a simulation or further data treatment is demanded by the user, an http request is assigned to the Back-End that again, with the use of the Node.js environment and Python scripts applies the necessary modeling and numerical methods to fulfill the specific user request. Then, a reply with the correlated data is created to update the interface in a useful manner. All this process was designed to enhance the user cognition about the corresponding state of the network in the analyzed scenarios.

7. Conclusions

Computer simulation has been permeating the industry as it contributes to higher system analysis, greater robustness, prototyping reduction and economic savings. This has been the case of some vehicular systems such as aerodynamics, autonomous driving, energy management and electrified traction. However, only lately some sustained research has exposed the use of tailored simulation tactics for on-board Electrical Distribution Systems (EDS), which are responsible for delivering power supply to the equipment within a vehicle. In this regard, this work has reported the development of a web-based simulation platform intended to reduce physical experimentation needs and thus pave the way towards zero-prototyping in vehicular EDS. Considering visual analytics-based precepts to boost user productivity, features such as data preprocessing, visualization, simulation and reporting have been incorporated in a single computer tool for this aim. On the other hand, an intuitive visual understanding of the electrical network was achieved by means of tailored broad level and single-line level schematics. The deployed software functionalities were validated considering a real harness from a commercial vehicle. The practicality and versatility of the proposed architecture, added to the sole use of open-source tools, makes the exhibited platform readily scalable to other automotive or transportation web-based environments that require computer simulation.

Author Contributions

Conceptualization, P.A. and M.A.D.M.; methodology, X.D. and P.M.-P.; software, X.D., P.M.-P. and I.E.-S.; validation, X.D., P.M.-P. and N.G.; formal analysis, X.D. and P.M.-P.; investigation, X.D. and P.M.-P.; resources, P.M.-P. and N.G.; data curation, X.D. and P.M.-P.; writing—original draft preparation, X.D.; writing—review and editing, X.D., P.M.-P. and P.A.; visualization, X.D.; supervision, P.A., I.E.-S.; project administration, P.A.; funding acquisition, M.A.D.M. All authors have read and agreed to the published version of the manuscript.

Funding

This work was partially supported by SEAT under grant for Industrial PhD. project FUO-371-17 (Development of tools for electrical and thermal simulation of the on board electrical network of vehicles), and by RueckerLypsa under grant for Industrial PhD. project FUO-200-18 (Development of a visual analytics tool for representing and analyzing the on-board electrical network of vehicles).

Conflicts of Interest

The authors declare no conflict of interest.

References

  1. Zhou, L.; Ren, L.; Laili, L. Modeling and Simulation in Intelligent Manufacturing. Comput. Ind. 2019, 112, 103123. [Google Scholar]
  2. Dominguez, X.; Arboleya, P.; Mantilla-Perez, P.; El-Sayed, I.; Gimenez, N.; Millan, M.A.D. Visual Analytics-Based Computational Tool for Electrical Distribution Systems of Vehicles. In Proceedings of the 2019 IEEE Vehicle Power and Propulsion Conference (VPPC), Hanoi, Vietnam, 14–17 October 2019; pp. 1–5. [Google Scholar] [CrossRef]
  3. Sajjad, M.; Irfan, M.; Muhammad, K.; Ser, J.D.; Sanchez-Medina, J.; Andreev, S.; Ding, W.; Lee, J.W. An Efficient and Scalable Simulation Model for Autonomous Vehicles With Economical Hardware. IEEE Trans. Intell. Transp. Syst. 2021, 22, 1718–1732. [Google Scholar] [CrossRef]
  4. Jiang, D.; Huo, L.; Zhang, P.; Lv, Z. Energy-Efficient Heterogeneous Networking for Electric Vehicles Networks in Smart Future Cities. IEEE Trans. Intell. Transp. Syst. 2021, 22, 1868–1880. [Google Scholar] [CrossRef]
  5. Pokhrel, S.R. Software Defined Internet of Vehicles for Automation and Orchestration. IEEE Trans. Intell. Transp. Syst. 2021, 22, 3890–3899. [Google Scholar] [CrossRef]
  6. Mantilla-Pérez, P.; Pérez-Rúa, J.; Millán, M.A.D.; Domínguez, X.; Arboleya, P. Power Flow Simulation in the Product Development Process of Modern Vehicular DC Distribution Systems. IEEE Trans. Veh. Technol. 2020, 69, 5025–5040. [Google Scholar] [CrossRef]
  7. Dominguez, X.; Arboleya, P.; Mantilla-Perez, P.; El-Sayed, I.; Gimenez, N.; Millan, M.A.D. Development of a Computer Platform for Visualization and Simulation of Vehicular DC Distribution Systems. IET Electr. Syst. Transp. 2020, 10, 341–350. [Google Scholar] [CrossRef]
  8. Mantilla-Pérez, P.; Domínguez, X.; Gimenez, N.; Mohamed, B.; Millán, M.A.D.; Arboleya, P. Vehicular Electrical Distribution System Simulation Employing a Current-injection Algorithm. IEEE Trans. Transp. Electrif. 2021. [Google Scholar] [CrossRef]
  9. Xie, J.; Wang, X.; Yang, Z.; Hao, S. An Integrated Cloud CAE Simulation System for Industrial Service Applications. IEEE Access 2019, 7, 21429–21445. [Google Scholar] [CrossRef]
  10. Xiaocheng, L.; Qiang, H.; Xiaogang, Q.; Bin, C.; Kedi, H. Cloud-based Computer Simulation: Towards Planting Existing Simulation Software Into the Cloud. Simul. Model. Pract. Theory 2012, 26, 135–150. [Google Scholar]
  11. Multisim Live Online Simulator. Available online: www.multisim.com (accessed on 1 June 2021).
  12. Autodesk Tinkercad. Available online: www.tinkercad.com (accessed on 1 June 2021).
  13. CircuitLab Online Circuit Simulator. Available online: www.circuitlab.com (accessed on 1 June 2021).
  14. Partsim Circuit Simulation. Available online: www.partsim.com (accessed on 1 June 2021).
  15. Sousa, J.; Coury, D.; Fernandes, R. A Survey on Cloud Computing Applications in Smart Distribution Systems. Electr. Power Compon. Syst. 2018, 46, 1554–1569. [Google Scholar] [CrossRef]
  16. Byrne, J.; Heavey, C.; Byrne, P. A Review of Web-based Simulation and Supporting Tools. Simul. Model. Pract. Theory 2010, 18, 253–276. [Google Scholar] [CrossRef]
  17. Internet Technology Based Power System Simulator (InterPSS). Available online: https://sites.google.com/a/interpss.org/interpss/Home (accessed on 8 June 2021).
  18. MATPOWER Simulator. Available online: https://matpower.org (accessed on 8 June 2021).
  19. Neplan 360 Cloud Simulator. Available online: https://www.neplan.ch/neplanproduct/en-neplan-360-cloud/ (accessed on 8 June 2021).
  20. Simulink Online. Available online: https://es.mathworks.com/products/simulink-online.html (accessed on 8 June 2021).
  21. Huang, Q.; Zhou, M.; Zhang, Y.; Wu, Z. Exploiting Cloud computing for Power System Analysis. In Proceedings of the 2010 International Conference on Power System Technology, Hangzhou, China, 24–28 October 2010; pp. 1–6. [Google Scholar] [CrossRef]
  22. Leijiao, G.; Shouxiang, W.; Xianjun, G. Framework Design of Cloud Computing Technology Application in Power System Transient Simulation. In Proceedings of the 2014 IEEE PES Asia-Pacific Power and Energy Engineering Conference (APPEEC), Hong Kong, China, 7–10 December 2014; pp. 1–6. [Google Scholar] [CrossRef]
  23. Anderson, K.; Du, J.; Narayan, A.; Gamal, A.E. GridSpice: A Distributed Simulation Platform for the Smart Grid. IEEE Trans. Ind. Inform. 2014, 10, 2354–2363. [Google Scholar] [CrossRef]
  24. Fang, X.; Yang, D.; Xue, G. Evolving Smart Grid Information Management Cloudward: A Cloud Optimization Perspective. IEEE Trans. Smart Grid 2013, 4, 111–119. [Google Scholar] [CrossRef]
  25. Maheshwari, K.; Lim, M.; Wang, L.; Birman, K.; van Renesse, R. Toward a Reliable, Secure and Fault Tolerant Smart Grid State Estimation in the Cloud. In Proceedings of the 2013 IEEE PES Innovative Smart Grid Technologies Conference (ISGT), Washington, DC, USA, 24–27 February 2013; pp. 1–6. [Google Scholar] [CrossRef]
  26. Agamah, S.; Ekonomou, L. Agamah, S.; Ekonomou, L. A Methodology for Web-Based Power Systems Simulation and Analysis Using PHP Programming. In Electricity Distribution: Intelligent Solutions for Electricity Transmission and Distribution Networks; Springer: Berlin, Germany, 2016; pp. 1–25. [Google Scholar]
  27. Ma, F.; Luo, X.; Litvinov, E. Cloud Computing for Power System Simulations at ISO New England—Experiences and Challenges. IEEE Trans. Smart Grid 2016, 7, 2596–2603. [Google Scholar] [CrossRef]
  28. Luo, X.; Zhang, S.; Litvinov, E. Practical Design and Implementation of Cloud Computing for Power System Planning Studies. In Proceedings of the 2019 IEEE Power Energy Society General Meeting (PESGM), Atlanta, GA, USA, 4–8 August 2019; p. 1. [Google Scholar] [CrossRef]
  29. Liu, Y.; Song, Y.; Yu, Z.; Shen, C.; Chen, Y. Modeling and Simulation of Hybrid AC-DC System on a Cloud Computing Based Simulation Platform—CloudPSS. In Proceedings of the 2018 2nd IEEE Conference on Energy Internet and Energy System Integration (EI2), Beijing, China, 20–22 October 2018; pp. 1–6. [Google Scholar] [CrossRef]
  30. Ramos, M.; Valente, M.T.; Terra, R. AngularJS Performance: A Survey Study. IEEE Softw. 2018, 35, 72–79. [Google Scholar] [CrossRef] [Green Version]
  31. El-Sayed, I.; Mohamed, B.; Arboleya, P. Web-based Software-Suite for DC Railway Simulation and Analysis: Architecture, Data Management and Visualization. In Proceedings of the 2020 IEEE Vehicle Power and Propulsion Conference (VPPC), Gijón, Spain, 26–29 October 2020; pp. 1–6. [Google Scholar] [CrossRef]
  32. Bostock, M.; Ogievetsky, V.; Heer, J. D3: Data-Driven Documents. IEEE Trans. Vis. Comput. Graph. 2011, 17, 2301–2309. [Google Scholar] [CrossRef]
  33. Tilkov, S.; Vinoski, S. Node.js: Using JavaScript to Build High-Performance Network Programs. IEEE Internet Comput. 2010, 14, 80–83. [Google Scholar] [CrossRef]
  34. Koirala, A.; Suarez-Ramon, L.; Mohamed, B.; Arboleya, P. Non-synthetic European Low Voltage Test System. Int. J. Electr. Power Energy Syst. 2020, 118, 105712. [Google Scholar] [CrossRef]
  35. Birchfield, A.B.; Overbye, T.J. Techniques for Drawing Geographic One-Line Diagrams: Substation Spacing and Line Routing. IEEE Trans. Power Syst. 2018, 33, 7269–7276. [Google Scholar] [CrossRef]
  36. Mota, A.d.A.; Mota, L.T.M. Drawing Meshed One-Line Diagrams of Electric Power Systems Using a Modified Controlled Spring Embedder Algorithm Enhanced with Geospatial Data. J. Comput. Sci. 2011, 7, 234–241. [Google Scholar] [CrossRef] [Green Version]
  37. Lendak, I.; Erdeljan, A.; Capko, D.; Vukmirovic, S. Algorithms in Electric Power System One-line Diagram Creation: The Soft Computing Approach. In Proceedings of the 2010 IEEE International Conference on Systems, Man and Cybernetics, Istanbul, Turkey, 10–13 October 2010; pp. 2867–2873. [Google Scholar] [CrossRef]
  38. Lendak, I.; Vidacs, A.; Erdeljan, A. Electric Power System One-line Diagram Generation with Branch and Bound Algorithm. In Proceedings of the 2012 IEEE International Energy Conference and Exhibition, ENERGYCON 2012, Florence, Italy, 9–12 September 2012; pp. 947–951. [Google Scholar] [CrossRef]
  39. Reingold, E.; Tilford, J. Tidier Drawings of Trees. IEEE Trans. Softw. Eng. 1981, SE-7, 223–228. [Google Scholar] [CrossRef]
  40. Keim, E.D.; Kohlhammer, J.; Ellis, G. Mastering the Information Age: Solving Problems with Visual Analytics; Eurographics Association: Goslar, Germany, 2010. [Google Scholar]
  41. Huang, X.; Zhao, Y.; Ma, C.; Yang, J.; Ye, X.; Zhang, C. TrajGraph: A Graph-Based Visual Analytics Approach to Studying Urban Network Centralities Using Taxi Trajectory Data. IEEE Trans. Vis. Comput. Graph. 2016, 22, 160–169. [Google Scholar] [CrossRef] [PubMed]
  42. Kalamaras, I.; Zamichos, A.; Salamanis, A.; Drosou, A.; Kehagias, D.D.; Margaritis, G.; Papadopoulos, S.; Tzovaras, D. An Interactive Visual Analytics Platform for Smart Intelligent Transportation Systems Management. IEEE Trans. Intell. Transp. Syst. 2018, 19, 487–496. [Google Scholar] [CrossRef]
  43. Sedlmair, M.; Isenberg, P.; Baur, D.; Mauerer, M.; Pigorsch, C.; Butz, A. Cardiogram: Visual Analytics for Automotive Engineers. In Proceedings of the SIGCHI Conference on Human Factors in Computing Systems, Vancouver, BC, Canada, 7–12 May 2011; ACM: New York, NY, USA, 2011; pp. 1727–1736. [Google Scholar]
  44. Sedlmair, M.; Bernhold, C.; Herrscher, D.; Boring, S.; Butz, A. MostVis: An Interactive Visualization Supporting Automotive Engineers in MOST Catalog Exploration. In Proceedings of the 2009 13th International Conference Information Visualisation, Barcelona, Spain, 14–19 July 2009; pp. 173–182. [Google Scholar] [CrossRef]
Figure 1. Vehicular EDS of the SEAT Ibiza car model.
Energies 14 06087 g001
Figure 2. Web-based environment architecture.
Energies 14 06087 g002
Figure 3. Data generation workflow.
Energies 14 06087 g003
Figure 4. Simplified electrical topology of vehicular EDS.
Energies 14 06087 g004
Figure 5. General View for the main harness of the SEAT Ibiza car model.
Energies 14 06087 g005
Figure 6. Extract of the Detailed View for the main harness of the SEAT Ibiza car model.
Energies 14 06087 g006
Figure 7. Examples of VA-based features. (a) Elements search box and tooltip on mouse-over. Contextual menus on right-click: (b) Download consumer datasheet, (c) Harness with wire having temperature >105 °C and (d) Harness with wire having temperature >70 °C.
Energies 14 06087 g007
Figure 8. Simulation workflow.
Energies 14 06087 g008
Figure 9. Simulation time-plots examples.
Energies 14 06087 g009
Table 1. Network characteristics of the studied harness.
FeatureNumber
Mechanical and electrical nodes732
Electrical nodes175
Harness segments369
Lines180
Consumers46
Fuses25
Publisher’s Note: MDPI stays neutral with regard to jurisdictional claims in published maps and institutional affiliations.