Article

Towards Sustainable Energy Development in Sub-Saharan Africa: Challenges and Opportunities

1
Department of Entrepreneurship and Innovation, Cracow University of Economics, ul. Rakowicka 27, 31-510 Kraków, Poland
2
Department of Organization Development, Cracow University of Economics, ul. Rakowicka 27, 31-510 Kraków, Poland
3
Elliott School of International Affairs, George Washington University, Washington, DC 20052, USA
*
Author to whom correspondence should be addressed.
Energies 2021, 14(19), 6037; https://doi.org/10.3390/en14196037
Submission received: 28 August 2021 / Revised: 16 September 2021 / Accepted: 17 September 2021 / Published: 23 September 2021
(This article belongs to the Section C: Energy Economics and Policy)

Abstract

:
Sub-Saharan Africa is considered a region with enormous economic and demographic potential. One of the main challenges it faces, included in the “Agenda 2063: The Africa We Want, implemented by the African Union”, is to provide access to electricity. Currently, 600 million inhabitants of the African continent do not have access to electricity, which is a significant limiting factor for further economic growth and socio-economic development. Moreover, the measures taken by individual Sub-Saharan African countries appear insufficient in the face of rapid population growth. The aim of the article is to analyse the opportunities and challenges of the development of Sub-Saharan Africa’s energy sector. This raises the following research question: to what extent can a sustainable energy transition be achieved in sub-Saharan African countries to ensure access to electricity? The study used Ward’s hierarchical clustering method, classification and regression tree analysis, and the distance-weighted least squares method. The results show that the level of development of the energy sector in the individual countries of Sub-Saharan Africa varies greatly. Moreover, the Sub-Saharan African region is exposed to the effects of climate change, which also affects the development of the energy sector and whether or not access to electricity can be ensured. The study contributes to assessments of the adaptive capacity and transformative potential of the energy sector in Sub-Saharan Africa. This is particularly important for achieving the Sustainable Development Goal 7, which relates to building more robust and efficient systems, as well as implementing diversified energy sources. This research is crucial to bridge the energy access gap and build a resilient and sustainable economy in Sub-Saharan Africa countries.

1. Introduction

Energy is one of the key factors enabling the achievement of sustainable development [1,2,3]. Research shows that the development of the energy sector plays an important role both in ensuring access to electricity and stimulating economic growth, e.g., by expanding the economy to include productive economic activities [4], as well as by increasing the country’s export potential [5]. The energy sector is also important in creating employment [6,7], and reducing poverty [2,8,9,10] and household welfare [11].
Sub-Saharan Africa displays dynamic economic growth, progressive urbanisation and huge demographic potential [1,12]. The African continent as a whole and the Sub-Saharan African region are also characterised by high population rates and rising income levels. At the same time, the region also has the lowest level of access to electricity in the world [13]. According to International Energy Agency data, in 2019, 770 million people worldwide lacked access to electricity. While the percentage of the population without access to electricity is declining globally, this positive change does not apply equally to all regions, and 75% of the global population without access to electricity lives in the Sub-Saharan African region. Lack of access to electricity is one of the key barriers to the development of Sub-Saharan Africa [14]. Therefore, the region requires extensive efforts to develop the energy sector, both on the part of individual countries and the region as a whole [12].
This challenge is also included in the strategy “Agenda 2063: The Africa We Want”, which lays down measures aimed at contributing to the economic growth and sustainable development of the African continent. The importance of the energy sector has been highlighted in various priority areas and goals of the Agenda 2063, including a 30% increase in the efficiency of household energy consumption, as well as the implementation of an energy production policy that will enable higher productivity in rural areas. Furthermore, efforts are being made at the regional level to create a common energy market. It is worth noting that the importance of environmental issues and resilience to climate change is also highlighted. This calls for the development of renewable energy [15].
The aim of the article is to analyse the opportunities and challenges facing Sub-Saharan Africa in developing its energy sector. The study is based on the triangulation of research methods, including a scoping method used for a literature review on sustainable energy sector development and access to electricity in sub-Saharan Africa, as well as Ward’s hierarchical clustering method, enhanced classification and regression tree analysis, and distance-weighted least squares method. This triangulation allows for the identification of measures that should be taken by the governments of individual Sub-Saharan African countries to develop the energy sector and ensure access to electricity. The methods used contribute to the development of research on energy sector development in sub-Saharan Africa.
The article is structured as follows: in the next part, the literature will be reviewed based on the scoping method. Section 3 includes the research methodology and data sources. Section 4 presents the results of the study, while Section 5 provides a discussion of the main findings of the analysis. The last section summarises the most important conclusions and presents the limitations of the research.

2. Literature Review

Energy is considered a key economic driver [16]. However, energy shortage is still very evident in some regions of the world, including Sub-Saharan Africa [17]. Developing the energy sector and ensuring access to electricity is crucial for Sub-Saharan Africa in moving towards sustainable development. In addition, limited access to electricity is a significant obstacle to the region’s economic growth; competitiveness and innovation; poverty reduction; and development of entrepreneurship [2,9,11,13,18,19,20]. Especially in the context of poverty, access to electricity plays a crucial role as it ensures the integration of society [9]. In addition, socio-economic development requires a continuous and uninterrupted supply of electricity [19].
The literature review on sustainable energy sector development and access to electricity in Sub-Saharan Africa is based on the scoping method. There is no universally accepted definition or purpose of a scoping review [21,22]. A scoping review is considered a useful tool in determining the scope or extent of literature on a specific topic. It enables both a broad and detailed overview of the available literature. In addition, based on the scoping review, it is possible to explore and define the scope and concept of previous studies, which enables the identification and analysis of research gaps in the literature [23,24]. This method can be employed to perform a robust analysis of the opportunities and challenges of energy sector development in Sub-Saharan Africa.
For the literature review, the Scopus database was chosen, which includes journals with Impact Factor, among others. The Scopus database was used because of its reliability and multidisciplinary profile. Figure 1 shows how the literature for the analysis was selected.
In the first stage, research articles were searched based on three keywords: Africa, energy sector, and sustainability. Two hundred and twenty-five results were obtained, and the scope of the search was then narrowed down. In the second stage, research articles were searched using three keywords: Sub-Saharan Africa, energy sector and sustainability. Following these criteria, 65 results were identified in the Scopus database. In the third phase, the research was limited to four keywords: Sub-Saharan Africa, energy sector, sustainable development and access to electricity. In total, 10 papers were identified, including 5 research articles, 3 reviews, 1 conference paper and 1 monograph (Table 1). The keywords selected were considered sufficient to identify literature on sustainable energy sector development in Sub-Saharan Africa. The broad set of keywords enabled the identification of key articles on energy sector development and access to electricity in the Sub-Saharan African region.
The reviewed scientific articles that were selected through the scoping review show that the researchers focused on exploring Sub-Saharan Africa’s energy sector development opportunities, building a sustainable energy sector in the region and Sub-Saharan Africa’s renewable energy potential.
An overview of the complexity of energy sector development in the sub-Saharan African region was provided by Prasad [13]. She showed the inefficiency of the energy sector in the region and stressed that Sub-Saharan Africa continues to have the lowest level of access to electricity in the world. At the same time, in her analysis, she identified four policy areas that require strengthening if the energy sector is to develop. They included reforms to improve management efficiency at state-owned energy enterprises, the need to lift the profitability of the energy sector, electrification of urban and rural areas and the growth of regional energy trade.
To assess the development of the electricity sector in sub-Saharan Africa, Panos et al. [14] used an econometric model that took into account the key socio-economic factors influencing access to electricity and the Global Multiregional MARKAL model. They showed that lack of access to electricity is one of the biggest barriers to the development of Sub-Saharan Africa. In fact, at least 30 countries in the region experience chronic power cuts. Interestingly, while 80% of the population without access to electricity is poor, Panos et al. found that access to electricity is negatively correlated with poverty. They explained that although electrification programmes are available, the beneficiaries of these programs are not always able to bear the operating costs. Hence, electrification programmes may not produce the desired results.
Other important aspects are the development of renewable energy in sub-Saharan Africa and the need to reduce greenhouse gas emissions in the atmosphere [19]. Socio-economic development requires continuous energy supplies and the development of the energy sector. However, the growing demand for energy is contributing to increased pollution. Hence, in addition to the security of supply and economic efficiency, the ecological spectrum should be taken into account. This will make it possible to build a sustainable energy supply system [25,26]. Researchers demonstrated the region’s potential for the use of solar energy, biomass, wind energy, hydropower and geothermal energy. They also proposed a methodology for renewable energy integration and a renewable energy planning and management system.
Sub-Saharan Africa’s potential for renewable energy development was also examined by Ebhota and Tabakov [18]. In their analysis, they emphasised that economic growth in individual countries of Sub-Saharan Africa has stalled, due largely to a lack of access to electricity and the faltering condition of infrastructure. At the same time, many countries in the region have the potential to generate electricity from renewable sources. However, for this purpose it is necessary to provide infrastructure, increase the share of qualified workforce and create an investment climate.
Sub-Saharan Africa’s renewable energy potential has also been explored by Pueyo [9], who emphasised the region’s huge gap in the development of renewable energy sources. Based on interviews with investors and decision trees, Pueyo [9] conducted a comparative analysis for Kenya and Ghana. Both countries have the potential to generate renewable energy but have faced investment-, finance- and regulatory constraint-based hurdles.
Chakamera and Alagidede [11] also addressed the green energy in the Sub-Saharan African region, where environmental degradation is hampering the development of the energy sector. Along with the economic growth and progressing industrialisation and urbanisation, the demand for electricity has risen. Chakamera and Alagidede [11] examined the Kuznets curve and the relationship between socio-economic development and environmental degradation. With their model, they examined the impact of electricity infrastructure on economic growth in Sub-Saharan Africa, including carbon dioxide emissions to the atmosphere. Their research showed that the quality of efficiency in the energy sector in that region is negatively affected by increasing carbon dioxide emissions into the atmosphere. Additionally, they confirmed that Sub-Saharan Africa has the lowest per capita electricity consumption among all region globally. Their research also shows that the region’s electricity prices are among the highest in the world and that the electricity sector still relies heavily on conventional energy sources.
Moreover, Luo et al. [12] focused on the process of urbanisation in the context of sustainable development. The study looked at the housing sector and used a future pathways of energy use and GHG emissions model. Using the example of Dar Es Salam, they showed how cities adapt to climate change, emphasising at the same time that urban electricity demand in Sub-Saharan Africa may quadruple by 2040, while the increase in greenhouse gas emissions will run to 280%. They stressed that rapid urbanisation and economic growth are increasing energy demand, while also increasing CO2 emissions to the atmosphere.
Research on the development potential of the energy sector and ensuring access to electricity in Sub-Saharan Africa focuses mainly on environmental issues. In addition, socio-economic and energy development opportunities in the Sub-Saharan African region were examined, focusing on the potential of renewable energy sources. A study by Ilskog and Kjellstrom [2] demonstrated the importance of a sustainability model in the context of the energy sector. The study was based on a ranking system that includes 70 indicators covering five dimensions of sustainable development: technical, economic, environmental, social and institutional. Of these, the institutional dimension as well as public utilities proved of particular importance for their effect on access to electricity. Previous research has not addressed the Sustainable Development Goals in the context of the adaptation and transformation potential of the energy sector in the Sub-Saharan African region. This gap provides a basis for further research to extend the previous studies. Chapter 3 describes the materials and methods that should enable replication of the research and use of the results.

3. Research Methodology

3.1. Research Sampling and Data Collection

The aim of this article is to analyse the opportunities and challenges of energy sector development in Sub-Saharan Africa. The study also focuses on identifying the leading countries that have made the greatest progress on the indicators of Sustainable Development Goal 7, which aims to ensure access to sources of stable and sustainable energy at affordable prices [27].
The study uses annual data for the period 2000–2019, describing the following indicators: access to electricity (% of population), access to electricity urban (% of urban population), access to electricity, rural (% of rural population), access to clean fuels and technologies for cooking (% of population), renewable electricity output (% of total electricity output), renewable energy consumption (% of total final energy consumption) and intensity level of primary energy (MJ / $ 2011 PPP GDP). The study period was chosen due to the availability of the necessary data needed to analyse the energy sector in the Sub-Saharan African region for those years. In addition, the long-term perspective enables the analysis of development trends in the energy sector in Sub-Saharan Africa in the context of achieving Sustainable Development Goal 7.
The data concerned 49 countries: Liberia (LBR), South Sudan (SSD), Rwanda (RWA), Lesotho (LSO), Somalia (SOM), Comoros (COM), Ethiopia (ETH), Kenya (KEN), Togo (TGO), Burkina Faso (BFA), Ghana (GHA), Nigeria (NGA), Sudan (SDN), Benin (BEN), Djibouti (DJI), Eritrea (ERI), Sierra Leone (SLE), Cameroon (CMR), Cabo Verde (CPV), Mauritius (MUS), Seychelles (SYC), South Africa (ZAF), Cote d’Ivoire (CIV), Gabon (GAB), Zimbabwe (ZWE), Equatorial Guinea (GNQ), Sao Tome and Principe (STP), Congo, Rep. (COG), Namibia (NAM), Guinea-Bissau (GNB), Chad (TCD), Mozambique (MOZ), Uganda (UGA), Mali (MLI), Niger (NER), Eswatini (SWZ), Botswana (BWA), Mauritania (MRT), Gambia, The (GMB), Senegal (SEN), Burundi (BDI), Central African Republic (CAF), Congo, Dem. Rep. (COD), Malawi (MWI), Zambia (ZMB), Madagascar (MDG), Tanzania (TZA), Guinea (GIN) and Angola (AGO).
The list of indicators for Sustainable Development Goal 7 on ensuring access to affordable, reliable and sustainable energy was taken from the World Bank Database and the Sustainable Energy for All (SE4ALL) database jointly maintained by the World Bank and the International Energy Agency. The list can be found in Table 2 with a description of the respective indicators.

3.2. Data Analysis Methods

In this study, we applied quantitative research methods. We focused on the development of the energy sector in the Sub-Saharan Africa region because it is an extremely important area of economic growth and socio-economic development. Furthermore, the importance of the energy sector and ensuring access to electricity is included in the Sustainable Development Goals. The research used the Ward’s hierarchical clustering method and classification and regression tree analysis. The first method is widely used in economic research [28,29]. The second has been thoroughly described in the research of Friedman [30], [31]; and Hastie, Tibshirani and Friedman [32]. In addition, the distance-weighted least squares method was used to describe the variables, which allowed for the development of distribution graphs for each variable.
The choice of research methods contributed to the fulfilment of two research quality criteria: validity and reliability. Validity was achieved through the selection of important indicators that allowed us to conduct the study and check the opportunities and challenges for the development of the energy sector in Sub-Saharan Africa. Reliability was achieved by using reliable and verifiable data sources, which makes the research replicable. The use of research triangulation methods answered the research question of to what extent a sustainable energy transition can be achieved in Sub-Saharan African countries to provide access to electricity.

4. Results

In the first stage of the study, an attempt was made to identify groups of countries with similar values of the individual indicators under study. For this purpose, the arithmetic mean of their values for individual countries was calculated. Next, Ward’s hierarchical clustering method was applied, which allowed the grouping of individual countries (Figure 2).
Classifying the countries based on Ward’s method in relation to the values of the examined indicators allows for the following nine groups of countries with similar average values to be distinguished. They include:
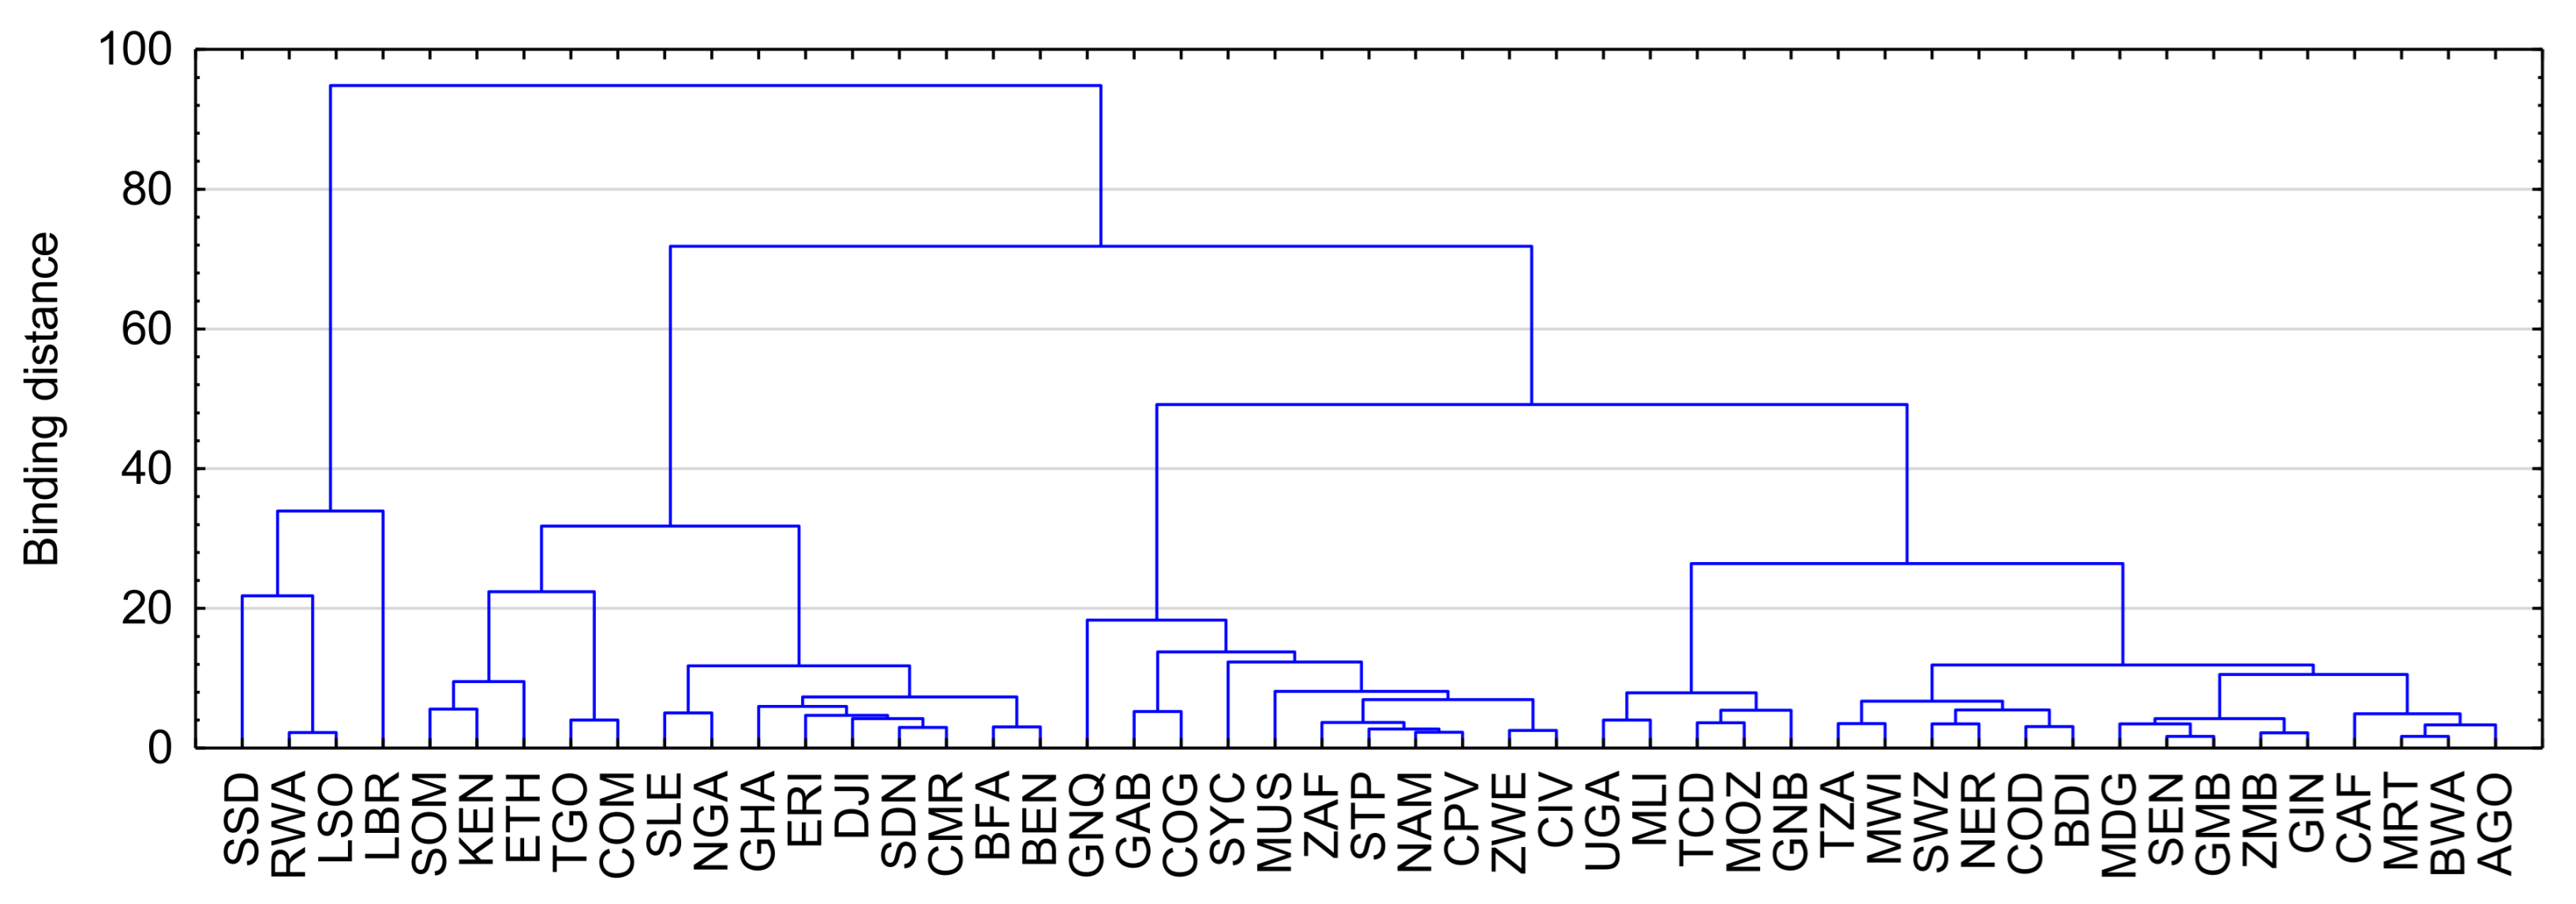
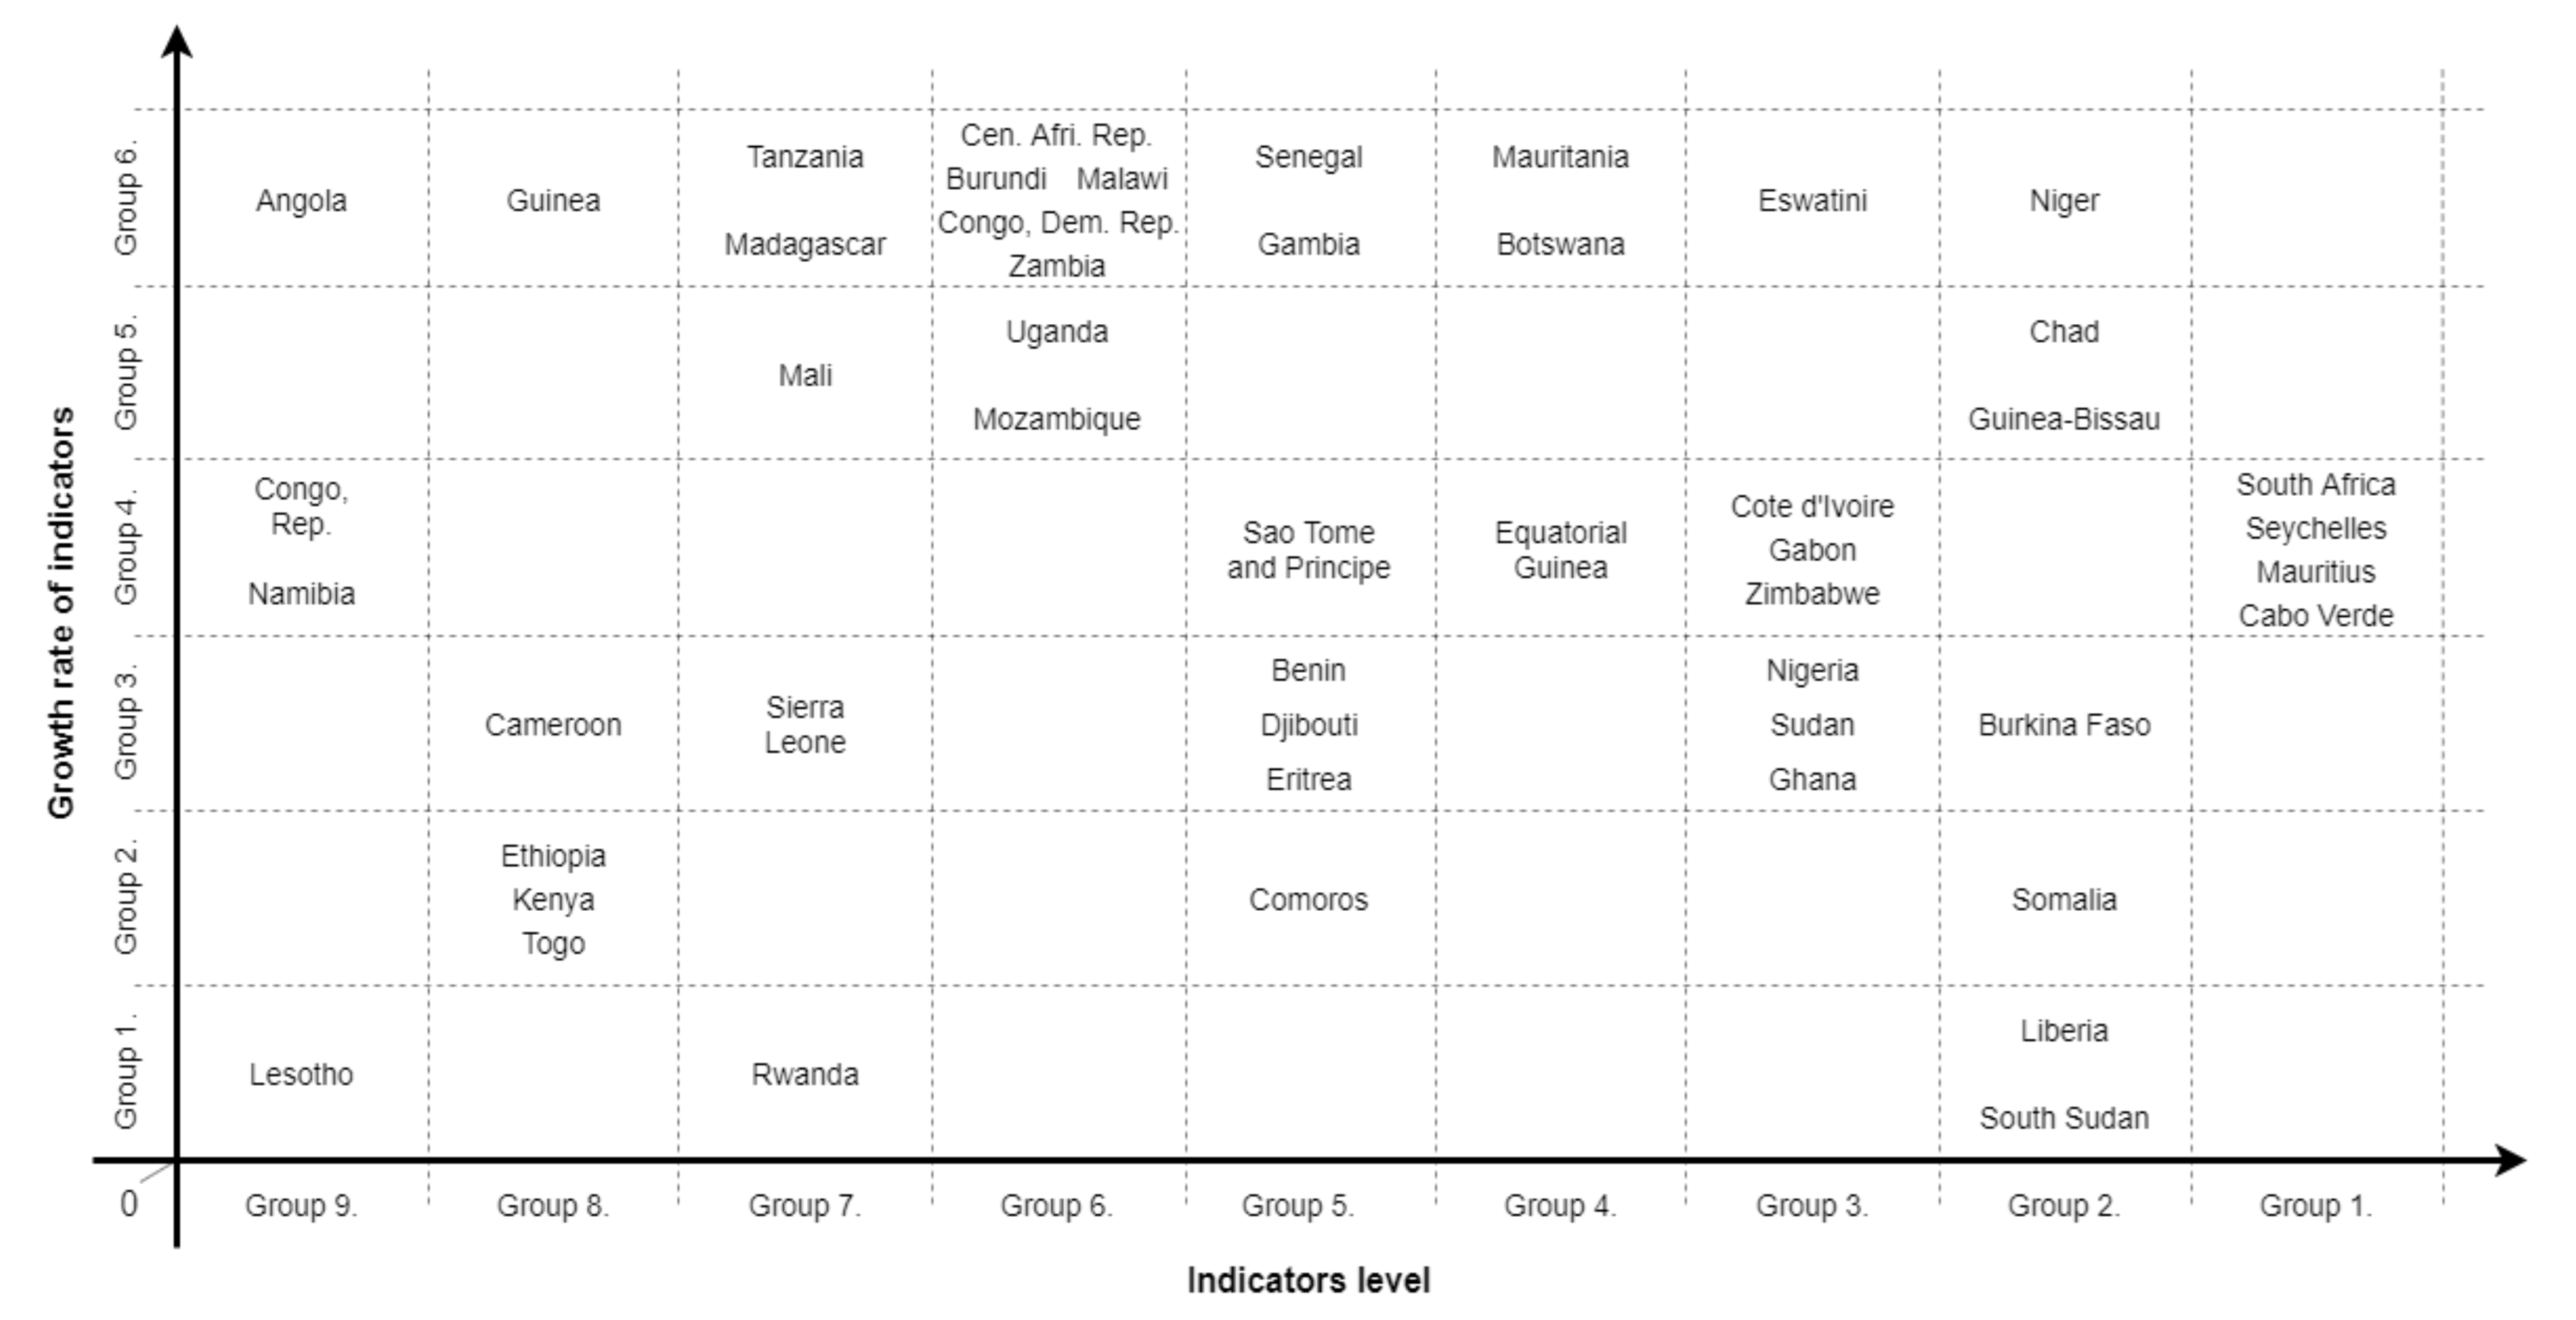
  • Group 1: Cabo Verde, Mauritius, Seychelles and South Africa;
  • Group 2: Burkina Faso, Guinea-Bissau, Liberia, Niger, Somalia, South Sudan and Chad;
  • Group 3: Cote d’Ivoire, Gabon, Ghana, Nigeria, Sudan, Eswatini and Zimbabwe;
  • Group 4: Botswana, Equatorial Guinea and Mauritania;
  • Group 5: Benin, Comoros, Djibouti, Eritrea, Gambia, The Senegal, Sao Tome and Principe;
  • Group 6: Burundi, Central African Republic, Democratic Republic of the Congo, Mozambique, Malawi, Uganda and Zambia;
  • Group 7: Madagascar, Mali, Rwanda, Sierra Leone and Tanzania;
  • Group 8: Cameroon, Ethiopia, Guinea, Kenya and Togo;
  • Group 9: Angola, Republic of the Congo, Lesotho and Namibia.
In the next step, a similar classification of countries was performed, considering the average values of changes (year-on-year increase) of individual indicators in the period analysed (Figure 3).
As in the previous stage, this classification made it possible to distinguish groups of countries with similar average year-on-year growth rates. Ward’s hierarchical clustering has contributed to the identification of six further groups. These include:
  • Group 1: Liberia, South Sudan, Rwanda and Lesotho;
  • Group 2: Somalia, Comoros, Ethiopia, Kenya and Togo;
  • Group 3: Burkina Faso, Ghana, Nigeria, Sudan, Benin, Djibouti, Eritrea, Sierra Leone and Cameroon;
  • Group 4: Cabo Verde, Mauritius, Seychelles, South Africa, Cote d’Ivoire, Gabon, Zimbabwe, Equatorial Guinea, Sao Tome and Principe, Republic of the Congo and Namibia;
  • Group 5: Guinea-Bissau, Chad, Mozambique, Uganda and Mali;
  • Group 6: Niger, Eswatini, Botswana, Mauritania, Gambia, The Senegal, Burundi, Central African Republic, Democratic Republic of the Congo, Malawi, Zambia, Madagascar, Tanzania, Guinea and Angola.
To determine the importance of individual indicators in explaining a country’s belonging to specific groups, and given the need to examine the described distribution, considering the annual changes occurring in the period 2000–2019 (the previous classification used the average values for this period), the extended classification method and regression tree analysis were applied. The application of these methods allowed for the creation of a model to explain the grouping of countries by using information on the annual values of all indicators for a given country. With this method, it was possible to perform a sequence of analyses using successive regression trees, where each successive tree is used to predict the residuals generated by the previous one. The weighted additive expansion procedure leads to the most accurate representation of the relation, even if it is a complex relation. In order to avoid the problem of model overfitting, the dataset was split into two subsets: 70% of the data for the training set and 30% for the test set. This made it possible to select an optimal model. Detailed results of the model learning process for the two classifications (in terms of indicator values and the magnitude of their year-to-year change) are presented in Appendix Figure A1 and Figure A2. Figure 4 shows the fit of the distribution of the model results obtained to the observed results, which indicate that the classification framework developed for the annual data is consistent, thus validating its correctness.
The next stage of the study was to identify the factors that contribute to the strongest country differentiation between the groups. Table 3 shows the strongest differentiating characteristics of the groups in the classification model developed. The indicators with the highest impact have the highest validity values (two classification models were considered—in terms of the number of the indicator and its change from year to year). Access to clean fuels and technologies for cooking (% of population) emerged as the most differentiating indicator for both classification models.
Figure 5 and Figure 6 show the four indicators with the highest impact in the classification model in relation to the values of the individual indicators. The graphs were developed based on the distance-weighted least squares method using annual data for each country. As shown, each group resulting from the classification in relation to the values of individual indicators with higher eigenvalues displays lower values of the individual indicators. The highest values of the indicators are therefore observed in group 1.
As with the first division, the classification of groups in relation to the changes of individual indicators shows the hierarchy of the values of changes in the groups. In the values presented in Figure 7 and Figure 8, as the size of the group increases, the value of the indicators rises. The classification ultimately leads to the identification of groups of countries with both the highest values and the highest growth dynamics of the analysed indicators.
Figure 9 shows the development of the energy sector in the individual countries of the Sub-Saharan African region based on the indicators describing Sustainable Development Goal 7 (ensuring access to affordable, reliable, sustainable and modern energy for all).
As can be seen from the figure above, the lowest level of the indicators analysed and the lowest rate of their growth occurred in Lesotho. The country has a small population of just over 2 million people. The vast majority of Lesotho’s population is dispersed and lives in rural areas with very limited access to electricity [10]. Only 10% of households in rural areas have access to electricity, compared to 80% of the population in urban areas [33]. In addition, industrialisation in Lesotho is contributing to an increase in the demand for electricity [10,34]. At the same time, Lesotho produces less energy than it consumes as the domestic generation capacity is 74 MW, while the demand for energy is 161 MW [33]. Hence, the energy sector in this country urgently requires infrastructure development, as well as investments in local generation capacities.
In turn, in Angola, despite the indicators’ low values, they are growing rapidly. The country is inefficient, suffers regular power cuts and has a deficient distribution infrastructure [7,35]. However, it has taken a number of measures to develop its energy sector and rebuild the energy infrastructure destroyed during the civil war that ended in 2002. While the national energy grid remains weak and insufficiently connected and electricity prices are artificially underestimated in Angola, the modernisation of production capacity is progressing, as is the development and modernisation of transmission networks [7,35].
The highest level of indicators and a moderate growth rate were recorded in South Africa, Seychelles, Mauritius and Cape Verde. The latter three countries are small island archipelagos and are included in the Small Island Developing States group. All three countries depend on imported fossil fuels, which are an integral part of their energy mix and are vulnerable to climate change-related legislation [36]. Seychelles, Mauritius and Cape Verde are seeing an increase in electricity demand, especially in the context of a growing tourism sector [37,38]. In the Seychelles and Mauritius, 100% of the population has access to electricity, while in Cape Verde the figure stands at 95%. The great advantage is that all three countries have implemented national energy policies and recognise the need for changes in the energy sector in order to achieve sustainable development [39]. At the same time, these countries need to modernise their energy sectors, taking into account the growing demand, and are developing renewable energy to this end [36,37,39,40].
At the opposite extreme of Seychelles, Mauritius and Cape Verde is South Africa, the largest economy in Africa. South Africa implemented a nationwide electrification programme in 1990 and has the most developed energy sector in Sub-Saharan Africa [41,42]. The energy sector is considered one of the key factors determining the further socio-economic development of South Africa [4]. This is important as the country is facing challenges, including poverty, high unemployment and social inequalities [43]. It is emphasised that South Africa has a relatively coherent energy policy, which will help it meet the growing energy demand, improve energy efficiency and develop renewable energy, and will enable it to achieve sustainable development [43,44,45,46].

5. Discussion

The study aimed to answer the following research question: to what extent can a sustainable energy transition be achieved in Sub-Saharan African countries to ensure access to electricity? Based on available data, overall positive developments can be observed in the development of the energy sector in Sub-Saharan African countries. Our study shows that the development of the energy sector varies greatly from country to country. The countries with the most developed energy sector in Sub-Saharan Africa include the Republic of South Africa, the Seychelles, Mauritius and the Republic of Cape Verde. All four countries are characterised by high values of the indicators that make up the Seventh Sustainable Development Goal, as well as a relatively high growth rate of these indicators. In turn, Lesotho showed the lowest level of indicators and their lowest growth rate, which is attributable to the dissipation of society. With 90% of the population living in rural areas having limited access to electricity, the gap between the urban and the rural in Sub-Saharan Africa in terms of developing the energy sector as well as ensuring access to electricity is large. This problem does not affect only Lesotho but also countries such as Kenya, Mali, Ethiopia and Sierra Leone [3].
The study also identifies a number of countries in the Sub-Saharan African region that are growing rapidly despite the low values of the indicators. Apart from Angola, this trend also characterised Congo, Namibia, Guinea, Tanzania, Madagascar and Mali. However, poor regulation of the energy market or corruption have not held back growth rates, such as those Congo has demonstrated [47].
Over the years, individual countries in this region have significantly increased their access to electricity and strengthened the potential of their energy sectors [48]. However, these changes are progressing too slowly—Sub-Saharan Africa remains the region with the lowest per capita electricity consumption of any region in the world [11]. Furthermore, the increase in electrification in Sub-Saharan Africa can also be attributed to improved data collection [14]. In addition, the energy sector in Sub-Saharan Africa is inefficient, while electricity prices in the region are among the highest in the world [11,13]. Electricity shortages also bring huge costs to Sub-Saharan Africa, slowing annual economic growth by 2–4% of GDP [49]. This, in turn, has a negative impact on socio-economic development, poverty and the labour market [50]. Sub-Saharan Africa remains the most energy-vulnerable region in the world [48]. In terms of both the generation of electricity and access to electricity, Sub-Saharan Africa continues to lag other regions [3].
While numerous studies have been done on the development of the energy sector in the Sub-Saharan African region, the impact of access to electricity on Sub-Saharan African economic growth and the potential for renewable energy development, this study extends both the theoretical and practical knowledge of the energy sector in the Sub-Saharan African region. This identifies areas that need to be addressed by individual Sub-Saharan African governments to develop the energy sector and provide access to electricity. To the best of our knowledge, this is the first study on the implementation of Sustainable Development Goal 7 by a Sub-Saharan African region using Ward’s hierarchical clustering method, classification and regression tree analysis and the distance-weighted least squares method. The methods used contribute to the development of research on energy sector development in Sub-Saharan Africa.
Moreover, our study contributes to the literature on development of the energy sector in the Sub-Saharan African region by covering a broad research perspective—from 2000 to 2019. It is crucial for Sub-Saharan Africa to use the long-term development potential of the energy sector [14]. However, policy should be shaped in such a way as to take into account both energy security and social and environmental issues. It is also important to create an investment climate that encourages the private sector to invest [18]. In their research, Panos et al. [14] showed that long-term private investment and innovation can positively influence the development of the energy sector in Sub-Saharan Africa, contributing to an increase in energy production and improved energy efficiency.

6. Conclusions

The aim of this article was to analyse the opportunities and challenges of energy sector development in Sub-Saharan Africa. Our research demonstrates that the level of development of the energy sector in the individual countries of Sub-Saharan Africa varies greatly. The highest levels are recorded in South Africa, the Seychelles, Mauritius and Cape Verde, while the lowest were found in Lesotho. It turns out that the smallest island archipelagos and the largest economy on the African continent have the most developed energy sector. We observed dynamic growth in Angola and a simultaneous low level of the analysed indicators.
The energy sector is one of the keys to economic growth and socio-economic development. It can contribute to industrialisation and urbanisation and play an important role in achieving sustainable development [47,51,52]. Hence, ensuring access to electricity has become a priority and has been included in the Sustainable Development Goals. However, Sub-Saharan Africa lags far behind other regions in both generation and access to electricity. In addition, the low electrification rates of many Sub-Saharan African countries are identified as an obstacle to further economic growth and socio-economic development and make the region even more vulnerable to the effects of progressive climate change.
Our research provides basic information that can be a starting point for decision-makers dealing with energy policy both at the level of the Sub-Saharan African region and the individual countries of Sub-Saharan Africa. Energy sector development is a common goal of all Sub-Saharan African countries, making the implementation of the Sustainable Development Goal 7 of key importance. Hence, attention should be paid to creating an investment climate, supporting research and development, and promoting cooperation in the region.
Like any scientific article, the present one is not without its limitations. The literature review and the research contained answers to the research question posed, allowing for the goal of the article—to provide an analysis of the opportunities for and challenges facing the development of the energy sector in Sub-Saharan Africa—to be achieved. Limited access to complete data was a significant limitation and determined the analysis for the years 2000–2019. At the same time, data for some countries were not available for the entire analysis period. This could have been influenced by factors such as the political situation, armed conflicts or the political stability of individual states. Additionally, in 2011 Sudan was divided into two separate and independent states: Sudan and South Sudan. Moreover, the analysis covered the entire region, which is characterised by a diverse level of socio-economic development; political stability; and economic, social and environmental challenges, all of which will determine the development of the energy sector.
It is worth expanding the area of analysis as soon as further data are available. This would significantly deepen the knowledge about the energy sector in the Sub-Saharan Africa region and the implementation of the Sustainable Development Goal 7 objectives by individual Sub-Saharan African countries individually and in the region as a whole. Another interesting thread that could be explored is a comparative analysis for all regions in the world, one that shows the degree of implementation of Sustainable Development Goal 7. Another aspect worth examining is the impact of the COVID-19 pandemic on the development of the energy sector in Sub-Saharan Africa, as well as on the implementation of Sustainable Development Goal 7 in Sub-Saharan Africa and other regions of the world. This is important because the COVID-19 pandemic has affected many aspects of economic and social life. It may also pose a threat to the achievement of individual Sustainable Development Goals.

Author Contributions

Conceptualization, M.U. and J.T.; methodology, J.T. and M.M.; validation, M.M.; formal analysis, J.T. and M.M.; investigation, J.T. and S.M.; resources, S.M.; data curation, M.M. and J.T.; writing—original draft preparation, J.T.; writing—review and editing, M.U.; visualization, M.M.; supervision, M.U.; funding acquisition, M.U. All authors have read and agreed to the published version of the manuscript.

Funding

This project was financed by the Polish Ministry of Education and Science within the “Regional Initiative of Excellence” Programme for 2019–2022. Project no.: 021/RID/2018/19. Total financing: PLN 11,897,131.40.

Institutional Review Board Statement

Not applicable.

Informed Consent Statement

Not applicable.

Data Availability Statement

Data will be available on request.

Conflicts of Interest

The authors declare no conflict of interest.

Appendix A

Figure A1. Model of the learning process using the enhanced decision tree method for the size classification of the variables under study. Source: own study.
Energies 14 06037 g0a1
Figure A2. A model of the learning process using the decision tree method to classify changes in the size of the variables under study. Source: own study.
Energies 14 06037 g0a2

References

  1. Chirambo, D. Towards the achievement of SDG 7 in sub-Saharan Africa: Creating synergies between Power Africa, Sustainable Energy for All and climate finance in-order to achieve universal energy access before 2030. Renew. Sustain. Energy Rev. 2018, 94, 600–608. [Google Scholar] [CrossRef]
  2. Ilskog, E.; Kjellström, B. And then they lived sustainably ever after?—Assessment of rural electrification cases by means of indicators. Energy Policy 2008, 36, 2674–2684. [Google Scholar] [CrossRef]
  3. Olanrewaju, B.T.; Olubusoye, O.E.; Adenikinju, A.; Akintande, O.J. A panel data analysis of renewable energy consumption in Africa. Renew. Energy 2019, 140, 668–679. [Google Scholar] [CrossRef]
  4. Kumar, R.R.; Stauvermann, P.J.; Loganathan, N.; Kumar, R.D. Exploring the role of energy, trade and financial development in explaining economic growth in South Africa: A revisit. Renew. Sustain. Energy Rev. 2015, 52, 1300–1311. [Google Scholar] [CrossRef] [Green Version]
  5. Narayan, P.K.; Smyth, R. Multivariate granger causality between electricity consumption, exports and GDP: Evidence from a panel of Middle Eastern countries. Energy Policy 2009, 37, 229–236. [Google Scholar] [CrossRef]
  6. Narayan, P.K.; Smyth, R. Electricity consumption, employment and real income in Australia evidence from multivariate Granger causality tests. Energy Policy 2005, 33, 1109–1116. [Google Scholar] [CrossRef]
  7. Solarin, S.A.; Shahbaz, M. Trivariate causality between economic growth, urbanisation and electricity consumption in Angola: Cointegration and causality analysis. Energy Policy 2013, 60, 876–884. [Google Scholar] [CrossRef] [Green Version]
  8. Cotte Poveda, A.; Pardo Martínez, C.I. Trends in economic growth, poverty and energy in Colombia: Long-run and short-run effects. Energy Systems 2011, 2, 281–298. [Google Scholar] [CrossRef] [Green Version]
  9. Pueyo, A. What constrains renewable energy investment in Sub-Saharan Africa? A comparison of Kenya and Ghana. World Dev. 2018, 109, 85–100. [Google Scholar] [CrossRef]
  10. Taele, B.M.; Mokhutšoane, L.; Hapazari, I.; Tlali, S.B.; Senatla, M. Grid electrification challenges, photovoltaic electrification progress and energy sustainability in Lesotho. Renew. Sustain. Energy Rev. 2012, 16, 973–980. [Google Scholar] [CrossRef]
  11. Chakamera, C.; Alagidede, P. Electricity crisis and the effect of CO2 emissions on infrastructure-growth nexus in Sub Saharan Africa. Renew. Sustain. Energy Rev. 2018, 94, 945–958. [Google Scholar] [CrossRef]
  12. Luo, C.; Posen, I.; Hoornweg, D.; Maclean, H. Modelling future patterns of urbanization, residential energy use and greenhouse gas emissions in Dar es Salaam with the Shared Socio-Economic Pathways. J. Clean. Prod. 2020, 254, 119998. [Google Scholar] [CrossRef] [Green Version]
  13. Prasad, G. Improving access to energy in sub-Saharan Africa. Curr. Opin. Environ. Sustain. 2011, 3, 248–253. [Google Scholar] [CrossRef]
  14. Panos, E.; Turton, H.; Densing, M.; Volkart, K. Powering the growth of Sub-Saharan Africa: The Jazz and Symphony scenarios of World Energy Council. Energy Sustain. Dev. 2015, 26, 14–33. [Google Scholar] [CrossRef]
  15. Juju, D.; Baffoe, G.; Dam Lam, R.; Karanja, A.; Naidoo, M.; Ahmed, A.; Jarzebski, M.P.; Saito, O.; Fukushi, K.; Takeuchi, K.; et al. Sustainability Challenges in Sub-Saharan Africa in the Context of the Sustainable Development Goals (SDGs). In Sustainability Challenges in Sub-Saharan Africa I: Continental Perspectives and Insights from Western and Central Africa; Gasparatos, A., Ahmed, A., Naidoo, M., Karanja, A., Fukushi, K., Saito, O., Takeuchi, K., Eds.; Springer Singapore: Singapore, 2020; pp. 3–50. [Google Scholar]
  16. Ozcan, B.; Ozturk, I. Renewable energy consumption-economic growth nexus in emerging countries: A bootstrap panel causality test. Renew. Sustain. Energy Rev. 2019, 104, 30–37. [Google Scholar] [CrossRef]
  17. Adedoyin, F.F.; Ozturk, I.; Agboola, M.O.; Agboola, P.O.; Bekun, F.V. The implications of renewable and non-renewable energy generating in Sub-Saharan Africa: The role of economic policy uncertainties. Energy Policy 2021, 150, 112115. [Google Scholar] [CrossRef]
  18. Ebhota, W.; Tabakov, P.Y. Hydropower potentials and effects of poor manufacturing infrastructure on small hydropower development in Sub-Saharan Africa. Int. J. Energy Econ. Policy 2017, 7, 60–67. [Google Scholar]
  19. Suberu, M.Y.; Mustafa, M.W.; Bashir, N.; Muhamad, N.A.; Mokhtar, A.S. Power sector renewable energy integration for expanding access to electricity in sub-Saharan Africa. Renew. Sustain. Energy Rev. 2013, 25, 630–642. [Google Scholar] [CrossRef]
  20. Urbaniec, M. Sustainable competitiveness. Opportunities and challenges for Poland’s economy. Econ. Environ. 2016, 59, 34–51. [Google Scholar]
  21. Daudt, H.M.L.; van Mossel, C.; Scott, S.J. Enhancing the scoping study methodology: A large, inter-professional team’s experience with Arksey and O’Malley’s framework. BMC Med. Res. Methodol. 2013, 13, 48. [Google Scholar] [CrossRef] [PubMed] [Green Version]
  22. Peterson, J.; Pearce, P.F.; Ferguson, L.A.; Langford, C.A. Understanding scoping reviews: Definition, purpose, and process. J. Am. Assoc. Nurse Pract. 2017, 29, 12–16. [Google Scholar] [CrossRef]
  23. Munn, Z.; Peters, M.D.J.; Stern, C.; Tufanaru, C.; McArthur, A.; Aromataris, E. Systematic review or scoping review? Guidance for authors when choosing between a systematic or scoping review approach. BMC Med. Res. Methodol. 2018, 18, 1–7. [Google Scholar] [CrossRef] [PubMed]
  24. Arksey, H.; O’Malley, L. Scoping studies: Towards a methodological framework. Int. J. Soc. Res. Methodol. 2005, 8, 19–32. [Google Scholar] [CrossRef] [Green Version]
  25. D’Adamo, I.; Falcone, P.M.; Morone, P. A New Socio-economic Indicator to Measure the Performance of Bioeconomy Sectors in Europe. Ecol. Econ. 2020, 176, 106724. [Google Scholar] [CrossRef]
  26. Ikram, M. Models for Predicting Non-Renewable Energy Competing with Renewable Source for Sustainable Energy Development: Case of Asia and Oceania Region. Available online: https://link.springer.com/article/10.1007/s40171-021-00285-7 (accessed on 17 August 2021).
  27. Shyu, C.-W. A framework for ‘right to energy’ to meet UN SDG7: Policy implications to meet basic human energy needs, eradicate energy poverty, enhance energy justice, and uphold energy democracy. Energy Res. Soc. Sci. 2021, 79, 102199. [Google Scholar] [CrossRef]
  28. Garncarz, J.; Mierzejewski, M. The Impact of Crises on the Intellectual Capital of Companies in the Food Sector. e-Finanse 2019, 15, 1–9. [Google Scholar] [CrossRef] [Green Version]
  29. Piątkowski, M.J. Expectations and Challenges in the Labour Market in the Context of Industrial Revolution 4.0. The Agglomeration Method-Based Analysis for Poland and Other EU Member States. Sustainability 2020, 12, 5437. [Google Scholar] [CrossRef]
  30. Friedman, J.H. Greedy function approximation: A gradient boosting machine. Ann. Stat. 2001, 29, 1189–1232. [Google Scholar] [CrossRef]
  31. Friedman, J.H. Stochastic gradient boosting. Comput. Stat. Data Anal. 2002, 38, 367–378. [Google Scholar] [CrossRef]
  32. Hastie, T.; Tibshirani, R.; Friedman, J.H. The Elements of Statistical Learning: Data Mining, Inference, and Prediction; Springer: New York, NY, USA, 2001. [Google Scholar]
  33. Mpholo, M.; Mothala, M.; Mohasoa, L.; Eager, D.; Thamae, R.; Molapo, T.; Jardine, T. Lesotho electricity demand profile from 2010 to 2030. J. Energy South Afr. 2021, 32, 41–57. [Google Scholar] [CrossRef]
  34. Senatla, M.; Nchake, M.; Taele, B.M.; Hapazari, I. Electricity capacity expansion plan for Lesotho—Implications on energy policy. Energy Policy 2018, 120, 622–634. [Google Scholar] [CrossRef]
  35. Solarin, S.A.; Shahbaz, M.; Shahbaz, S.H. Revisiting the electricity consumption-economic growth nexus in Angola: The role of exports, imports and urbanization. Int. J. Energy Econ. Policy 2016, 6, 501–512. [Google Scholar]
  36. Surroop, D.; Raghoo, P. Renewable energy to improve energy situation in African island states. Renew. Sustain. Energy Rev. 2018, 88, 176–183. [Google Scholar] [CrossRef]
  37. Surroop, D.; Raghoo, P. Energy landscape in Mauritius. Renew. Sustain. Energy Rev. 2017, 73, 688–694. [Google Scholar] [CrossRef]
  38. Surroop, D.; Raghoo, P.; Bundhoo, Z.M.A. Comparison of energy systems in Small Island Developing States. Util. Policy 2018, 54, 46–54. [Google Scholar] [CrossRef]
  39. Tung, L.; Juliette, O. Towards a regional energy framework for African SIDS: Prospects and challenges. J. World Energy Law Bus. 2017, 10, 220–234. [Google Scholar] [CrossRef]
  40. Coutinho, G.L.; Vianna, J.N.; Dias, M.A. Alternatives for improving energy security in Cape Verde. Util. Policy 2020, 67, 101112. [Google Scholar] [CrossRef]
  41. An, J.; Mikhaylov, A. Russian energy projects in South Africa. J. Energy South Afr. 2020, 31, 58–64. [Google Scholar] [CrossRef]
  42. Denisova, V.; Mikhaylov, A.; Lopatin, E. Blockchain Infrastructure and Growth of Global Power Consumption. Int. J. Energy Econ. Policy 2019, 9, 22–29. [Google Scholar] [CrossRef]
  43. Bellos, E. Sustainable energy development: How can the tension between energy security and energy transition be measured and managed in South Africa? J. Clean. Prod. 2018, 205, 738–753. [Google Scholar] [CrossRef]
  44. Aliyu, A.K.; Modu, B.; Tan, C.W. A review of renewable energy development in Africa: A focus in South Africa, Egypt and Nigeria. Renew. Sustain. Energy Rev. 2018, 81, 2502–2518. [Google Scholar] [CrossRef]
  45. Winkler, H. Energy policies for sustainable development in South Africa. Energy Sustain. Dev. 2007, 11, 26–34. [Google Scholar] [CrossRef]
  46. McEwan, C. Spatial processes and politics of renewable energy transition: Land, zones and frictions in South Africa. Political Geogr. 2017, 56, 1–12. [Google Scholar] [CrossRef] [Green Version]
  47. Falchetta, G.; Dagnachew, A.G.; Hof, A.F.; Milne, D.J. The role of regulatory, market and governance risk for electricity access investment in sub-Saharan Africa. Energy Sustain. Dev. 2021, 62, 136–150. [Google Scholar] [CrossRef]
  48. Bishoge, O.; Kombe, G.; Mvile, B. Renewable energy for sustainable development in sub-Saharan African countries: Challenges and way forward. J. Renew. Sustain. Energy 2020, 12, 1–14. [Google Scholar] [CrossRef]
  49. Zalengera, C.; To, L.S.; Sieff, R.; Mohr, A.; Eales, A.; Cloke, J.; Buckland, H.; Brown, E.; Blanchard, R.; Batchelor, S. Decentralization: The key to accelerating access to distributed energy services in sub-Saharan Africa? J. Environ. Stud. Sci. 2020, 10, 270–289. [Google Scholar] [CrossRef]
  50. Hancock, K.J. The expanding horizon of renewable energy in sub-Saharan Africa: Leading research in the social sciences. Energy Res. Soc. Sci. 2015, 5, 1–8. [Google Scholar] [CrossRef]
  51. Urbaniec, M.; Tomala, J.; Martinez, S. Measurements and Trends in Technological Eco-Innovation: Evidence from Environment-Related Patents. Resources 2021, 10, 68. [Google Scholar] [CrossRef]
  52. Mainali, B.; Luukkanen, J.; Silveira, S.; Kaivo-oja, J. Evaluating Synergies and Trade-Offs among Sustainable Development Goals (SDGs): Explorative Analyses of Development Paths in South Asia and Sub-Saharan Africa. Sustainability 2018, 10, 815. [Google Scholar] [CrossRef] [Green Version]
Figure 1. Flow diagramme. Source: own study.
Energies 14 06037 g001
Figure 2. Classification of individual countries in relation to the level of the indicators examined. Source: own study.
Energies 14 06037 g002
Figure 3. Classification of individual countries in relation to the year-on-year change in the value of the indicators analysed. Source: own study.
Energies 14 06037 g003
Figure 4. Classification by level of indicator and in relation to the change of the index. Source: own study.
Energies 14 06037 g004
Figure 5. Distribution of indicator values for access to clean fuels and technologies for cooking (% of population) and access to electricity (% of urban population) in relation to classification by levels of all indicators from 2000 to 2019. Source: own study.
Energies 14 06037 g005
Figure 6. Distribution of the values of indicators for access to electricity (% of population) and access to electricity (% of rural population) in relation to the classification by levels of all indicators from 2000 to 2019. Source: own study.
Energies 14 06037 g006
Figure 7. Distribution of the values of indicators for access to clean fuels and technologies for cooking (% of population) and renewable energy consumption (% of total final energy consumption) in relation to the classification according to changes in the values of all indicators from 2000 to 2019. Source: own study.
Energies 14 06037 g007
Figure 8. Distribution of the values of indicators for access to clean fuels and technologies for cooking (% of population) and renewable energy consumption (% of total final energy consumption) in relation to the classification by changes in the values of all indicators from 2000 to 2019. Source: own study.
Energies 14 06037 g008
Figure 9. Development of the energy sector in individual countries of Sub-Saharan Africa based on indicators describing Sustainable Development Goal 7. Source: own study.
Energies 14 06037 g009
Table 1. Article numbers by journal title.
SourceNo. of Articles
Renewable and Sustainable Energy Reviews2
Current Opinion on Environmental Sustainability1
Energy For Sustainable Development1
Energy Policy 1
International Journal of Energy Economics and Policy1
Journal of Cleaner Production1
World Development1
Source: own study based on Scopus Database.
Table 2. Indicators for Sustainable Development Goal 7.
SDG TargetSDG IndicatorIndicator NameLong DefinitionSourceLicense URL
Target 7.1: By 2030, ensure universal access to affordable, reliable and modern energy servicesIndicator 7.1.1: Proportion of population with access to electricityAccess to electricity (% of population)Access to electricity is the percentage of population with access to electricity. Electrification data are collected from industry, national surveys and international sources.World Bank, Sustainable Energy for All (SE4ALL) database from the SE4ALL Global Tracking Framework led jointly by the World Bank, International Energy Agency and the Energy Sector Management Assistance Program.https://datacatalog.worldbank.org/public-licenses#cc-by (accessed on 3 August 2021).
Access to electricity, rural (% of rural population)Access to electricity, rural is the percentage of the rural population with access to electricity.World Bank, Sustainable Energy for All (SE4ALL) database from the SE4ALL Global Tracking Framework led jointly by the World Bank, International Energy Agency and the Energy Sector Management Assistance Program.https://datacatalog.worldbank.org/public-licenses#cc-by (accessed on 3 August 2021).
Access to electricity, urban (% of urban population)Access to electricity, urban is the percentage of the urban population with access to electricity.World Bank, Sustainable Energy for All (SE4ALL) database from the SE4ALL Global Tracking Framework led jointly by the World Bank, International Energy Agency and the Energy Sector Management Assistance Program.https://datacatalog.worldbank.org/public-licenses#cc-by (accessed on 3 August 2021).
Indicator 7.1.2: Proportion of population with primary reliance on clean fuels and technologyAccess to clean fuels and technologies for cooking (% of population)Access to clean fuels and technologies for cooking is the proportion of total population primarily using clean cooking fuels and technologies for cooking. Under WHO guidelines, kerosene is excluded from clean cooking fuels.World Bank, Sustainable Energy for All (SE4ALL) database from WHO Global Household Energy database.https://datacatalog.worldbank.org/public-licenses#cc-by (accessed on 3 August 2021).
Target 7.2: By 2030, substantially increase the share of renewable energy in the global energy mixIndicator 7.2.1 (supplement): Renewable energy share of total final energy consumptionRenewable electricity output (% of total electricity output)Renewable electricity is the share of electricity generated by renewable power plants of the overall electricity generated by all types of plants.IEA Statistics © OECD/IEA 2018 (http://www.iea.org/stats/index.asp (accessed on 3 August 2021)), subject to https://www.iea.org/t&c/termsandconditions/ (accessed on 3 August 2021).http://www.iea.org/t&c/termsandconditions (accessed on 3 August 2021).
Indicator 7.2.1: Renewable energy share of total final energy consumptionRenewable energy consumption (% of total final energy consumption)Renewable energy consumption is the share of renewable energy of total final energy consumption.World Bank, Sustainable Energy for All (SE4ALL) database from the SE4ALL Global Tracking Framework led jointly by the World Bank, International Energy Agency, and the Energy Sector Management Assistance Program.https://datacatalog.worldbank.org/public-licenses#cc-by (accessed on 3 August 2021).
Target 7.3: By 2030, double the global rate of improvement in energy efficiencyIndicator 7.3.1: Energy intensity measured in terms of primary energy and GDPEnergy intensity level of primary energy (MJ/$2011 PPP GDP)Energy intensity level of primary energy is the ratio between energy supply and gross domestic product measured at purchasing power parity. Energy intensity is an indication of how much energy is used to produce one unit of economic output. A lower ratio indicates that less energy is used to produce one unit of output.World Bank, Sustainable Energy for All (SE4ALL) database from the SE4ALL Global Tracking Framework led jointly by the World Bank, International Energy Agency and the Energy Sector Management Assistance Program.https://datacatalog.worldbank.org/public-licenses#cc-by (accessed on 3 August 2021).
Source: own study based on World Development Indicators (2021).
Table 3. The significance of individual indicators in the group classification in relation to the value of the indicators and the magnitude of their year-on-year change from 2000 to 2019.
IndicatorValidity for QuantityValidity for Change
Access to clean fuels and technologies for cooking (% of population)1.001.00
Access to electricity (% of population)0.900.98
Access to electricity, rural (% of rural population)0.810.75
Access to electricity, urban (% of urban population)0.821.00
Energy intensity level of primary energy (MJ/$2011 PPP GDP)0.700.67
Renewable electricity output (% of total electricity output)0.700.67
Renewable energy consumption (% of total final energy consumption)0.800.75
Source: own study.
Publisher’s Note: MDPI stays neutral with regard to jurisdictional claims in published maps and institutional affiliations.

