Article

Possibilities of Upgrading Warsaw Existing Residential Area to Status of Positive Energy Districts

Institute of Heat Engineering, Faculty of Power and Aeronautical Engineering, Warsaw University of Technology, 00-665 Warsaw, Poland
*
Author to whom correspondence should be addressed.
Energies 2021, 14(18), 5984; https://doi.org/10.3390/en14185984
Submission received: 14 July 2021 / Revised: 3 September 2021 / Accepted: 15 September 2021 / Published: 21 September 2021

Abstract

:
This paper analyses possibilities of refurbishment of Warsaw’s residential buildings towards standards of the Positive Energy District. The annual final energy consumption in the city in 2019 for the district heating was 8668 GWh, gas (pipelines) was 5300 GWh, electricity from the grid was 7500 GWh, while the emission of the carbon dioxide was 5.62 × 10⁹ kg. The city consists of 18 districts, which are heterogeneous in terms of typology and structure of buildings. The great variety of buildings can be seen, for example, by the annual final energy demand for space heating and hot water preparation per unit of room area. This annual index ranges from over 400 kWh/m2 in historic buildings to 60 kWh/m2 in modern buildings. A reduction in the consumption of non-renewable energy sources and carbon dioxide emissions can be achieved by improving the energy standard of residential buildings and by using renewable energy sources: solar energy, geothermal energy and biogas. The potential barriers for achieving the status of a positive energy district, for example, problems connected with ownership, financing new investments and refurbishment and legal boundaries, have been identified. Moreover, changing the existing electrical grid and district heating systems in urban areas in Warsaw requires comprehensive modernization of practically the entire city’s infrastructure.

1. Introduction

The first intensive measures aimed at improving energy security appeared in response to the fuel crisis of 1973 [1]. Indirectly, this global shock also contributed to increasing the importance of environmental protection to preserve the environment for future generations. There are several standard actions aimed at reducing the burden of harmful substances in the environment: rationalization of needs, improvement of broadly understood efficiency, and increased use of “clean” technologies to meet the needs.
In the residential buildings sector, these activities are mentioned:
- rationalizing the behaviour of building users (residents),
- rationalizing the internal systems operation,
- reduction of heat losses in buildings by improving the thermal insulation of the envelope,
- recovery of heat discharged to the environment, e.g., from ventilation air, domestic sewage,
- improving the energy efficiency of all technical devices and systems.
Nevertheless, it is not enough just to try to reduce the energy demand to meet the needs. Hence the idea of using “clean” technologies that do not burden the environment, especially renewable energy ones, have consequently led to the creation of “nearly zero-energy”, “zero-energy” and “energy-positive” buildings in terms of final energy and/or primary energy. The assessment also concerns the balance of emissions of harmful solid and gaseous substances, e.g., carbon dioxide (CO2).
In the European Union, these activities are directed, and at the same time supported, by the Directives. For example, Directive 2002/91/EC of the European Parliament and of the Council of 16 December 2002 on the energy performance of buildings [2] has brought lasting change in the Polish construction law and regulations relevant to the technical requirements of newly constructed buildings and buildings under refurbishment [3]. Nowadays, a comprehensive approach to energy conservation and environmental protection issues, linked to climate change problems, is extremely valuable and is evident in Polish national energy policy [4]. The energy and climate policies have been linked very strongly and utilisation of renewable energy technologies has become one of the basic elements of both.
New or renovated buildings are evaluated on the basis of energy consumption of non-renewable primary energy for space heating, ventilation, cooling, domestic hot water and lighting. It is also necessary to determine CO2 emissions and the share of renewable energy sources in meeting the energy demand [3,5].
The City of Warsaw is actively engaged in activities aimed at rationalizing and reducing energy use. An example of completed actions include action plans for sustainable energy consumption for Warsaw by 2020 [6] and investigations on the development of the Warsaw housing standard [7]. Warsaw, in cooperation with the local authorities of Austria, Germany and Italy, took part in the “Cities on Power” project (2011–2014), with the aim to increase the use of renewable energy in urban areas. One of the results was estimation of the possibilities of using renewable energy sources in Warsaw [8]. Future planning has been performed for the 2050 perspective and is constantly updated [9]. In 2016, the City of Warsaw began participating in the Cities Council of the EERA (European Energy Research Associations) Smart Cities Joint Program.
In 2019, at the capital city of Warsaw, the Office of Air Protection and Climate Policy was established by integration of four different former Offices. The new Office’s tasks include preparing and updating action plans in the field of air protection and climate change and elaborating reports on their implementation, including cooperation with competent authorities in the preparation of higher-level programs (regional, national) [10]. Other examples can be mentioned, e.g., the Municipal Climate Adaptation Plan [11], and the Low-Emission Economy Plan for the Capital City of Warsaw [12]. Among the numerous recommended actions, the introduction of solutions increasing the energy independence of the city, including increasing the share of energy from renewable sources, was mentioned. What is really important is that plan was the result of joint work of residents, entrepreneurs, representatives of various types of organizations and the City of Warsaw.
In Section 2, administrative characteristics of Warsaw are presented, and some historical facts are also mentioned. Because of the topic of the paper, the housing stock and energy sector are analysed with more attention. Considerations presented in Section 2 give the background for more detailed analysis of a very specific situation in terms of supplying heat to end users in Warsaw using a central district heating system. This analysis is carried out in Section 3. It can be noticed that with having such a well-developed district heating system, it is difficult to implement new investments in energy systems that use solutions other than connecting new buildings to the existing network. However, if new housing estates are built in an area that does not have access to the central energy systems, then the extension of the existing energy network may be technically too complicated and, consequently, too expensive. As a result, it is more reasonable to build new local energy systems in accordance with the current requirements of energy conservation and environmental protection. Consequently, this provides the basis for the use of energy from renewable sources available in the area of the city. Section 4 is therefore devoted to the presentation of the theoretical potential of using renewable energy sources in the city and its outskirts. Section 5 includes subchapters devoted to a different renewable energy, the theoretical potential of which in Warsaw or on its outskirts indicates the possibility of its use for utility purposes. However, possible and effective use can be limited due to specific location, environmental or legal aspects, which are also mentioned in Section 5 and 6. Section 6 briefly presents what should be done in order to achieve the goals set for the Positive Energy Districts (PED) in a city such as Warsaw. Moreover, it shows the potential risks that hinder the achievement of the goals. Finally, conclusions are formulated in Section 6.

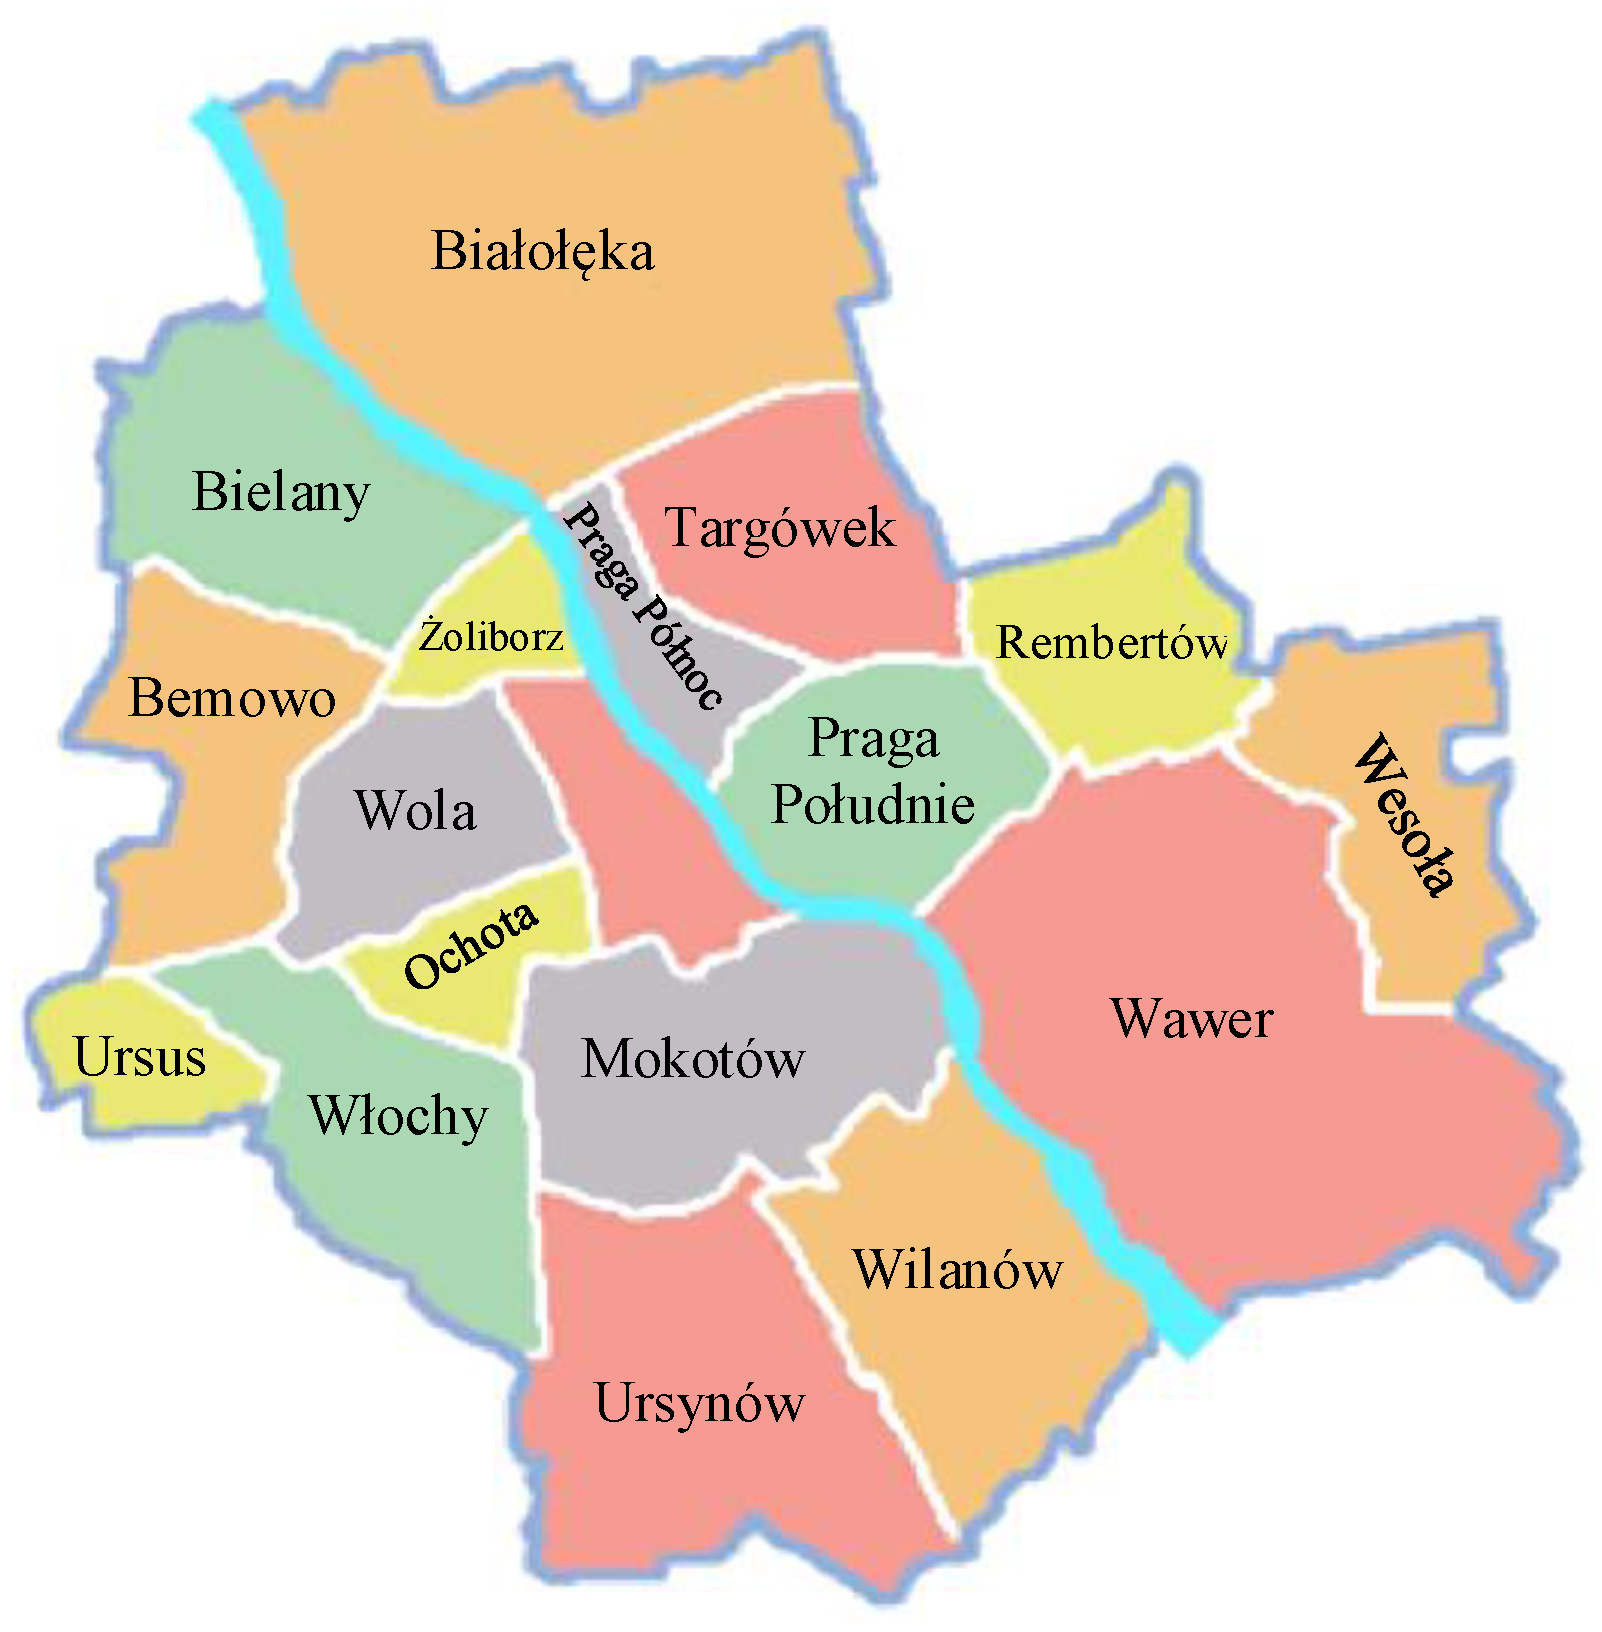
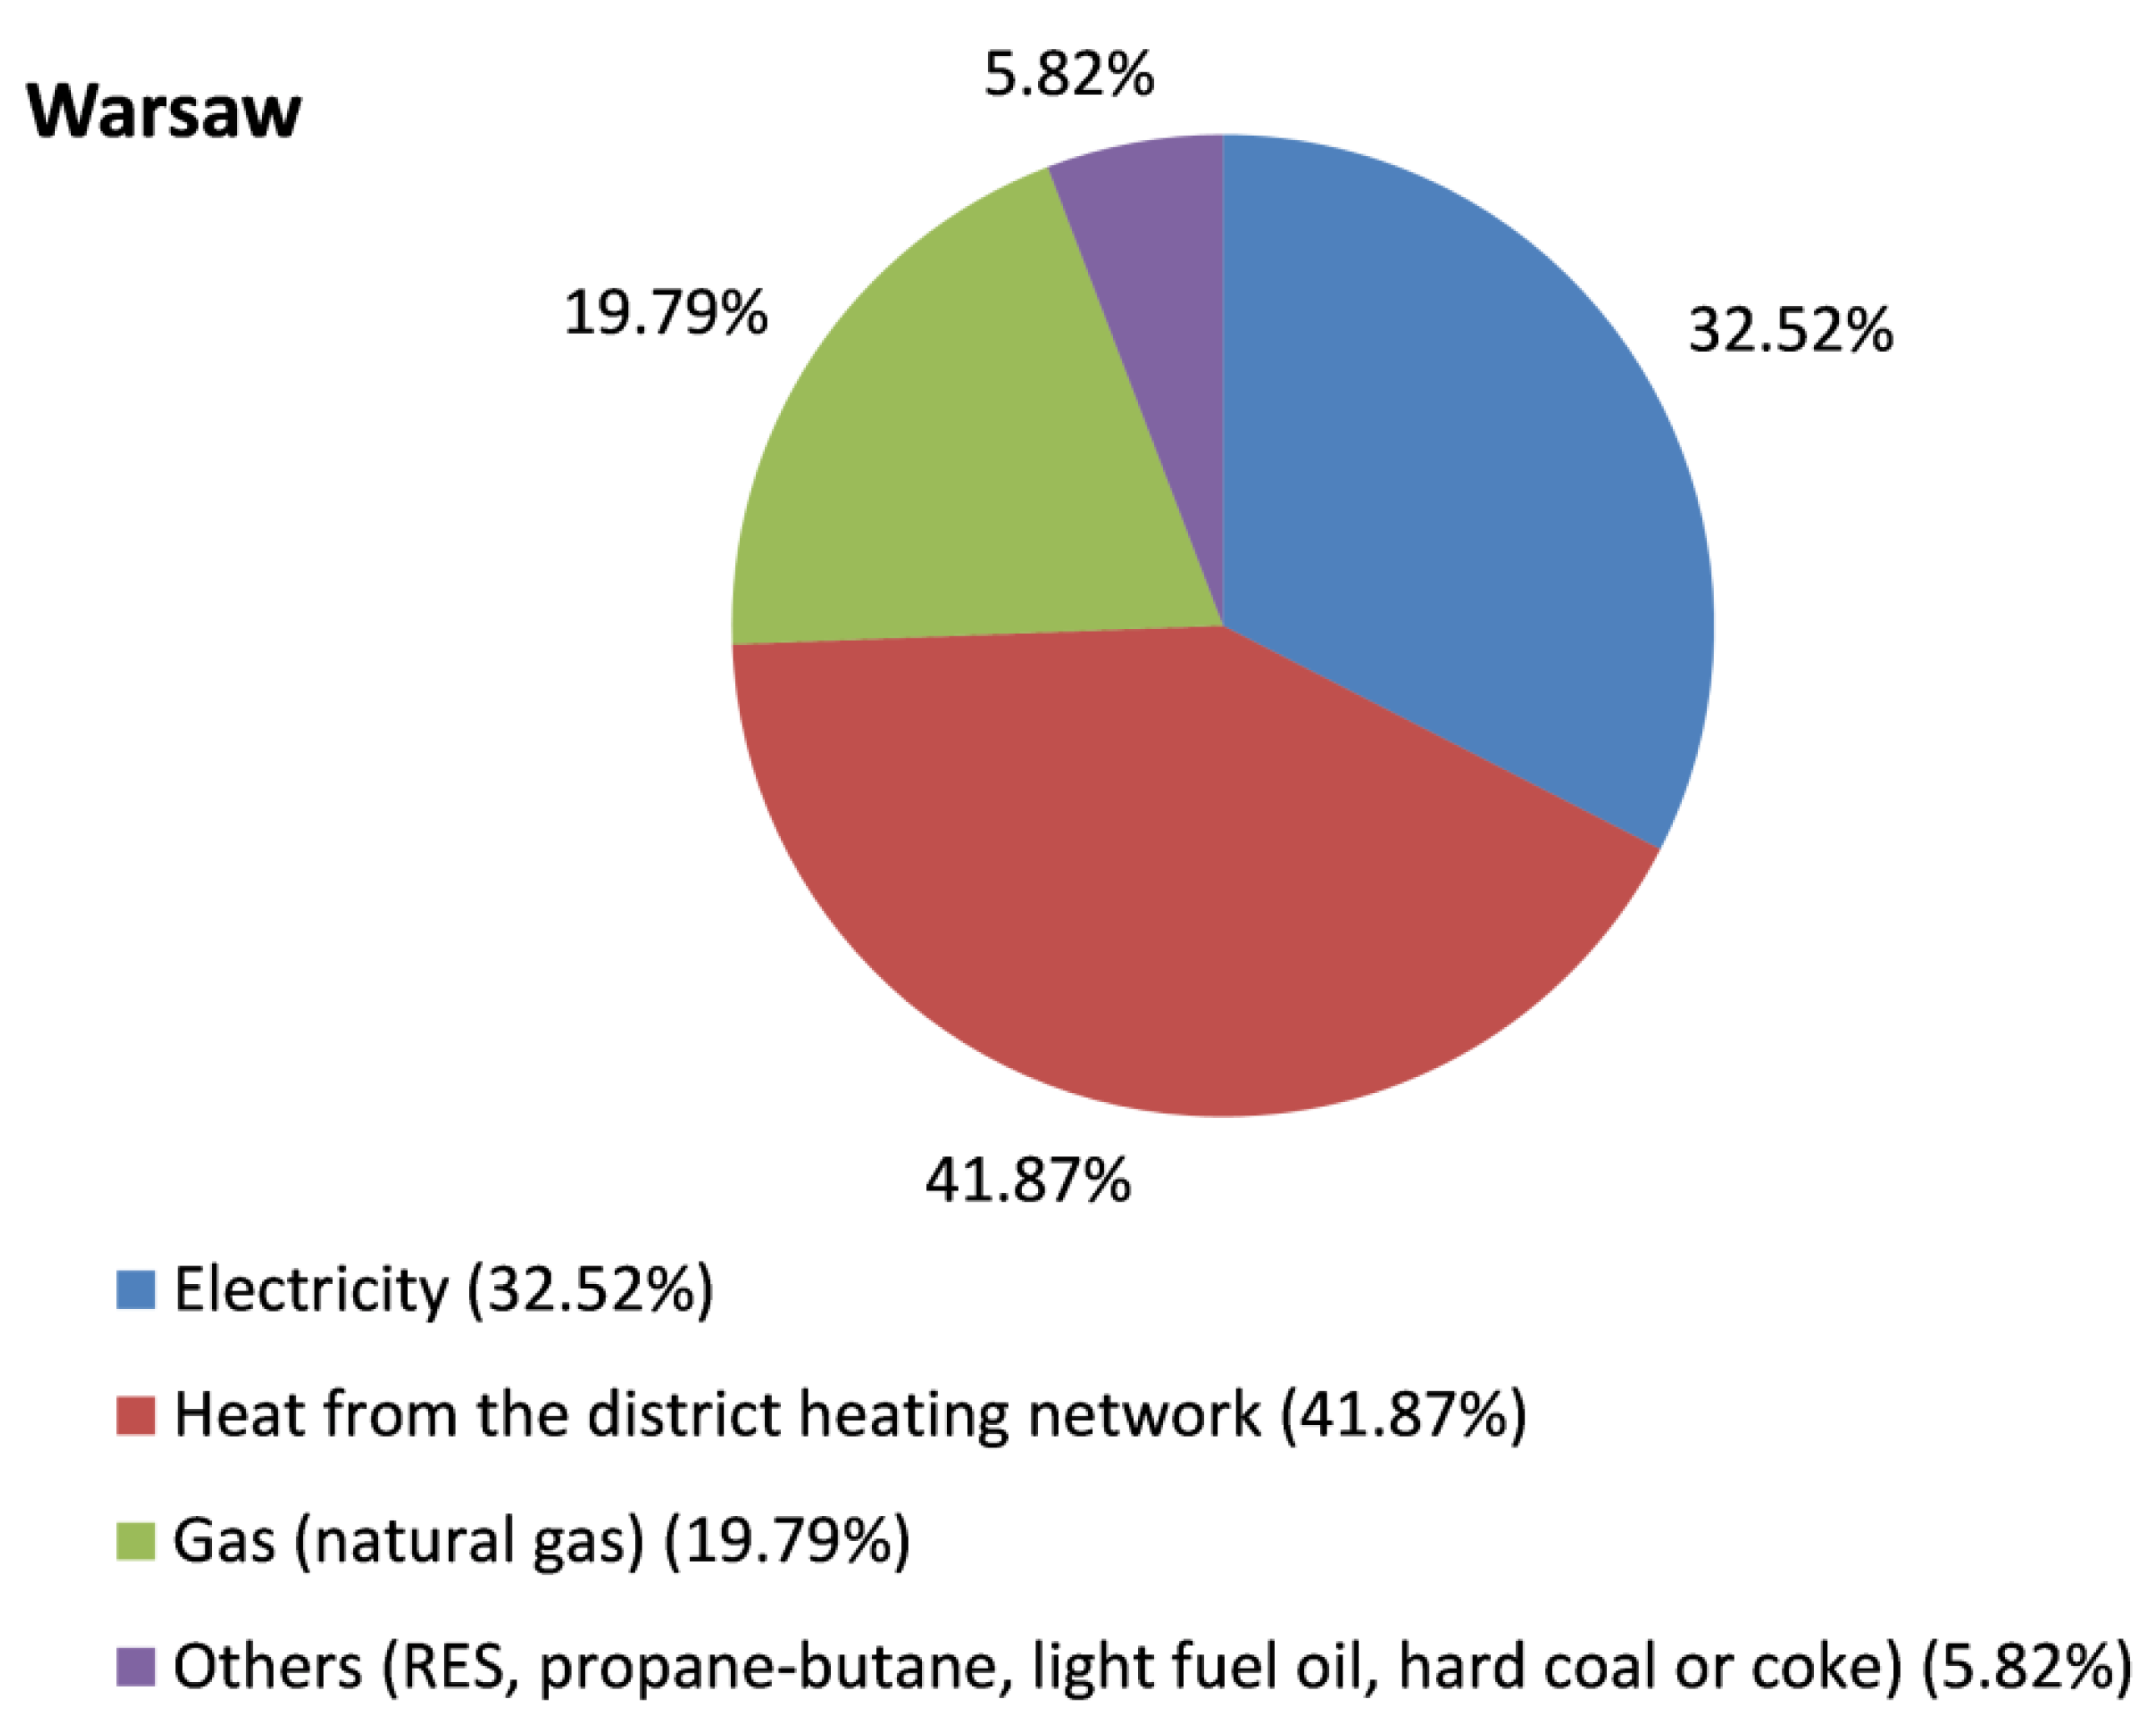
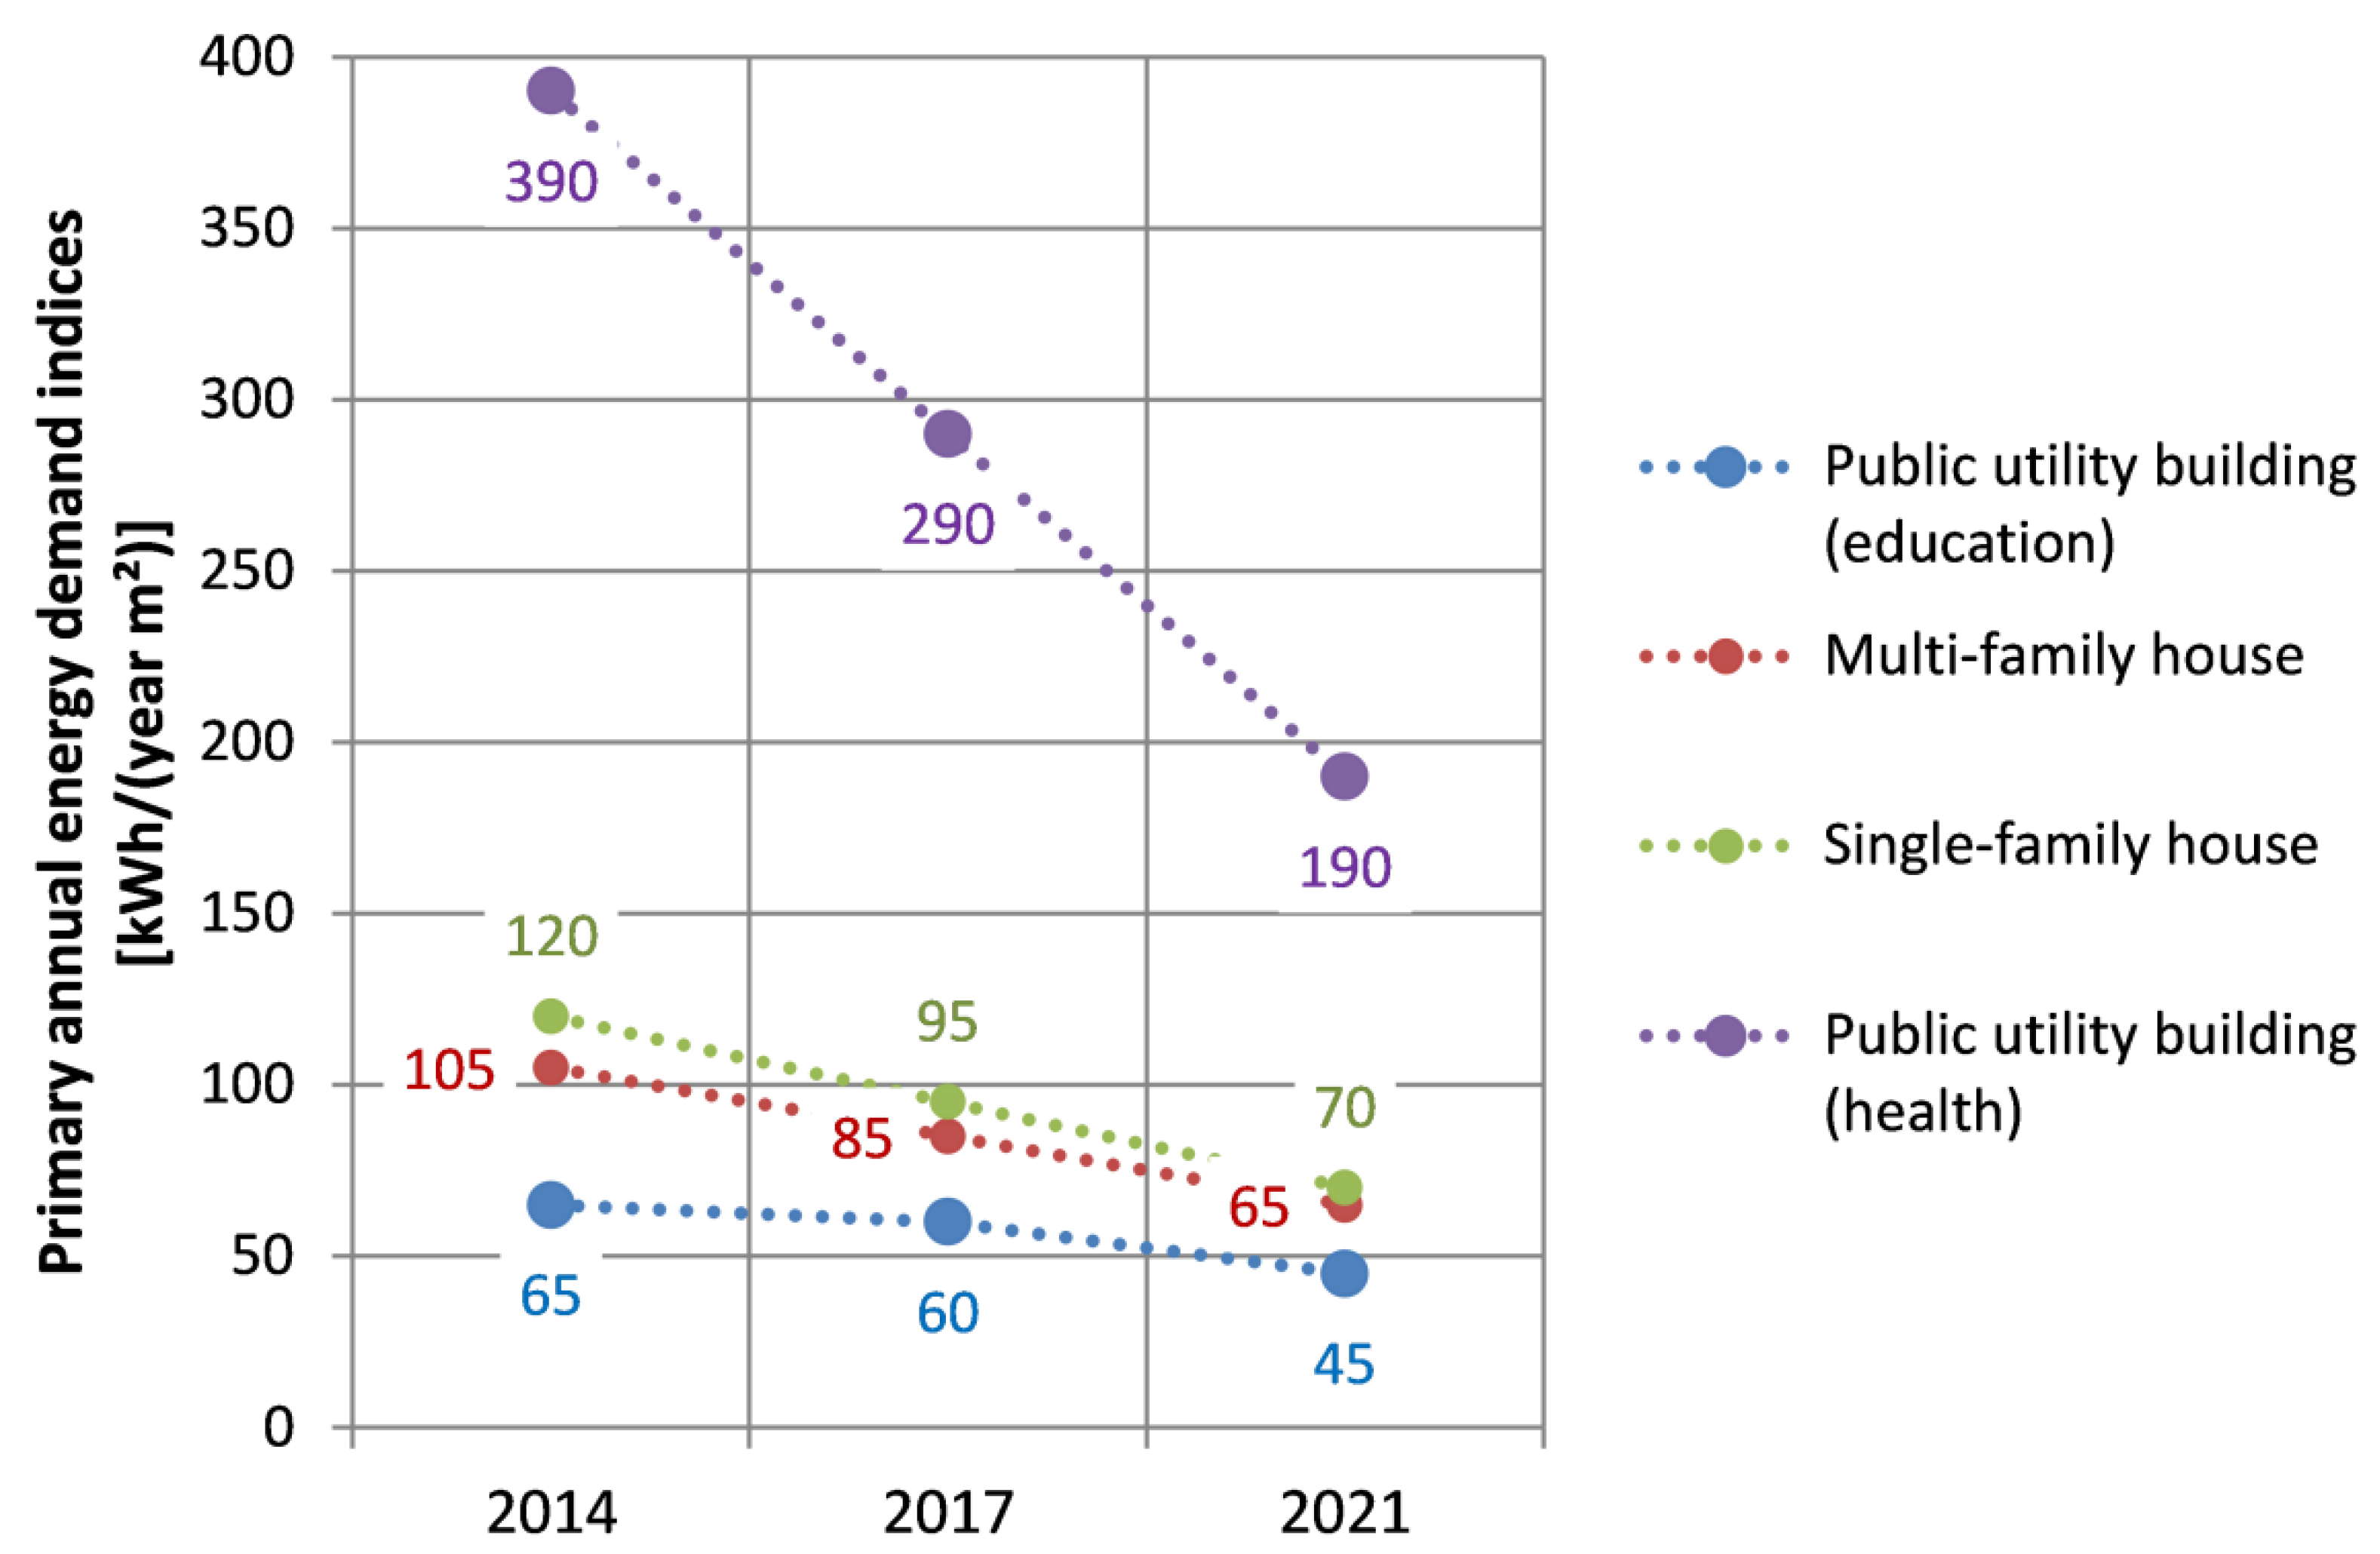
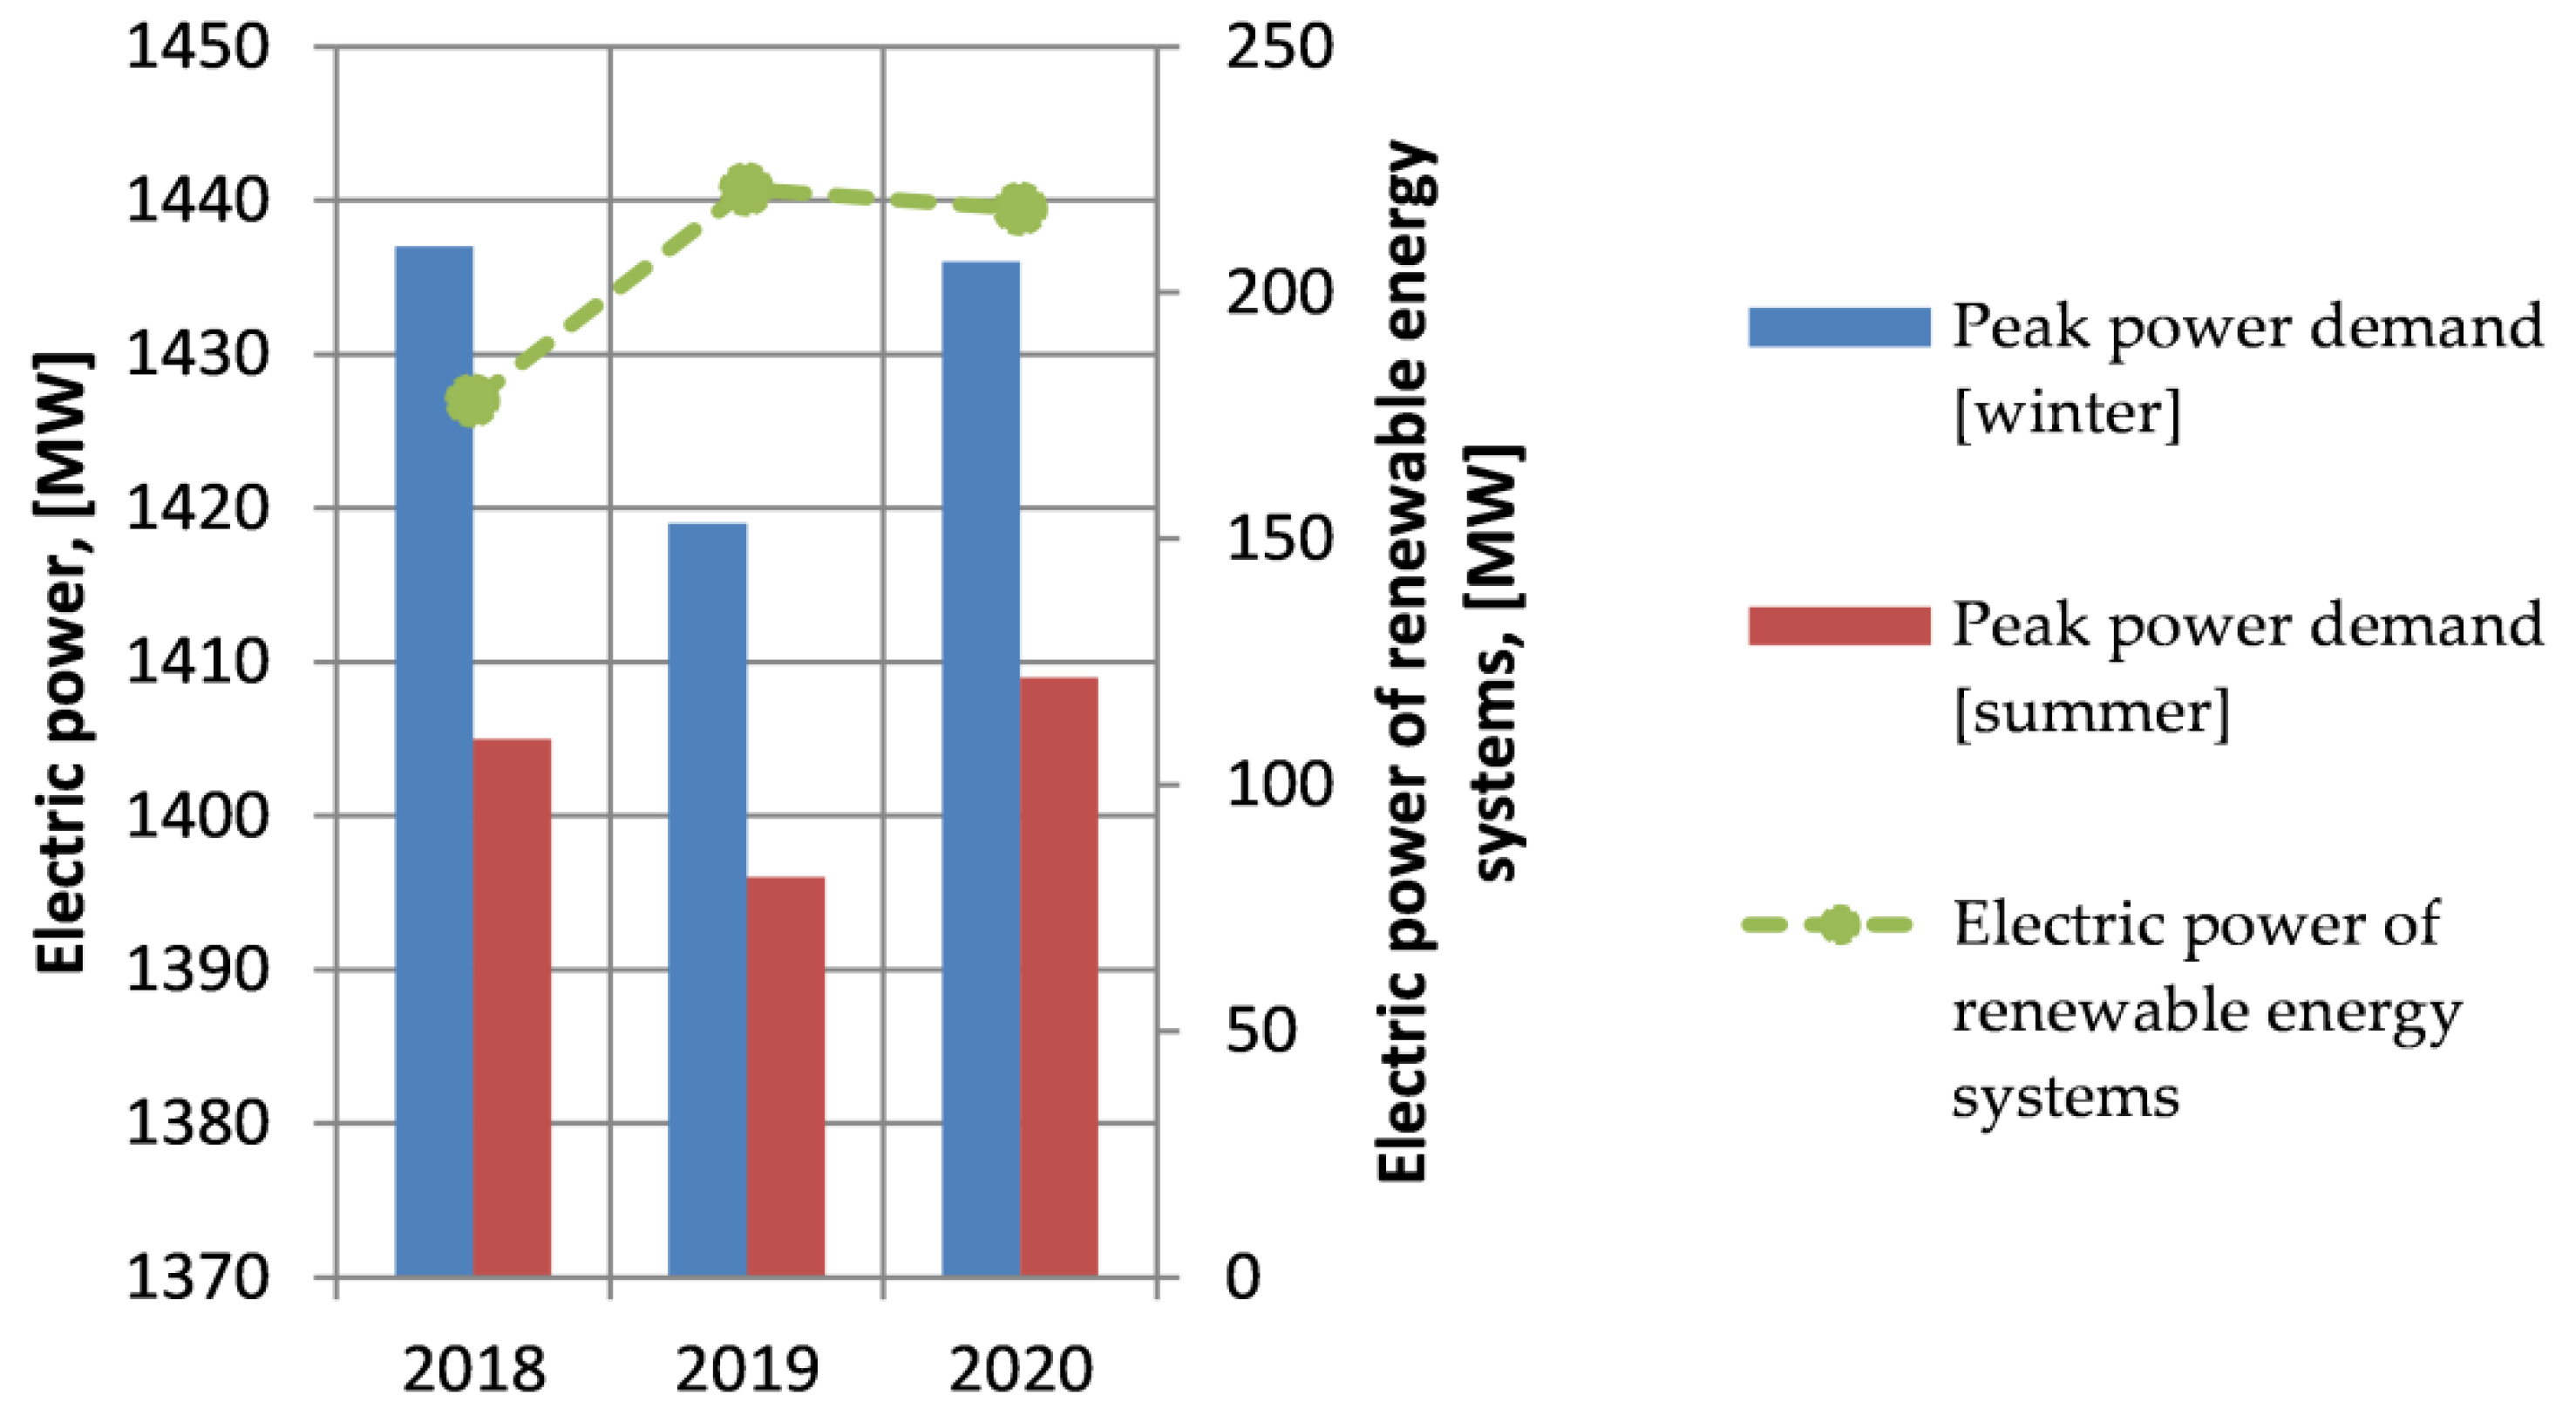
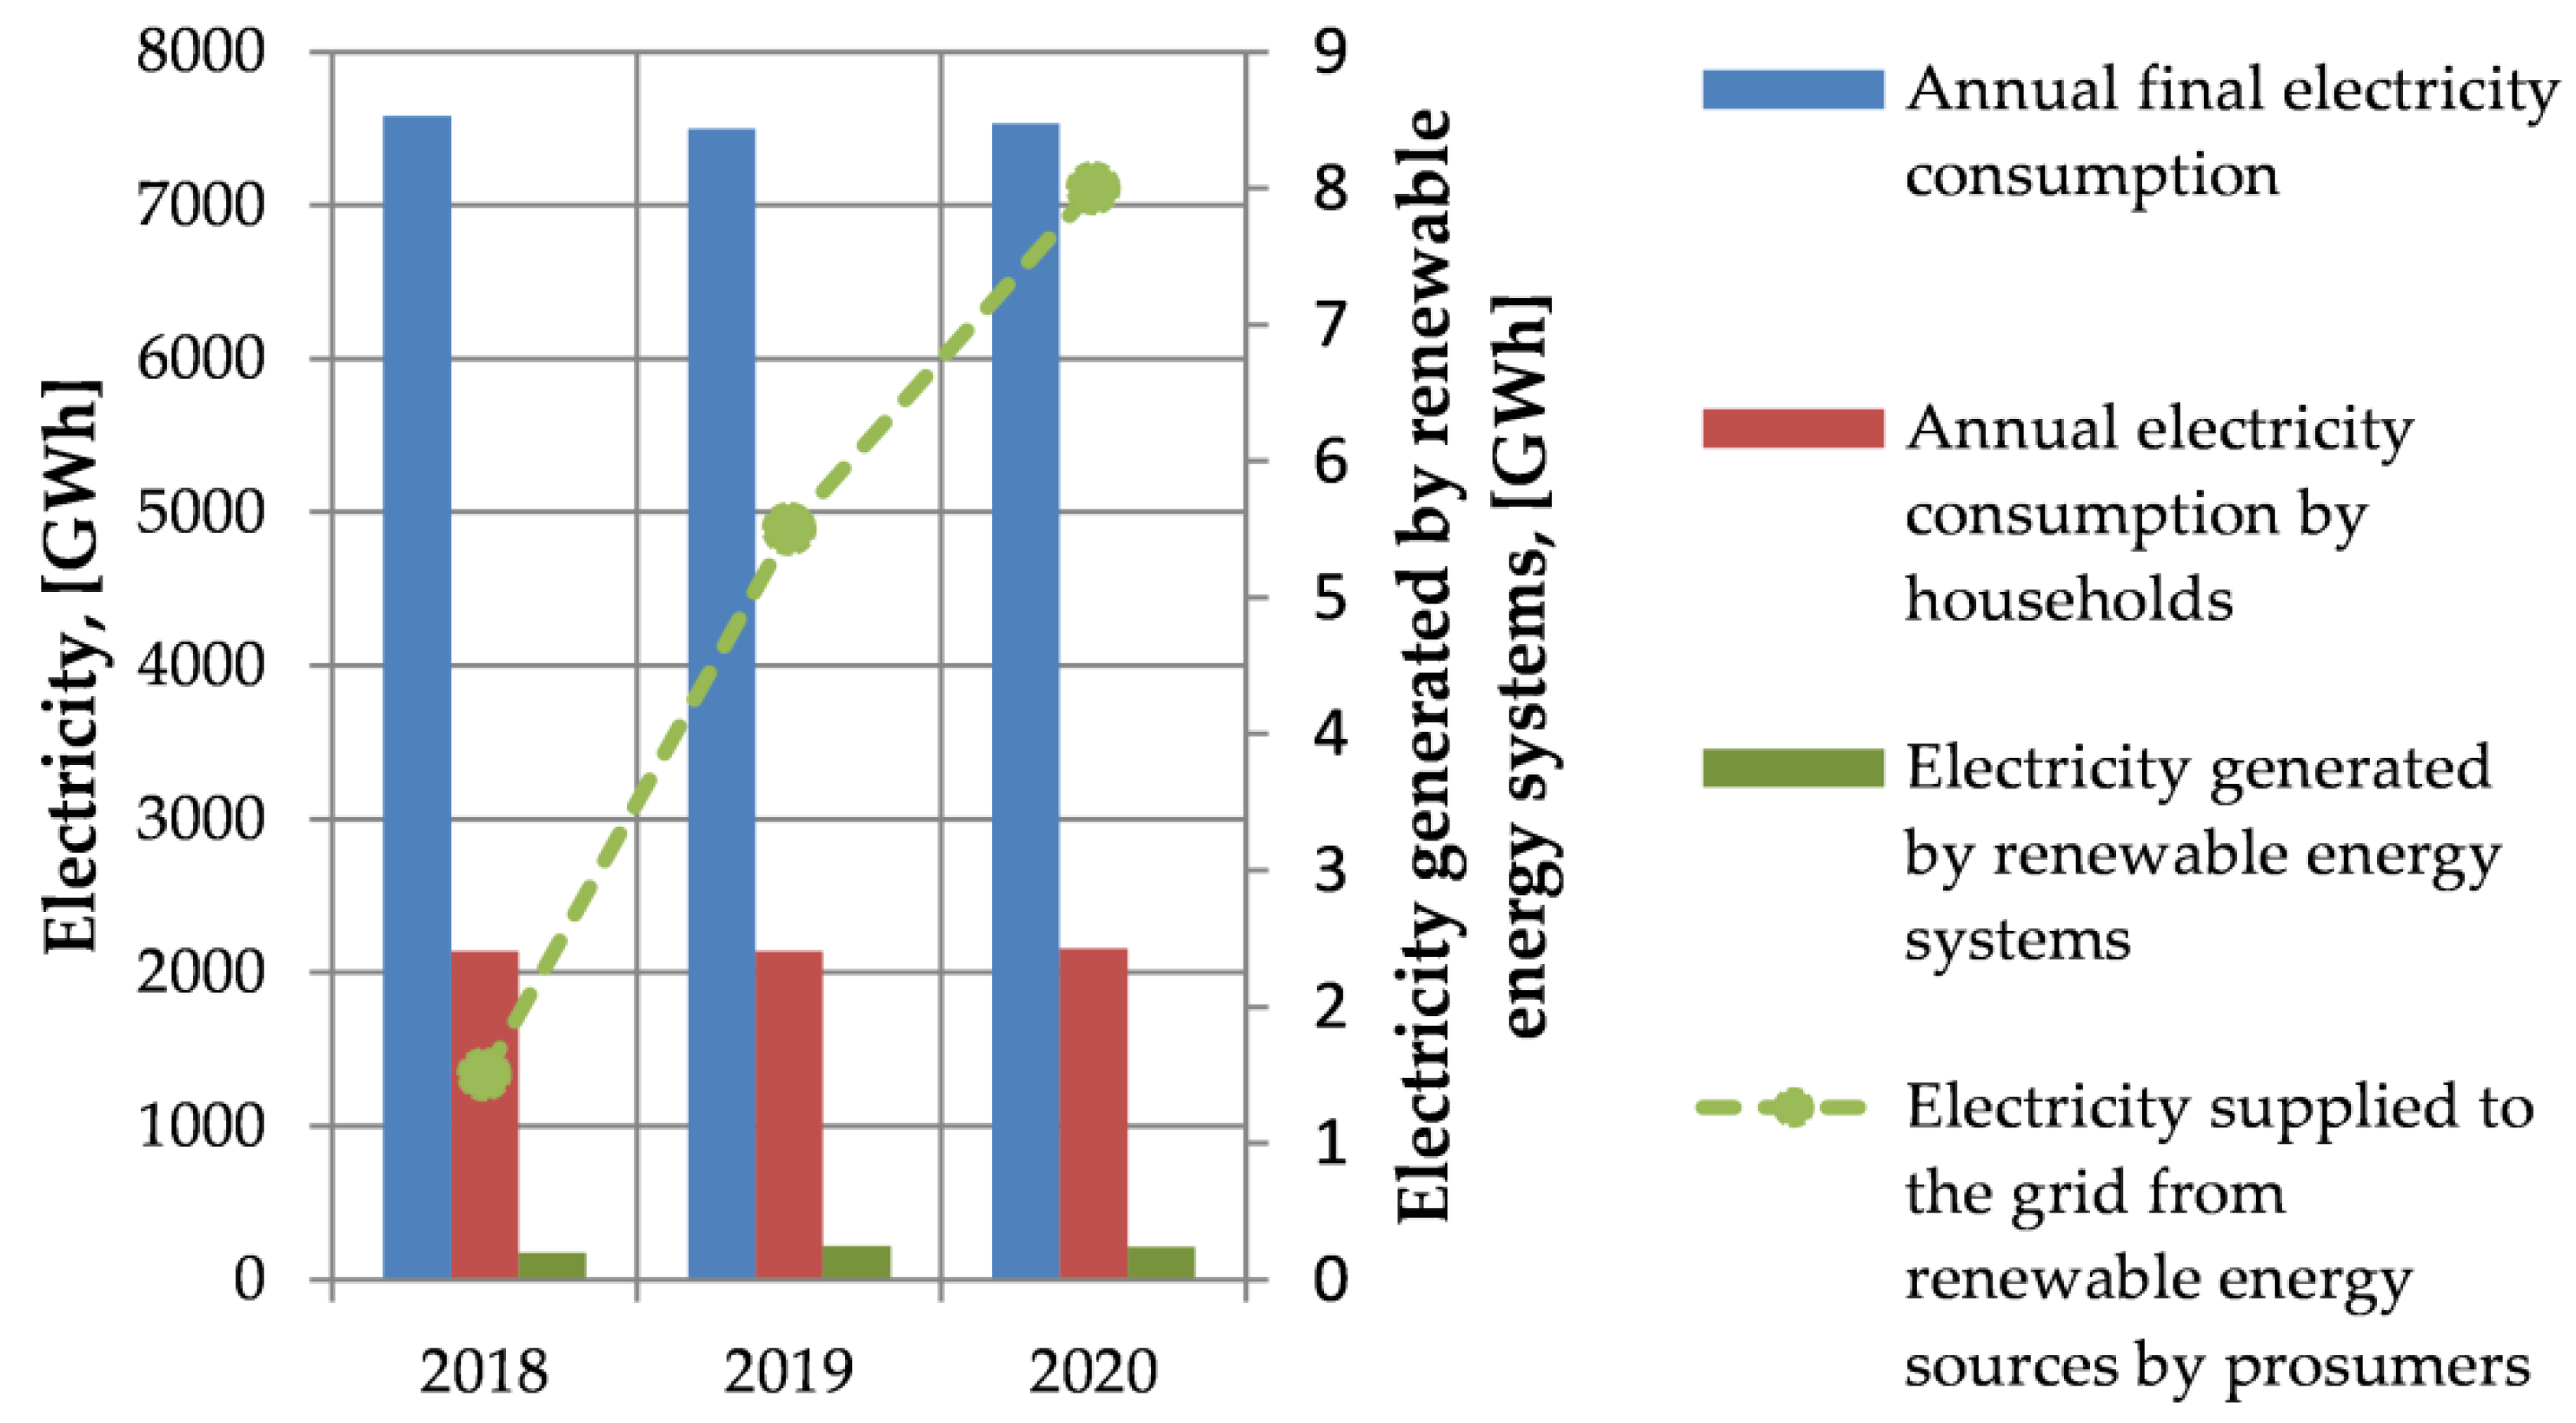
2. Administrative Characteristics of Warsaw: Housing Stock and Energy Sector Description

The settlement in today’s Warsaw dates back to the 9th or 10th century. However, the city was most likely founded at the turn of the 13th and 14th centuries, gaining its location around the year 1300. Warsaw became the capital of Poland in the year 1596, when the King Sigismund III Vasa decided to move the capital from Cracow to Warsaw [13]. Currently, there are approximately 1.8 × 10⁶ inhabitants in Warsaw and the city covers an area of approximately 5.20 × 10⁸ m2. The average population density is approximately 3.46 people per square meter [14]. Administratively, Warsaw is divided into 18 districts (Figure 1) and Śródmieście is the historical and present city centre [15].
The largest area includes the following administrative districts: Wawer (7.97 × 10⁷ m2), Białołęka (7.00 × 10⁷ m2) and Ursynów (4.38 × 10⁷ m2), while the smallest one is Żoliborz (8.50 × 10⁶ m2) (Table 1). The largest residential area is in Białołęka (1.00 × 10⁷ m2) (Table 1, [16]). The “greenest” districts are Wawer (1.43 × 10⁷ km2) and Białołęka (1.17 × 10⁷ m2). Additionally, taking into account the percentage of parks, lawns and green areas in housing estates in the district’s area, Wawer (18%), Rembertów (17%) and Włochy (15%) can be distinguished in this regard. The districts with the largest share of transport routes are located in the outskirts of Warsaw, Wawer (1.35 × 10⁷ m2, 17%) and Białołęka (1.17 × 10⁷ m2, 15%) [17]. This is mainly due to the location of the main transport connections: internally within in the city and externally outside of the city.
The structure of the land by use is as follows: 28% residential areas, 28% green areas, 12% agricultural areas, 10% development and communication areas, 7% service areas, 3% surface water areas, 1% technical infrastructure areas and 6% other [18]. It can therefore be concluded that Warsaw has a relatively large biologically active area, which constitutes 42%.
The final energy consumption structure in the year 2014 [9], averaged for the long-term weather conditions, is shown in the Figure 2. Most important is the heat from the district heating network (41.87%) and electricity from the national grid (32.52%). The category “Others”, which includes renewable energy systems, was still marginal (5.82%) that year.
According to the data [9], buildings constructed in the period of 1945–1970 have the largest share of the total number of buildings in Warsaw (26.39%). The share of relatively new buildings constructed after 2002 accounts only for 4.60%.
The final as well as primary energy consumption indices depending on the construction period show how different buildings in terms of the energy efficiency are in Warsaw (Table 2) [9,19,20].
Low thermal energy buildings can be improved through the typical retrofit methods: reduction of thermal transmission of the building external partitions (e.g., windows, walls, roofs), elimination of the existence of thermal bridges, improvement of efficiency of heating systems as well as hot water preparation (e.g., exchange of heat source, introduction and optimization of energy control strategy), improvement of ventilation system and heat recovery from the exhausted air. The possible effects of the thermo-modernization in two variants, depending on the construction period and type of a building, of two variants are presented in the Table 3 [20].
The first variant “standard” means reaching the level of the reduction when current requirements are fulfilled [3], while “deep” means the application of more intensive technical upgrading actions, up to reaching the maximal possible effects assuming use of new but conventional technologies. It is interesting that the application of the current technical possibilities, even in buildings that have recently been put into use, allows for reducing the demand for final energy in residential buildings by approximately 35% to almost 40%. It is possible mainly due to the reduction of the heat demand for heating the ventilation air, e.g., replacing gravity ventilation with a mechanical ventilation system with heat recovery.
It is characteristic for old buildings that no changes in their external appearance are possible if they are under conservator’s protection. Therefore, in such buildings, the thermal insulation of the external partitions can be added only from the inside of the building. The effectiveness of such treatments is low, and reduction of energy consumption does not exceed 20%. In many cases there is no possibility to install solar collector systems or PV systems due to heritage protection, so the old quarters of Warsaw are not so attractive in terms of generating energy on-site (locally). The most interesting in terms of retrofit are groups of buildings built in the 1970s and later, with the annual final energy consumption index for space heating and hot water preparing at a level of 220 kWh/m2. In such cases the possible reduction of energy demand reaches 40%, but it is still too low for reaching positive energy building status.
Figure 3 presents maximum annual primary non-renewable energy indices for heating, ventilation and hot water preparation [3]. The strongest requirements are foreseen for educational buildings, while for residential buildings the requirements are less restrictive. Nevertheless, in all cases the limit values are constantly lowered, which helps to reduce the consumption of non-renewable primary energy and hence CO2 emissions.
The annual final energy consumption in the year 2019 [9] for district heating was 8668 GWh, gas (pipelines) was 5300 GWh, electricity from the grid was 7500 GWh, while the emission of the carbon dioxide was 5.62 × 10⁹ kg [9].
In the year 2019, the co-generation heat and power plants had a thermal capacity of 2245 MW [9]. Old coal-fired plants are expected to be decommissioned in the near future. They will be replaced by modern gas-steam units [21]. During peak demand, the system can use thermal energy of 1 GWh stored in a water tank [9].
The capacity of all electricity generation sources in the year 2019 was 8.529 GW, while electricity consumption was 7500 GWh, of which households consumed 2141 GWh while the electricity storage in the electricity grid was 2 MWh [9].
In the year 2014 [9], taking into account the type of heating source (system and fuel), the situation was as follows: district heating supplying heat to buildings of 80,789,204 m2 of heated area (71.0%) and gaseous fuel for 23,395,279 m2 (20.6%). There were other energy carriers used in small amounts: electrically driven heaters for 2,599,475 m2 (2.3%), propane-butane mixture for 1,316,459 m2 (1.2%), light fuel oil for 3,432,031 m2 (3.0%), hard coal for 1,843,420 m2 (1.6%) and renewable energy sources for 411,743 m2 (0.4%).
Possibilities of the reduction of final energy consumption in residential buildings has been estimated by assuming average efficiency of the heating systems for all types of residential buildings in the specific period of their construction due to lack of detailed data. Additionally, it was assumed that historical buildings would not be refurbished. As the final energy reduction was decreased by almost 30% in the standard and 40% in the deep retrofit, relevant emissions in the residential sector are possible.
A characteristic feature of the demand for electric power is the lower demand in summer, but due to the increase in cooling demand, these relations will change (Figure 4). Although the available capacity of renewable energy sources is constantly increasing, it is still lower than 16% of the actual needs.
Electricity consumption in the last three years has remained stable despite the continuous development of the city (Figure 5). Energy consumption in households in the following years has been similar and accounts for less than 29% of total energy consumption in the city. Unfortunately, the coverage of energy demand from renewable energy systems is less than 2%. However, the real share of renewable energy sources is higher because the official data do not take into account the energy produced by prosumers for their own needs [9].
The basic rate of thermal energy necessary to cover the needs in Warsaw is generated in heat and power plants and heating plants (Figure 6). The available thermal installed capacity of renewable energy systems accounts for about 6% of the total demand.
The heat generated in renewable energy systems (Figure 7) accounts for less than 5% of the heat supplied to end users by the district heating network. However, it should be noted that the heat generated by individual users for their own needs is not included in the balance.

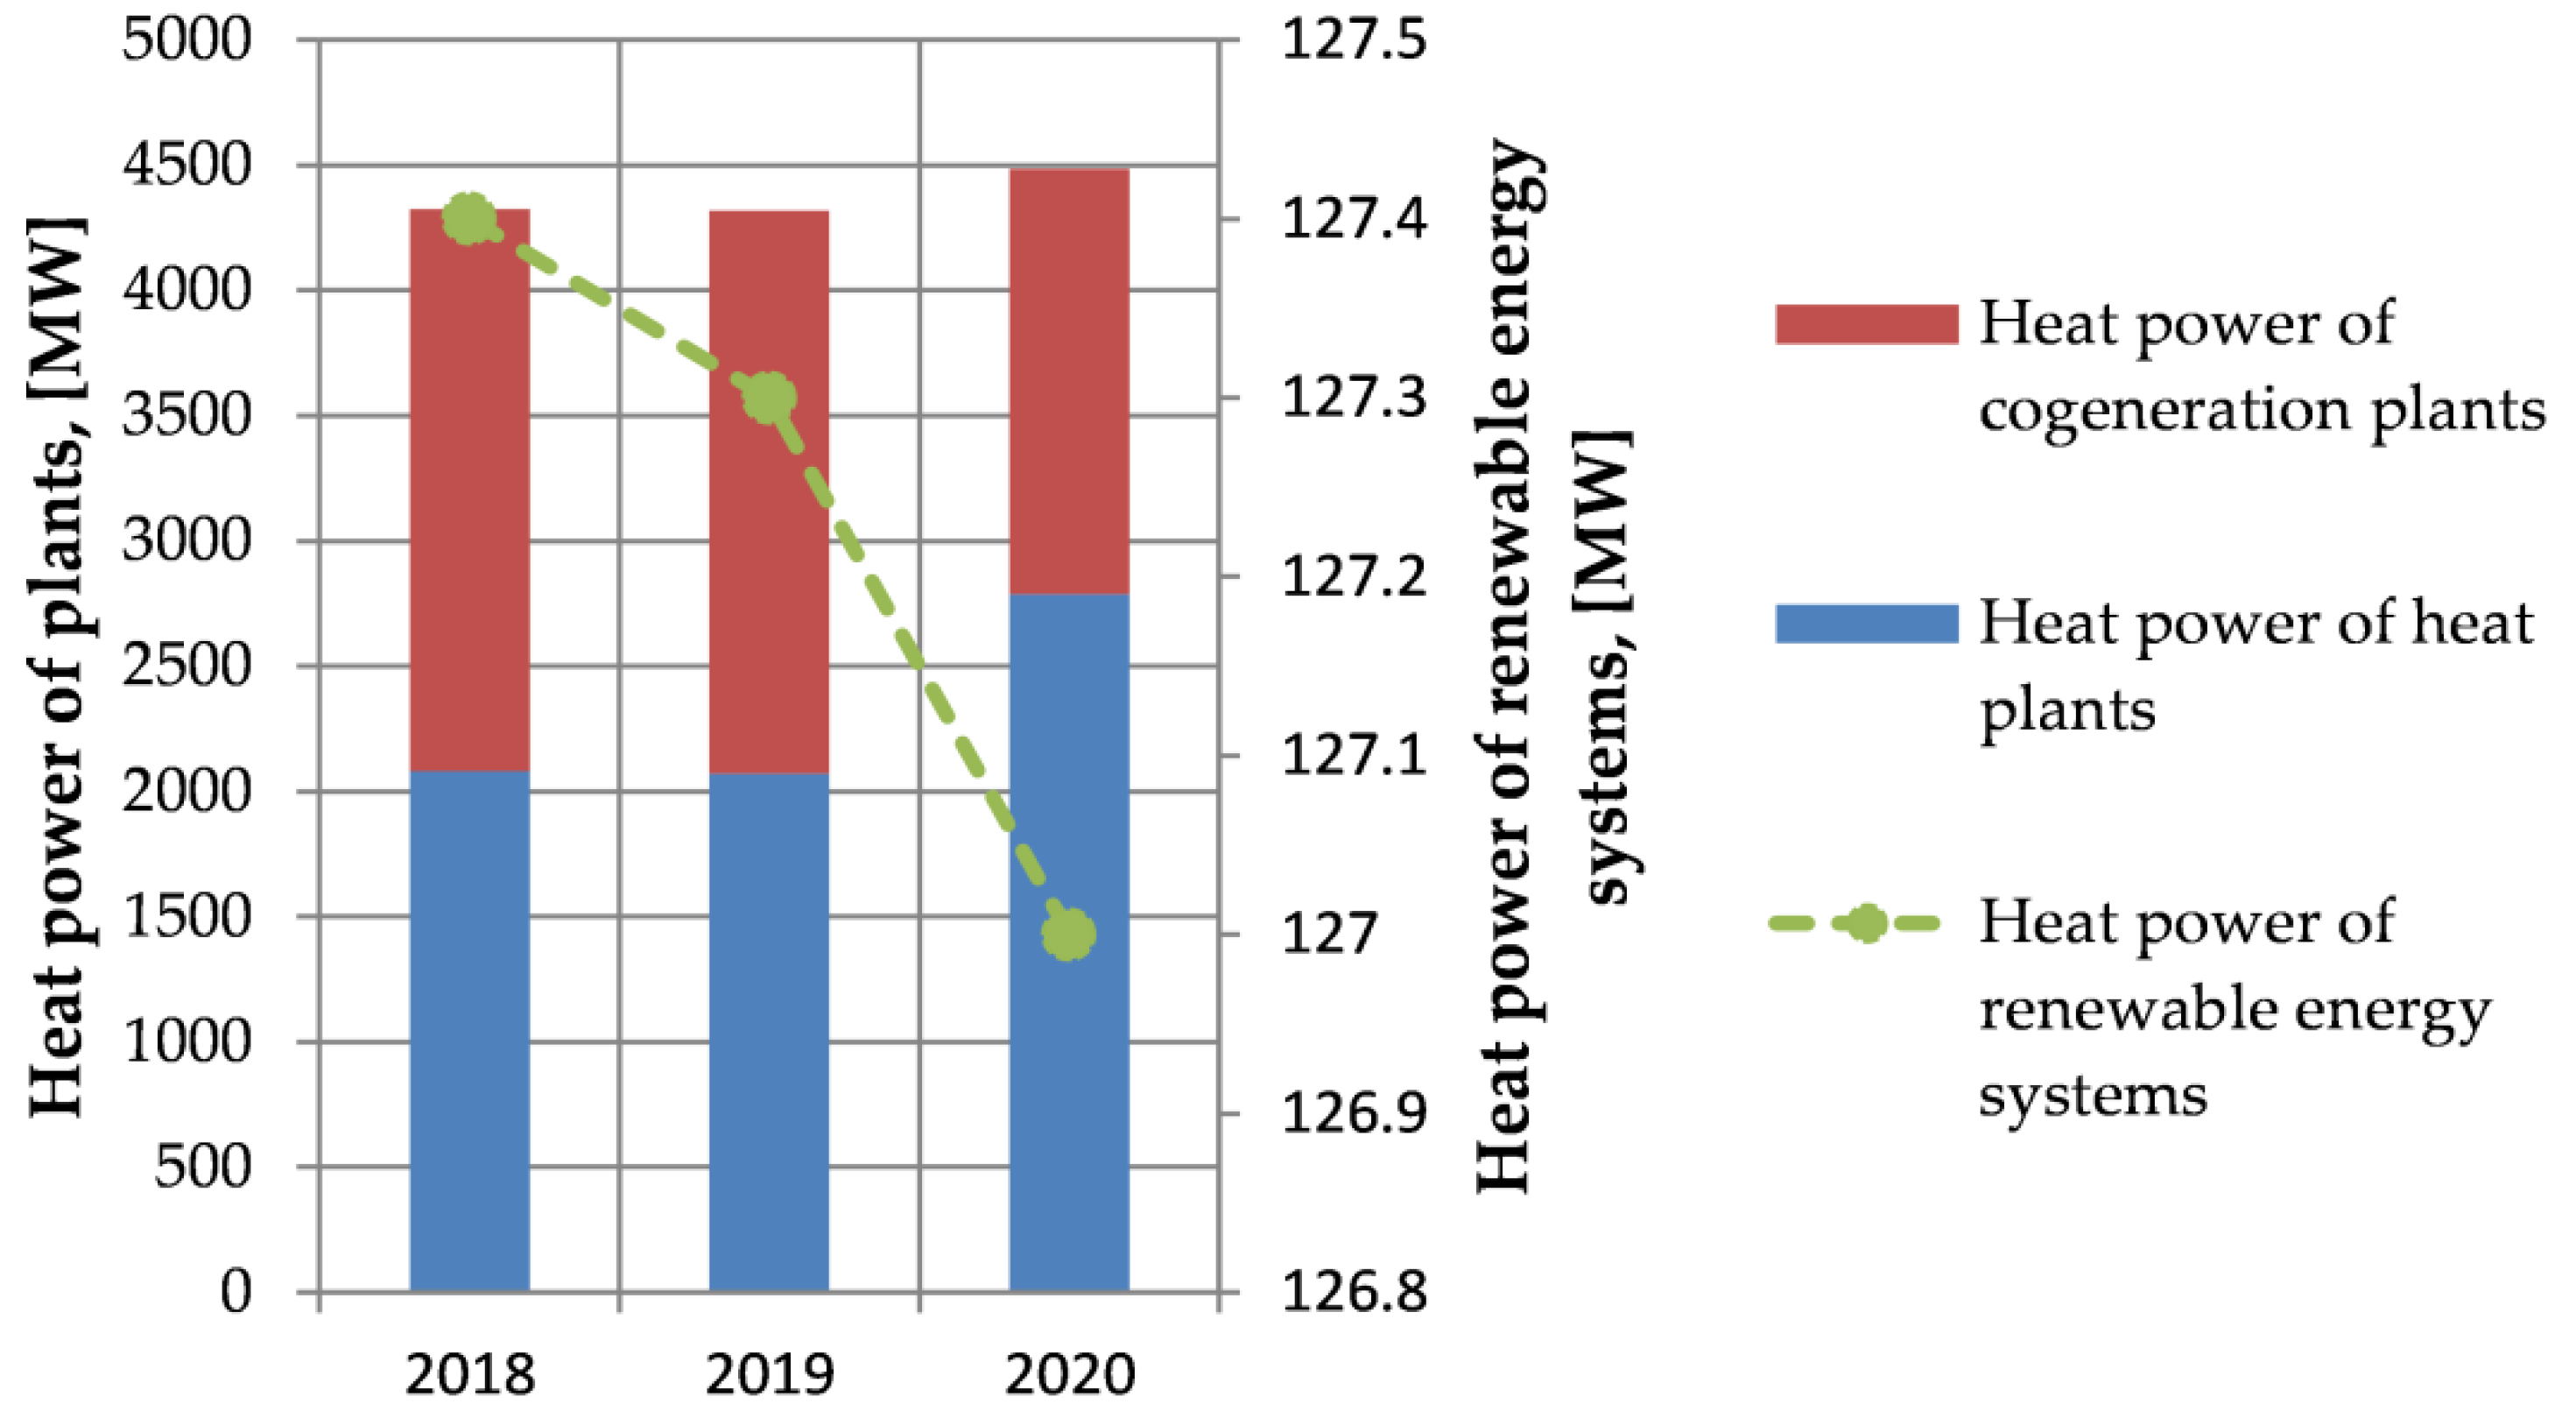
3. District Heating Network

The city of Warsaw is characterized by a very specific situation in terms of supplying heat to end users: the residential and public sector, services and industry. Heat is supplied centrally, ensuring cheap and reliable collection of this heat by users located in all parts of the city. Warsaw’s district heating network is one of the largest in Europe, with a length of almost 1800 km. It supplies heat to over 80% of buildings in the city. Heat is produced in co-generation, and coal is the main energy fuel [22]. Polish district heating systems are high temperature systems since they can supply steam with temperatures of 120 °C. The present state and planned development of Warsaw’s district heating system is presented in Figure 8 and it is mainly for residential purposes.
However, when analysing Figure 8, a question can be asked: why should the new residential districts (in yellow) be connected to the central district heating network? Extending the old network of poor quality (poor thermal insulation, corrosion of pipelines, leaks of heating medium (water or steam)) to new urban areas raises concerns not only in terms of energy efficiency, but also of the economic efficiency of such projects. The construction of new distributed energy systems focused on the use of own local energy resources, in particular renewable energies, seems to be a much more rational solution of energy and economic efficiency. Moreover, the construction of new buildings in newly emerging districts with the use of modern building materials and technologies enables a significant reduction in energy requirements for heating buildings. Newly created housing estates are usually characterized by low indices of energy needs. If, moreover, modern installation technologies are used, then, as a consequence, the final energy consumption can be significantly reduced and can easily meet modern building energy codes. Thanks to the use of renewable energy, the consumption of primary energy from fossil fuels can decrease significantly or even not be used at all. When using their own local and renewable energy resources, new estates can not only cope with their own small energy load but can also share energy with districts in the neighbourhood, becoming Positive Energy Districts. The next section presents and analyses the potential for using renewable energy in Warsaw. The different subchapters refer to the different renewable energies that can be used.

4. Potential of Renewable Energy Utilization in Warsaw

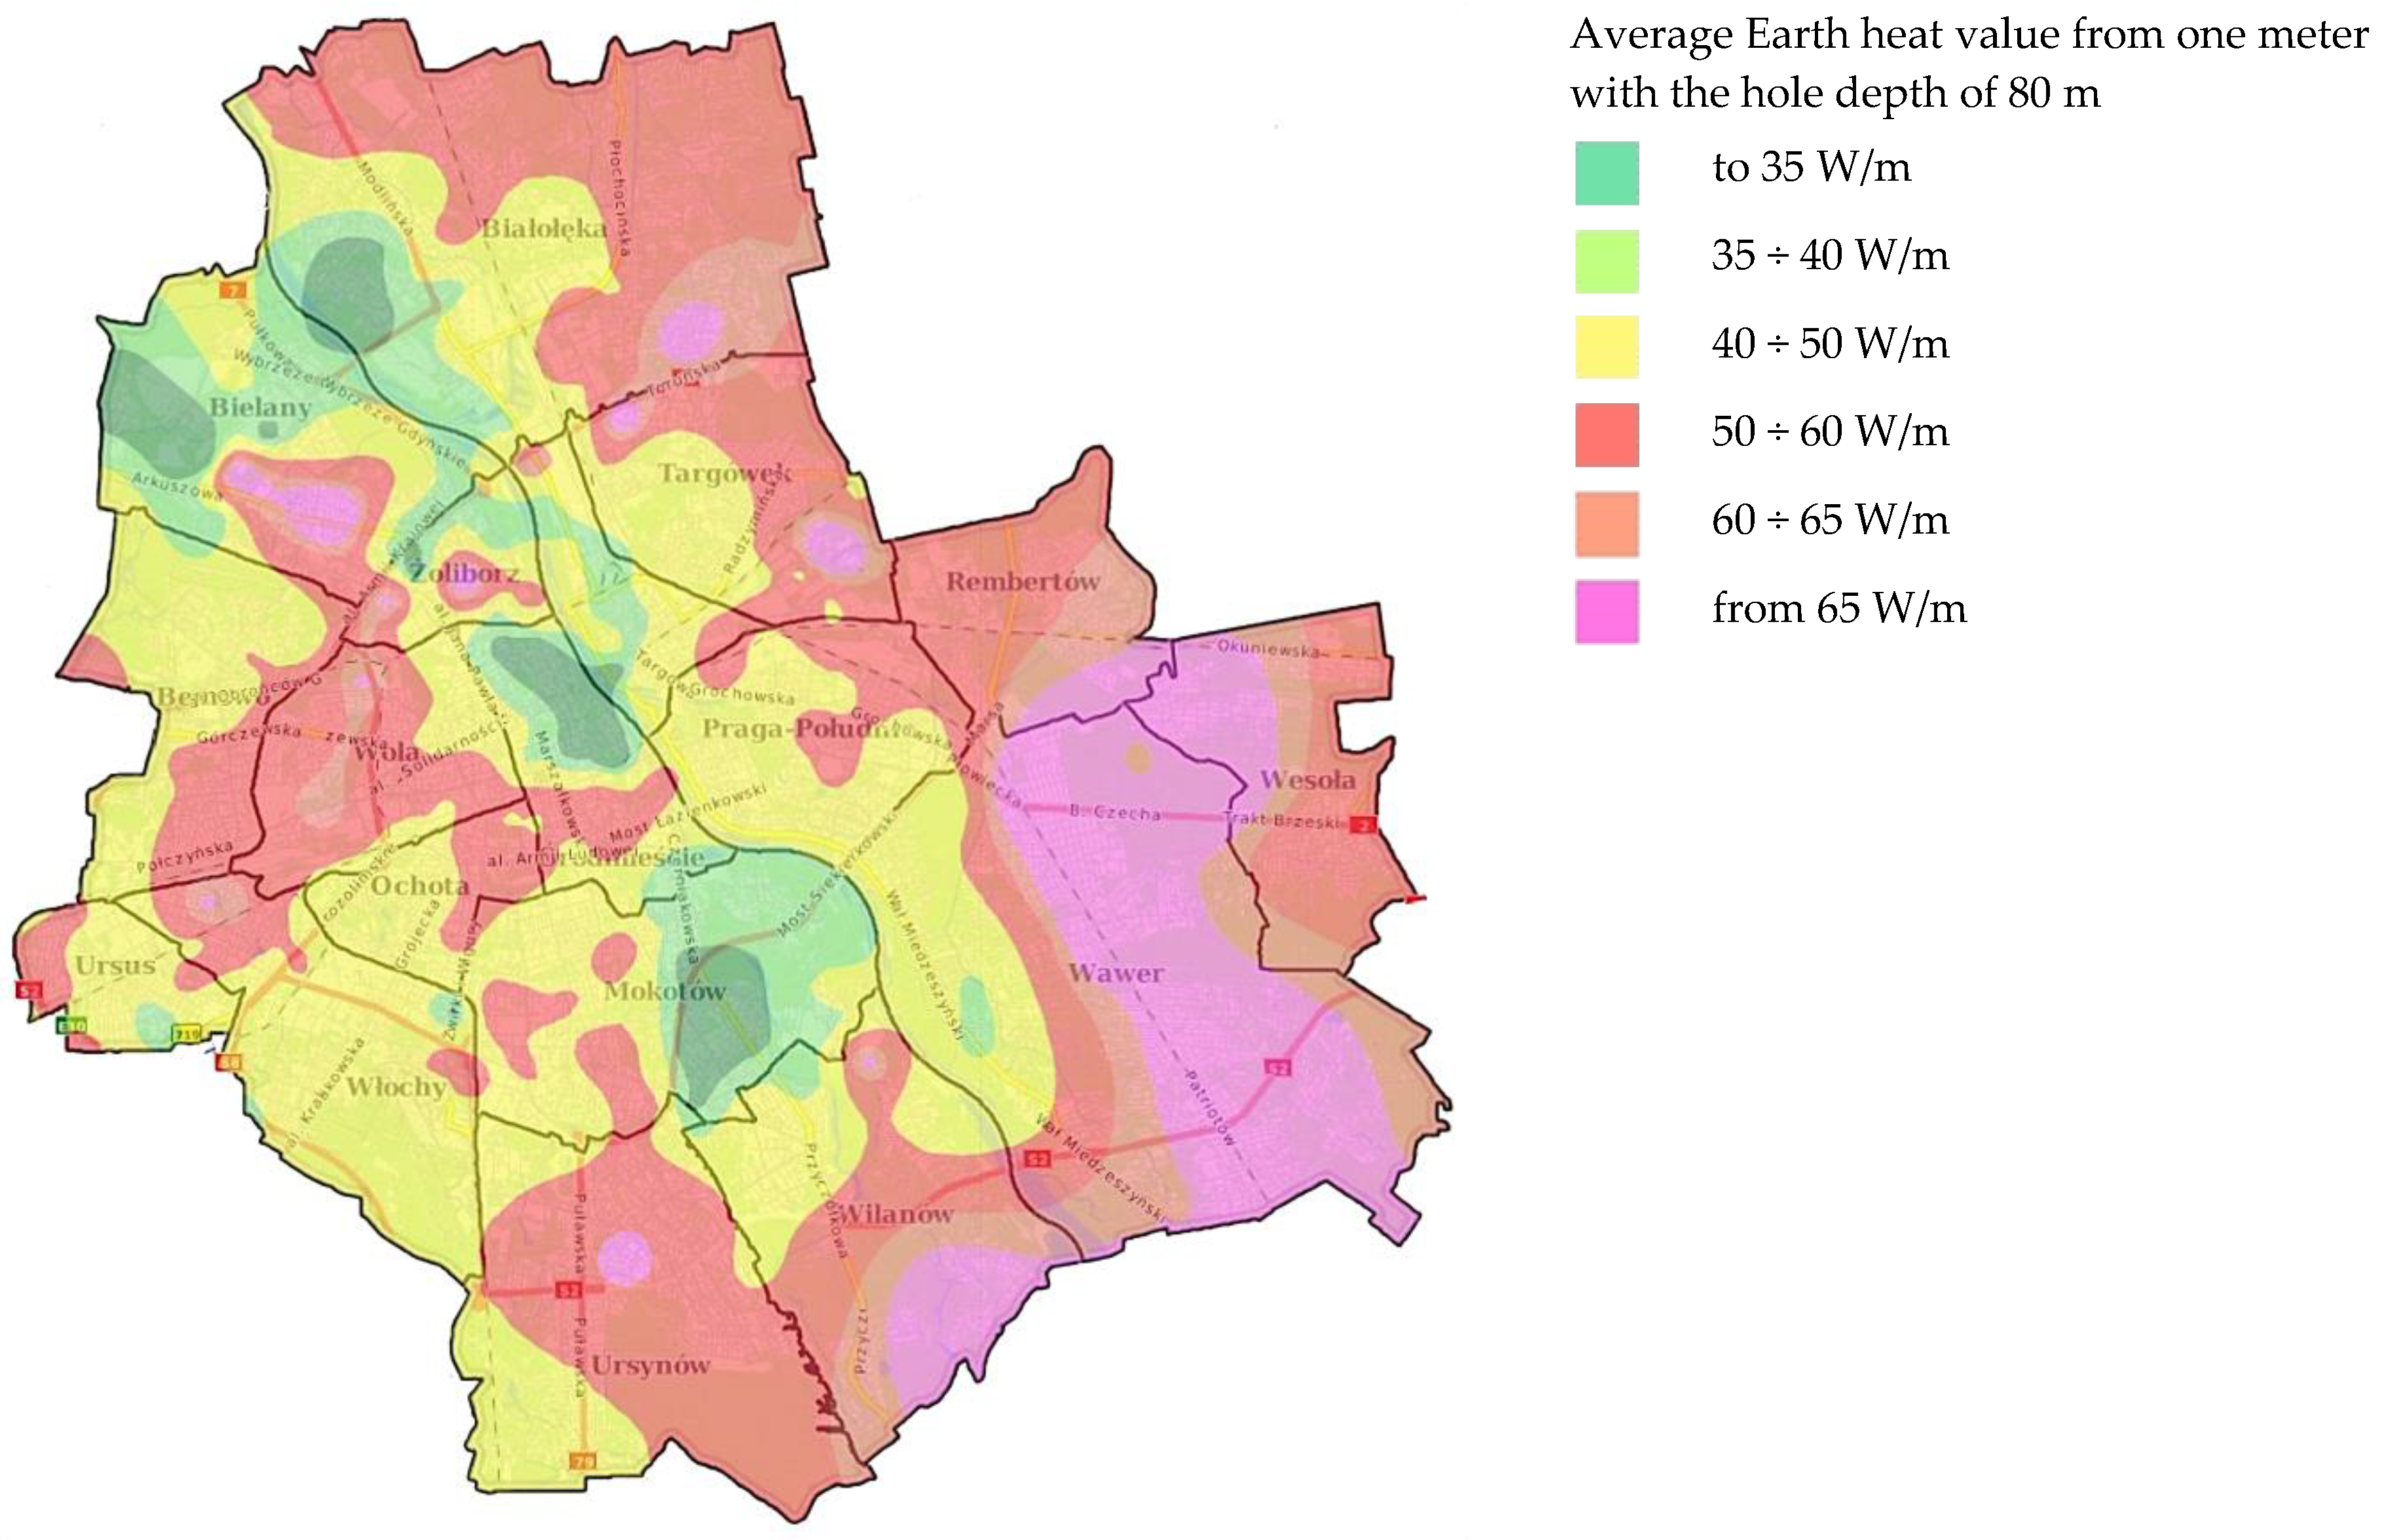
4.1. Geothermal Energy
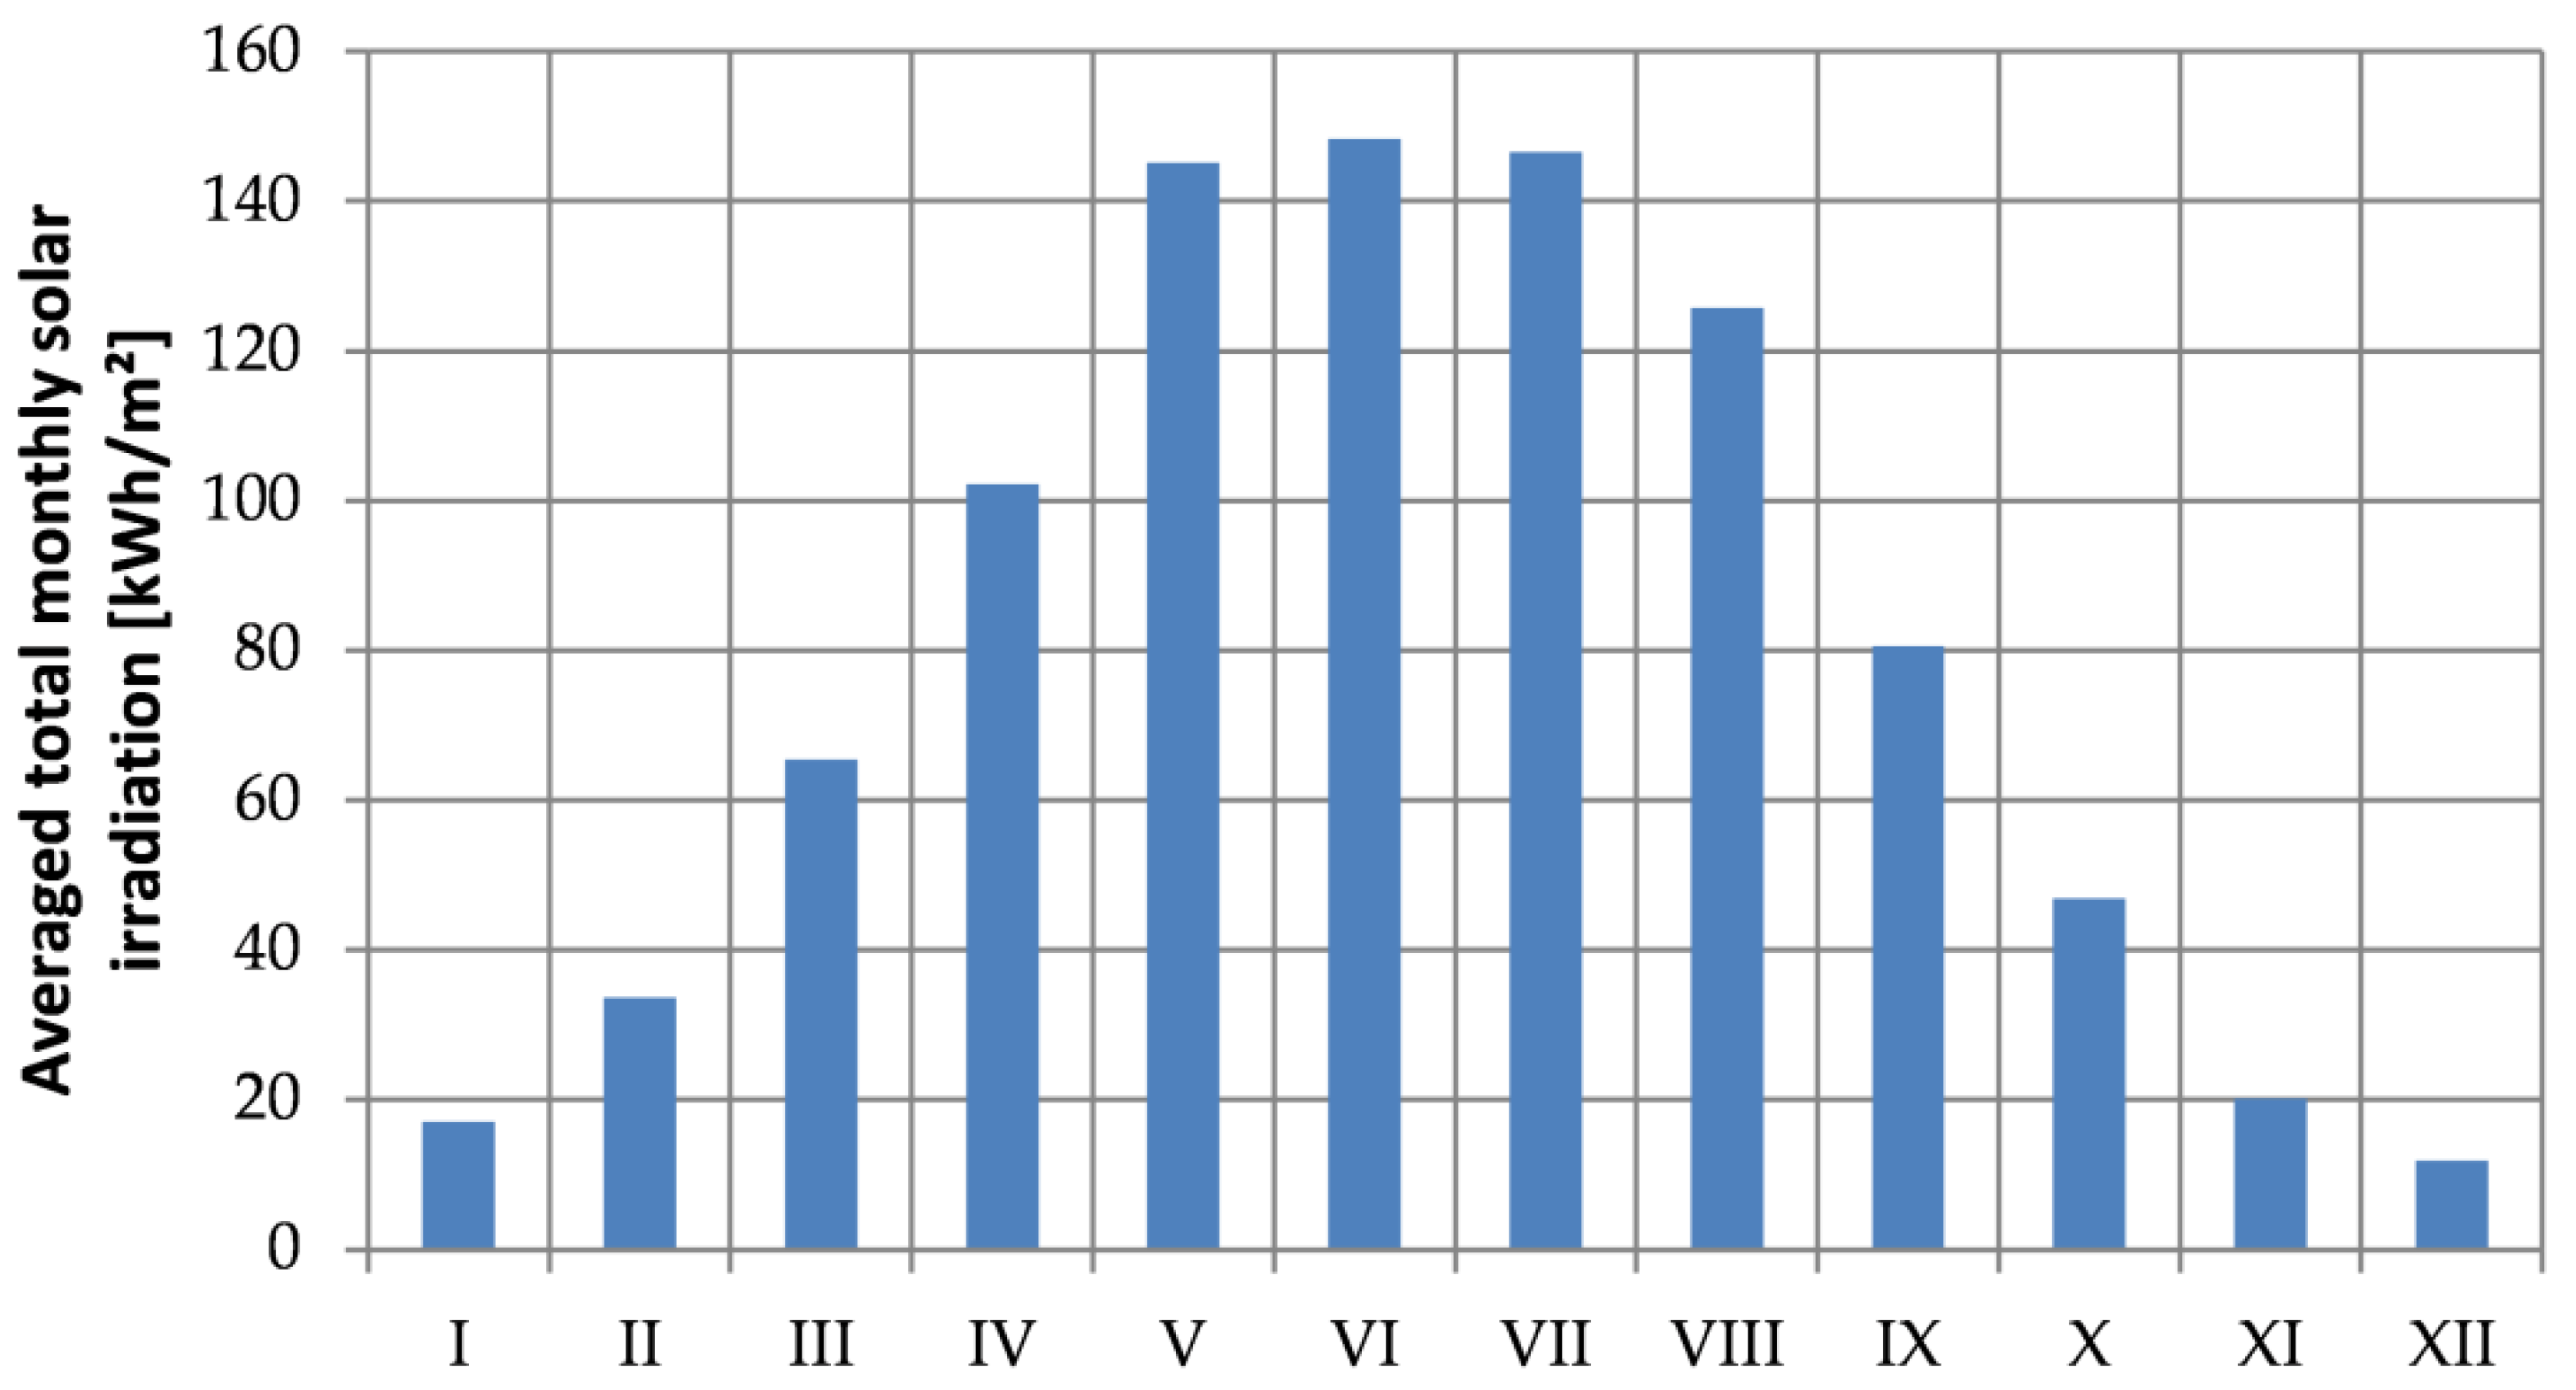
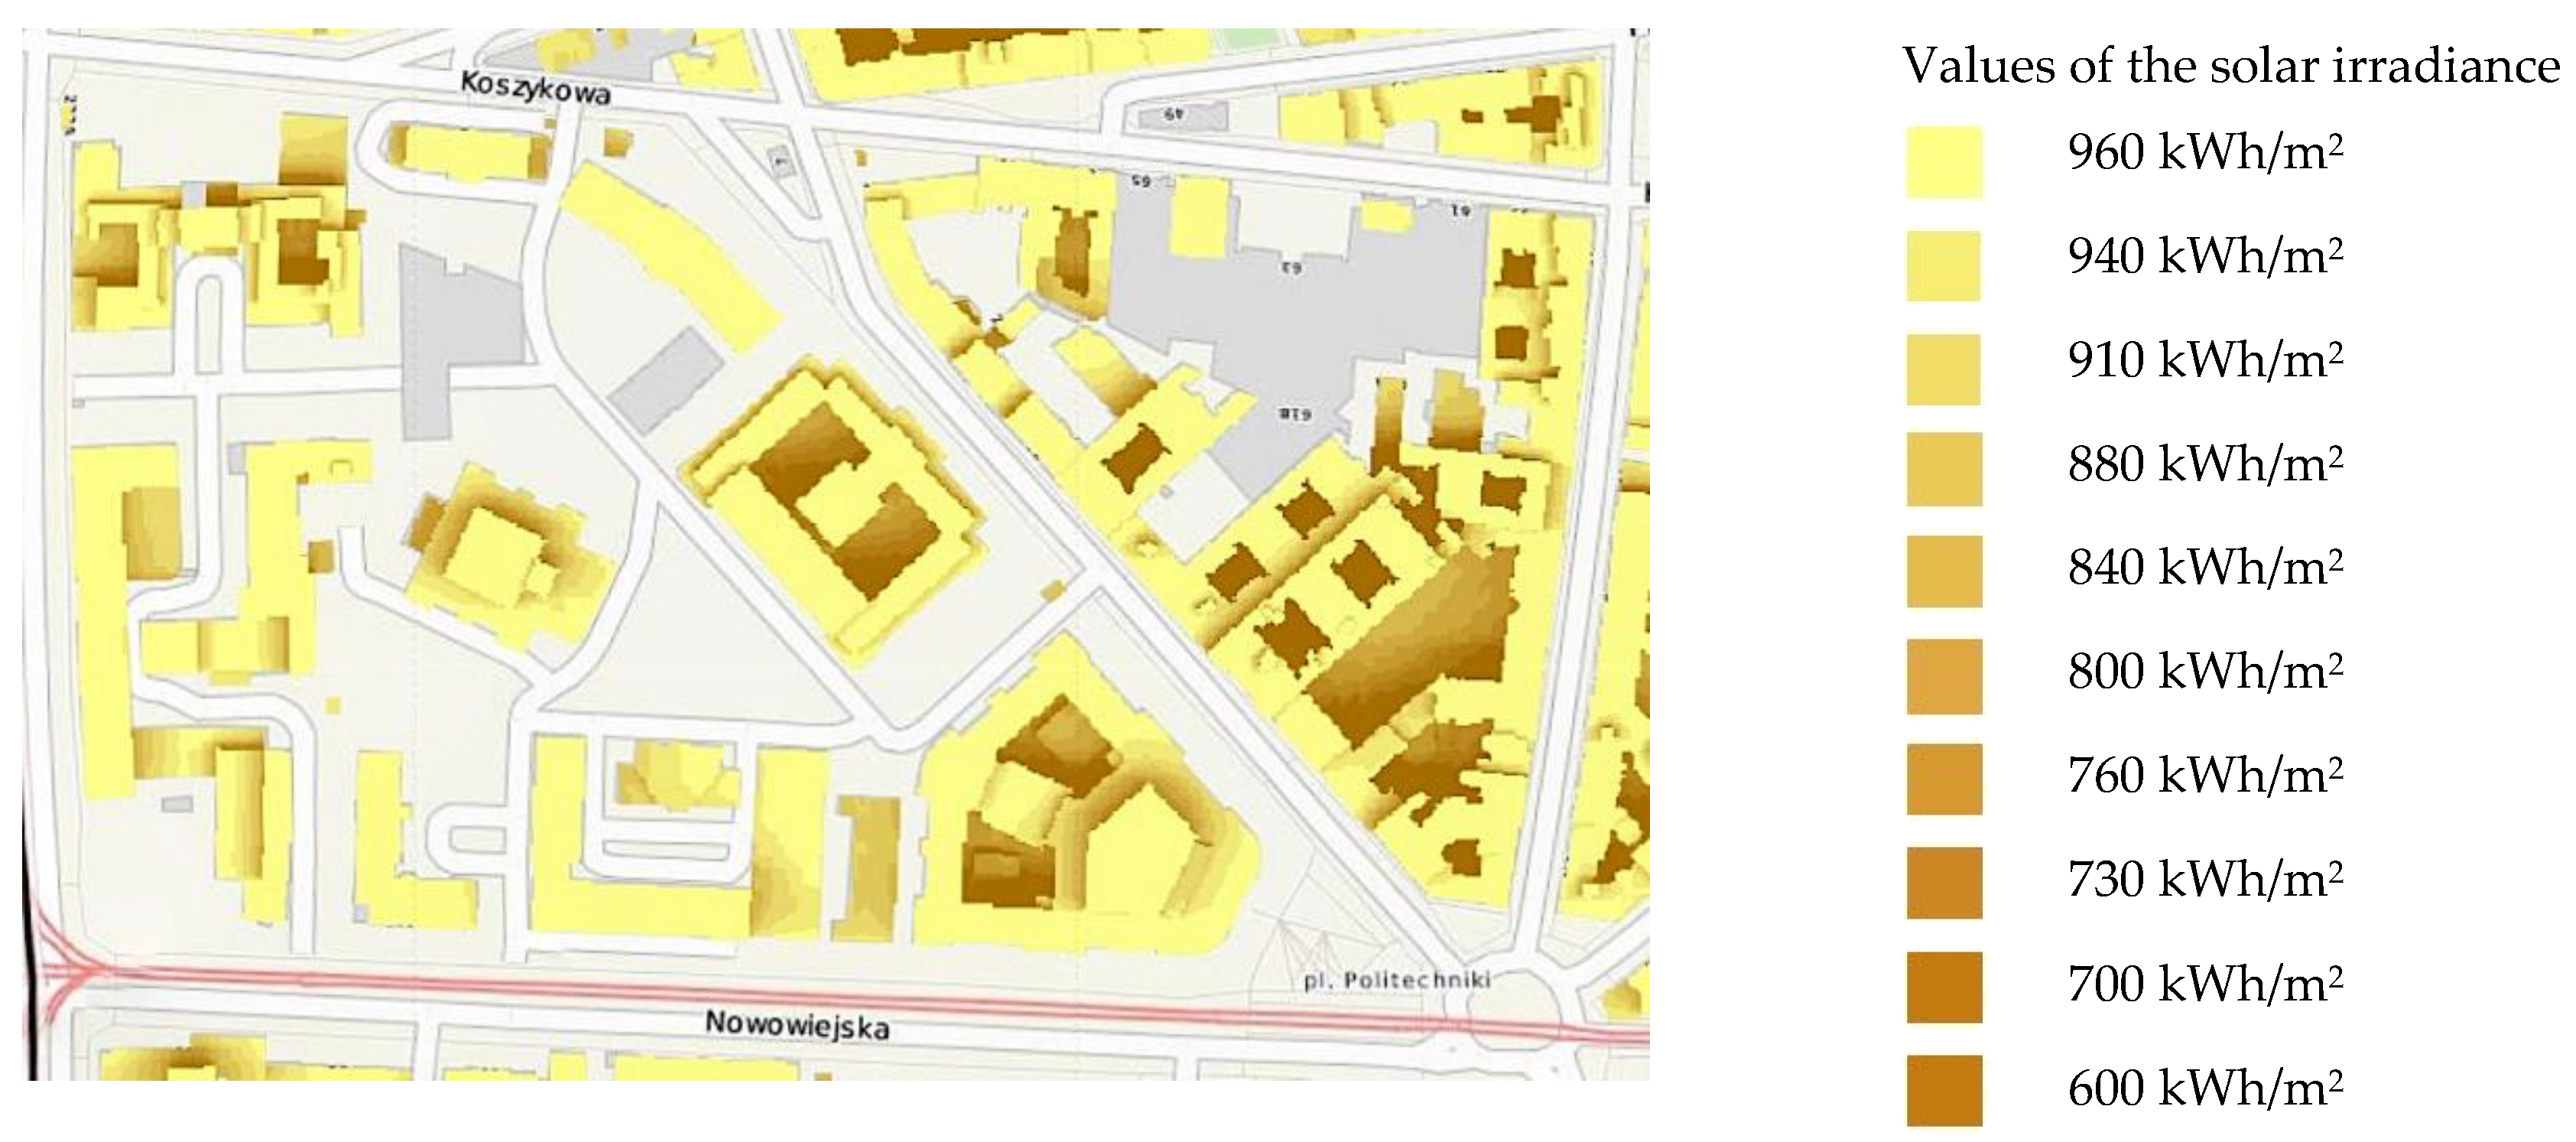
In Poland, geothermal energy potential is rather low. There are resources of low enthalpy geothermal water which can be applied for heating and balneology needs. There are thermal plants where geothermal waters are effectively applied for heating, however their utilization is combined with heat pumps and gas boilers.
Geothermal water resources in Warsaw have been assessed as average [23], i.e., at a depth of 1000 m the temperature reaches 30–35 °C, at a depth of 2000 m it exceeds 55 °C, and at a depth of 3000 m it reaches even 85 °C [23,24]. Economic profitability, understood as competition with the currently used technologies, requires temperatures of a resource (geothermal water) to be at least 65 °C at a depth of 2000 m. As the prices of “conventional” energy and heat increase, the competitiveness of this technology increases.
The districts of Wawer, Białołęka and Ursynów have the best opportunities to use geothermal energy for heating buildings (Figure 9), but so far geothermal energy is not used.

4.2. Solar Energy

Warsaw is located at 51 °N latitude in a moderate climate zone with influences of Atlantic and Continental climate, as is true of the whole country. Such a location causes the city (and Poland) to be affected by different atmospheric fronts that result in frequent heavy cloud formation. The averaged mean yearly temperature is equal to 7.9 °C and average annual global solar irradiation accounts for 1100 kWh/m2 and solar hours are on average equal to 1600 [25]. The winters are relatively severe. The coldest months are January, February and December and solar irradiation is lowest in those months, which can be seen in Figure 10. In winter the ambient air temperature can even drop to −20 °C on extremely cold days. The average hourly ambient air temperature for averaged days of January and February (the coldest months in a year) varies during the daytime from −6 °C to −2 °C (January) or to 0 °C (February).
The highest solar irradiation occurs in June and in Warsaw the average monthly irradiation is nearly 150 kWh/m2. The lowest solar irradiation occurs in December and the average monthly irradiation is equal to about 11 kWh/m2. From October to April only about 20% of annual total radiation is available. The structure of solar radiation is characterized by a very high share of diffuse radiation. An average annual percentage of direct radiation amounts to only 46%. In summer, the share of direct radiation is higher and accounts for approximately 56%. However, from November to the end of February the percentage of diffuse radiation varies from 65% to 80%. This situation recommends solar systems for applying both direct and diffuse solar radiation; systems with concentrators are not recommended. With such a low share of direct solar radiation, the effect of concentrating solar beams is very small and can be seen only in summer. The small increase in efficiency is too expensive and the solar concentration technology (solar thermal power plants, including solar power tower plants) is not an economically efficient solution in Polish climate. The solar thermal heating systems consist of flat plate or vacuum tube solar collectors and water storage tanks. Anti-freezing mixture circulates in a solar collector loop. The annual share of the solar heating system supplying heat to DHW (domestic hot water) system can be at a level of 50%–65%; in the case of space heating the solar share is lower and accounts for 20%–30% (even when the surface area of solar collectors is at least two times bigger than in the case of a system only for DHW heating) [25].
It should be underlined that to determine the effective use of solar energy it is necessary to analyse the availability of solar energy. Estimation of distribution of solar radiation incident on any surface of solar energy receiver is very important. The surfaces of solar energy receivers, elements of active solar systems, i.e., solar collectors and PV modules, are tilted to the horizontal surface and can have different orientations (azimuth angle). To analyse solar energy availability, the appropriate solar radiation data are required. However, when we consider utilization of solar energy in cities, not only is access to reliable data important. The architecture of the buildings and the urban planning of the entire city is also very important. The arrangement of individual buildings and other construction structures in close neighbourhoods are also very important. The urban environment may limit the availability of solar radiation, which is related to the shading of the surface of solar receivers. In some locations, building walls and roofs can have very good exposure to incident solar radiation, which makes utilization of solar radiation very effective throughout the year. Figure 11 shows a solar map of the main campus of the Warsaw University of Technology. The figure shows the annual solar irradiation of the individual campus buildings, which enables efficient planning and dimensioning of the solar energy receiver locations. Consequently, it is possible to estimate the technical potential of using solar energy to generate heating and cooling energy and electricity in a given area or district of the city.
It seems quite interesting to use solar radiation energy to generate electricity in some of the unshaded areas of facilities and transport facilities, which account for about 10% of the city’s area. It should be noted that in the current legal and ownership situation, this energy can be mainly used by the landowner.

4.3. Biomass and Biogas
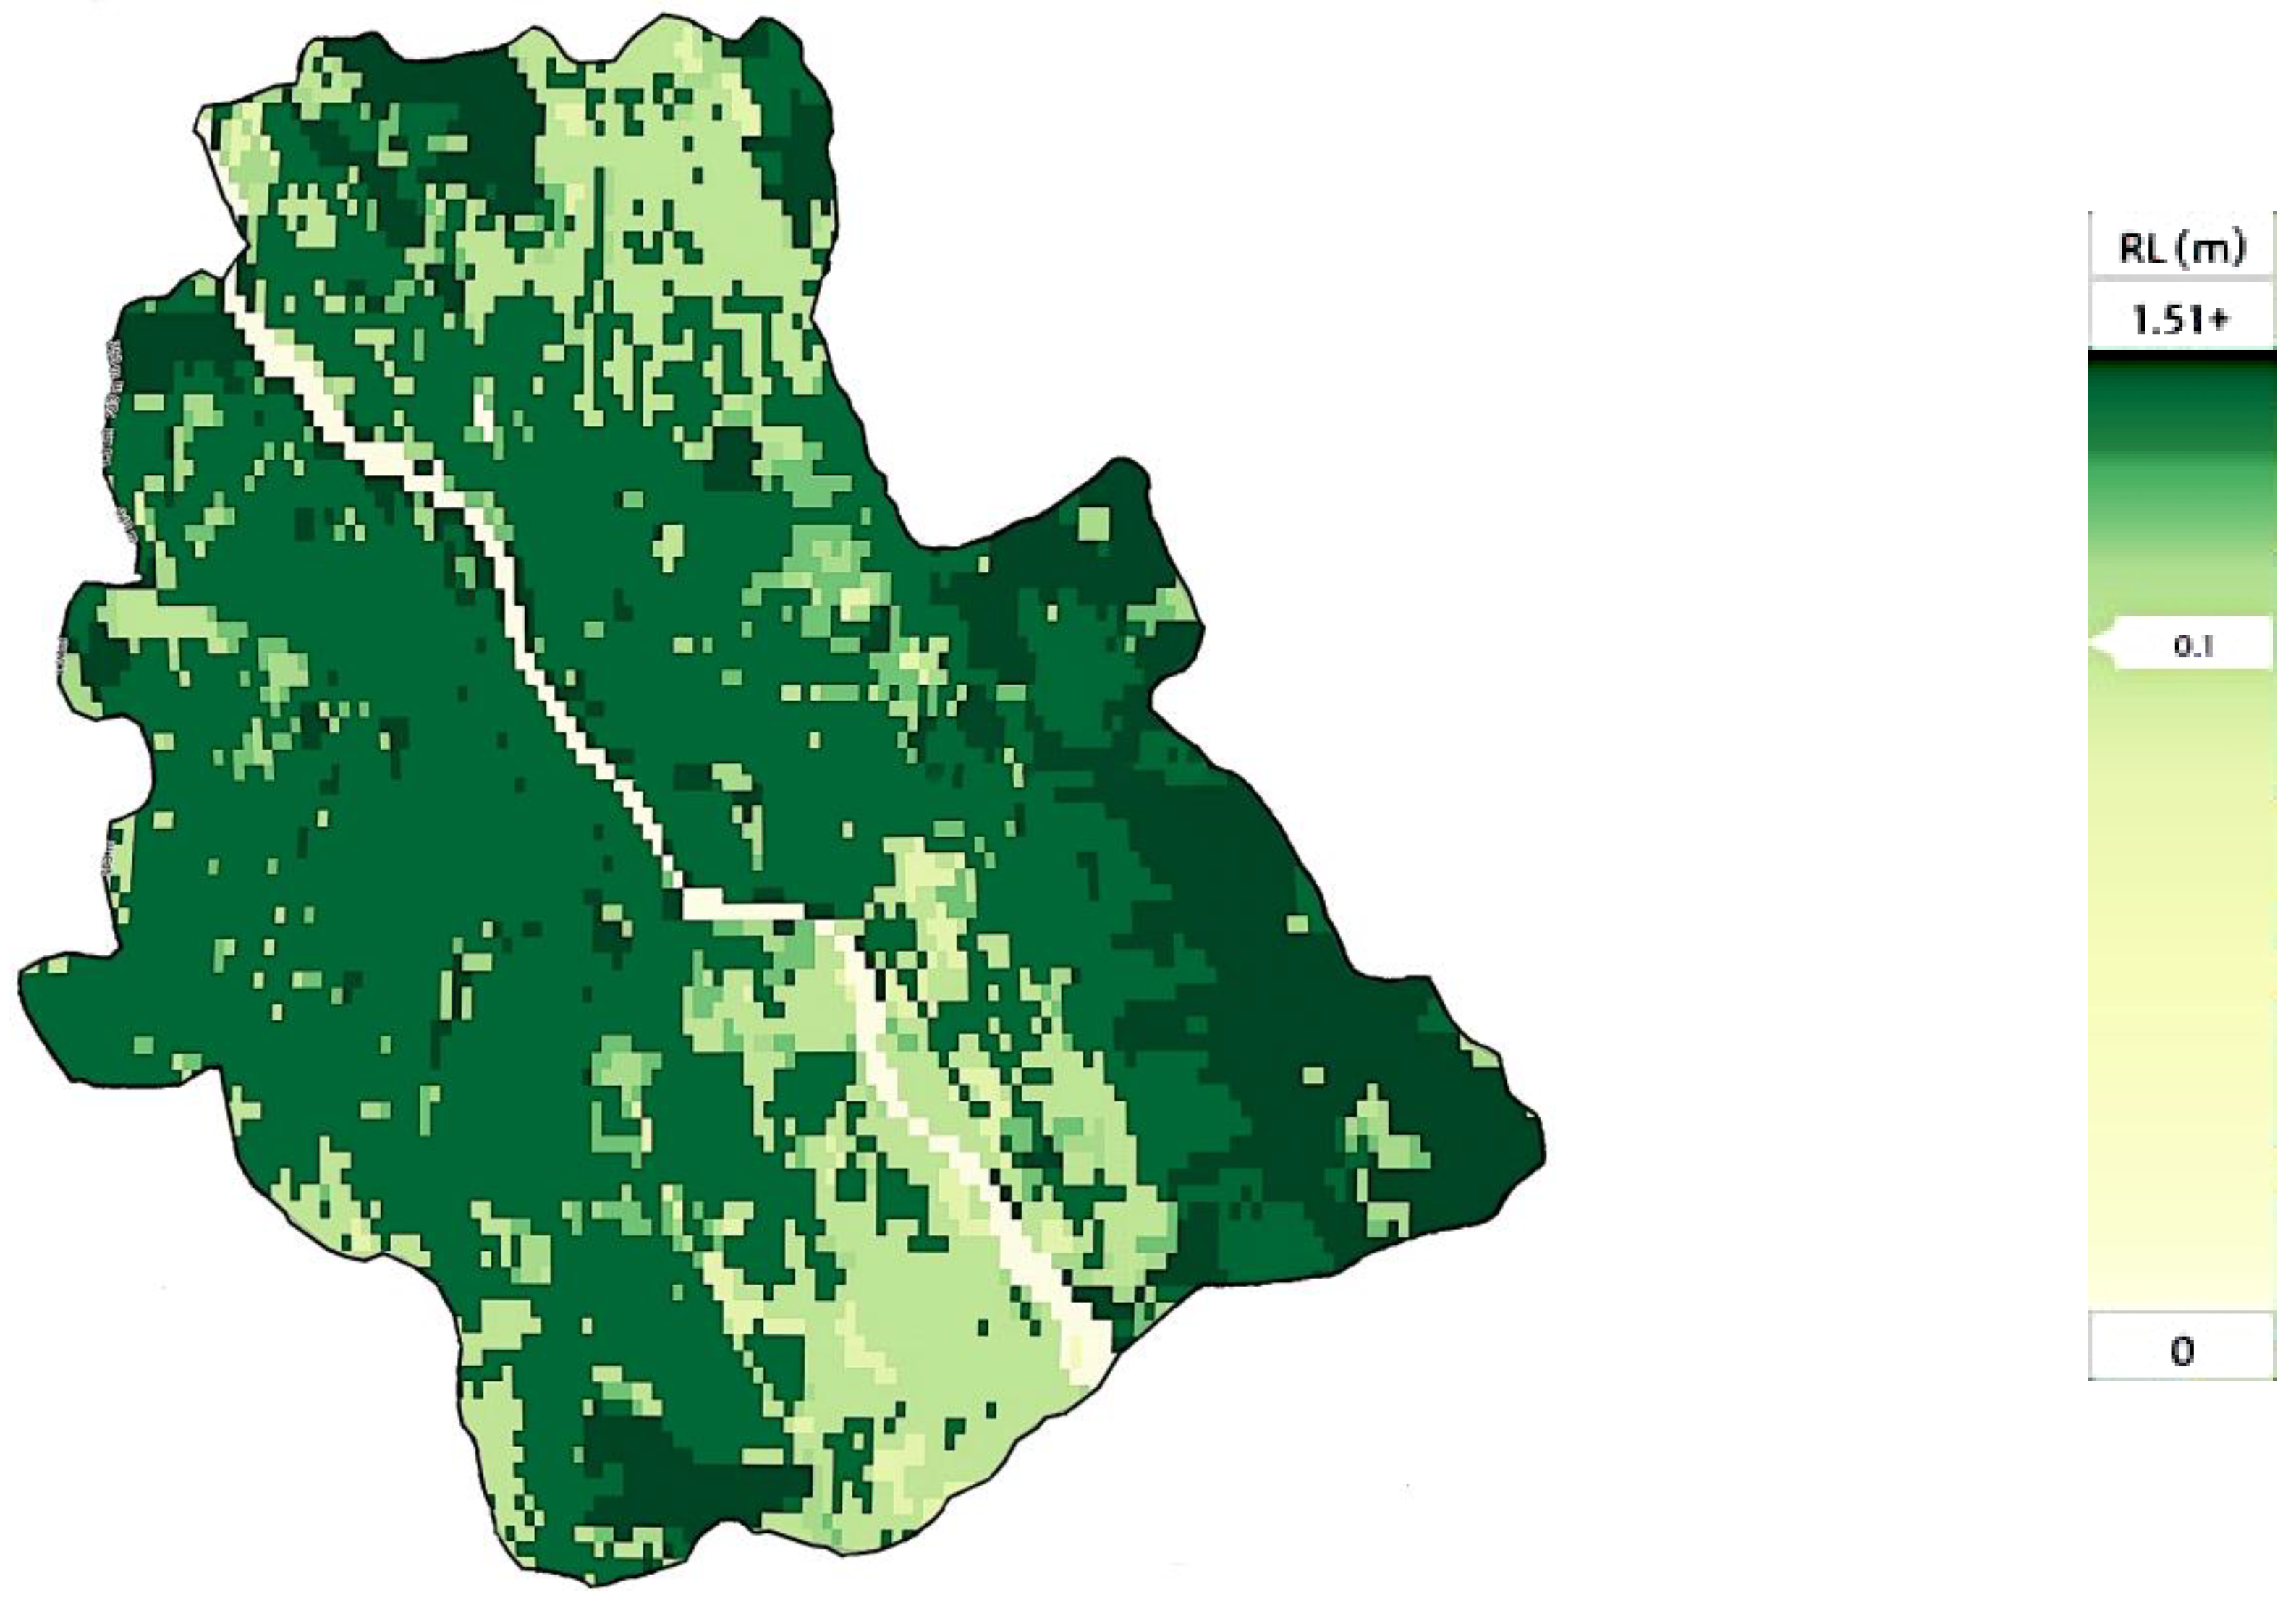
In the year 2019, a total of approximately 668,600 tons of municipal waste were produced, including 610,700 tons from households [26]. This means that a statistical resident of Warsaw generated 342.4 kg of municipal waste, including 271.1 kg of mixed waste. The share of mixed waste in the total mass of municipal waste collected was as high as 71.9%. Collection of biodegradable waste amounted to 27,098 tons and 15,020 tons of paper and cardboard. The calorific value of municipal waste ranges from 7–16 MJ/kg [27].
The production of electricity and heat from biogas from sewage is carried out in the “Czajka” and “Południe” sewage treatment plants [28]. Czajka’s annual heat production is about 40 GWh with similar amounts of electricity. Annual heat production of the second plant is about 5 GWh. Both plants use the heat and energy for their own purposes.
Interestingly, the owner—Municipal Water and Sewerage Company in the capital city of Warsaw S.A.—plans to invest in photovoltaic installations in the near future, for a total production of 6.7 GWh per year [28].
Electricity and heat are also generated from municipal waste in the Municipal Waste Disposal Plant (owner: Municipal Cleaning Enterprise in the Capital City of Warsaw, location: Targówek district). The reconstruction of this plant is planned in the near future [10].
PGNiG Termika’s plans also include a modern municipal waste incineration plant at the Siekierki heat and power plant [29].
What is important is that only the latest technologies will be applied in the new or reconstructed plants [10].
Every city generates a lot of waste. This waste should be recycled, both for the recovery of raw materials and for energy recovery. Each city may, or rather, should, strive to implement a circular economy, which is one of the most important and even basic elements of sustainable development and gives the base for PEDs creation.

4.4. Wind Energy

The possibilities of using wind energy to generate electricity in urban areas are quite limited due to the legal requirements in force, i.e., the location of the wind farm requires appropriate provisions in the local spatial development plans. In the part of the city under conservation protection, the installation of even micro wind farms is practically impossible. Availability of wind energy in the area of the Capital City of Warsaw’s electricity production is relatively low.
One of the important parameters to urban meteorological investigations is an aerodynamic roughness length (RL, Figure 12 [30]). In the centre of the town, that value is equal to 1 m or in some urbanized areas is even equal to 1.5 m, while is most attractive in terms of wind energy utilization in parts where the value is much lower, e.g., in agricultural areas or wastelands along the Vistula River the factor is equal to 0.1 m. The minimum value of this indicator is above the river surface. In this area, the value is 0.0002 m.
In Warsaw, for the 10% of the windiest surface at a height of 10 m above the ground, the average density of the available power is 87 W/m2 with an average air flow velocity of 4.00 m/s [30]. At a height of 50 m, these values are, respectively, 204 W/m2 and 5.63 m/s. At a height of 100 m, these values are, respectively, 299 W/m2 and 6.60 m/s. The best conditions are on the outskirts of the city, in the north and south, and along the Vistula, i.e., where the roughness length (RL) is not greater than 0.1 m, as can be seen on Figure 12.
The northern region (at the top of Figure 12) does not seem to be attractive for the use of wind energy due to the planned housing development.
The most favourable and sparsely inhabited area of about 17.0 km2 (south, where the roughness length is not greater than 0.1 m, at the bottom of Figure 12) at a height of 10 m is characterized by an average wind speed of 4.4 m/s, and an average power density of 117 W/m2. When at a height of 50 m the average wind speed is estimated as 5.7 m/s, and the average power density as 213 W/m2. For the height of 100 m these values are the following: 6.7 m/s and 300 W/m2, respectively. Based on the average power density and the assumed area of land, electricity production can be estimated: at a height of 10 m—63 GWh, at a height of 50 m—105 GWh, and at a height of 100 m—160 GWh.

4.5. Hydropower

Warsaw is located on the Central Masovian Lowland on the Vistula River, with no access to the sea. Although within the city limits the Vistula is 28 km long, the use of hydropower in Warsaw is not taken into account due to inadequate conditions, i.e., low slope of the land and high density of buildings [31]. The use of smaller rivers, streams or existing water channels with low and variable water flow is currently not considered.
It is worth adding that about 40 km to the north of Warsaw there is the Dębe Hydro Power Plant, which was established in the 1960s [32]. The installed capacity of this power plant is 20 MW, and the average annual energy production is about 91 GWh. This power plant directly supplies the Polish power system with energy.

5. Towards Positive Energy Districts in Warsaw and Risks to Achieving This Goal

As shown in the previous section, in Warsaw there is a theoretical potential for the use of renewable energies. It should be noted, however, that the use of renewable energies is a rational solution only if there is a reduction in energy demand for traditional methods, which in this case means reducing the energy demand of existing buildings or erecting new ones in accordance with the latest energy and environmental standards.
In Warsaw, buildings in terms of energy performance are very diverse. In many cases, it is possible to significantly improve their energy balance and reduce energy demand through refurbishment and thermo-modernization. Nevertheless, in the historic part of the city, as well as in densely built-up areas with too much energy demand for heating and ventilation, achieving the “positive energy” standard can be difficult even with the current state of technology.
In Polish climatic conditions, it is difficult to achieve energy self-sufficiency in urbanized areas based on only one type of renewable source because energy needs are too large in relation to the possibility of coverage from monovalent-source renewable systems.
The solar energy is easiest to acquire on non-shaded surfaces, e.g., roofs. South or south-west and south-east facades of buildings can also be used as long as they are not shaded.
Low-temperature geothermal energy cannot directly supply a high-temperature heating network. It may be necessary to create local or neighbourhood networks to distribute heat in a smaller area. Heat pumps will be required to raise the temperature. Later such local systems equipped with heat pumps can be connected, thus competing with the traditional district heating network.
The city of Warsaw “produces” large amounts of municipal waste. Some of them are not recyclable or biodegradable. However, they can be used in modern plants for the combined production of electricity and heat. Therefore, special attention can be put to developing modern landfill gas energy plants. Up until now none of these landfill plants operate in Warsaw or its surroundings.
Large areas of green spaces can also be a source of biomass. However, a traditional combustion procedure should not be applied. It is necessary to use highly effective gasification processes as a preliminary energy treatment of biomass residues.
Potential barriers for implementation of renewable energy technologies and achieving the status of a smart city with some positive energy districts should be identified and mentioned. These are mainly problems with ownership, financing new investments and refurbishment, and legal boundaries. Buildings may be private property, there may be business ownership issues, and buildings may belong to a cooperative, housing community or the city of Warsaw, or even a combination of the previously mentioned. This ownership structure determines the ways and possibilities of financing the retrofitting measures. It should be mentioned that land around buildings usually has a similar ownership structure. This, in turn, can result in problems with the placement of energy systems outside the building, and even applying extra thermal insulation to the building walls (the external size of the building increases). The use of renewable energy, rationalization of the energy efficiency of existing systems, proper energy, water and waste management are an important part of efforts to transform Warsaw into a smart city.

6. Conclusions

Sustainable development, carried out by taking into account the protection of the climate and the natural environment, is de facto a political, economic, technical and social problem even on the scale of the city.
Without the general awareness of the importance of these issues and, on the other hand, social pressure, activities in this area may not be accepted due to the high costs of implementing investments.
Moreover, the development of technology is still important in order to maximize the widely understood effectiveness of technical solutions. It is also important to prepare specialists who carry out comprehensive projects using renewable energy sources and take care of the proper operation and maintenance of existing systems.
Increased outlays for the implementation of the change of the heat and energy supply system require financial support, perhaps on preferential terms or from funds focused on renewable energy.
  • The Capital City of Warsaw supports all activities aimed at reducing the consumption of conventional energy, increasing the use of renewable energy sources and reducing carbon dioxide emissions.
  • Increasingly stringent requirements in the field of thermal and energy protection of buildings reduce both the demand for heating and ventilation and the required design power of heat sources.
  • Lowering the required design heating load per area below 60 W/m2 (indicative value) allows the use of low-temperature surface (e.g., floor) heating, which means that the heat source can be a heat pump using, for example, low-temperature geothermal heat available in Warsaw.
  • Achieving a positive energy standard by parts of the city with buildings with unsatisfactory energy performance may be economically unprofitable with the current technical possibilities.
  • Due to the diversified ownership structure of land, buildings and accompanying infrastructure, as well as in view of further city expansion plans, the easiest way to implement the idea of energy-positive districts is to modernize the relatively recently established housing estates and design new ones with the “obligatory” use of renewable energy sources.
  • The use of renewable energy sources instead of conventional fuels means a significant reduction in carbon dioxide emissions and environmental protection.
  • Changing the existing electricity and heat supply system for urbanized urban areas in Polish conditions requires comprehensive modernization of practically the entire city infrastructure.
Summarizing, it is very difficult to modernize large energy systems, which for many years have been the only ones supplying energy to various types of energy users in the city. However, it does not mean that nothing can be done. Warsaw, like many world cities, is expanding to new areas and this causes opportunity for development of new local energy systems based on renewables. Such systems can assure self-energy generation and consumption, giving energy security for new districts.
Moreover, new districts can share their energy with other neighbourhoods. As a consequence, the new districts can become Positive Energy Districts which will increasingly interfere with the central energy systems of the city centre. New PEDs will absorb central areas step by step, replacing ineffective central energy systems with new ones based on renewable energy, giving energy independence to the whole city.
It should be underlined that the way to achieve complete energy independence for the city is very complicated and rather long, which is what the authors have tried to present in this paper. If thermal energy (a central district heating system) and electricity (a central power grid) are available everywhere in the city, why does the energy sector, developers, communities and inhabitants have to look for new “fuels” and innovative energy conversion technologies, mainly those based on renewables? This is a question and idea which should be answered by the municipalities as often as possible. Of course, academic people and scientists and local “green” NGOs should help and support the urgent need of the development of local efficient energy generation systems based on locally available energy sources, such as renewables. They should foster the idea of sharing energy in a modern way, which gives the basis for creating more Positive Energy Districts in the city.

Author Contributions

Conceptualization, D.C. and H.J.; methodology, D.C. and H.J.; validation, D.C. and H.J.; formal analysis, D.C. and H.J.; investigation, D.C. and H.J.; resources, D.C. and H.J.; data curation, D.C. and H.J.; writing—original draft preparation, D.C. and H.J.; writing—review and editing, D.C. and H.J.; visualization, H.J.; supervision, D.C.; project administration, H.J.; funding acquisition, D.C. All authors have read and agreed to the published version of the manuscript.

Funding

The publishing procedure is funding by the EERA Smart Cities JP.

Institutional Review Board Statement

Not applicable.

Informed Consent Statement

Not applicable.

Data Availability Statement

The study did not report any data.

Conflicts of Interest

The authors declare no conflict of interest.

References

  1. Scott, R. The History of the International Energy Agency—The first Twenty Years; OECD Publishing: Paris, France, 1994. [Google Scholar]
  2. Directive 2002/91/EC of the European Parliament and of the Council of 16 December 2002 on the energy performance of buildings. Off. J. Eur. Commun. Available online: http://data.europa.eu/eli/dir/2002/91/oj (accessed on 10 September 2021). 2003, L 001, 04/01/2003 65–71.
  3. Regulation of the Minister of Infrastructure of 12 April 2002 on Technical Conditions to be Met by Buildings and Their Location. J. Laws. Available online: https://www.global-regulation.com/translation/poland/3353940/regulation-of-the-minister-of-infrastructure-of-12-april-2002-on-technical-conditions%252c-which-should-correspond-to-the-buildings-and-their-location.html (accessed on 10 September 2021). 2002 No.75, item. 690 (In Polish).
  4. Ministry of Climate and Environment. Poland’s Energy Policy until 2040. Available online: https://www.dziennikustaw.gov.pl/MP/2021/264 (accessed on 10 September 2021). Official Journal of the Republic of Poland Monitor Polski 2021, item 264. (In Polish)
  5. Regulation of the Minister of Infrastructure and Development of 27 February 2015 on the methodology for determining the energy performance of a building or part of a building and energy performance certificates. J. Laws. Available online: https://www.iea.org/policies/12240-regulation-of-the-minister-of-infrastructure-and-development-of-february-27-2015-on-the-methodology-for-determining-the-energy-performance-of-a-building-or-part-of-a-building-and-energy-performance-certificates (accessed on 10 September 2021). 2015, No. 2019, item 1065, consolidated text as amended. (In Polish).
  6. The City of Warsaw. Infrastructure Office: Action Plan for Sustainable Energy Consumption for Warsaw by 2020; Infrastructure Department of The City of Warsaw: Warszawa, Poland, 2013. [Google Scholar]
  7. Council of the Capital City of Warsaw. Resolution No. LIX/1534/2017of the Warsaw City Council of 14 December 2017; Housing Policy—Housing2030; Warsaw City Council: Warsaw, Poland, 2017. [Google Scholar]
  8. City of Warsaw. A Map of Renewable Energy Sources (RES)—A Map of the Sun Exposure, Low Temperature Geothermal Energy (Heat Pumps) and Range of the Heat within the Network. Available online: http://mapa.um.warszawa.pl/mapaApp1/mapa?service=mapa_oze&L=en (accessed on 19 June 2021).
  9. Council of the Capital City of Warsaw. Resolutions of the Council of the Capital City of Warsaw No. XXXV/1074/2020. In Assumptions for the Heat, Electricity and Gas Fuel Supply Plan for the Capital City of Warsaw; Warsaw City Council: Warsaw, Poland, 2020. (In Polish) [Google Scholar]
  10. Public Information Bulletin of the Capital City of Warsaw. Available online: https://bip.warszawa.pl/English/default.htm (accessed on 30 June 2021).
  11. Council of the Capital City of Warsaw. Strategy for Adaptation to Climate Change for the City of Warsaw up to 2030 with a Perspective to 2050. In City Adaptation Plan; Project LIFE_ADAPTCITY_PL, Institute for Sustainable Development: Warsaw, Poland, 2019; Available online: http://adaptcity.pl/wp-content/uploads/2019/11/strategia_2030-ENG.pdf (accessed on 10 September 2021).
  12. Low-Emission Economy Plan for the Capital City of WARSAW. Available online: http://infrastruktura.um.warszawa.pl/sites/infrastruktura.um.warszawa.pl/files/dokumenty/plan_gospodarki_niskoemisyjnej_dla_m.st_._warszawy.pdf (accessed on 30 June 2021).
  13. History of Warsaw. Available online: https://en.wikipedia.org/wiki/History_of_Warsaw (accessed on 20 June 2021).
  14. Statistics Poland, Area and Population in the Territorial Profile in 2020. Available online: https://stat.gov.pl/en/topics/population/population/area-and-population-in-the-territorial-profile-in-2020,4,14.html (accessed on 19 June 2021).
  15. Administrative Division of Warsaw into Districts. Available online: https://warszawa.wikia.org/wiki/Dzielnice?file=Warzawa_podzial_2002.png (accessed on 20 June 2021).
  16. Statistical Office in Warszawa, Statistical Review of Warsaw—1st Quarter 2021. Available online: https://warszawa.stat.gov.pl/en/communiqus-and-announcements/communiqus-and-announcements/other/statistical-review-of-warsaw-1st-quarter-2021,1,30.html (accessed on 21 June 2021).
  17. Mazovian Regional Research Center. Statistical Office in Warsaw. Ranking of Warsaw Districts in Terms of the Attractiveness of Living Conditions. Available online: https://warszawa.stat.gov.pl/files/gfx/warszawa/en/defaultaktualnosci/810/2/1/1/ranking_dzielnic_warszawy_pod_wzgledem_atrakcyjnosci_warunkow_zycia_ang.pdf (accessed on 12 July 2021).
  18. Council of the Capital City of Warsaw. Study of the conditions and directions of spatial development in the capital city of Warsaw. In Annex to Resolution No. LXII/1667/2018 of the Council of the Capital City of Warsaw from 1 March 2018; Council of the Capital City of Warsaw: Warsaw, Poland, 2018. (In Polish) [Google Scholar]
  19. Ministry of Infrastructure and Development: National Plan to Increase the Number of Buildings with Low Energy Consumption. Monitor Polski 2015, item 614; Official Journal of the Republic of Poland: Warsaw, Poland, 2015. (In Polish)
  20. National Energy Conservation Agency S.A. (NAPE). Polish Building Typology—TABULA; Scientific Report; Narodowa Agencja Poszanowania Energii SA: Warsaw, Poland, 2012. [Google Scholar]
  21. Żerań CHP Plant. Available online: https://termika.pgnig.pl/elektrocieplownia-zeran (accessed on 12 July 2021).
  22. Chwieduk, D.; Bujalski, W.; Chwieduk, B. Possibilities of Transition from Centralized Energy Systems to Distributed Energy Sources in Large Polish Cities. Energies 2020, 13, 6007. [Google Scholar] [CrossRef]
  23. Socha, M.; Sadurski, A.; Skrzypczyk, L. Possibilities of geothermal energy utilisation in the Warsaw urban area on the background of cost analysis. Prz. Geol. 2016, 64, 7. [Google Scholar]
  24. Szewczyk, J. Geophysical and hydrogeological aspects of utilization of thermal energy in Poland. Prz. Geol. 2010, 58, 7. (In Polish) [Google Scholar]
  25. Chwieduk, D. Solar Energy Use for Thermal Application in Poland. Polish J. Environ. Stud. 2010, 19, 473–478. [Google Scholar]
  26. Statistics Poland. Local Data Bank. Available online: https://bdl.stat.gov.pl/BDL/start (accessed on 10 August 2021). (In Polish)
  27. Wielgosiński, G. Thermal Waste Treatment; Nowa Energia Publishing House: Racibórz, Poland, 2020. (In Polish) [Google Scholar]
  28. Zero Waste—How to Minimize Waste Production. Available online: http://www.um.warszawa.pl/aktualnosci/zero-waste-jak-maksymalne-zmniejszy-produkcj-odpad-w?page=0,1 (accessed on 30 June 2021).
  29. PGNiG Termika’s Strategy for 2015–2022. Available online: https://termika.pgnig.pl/sites/default/files/2016-07/Strategia%20PGNiG%20TERMIKA%20na%20lata%202015%20-%202022.PDF (accessed on 30 June 2021).
  30. Global Wind Atlas. Available online: https://globalwindatlas.info/ (accessed on 10 August 2021).
  31. Warsaw. Available online: https://en.wikipedia.org/wiki/Warsaw (accessed on 10 August 2021).
  32. Dębe Hydroelectric Power Plant. Available online: https://pgeeo.pl/Nasze-obiekty/Elektrownie-wodne/Debe (accessed on 10 August 2021).
Figure 1. Administrative districts in Warsaw [15].
Energies 14 05984 g001
Figure 2. Final energy consumption structure in the year 2014 [9].
Energies 14 05984 g002
Figure 3. Maximum annual primary non-renewable energy indices for heating, ventilation and hot water preparation [3].
Energies 14 05984 g003
Figure 4. Electric power in Warsaw, [MW] [9].
Energies 14 05984 g004
Figure 5. Electricity generation in Warsaw, [GWh] [9].
Energies 14 05984 g005
Figure 6. Thermal installed capacity of energy plants in Warsaw, [MW] [9].
Energies 14 05984 g006
Figure 7. Heat supplied to the end users from the district heating network and renewable energy systems in Warsaw, [GWh] [9].
Energies 14 05984 g007
Figure 8. Coverage area of the district heating [8].
Energies 14 05984 g008
Figure 9. Low-temperature geothermal resources in Warsaw [8].
Energies 14 05984 g009
Figure 10. Distribution of averaged total monthly solar irradiation [kWh/m2] on horizontal surface in Warsaw [25].
Energies 14 05984 g010
Figure 11. Solar map (Warsaw University of Technology, Main Campus as an example) [8].
Energies 14 05984 g011
Figure 12. Aerodynamic roughness length of the Warsaw’s area [30].
Energies 14 05984 g012
Table 1. Area and population, total and by districts in the year 2020 as of 31 December [16].
DistrictsArea [m2]Population [People]
Bemowo25,000,000125,270
Białołęka73,000,000132,281
Bielany32,300,000130,848
Mokotów35,400,000217,424
Ochota9,700,00082,018
Praga-Południe22,400,000180,066
Praga-Północ11,400,00063,442
Rembertów19,300,00024,679
Śródmieście15,600,000111,338
Targówek24,200,000124,742
Ursus9,400,00062,399
Ursynów43,800,000151,288
Wawer79,700,00079,078
Wesoła22,900,00025,926
Wilanów36,700,00043,423
Włochy28,600,00044,343
Wola19,300,000142,694
Żoliborz8,500,0052,907
Warsaw: TOTAL517,200,0001,794,166
Table 2. Age structure of housing stock in Warsaw and energy consumption indices [9,19,20].
Construction PeriodBuildingsFinal Energy Index
[kWh/(m2 a)]
Primary Energy Index
[kWh/(m2 a)]
Before 191812,200>300>350
1918–1944260–300300–350
1945–197019,826220–260250–300
1971–19785691190–220210–250
1979–19887040140–190160–210
1989–200215,974125–160140–180
2003–2007646490–120100–150
2008–2011404390–120100–150
TOTAL71,238
Table 3. Reduction potential of the energy demand in houses [20].
Construction PeriodSingle Family HousesTerraced HousesMultifamily Houses
StandardDeepStandardDeepStandardDeep
up to 194563.2%72.7%55.7%71.4%57.8%71.9%
1945–196661.8%72.2%30.8%53.8%52.7%64.9%
1967–198553.4%62.8%18.2%47.7%51.6%64.4%
1986–199241.9%50.0%21.1%42.1%36.5%53.8%
1993–200234.4%43.8%21.9%39.4%26.3%46.9%
2003–200825.7%35.7%21.4%35.7%21.4%39.3%
after 200829.1%38.3%22.2%34.8%21.4%39.3%
Publisher’s Note: MDPI stays neutral with regard to jurisdictional claims in published maps and institutional affiliations.

