Perspectives and Problems of Using Renewable Energy Sources and Implementation of Local “Green” Initiatives: A Regional Assessment

 ,
,  ,
,  , and
, and
Abstract
1. Introduction
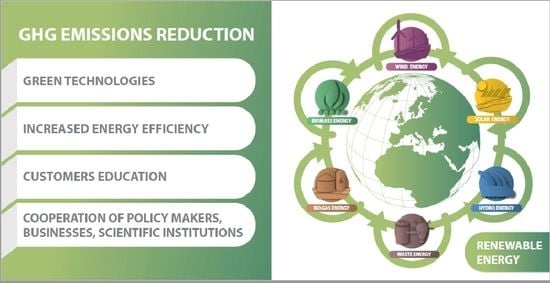
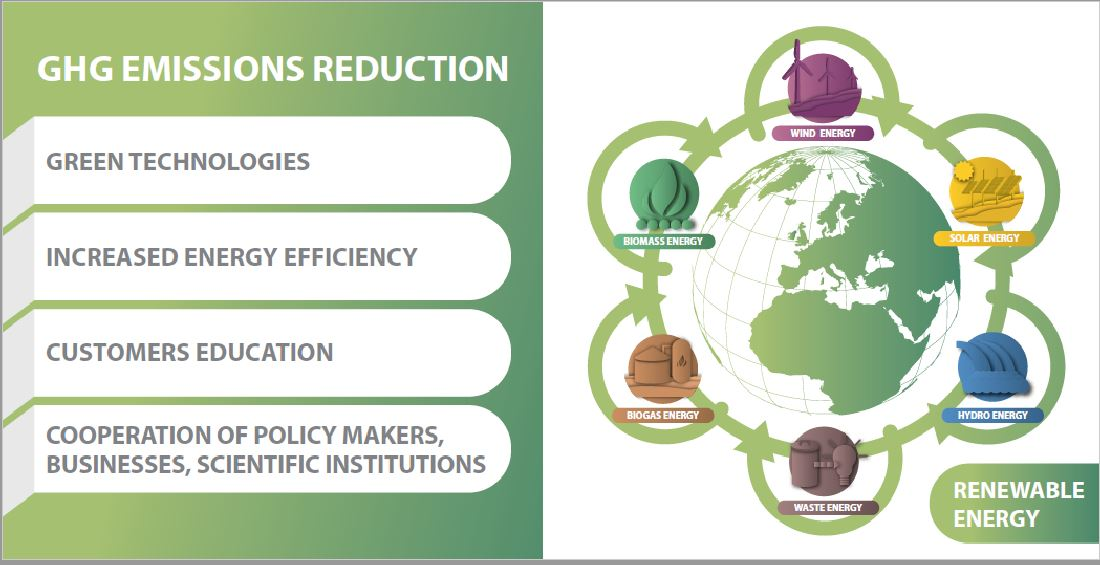
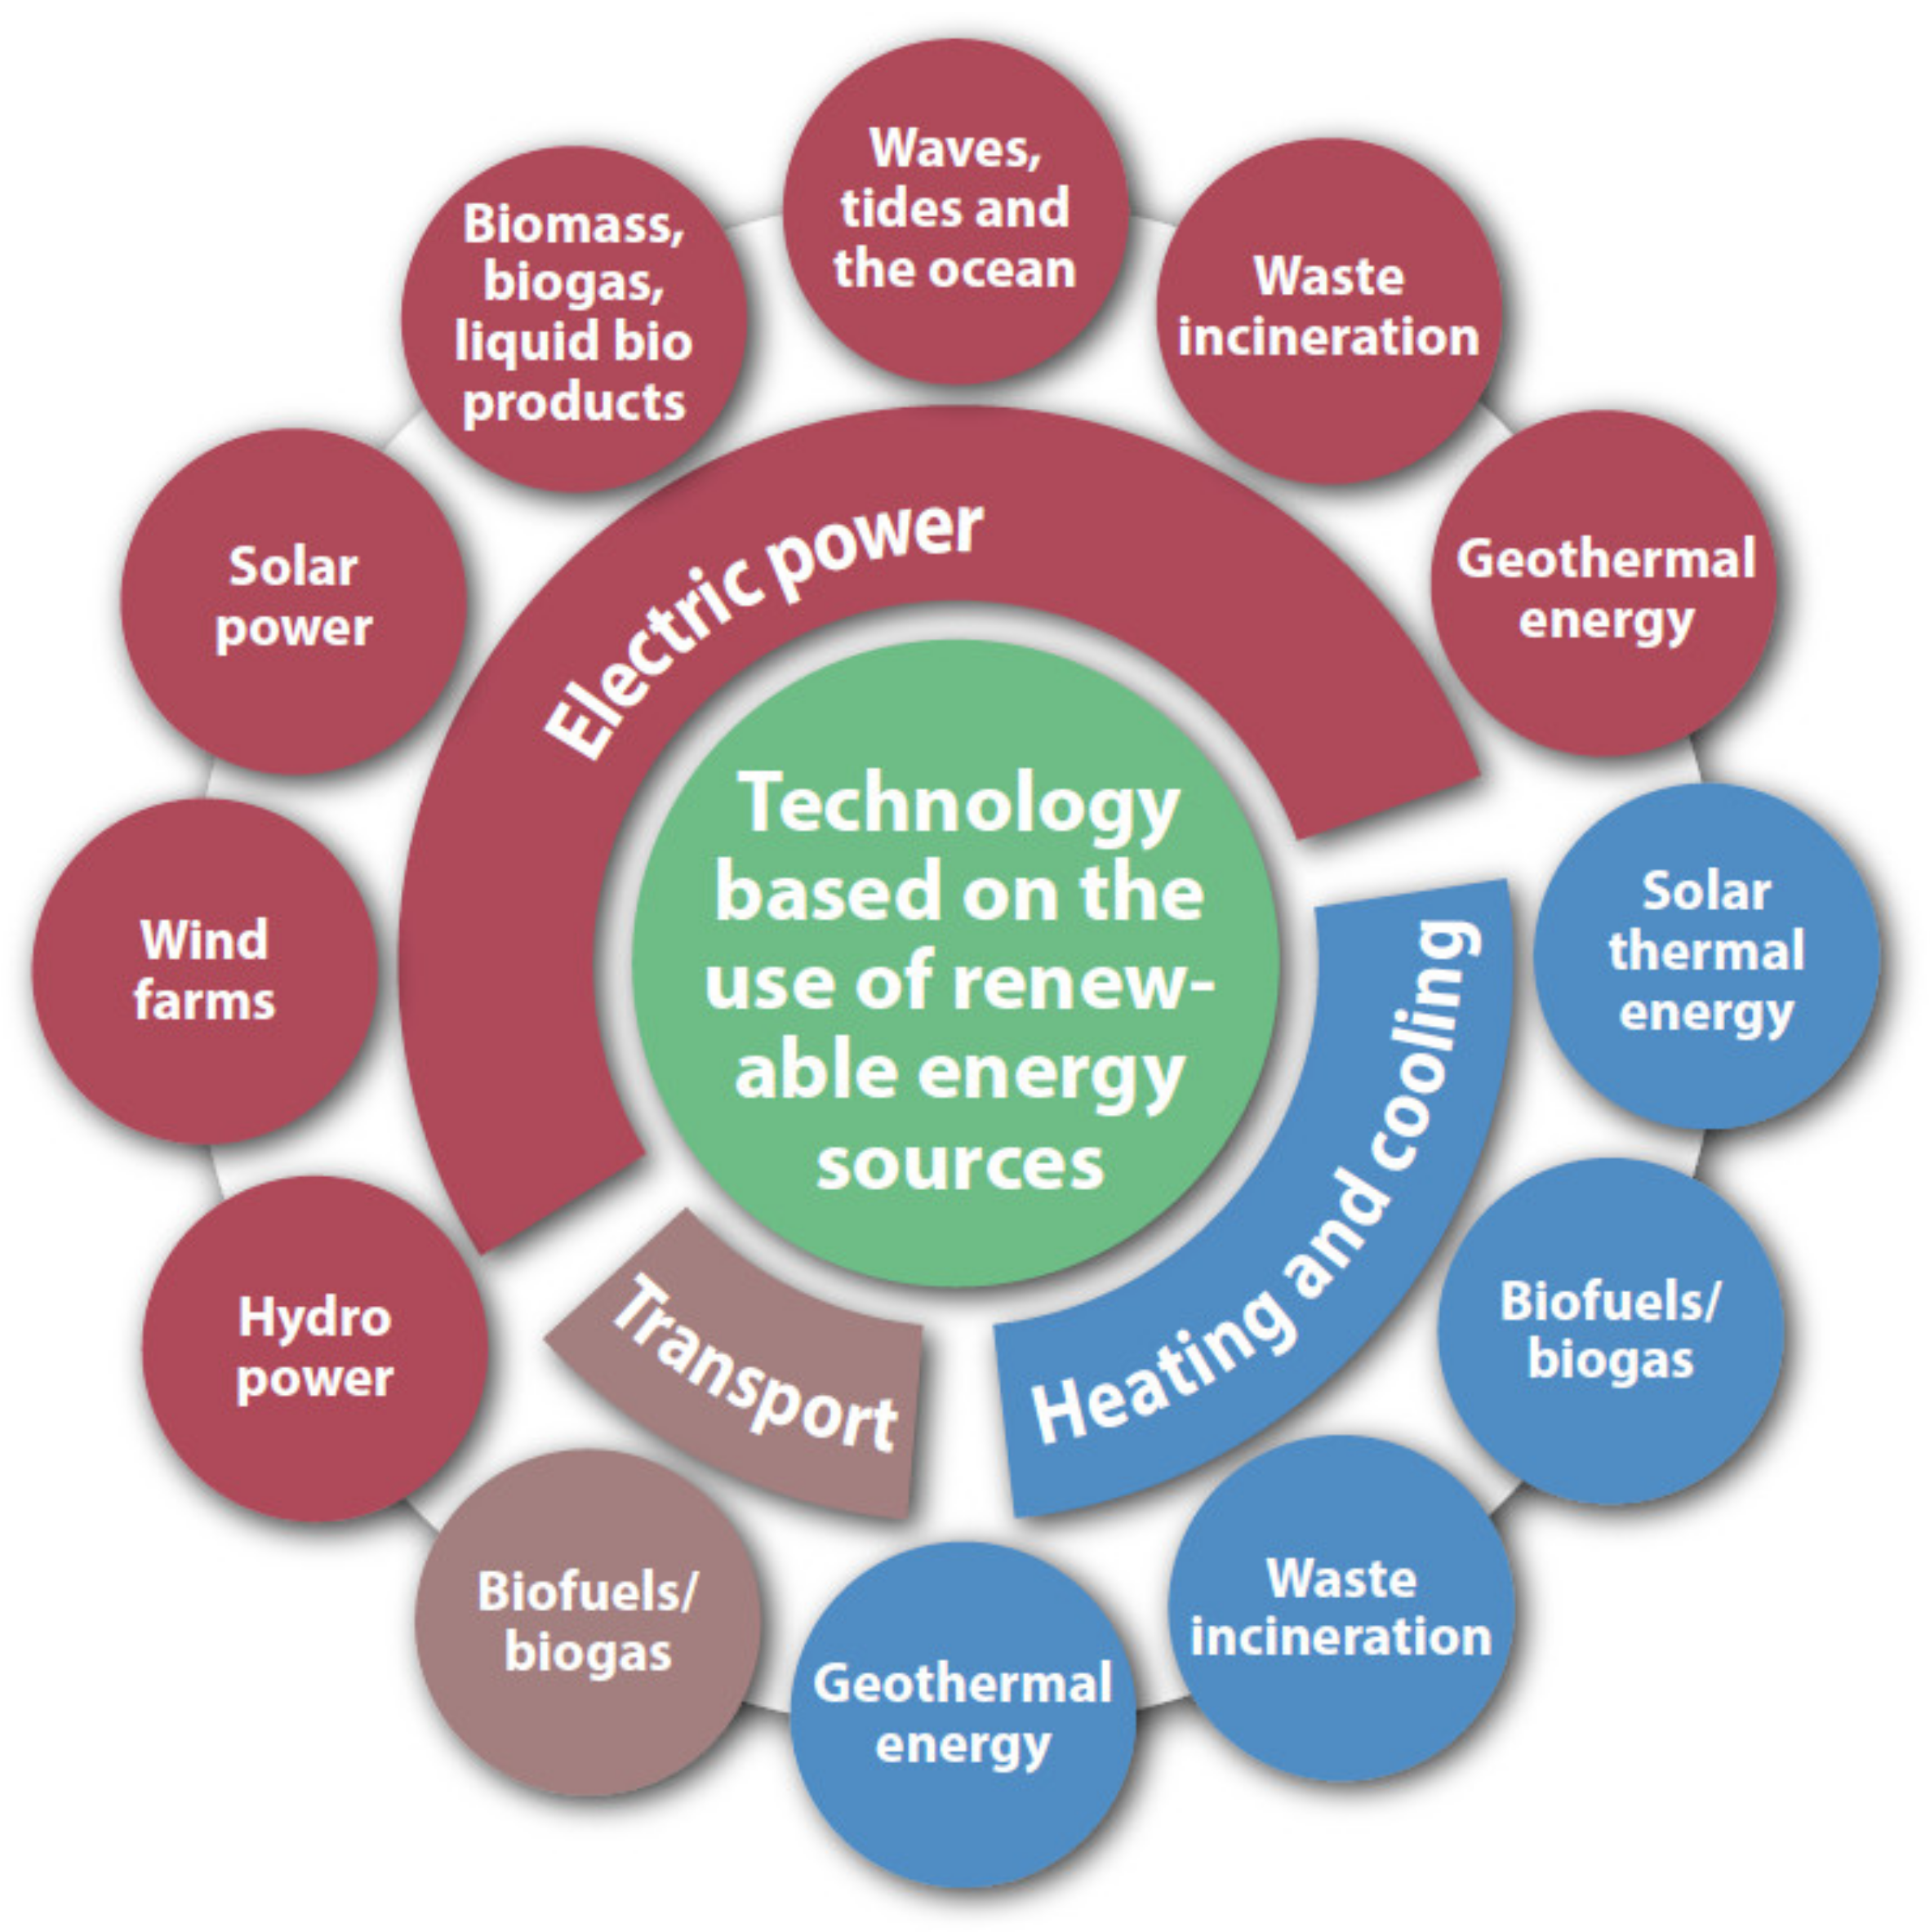
2. Renewable Energy
2.1. Wind Energy
2.2. Solar Energy
2.3. Biomass Energy
2.4. Geothermal Energy
2.5. Hydropower Energy
2.6. Hydrogen Energy
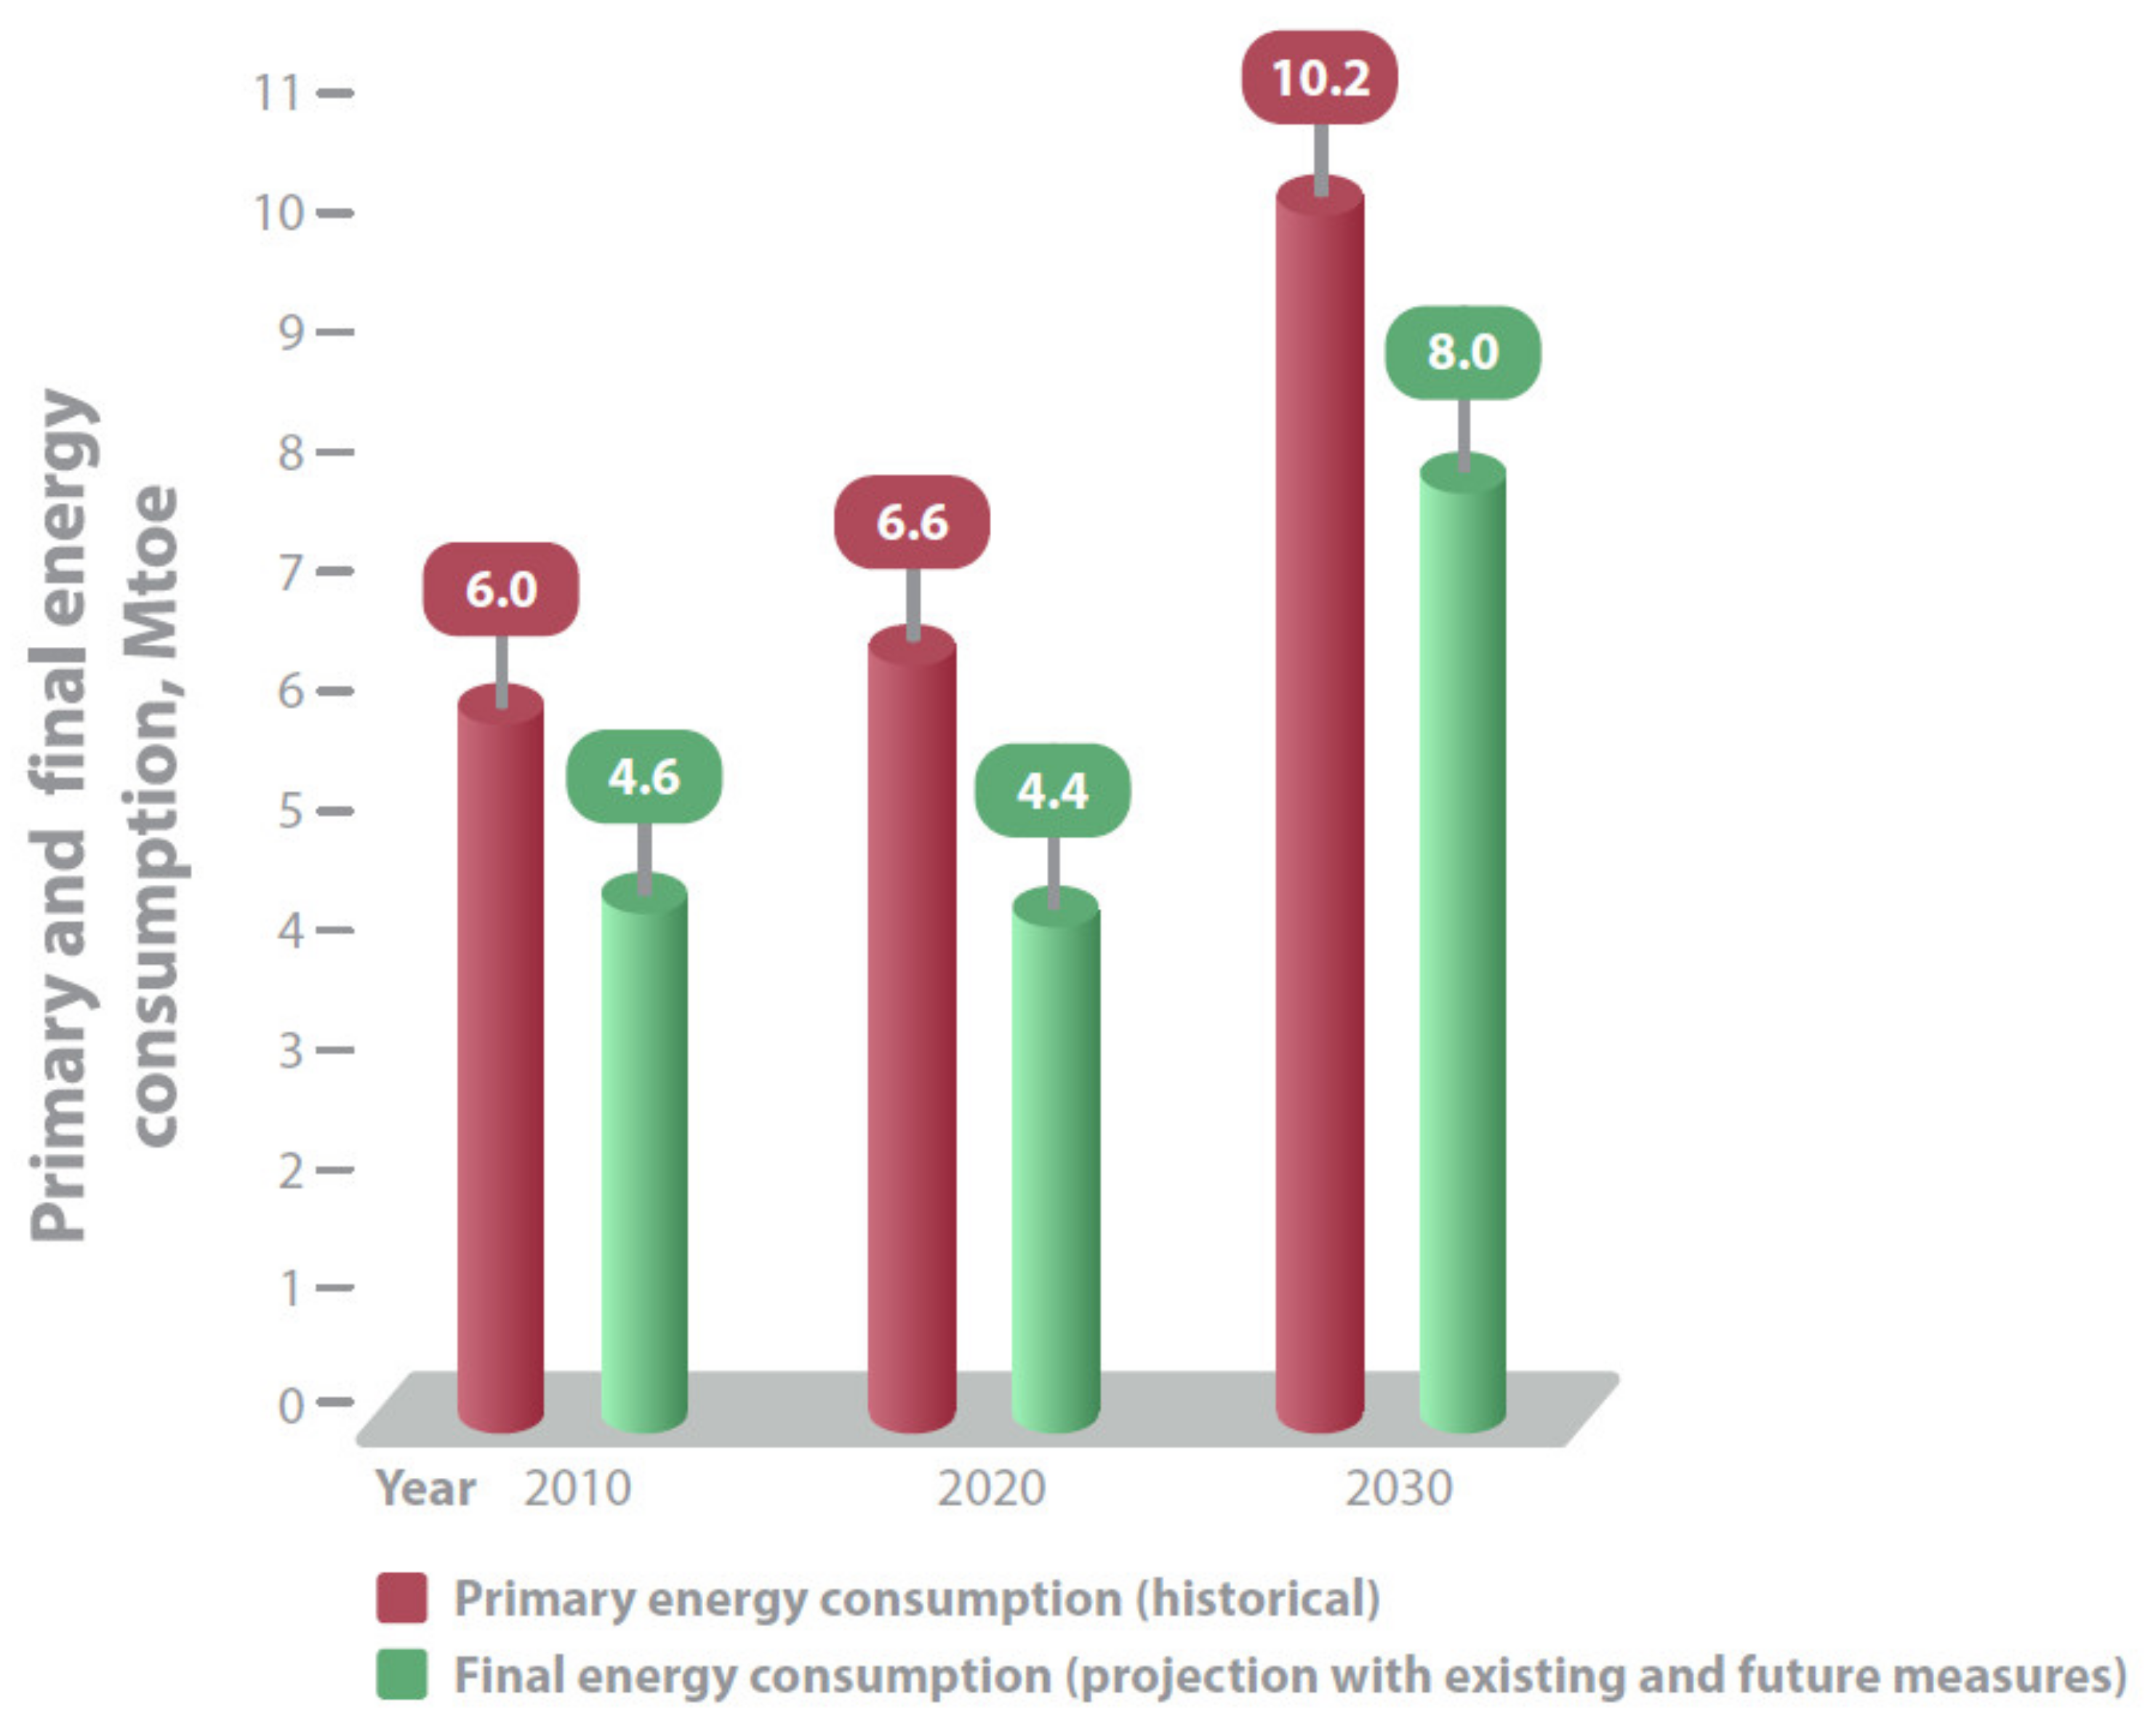
3. Energy Efficiency
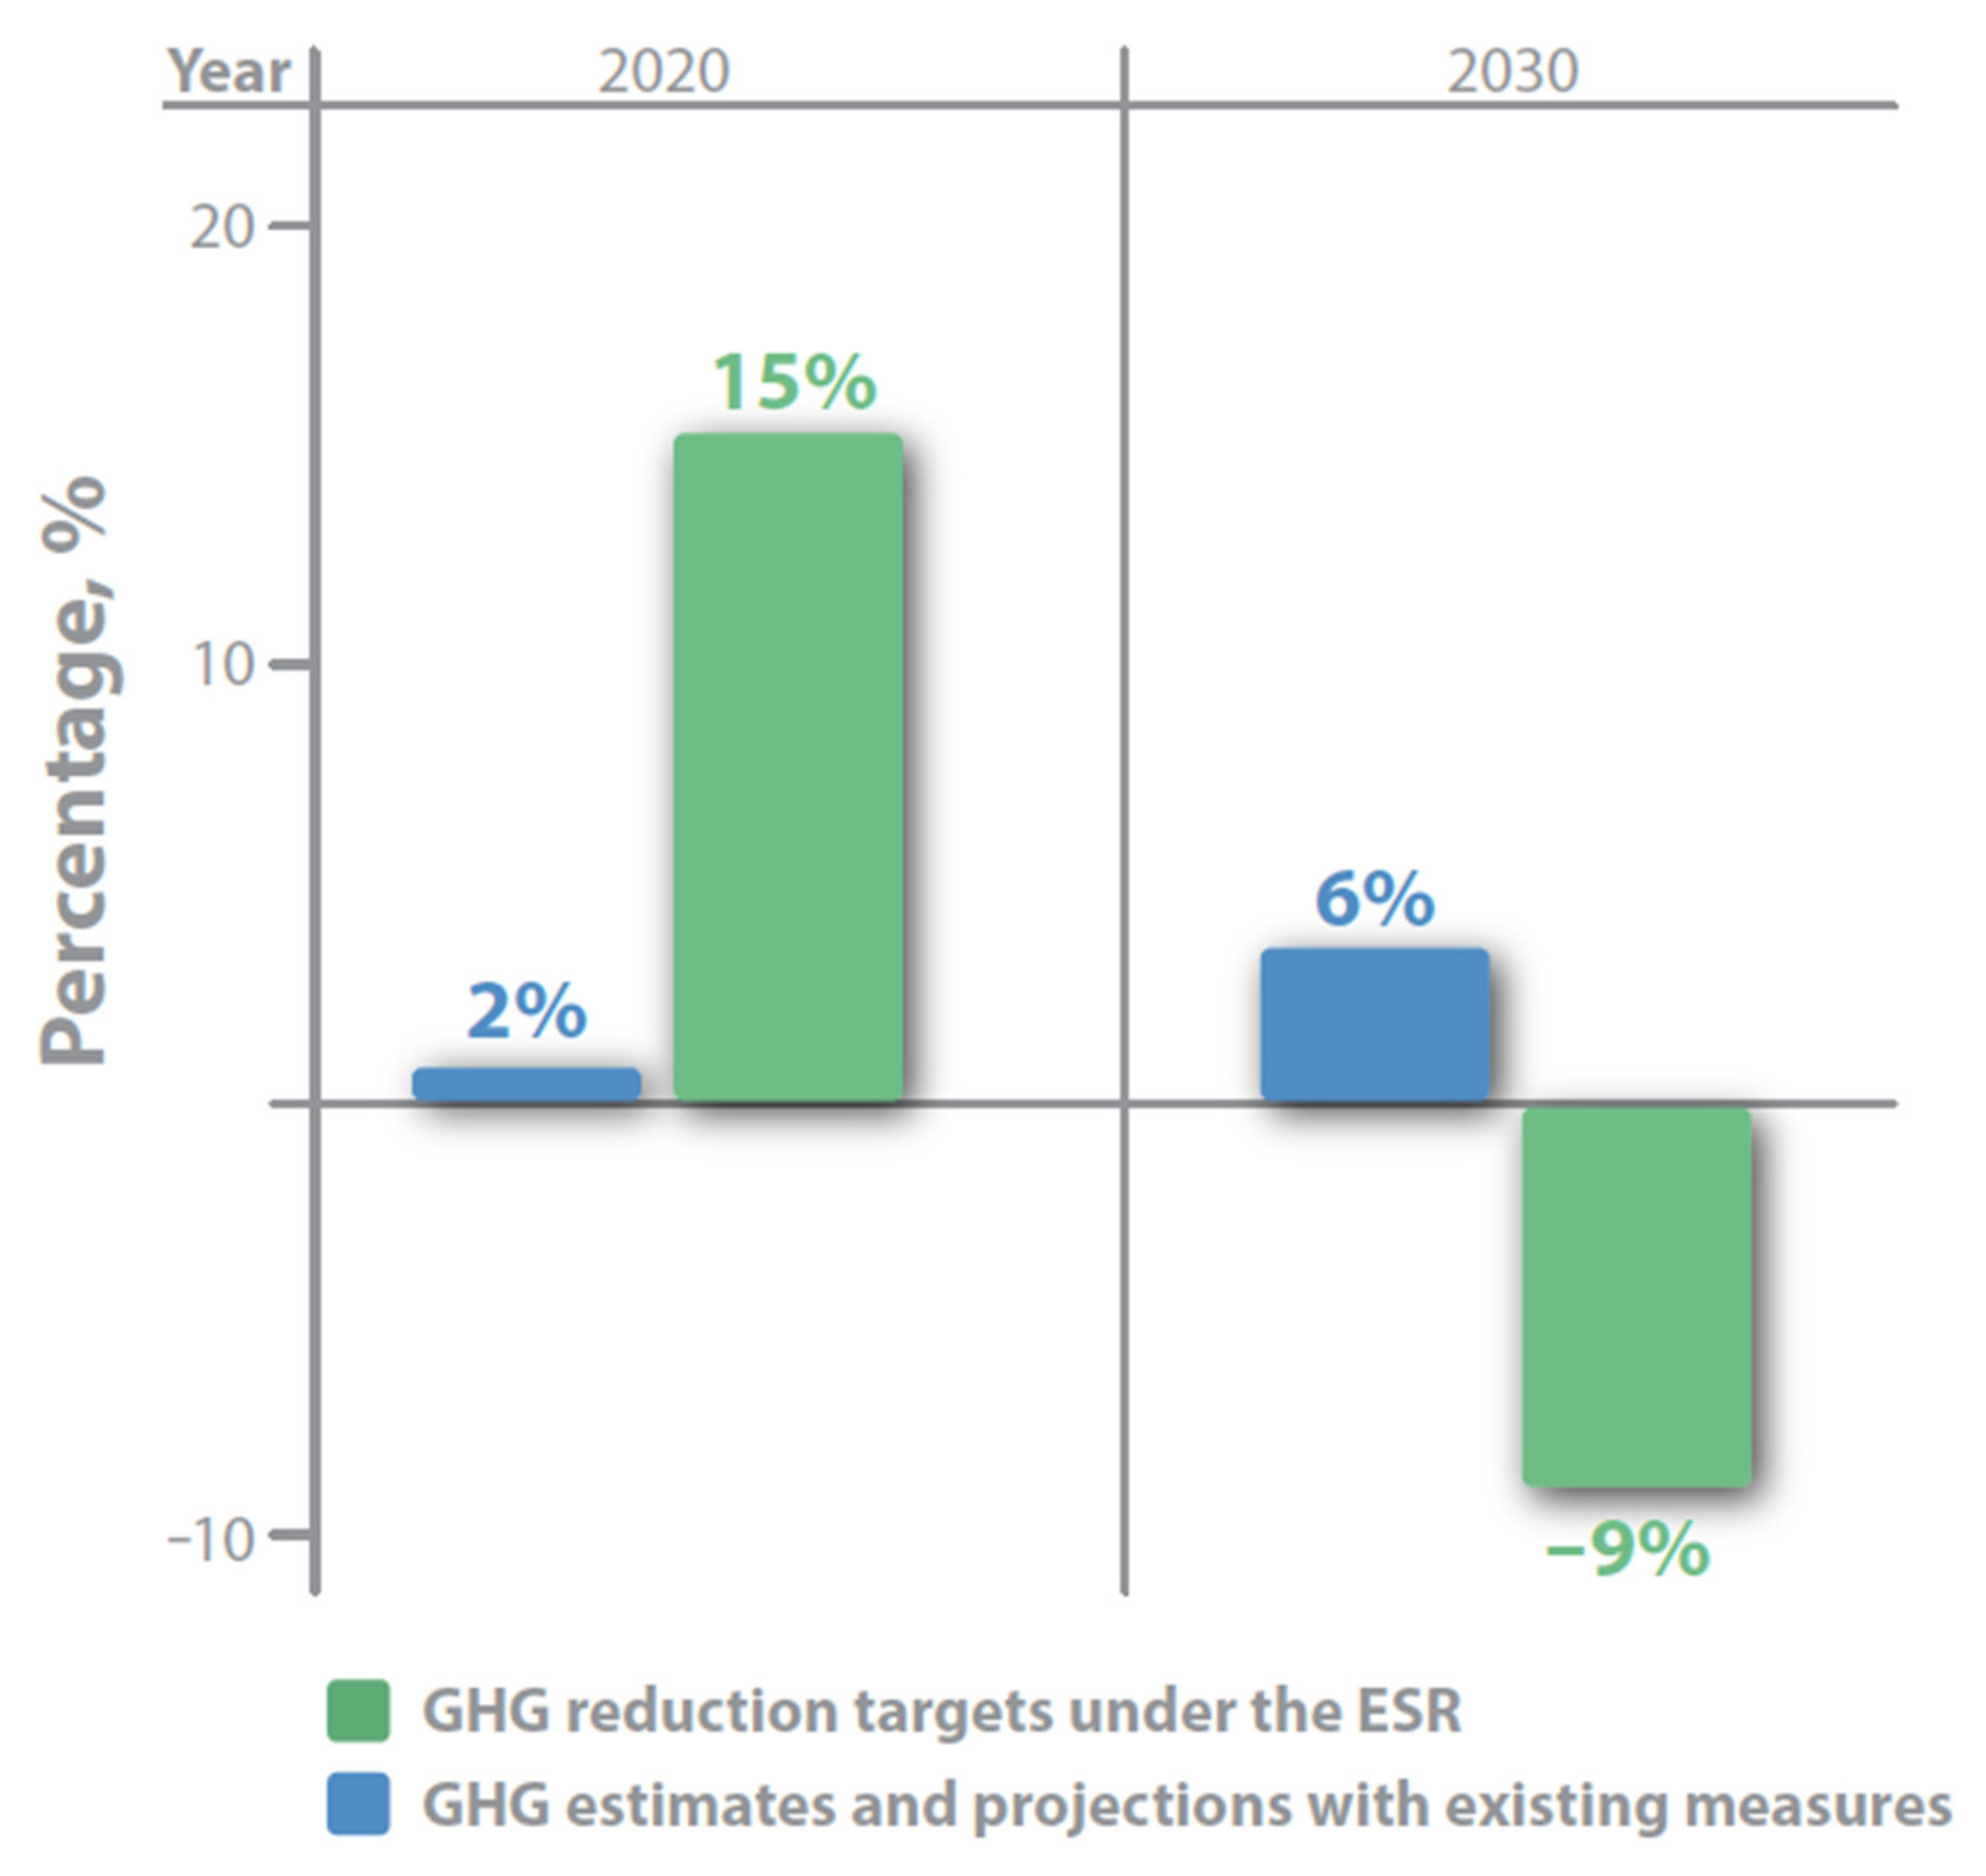
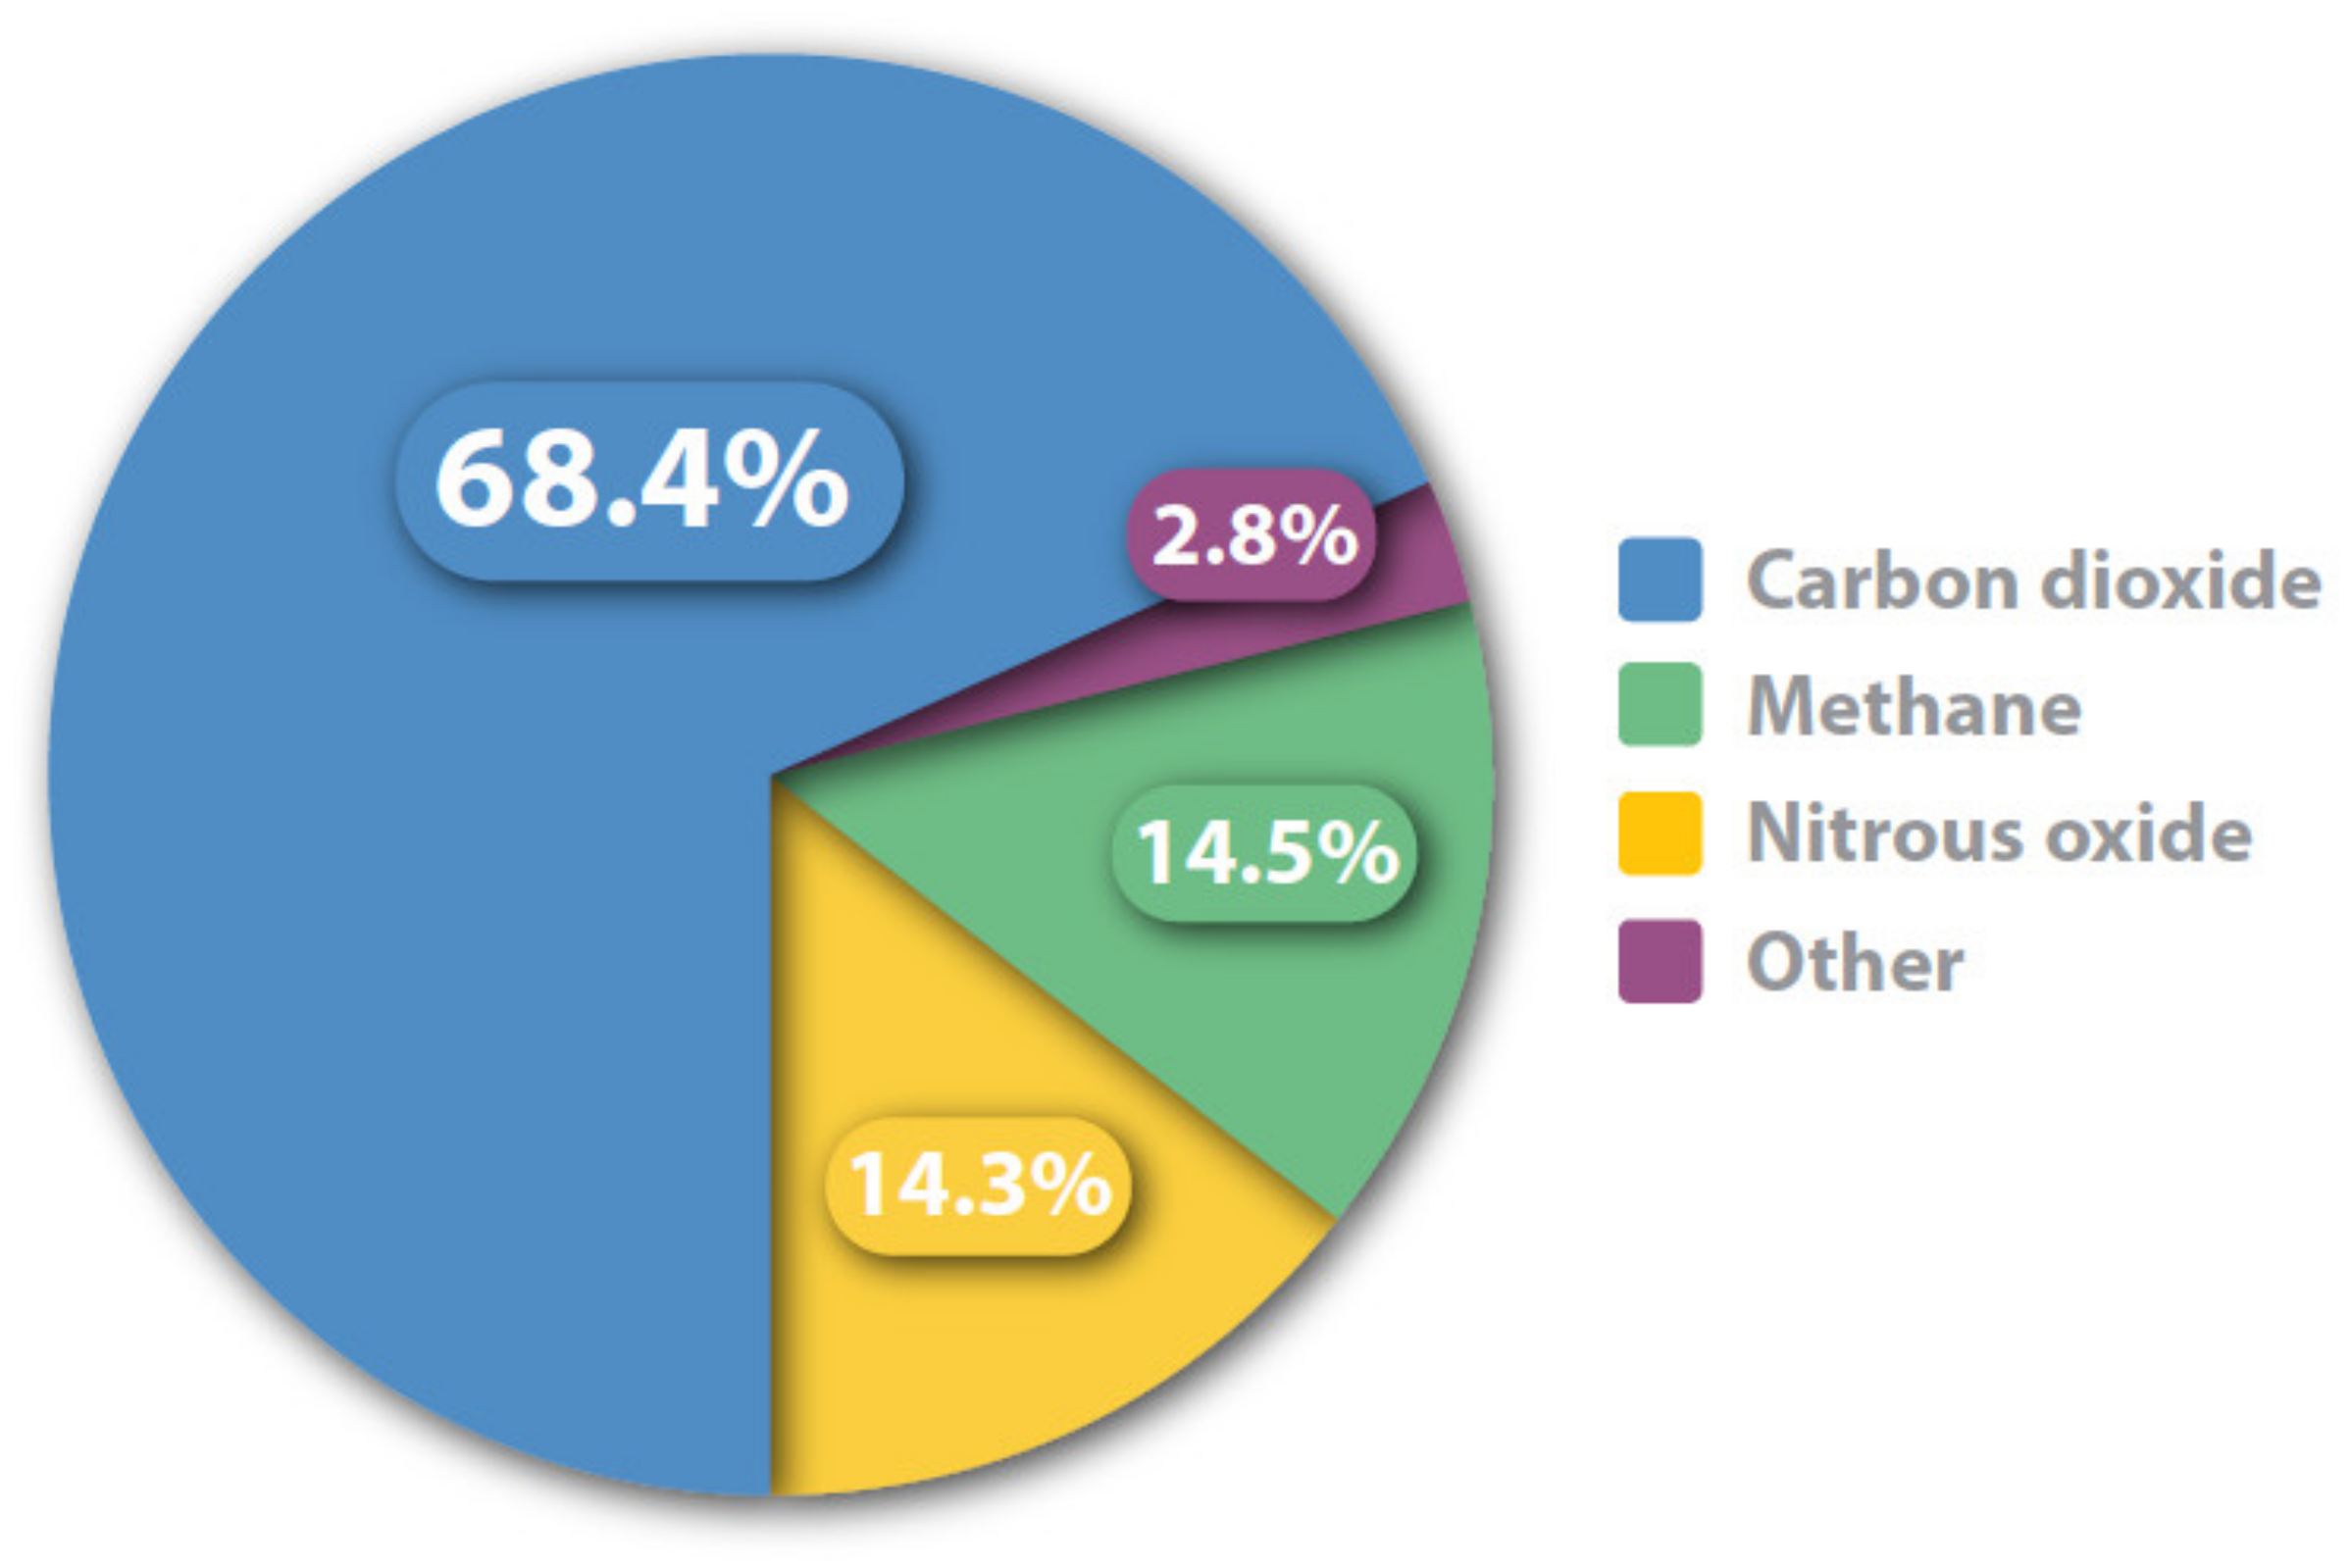
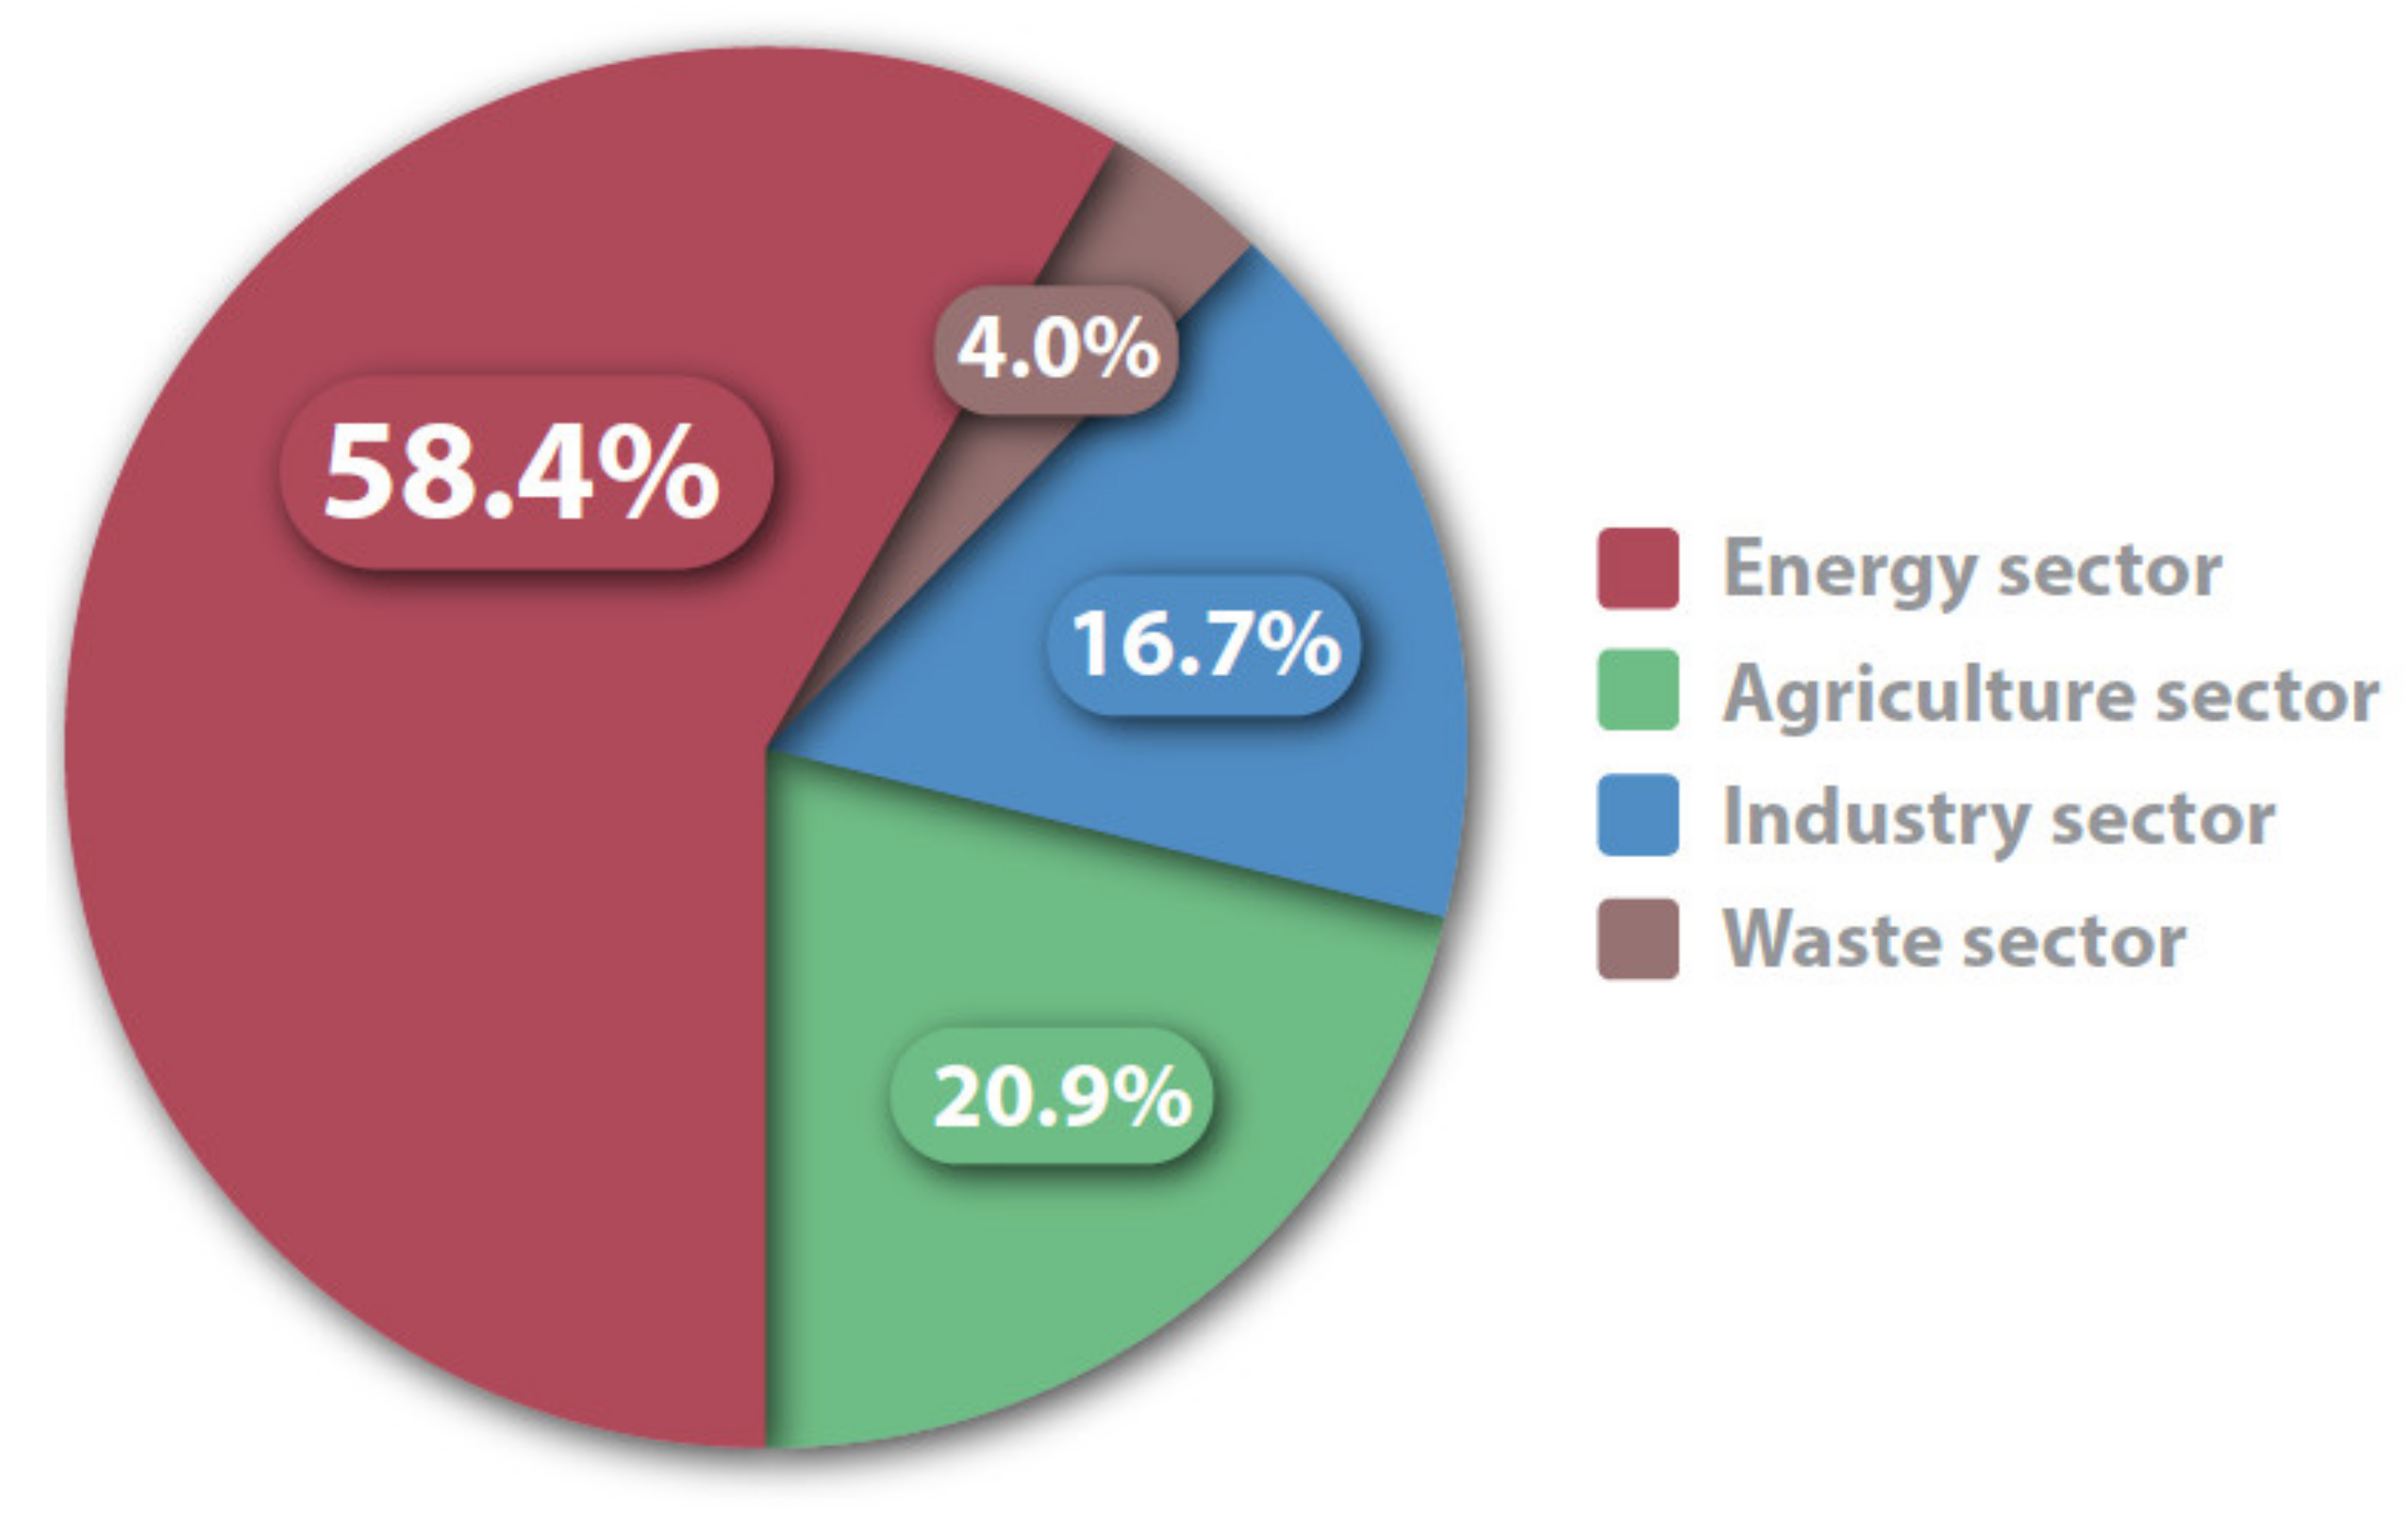
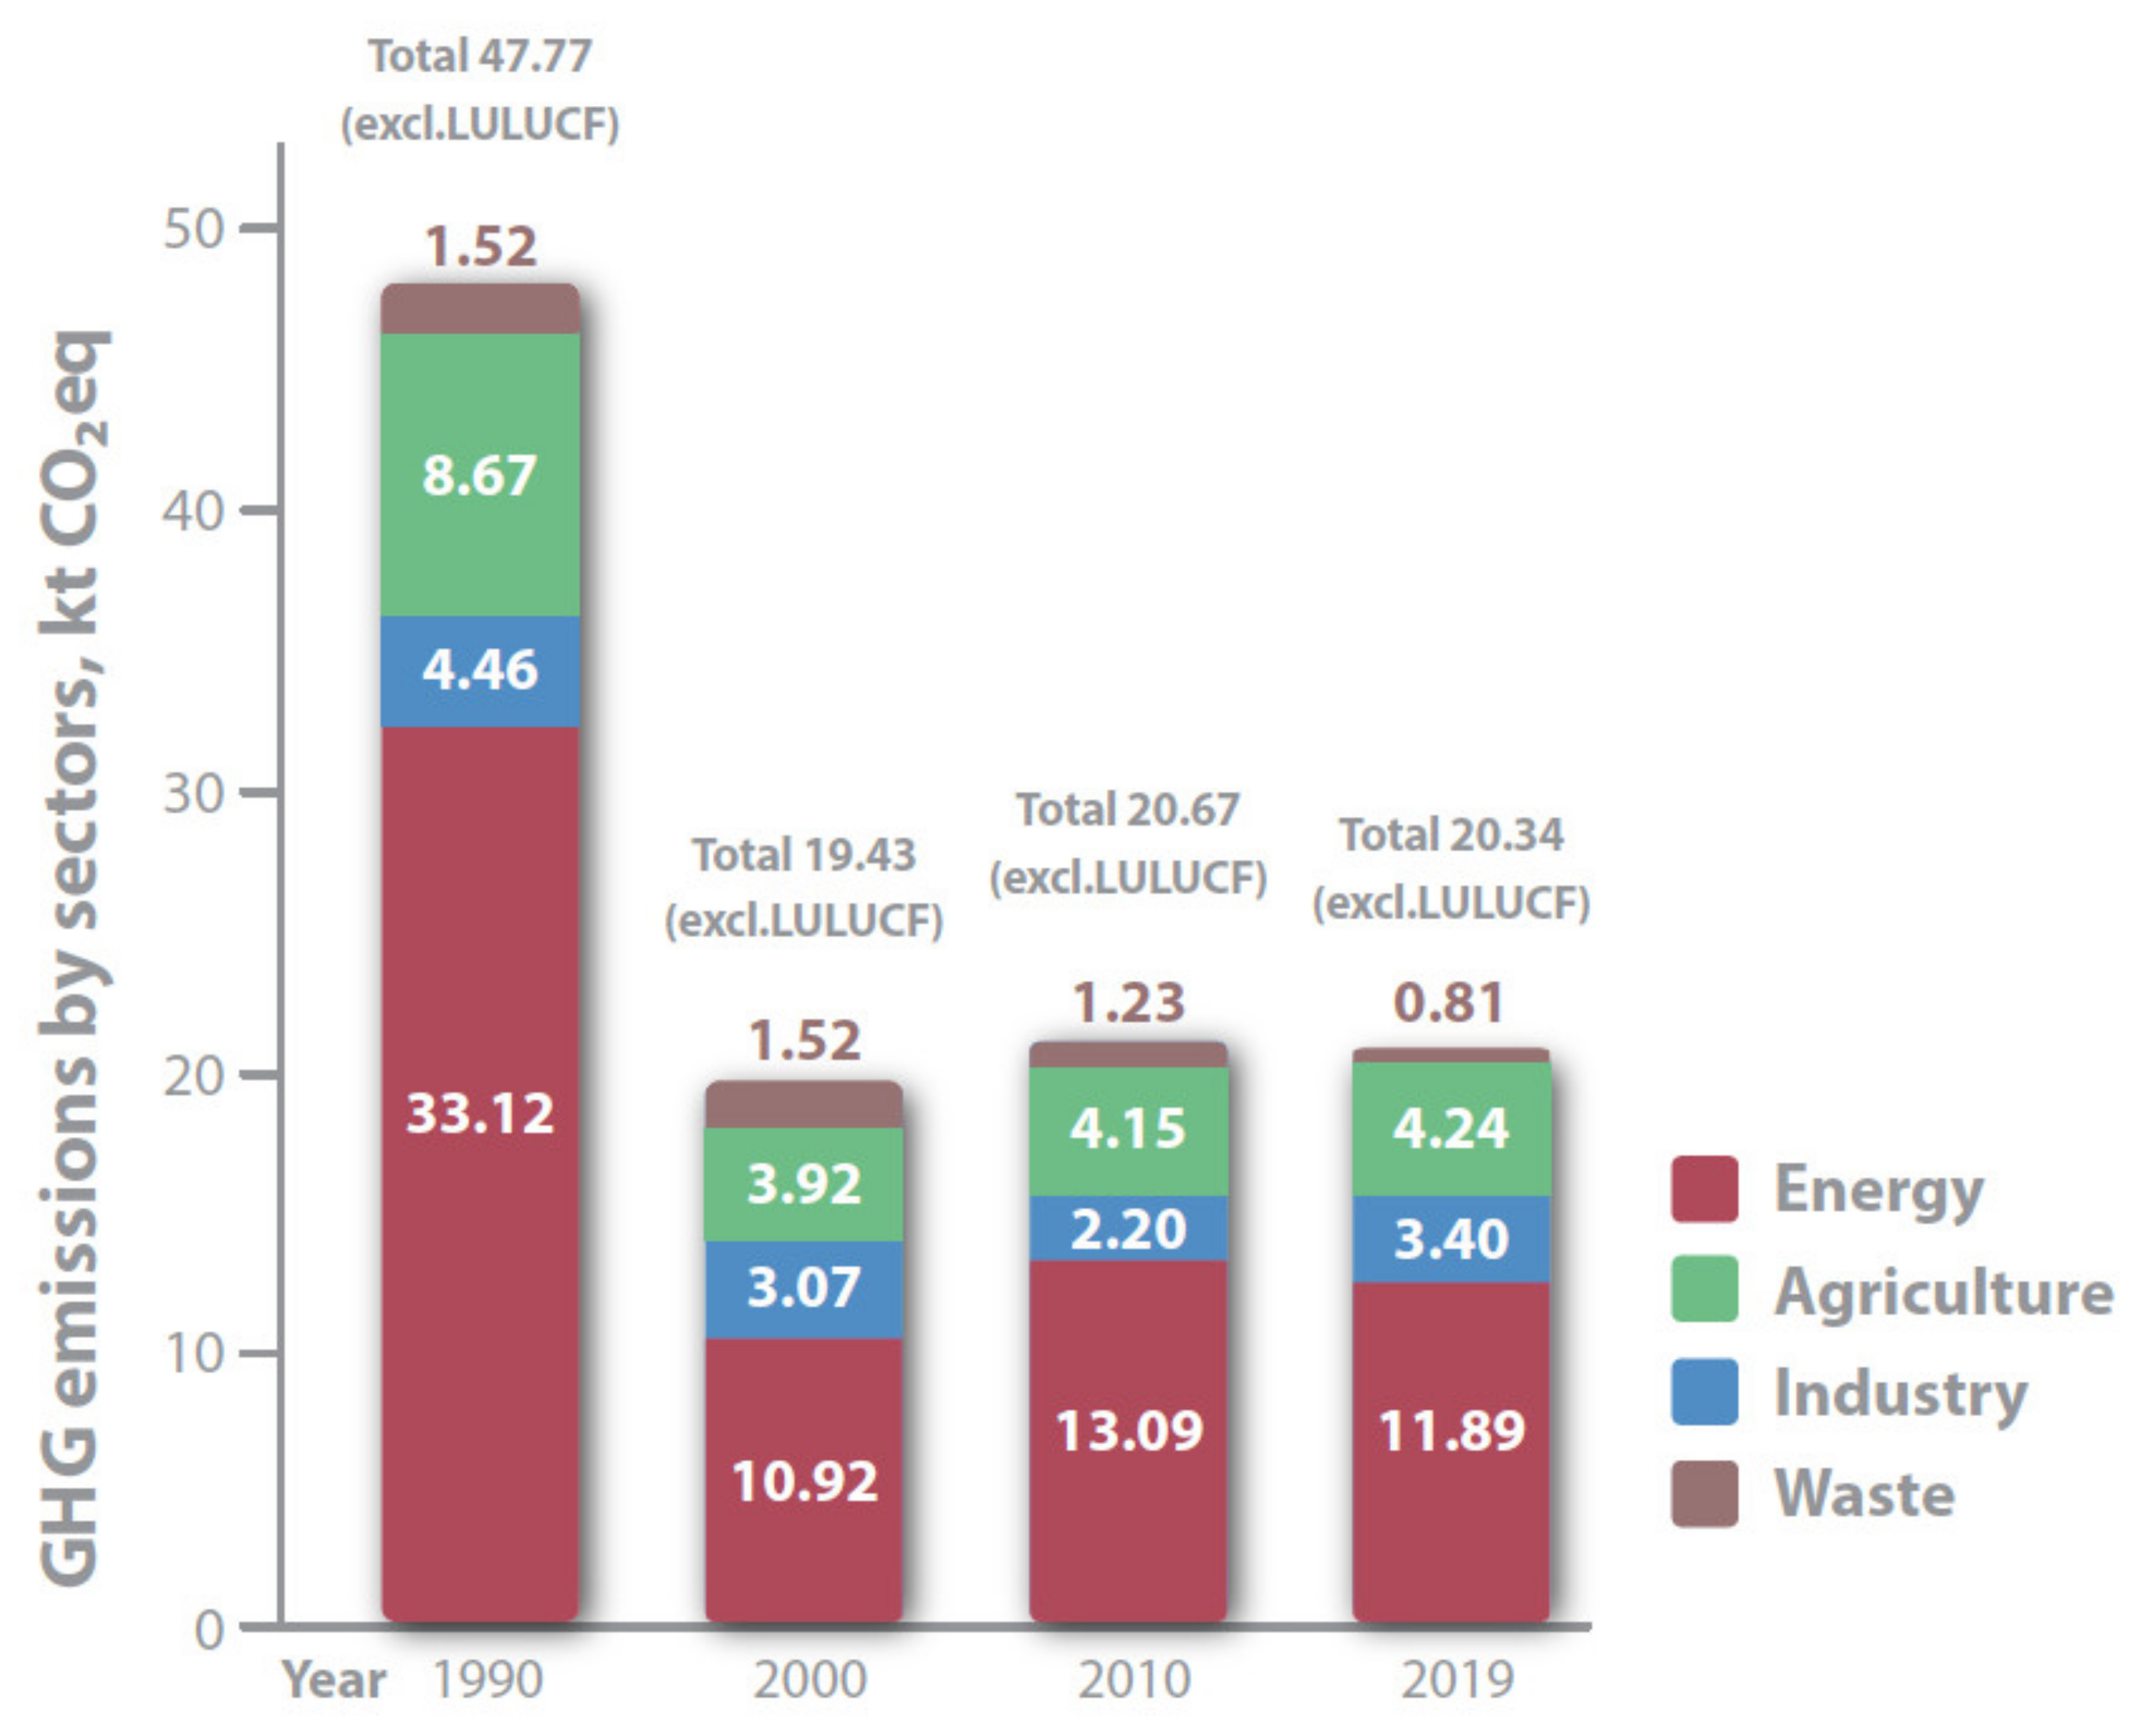
4. Greenhouse Gas Emissions
5. Conclusions
Author Contributions
Funding
Institutional Review Board Statement
Informed Consent Statement
Data Availability Statement
Conflicts of Interest
References
- OECD. OECD Economic Surveys: Lithuania 2020; OECD Publishing: Paris, France, 2020. [Google Scholar] [CrossRef]
- Zhu, D.; Mortazavi, S.M.; Maleki, A.; Aslani, A.; Yousefi, H. Analysis of the robustness of energy supply in Japan: Role of renewable energy. Energy Rep. 2020, 6, 378–391. [Google Scholar] [CrossRef]
- Nagatomo, Y.; Ozawa, A.; Kudoh, Y.; Hondo, H. Impacts of employment in power generation on renewable-based energy systems in Japan—Analysis using an energy system model. Energy 2021, 226, 120350. [Google Scholar] [CrossRef]
- Zhen, W.; Xin-Gang, Z.; Ying, Z. Biased technological progress and total factor productivity growth: From the perspective of China’s renewable energy industry. Renew. Sustain. Energy Rev. 2021, 146, 111136. [Google Scholar] [CrossRef]
- Liu, X.; Zhao, T.; Chang, C.-T.; Fu, C.J. China’s renewable energy strategy and industrial adjustment policy. Renew. Energy 2021, 170, 1382–1395. [Google Scholar] [CrossRef]
- Cany, C.; Mansilla, C.; Mathonnière, G.; da Costa, P. Nuclear contribution to the penetration of variable renewable energy sources in a French decarbonised power mix. Energy 2018, 150, 544–555. [Google Scholar] [CrossRef]
- Roussafi, F. Regional development trajectories of renewable energy: Evidence from French regions. Energy Strat. Rev. 2021, 35, 100639. [Google Scholar] [CrossRef]
- Marques, A.C.; Fuinhas, J.A.; Macedo, D. The impact of feed-in and capacity policies on electricity generation from renewable energy sources in Spain. Util. Policy 2019, 56, 159–168. [Google Scholar] [CrossRef]
- Colmenar-Santos, A.; Perera-Perez, J.; Borge-Diez, D.; Depalacio-Rodríguez, C. Offshore wind energy: A review of the current status, challenges and future development in Spain. Renew. Sustain. Energy Rev. 2016, 64, 1–18. [Google Scholar] [CrossRef]
- Zhong, J.; Bollen, M.; Rönnberg, S. Towards a 100% renewable energy electricity generation system in Sweden. Renew. Energy 2021, 171, 812–824. [Google Scholar] [CrossRef]
- Glaa, B.; Mignon, I. Identifying gaps and overlaps of intermediary support during the adoption of renewable energy technology in Sweden—A conceptual framework. J. Clean. Prod. 2020, 261, 121178. [Google Scholar] [CrossRef]
- Igliński, B.; Iglińska, A.; Koziński, G.; Skrzatek, M.; Buczkowski, R. Wind energy in Poland—History, current state, surveys, Renewable Energy Sources Act, SWOT analysis. Renew. Sustain. Energy Rev. 2016, 64, 19–33. [Google Scholar] [CrossRef]
- Hernik, J.; Noszczyk, T.; Rutkowska, A. Towards a better understanding of the variables that influence renewable energy sources in eastern Poland. J. Clean. Prod. 2019, 241, 118075. [Google Scholar] [CrossRef]
- Holma, A.; Leskinen, P.; Myllyviita, T.; Manninen, K.; Sokka, L.; Sinkko, T.; Pasanen, K. Environmental impacts and risks of the national renewable energy targets—A review and a qualitative case study from Finland. Renew. Sustain. Energy Rev. 2018, 82, 1433–1441. [Google Scholar] [CrossRef]
- Panula-Ontto, J.; Luukkanen, J.; Kaivo-Oja, J.; O’Mahony, T.; Vehmas, J.; Valkealahti, S.; Björkqvist, T.; Korpela, T.; Järventausta, P.; Majanne, Y.; et al. Cross-impact analysis of Finnish electricity system with increased renewables: Long-run energy policy challenges in balancing supply and consumption. Energy Policy 2018, 118, 504–513. [Google Scholar] [CrossRef]
- Scholz, R.; Beckmann, M.; Pieper, C.; Muster, M.; Weber, R. Considerations on providing the energy needs using exclusively renewable sources: Energiewende in Germany. Renew. Sustain. Energy Rev. 2014, 35, 109–125. [Google Scholar] [CrossRef]
- Kriechbaum, M.; Posch, A.; Hauswiesner, A. Hype cycles during socio-technical transitions: The dynamics of collective expectations about renewable energy in Germany. Res. Policy 2021, 50, 104262. [Google Scholar] [CrossRef]
- Matschoss, P.; Bayer, B.; Thomas, H.; Marian, A. The German incentive regulation and its practical impact on the grid integration of renewable energy systems. Renew. Energy 2018, 134, 727–738. [Google Scholar] [CrossRef]
- Berg, T.L.; Apostolou, D.; Enevoldsen, P. Analysis of the wind energy market in Denmark and future interactions with an emerging hydrogen market. Int. J. Hydrogen Energy 2020, 46, 146–156. [Google Scholar] [CrossRef]
- Mortensen, A.W.; Mathiesen, B.V.; Hansen, A.B.; Pedersen, S.L.; Grandal, R.D.; Wenzel, H. The role of electrification and hydrogen in breaking the biomass bottleneck of the renewable energy system—A study on the Danish energy system. Appl. Energy 2020, 275, 115331. [Google Scholar] [CrossRef]
- Johansen, K. Blowing in the wind: A brief history of wind energy and wind power technologies in Denmark. Energy Policy 2021, 152, 112139. [Google Scholar] [CrossRef]
- Bulavskaya, T.; Reynès, F. Job creation and economic impact of renewable energy in the Netherlands. Renew. Energy 2018, 119, 528–538. [Google Scholar] [CrossRef]
- Van Leeuwen, L.B.; Cappon, H.J.; Keesman, K.J. Urban bio-waste as a flexible source of electricity in a fully renewable energy system. Biomass Bioenergy 2021, 145, 105931. [Google Scholar] [CrossRef]
- Li, L.; Lin, J.; Wu, N.; Xie, S.; Meng, C.; Zheng, Y.; Wang, X.; Zhao, Y. Review and outlook on the international renewable energy development. Energy Built Environ. 2020, in press. [Google Scholar] [CrossRef]
- Official Statistics Portal of the Republic of Lithuania. Environment Protection and Energy. 2020. Available online: https://osp.stat.gov.lt/statistiniu-rodikliu-analize#/ (accessed on 27 July 2021).
- The International Renewable Energy Agency (IRENA). Renewable Energy Statistics 2021; The International Renewable Energy Agency: Abu Dhabi, United Arab Emirates, 2021; 460p. [Google Scholar]
- Hamzaoğlu, A.; Erduman, A.; Alçı, M. Reduction of distribution system losses using solar energy cooperativity by home user. Ain Shams Eng. J. 2021, in press. [Google Scholar] [CrossRef]
- Fraser, T. Does social capital boost or block renewable energy siting? South African solar politics in comparison. Energy Res. Soc. Sci. 2020, 71, 101845. [Google Scholar] [CrossRef]
- Cousse, J. Still in love with solar energy? Installation size, affect, and the social acceptance of renewable energy technologies. Renew. Sustain. Energy Rev. 2021, 145, 111107. [Google Scholar] [CrossRef]
- Gu, G.; Yang, D.; Feng, T.; Timmermans, H. Influence of the adoption of new mobility tools on investments in home renewable energy equipment: Results of a stated choice experiment. Sustain. Cities Soc. 2019, 50, 101641. [Google Scholar] [CrossRef]
- Murray, E. World Cities Ranked by Annual Sunshine Hours. 2019. Available online: https://data.world/makeovermonday/2019w44 (accessed on 14 July 2021).
- Bioenergy in Europe. Overview. European Technology and Innovation Platform, Bioenergy Fact Sheet. 2020. Available online: https://www.etipbioenergy.eu/images/ETIP_B_Factsheet_Bioenergy%20in%20Europe_rev_feb2020.pdf (accessed on 21 July 2021).
- Shahnazi, R.; Shabani, Z.D. The effects of renewable energy, spatial spillover of CO2 emissions and economic freedom on CO2 emissions in the EU. Renew. Energy 2021, 169, 293–307. [Google Scholar] [CrossRef]
- Garabetian, T.; Dumas, P.; Serrano, C.; Mazzagatti, V.; Kumar, S.; Dimitrisina, R.; Erbanova, H.; Katechi, S. (Eds.) EGEC Geothermal Market Report. Key Findings, 10th ed.; European Geothermal Energy Council: Brussels, Belgium, 2021; 26p. [Google Scholar]
- Buscheck, T.A.; Bielicki, J.; Randolph, J.B. CO2 Earth Storage: Enhanced Geothermal Energy and Water Recovery and Energy Storage. Energy Procedia 2017, 114, 6870–6879. [Google Scholar] [CrossRef]
- Burton, N.; Padilla, R.; Rose, A.; Habibullah, H. Increasing the efficiency of hydrogen production from solar powered water electrolysis. Renew. Sustain. Energy Rev. 2020, 135, 110255. [Google Scholar] [CrossRef]
- Ayodele, T.; Munda, J. Potential and economic viability of green hydrogen production by water electrolysis using wind energy resources in South Africa. Int. J. Hydrogen Energy 2019, 44, 17669–17687. [Google Scholar] [CrossRef]
- Kakoulaki, G.; Kougias, I.; Taylor, N.; Dolci, F.; Moya, J.; Jäger-Waldau, A. Green hydrogen in Europe—A regional assessment: Substituting existing production with electrolysis powered by renewables. Energy Convers. Manag. 2020, 228, 113649. [Google Scholar] [CrossRef]
- Lux, B.; Pfluger, B. A supply curve of electricity-based hydrogen in a decarbonized European energy system in 2050. Appl. Energy 2020, 269, 115011. [Google Scholar] [CrossRef]
- Cai, W.; Lai, K.-H.; Liu, C.; Wei, F.; Ma, M.; Jia, S.; Jiang, Z.; Lv, L. Promoting sustainability of manufacturing industry through the lean energy-saving and emission-reduction strategy. Sci. Total Environ. 2019, 665, 23–32. [Google Scholar] [CrossRef]
- Kilpys, J.; Pauša, K.; Jurkus, N. Climate Change Mitigation and Adaptation Climate Change Guidelines for Municipalities; Lithuanian Association of Municipalities: Vilnius, Lithuania, 2017; 73p, Available online: https://www.krea.lt/images/angle180/klimato-kaita-gaires-savivaldybems.pdf (accessed on 6 June 2021). (In Lithuanian)
- U.S. EPA. Inventory of U.S. Greenhouse Gas Emissions and Sinks. 1990–2019. 2021. Available online: https://www.epa.gov/ghgemissions/inventory-us-greenhouse-gas-emissions-and-sinks (accessed on 6 July 2021).
- Sovacool, B.K.; Griffiths, S.; Kim, J.; Bazilian, M. Climate change and industrial F-gases: A critical and systematic review of developments, sociotechnical systems and policy options for reducing synthetic greenhouse gas emissions. Renew. Sustain. Energy Rev. 2021, 141, 110759. [Google Scholar] [CrossRef]
- Lindley, A.; McCulloch, A. Regulating to reduce emissions of fluorinated greenhouse gases. J. Fluor. Chem. 2005, 126, 1457–1462. [Google Scholar] [CrossRef]
- Bronson, K.; Hunsaker, D.; El-Shikha, D.; Rockholt, S.; Williams, C.; Rasutis, D.; Soratana, K.; Venterea, R. Nitrous oxide emissions, N uptake, biomass, and rubber yield in N-fertilized, surface-irrigated guayule. Ind. Crop. Prod. 2021, 167, 113561. [Google Scholar] [CrossRef]
- Sun, J.; Du, T.; Sun, W.; Na, H.; He, J.; Qiu, Z.; Yuan, Y.; Li, Y. An evaluation of greenhouse gas emission efficiency in China’s industry based on SFA. Sci. Total Environ. 2019, 690, 1190–1202. [Google Scholar] [CrossRef]
- Mao, W.; Wang, W.; Sun, H. Driving patterns of industrial green transformation: A multiple regions case learning from China. Sci. Total Environ. 2019, 697, 134134. [Google Scholar] [CrossRef]
- Xia, F.; Zhang, X.; Cai, T.; Wu, S.; Zhao, D. Identification of key industries of industrial sector with energy-related CO2 emissions and analysis of their potential for energy conservation and emission reduction in Xinjiang, China. Sci. Total Environ. 2019, 708, 134587. [Google Scholar] [CrossRef]
- The European Parliament; the Council of the European Union. Regulation (EU) 2018/842 of the European Parliament and of the Council of 30 May 2018 on binding annual greenhouse gas emission reductions by Member States from 2021 to 2030 contributing to climate action to meet commitments under the Paris Agreement and amending Regulation (EU) No 525/2013. Off. J. Eur. Union 2018, 61, 156. Available online: http://data.europa.eu/eli/reg/2018/842/oj (accessed on 27 July 2021).
- Matiiuk, Y.; Poškus, M.S.; Liobikienė, G. The Implementation of Climate Change Policy in Post-Soviet Countries Achieving Long-Term Targets. Sustainability 2020, 12, 4558. [Google Scholar] [CrossRef]
- Cilinskis, E.; Ziemele, J.; Blumberga, A.; Blumberga, D. Analysis of support measures for promoting energy efficiency and renewables for GHG emissions reduction in non-ETS sector. Energy Procedia 2017, 142, 2838–2843. [Google Scholar] [CrossRef]
- Lithuania’s National Inventory Report 2021. Greenhouse Gas Emissions 1990–2019. 2021; 566p, Available online: https://unfccc.int/sites/default/files/resource/ltu-2021-nir-15apr21.zip (accessed on 19 June 2021).
- Sansyzbayeva, G.; Temerbulatova, Z.; Aknur, Z.; Ashirbekova, L. Evaluating the transition to green economy in Kazakhstan: A synthetic control approach. J. Int. Stud. 2020, 13, 324–341. [Google Scholar] [CrossRef] [PubMed][Green Version]
- Hnatyshyn, M. Decomposition analysis of the impact of economic growth on ammonia and nitrogen oxides emissions in the European Union. J. Int. Stud. 2018, 11, 201–209. [Google Scholar] [CrossRef] [PubMed]
- Tvaronavičienė, M.; Prakapienė, D.; Garškaitė-Milvydienė, K.; Prakapas, R.; Nawrot, Ł. Energy Efficiency in the Long-Run in the Selected European Countries. Econ. Sociol. 2018, 11, 245–254. [Google Scholar] [CrossRef]
- Svazas, M.; Navickas, V.; Krajnakova, E.; Nakonieczny, J. Sustainable supply chain of the biomass cluster as a factor for preservation and enhancement of forests. J. Int. Stud. 2019, 12, 309–321. [Google Scholar] [CrossRef]
- Glavič, P. Evolution and Current Challenges of Sustainable Consumption and Production. Sustainability 2021, 13, 9379. [Google Scholar] [CrossRef]


| Technology | Capacity in 2020, MW | % |
|---|---|---|
| Non-renewable | 2493 | 73 |
| Renewable | 922 | 27 |
| Hydropower plants | 117 | 3.4 |
| Solar power plants | 148 | 4.3 |
| Wind farms | 539 | 15.8 |
| Bioenergy (biofuel, biogas) power plants | 118 | 3.5 |
| Geothermal | 0 | 0 |
| Total | 3415 | 100 |
| In Energy | In Transport | In the Industry | In Agriculture | In Forestry |
|---|---|---|---|---|
|
|
|
|
|
Publisher’s Note: MDPI stays neutral with regard to jurisdictional claims in published maps and institutional affiliations. |
© 2021 by the authors. Licensee MDPI, Basel, Switzerland. This article is an open access article distributed under the terms and conditions of the Creative Commons Attribution (CC BY) license (https://creativecommons.org/licenses/by/4.0/).
Share and Cite
Baskutis, S.; Baskutiene, J.; Navickas, V.; Bilan, Y.; Cieśliński, W. Perspectives and Problems of Using Renewable Energy Sources and Implementation of Local “Green” Initiatives: A Regional Assessment. Energies 2021, 14, 5888. https://doi.org/10.3390/en14185888
Baskutis S, Baskutiene J, Navickas V, Bilan Y, Cieśliński W. Perspectives and Problems of Using Renewable Energy Sources and Implementation of Local “Green” Initiatives: A Regional Assessment. Energies. 2021; 14(18):5888. https://doi.org/10.3390/en14185888
Chicago/Turabian StyleBaskutis, Saulius, Jolanta Baskutiene, Valentinas Navickas, Yuriy Bilan, and Wojciech Cieśliński. 2021. "Perspectives and Problems of Using Renewable Energy Sources and Implementation of Local “Green” Initiatives: A Regional Assessment" Energies 14, no. 18: 5888. https://doi.org/10.3390/en14185888
APA StyleBaskutis, S., Baskutiene, J., Navickas, V., Bilan, Y., & Cieśliński, W. (2021). Perspectives and Problems of Using Renewable Energy Sources and Implementation of Local “Green” Initiatives: A Regional Assessment. Energies, 14(18), 5888. https://doi.org/10.3390/en14185888