
Multi-Scenario Simulation of a Water–Energy Coupling System Based on System Dynamics: A Case Study of Ningbo City


Abstract
:1. Introduction
2. Materials and Methods
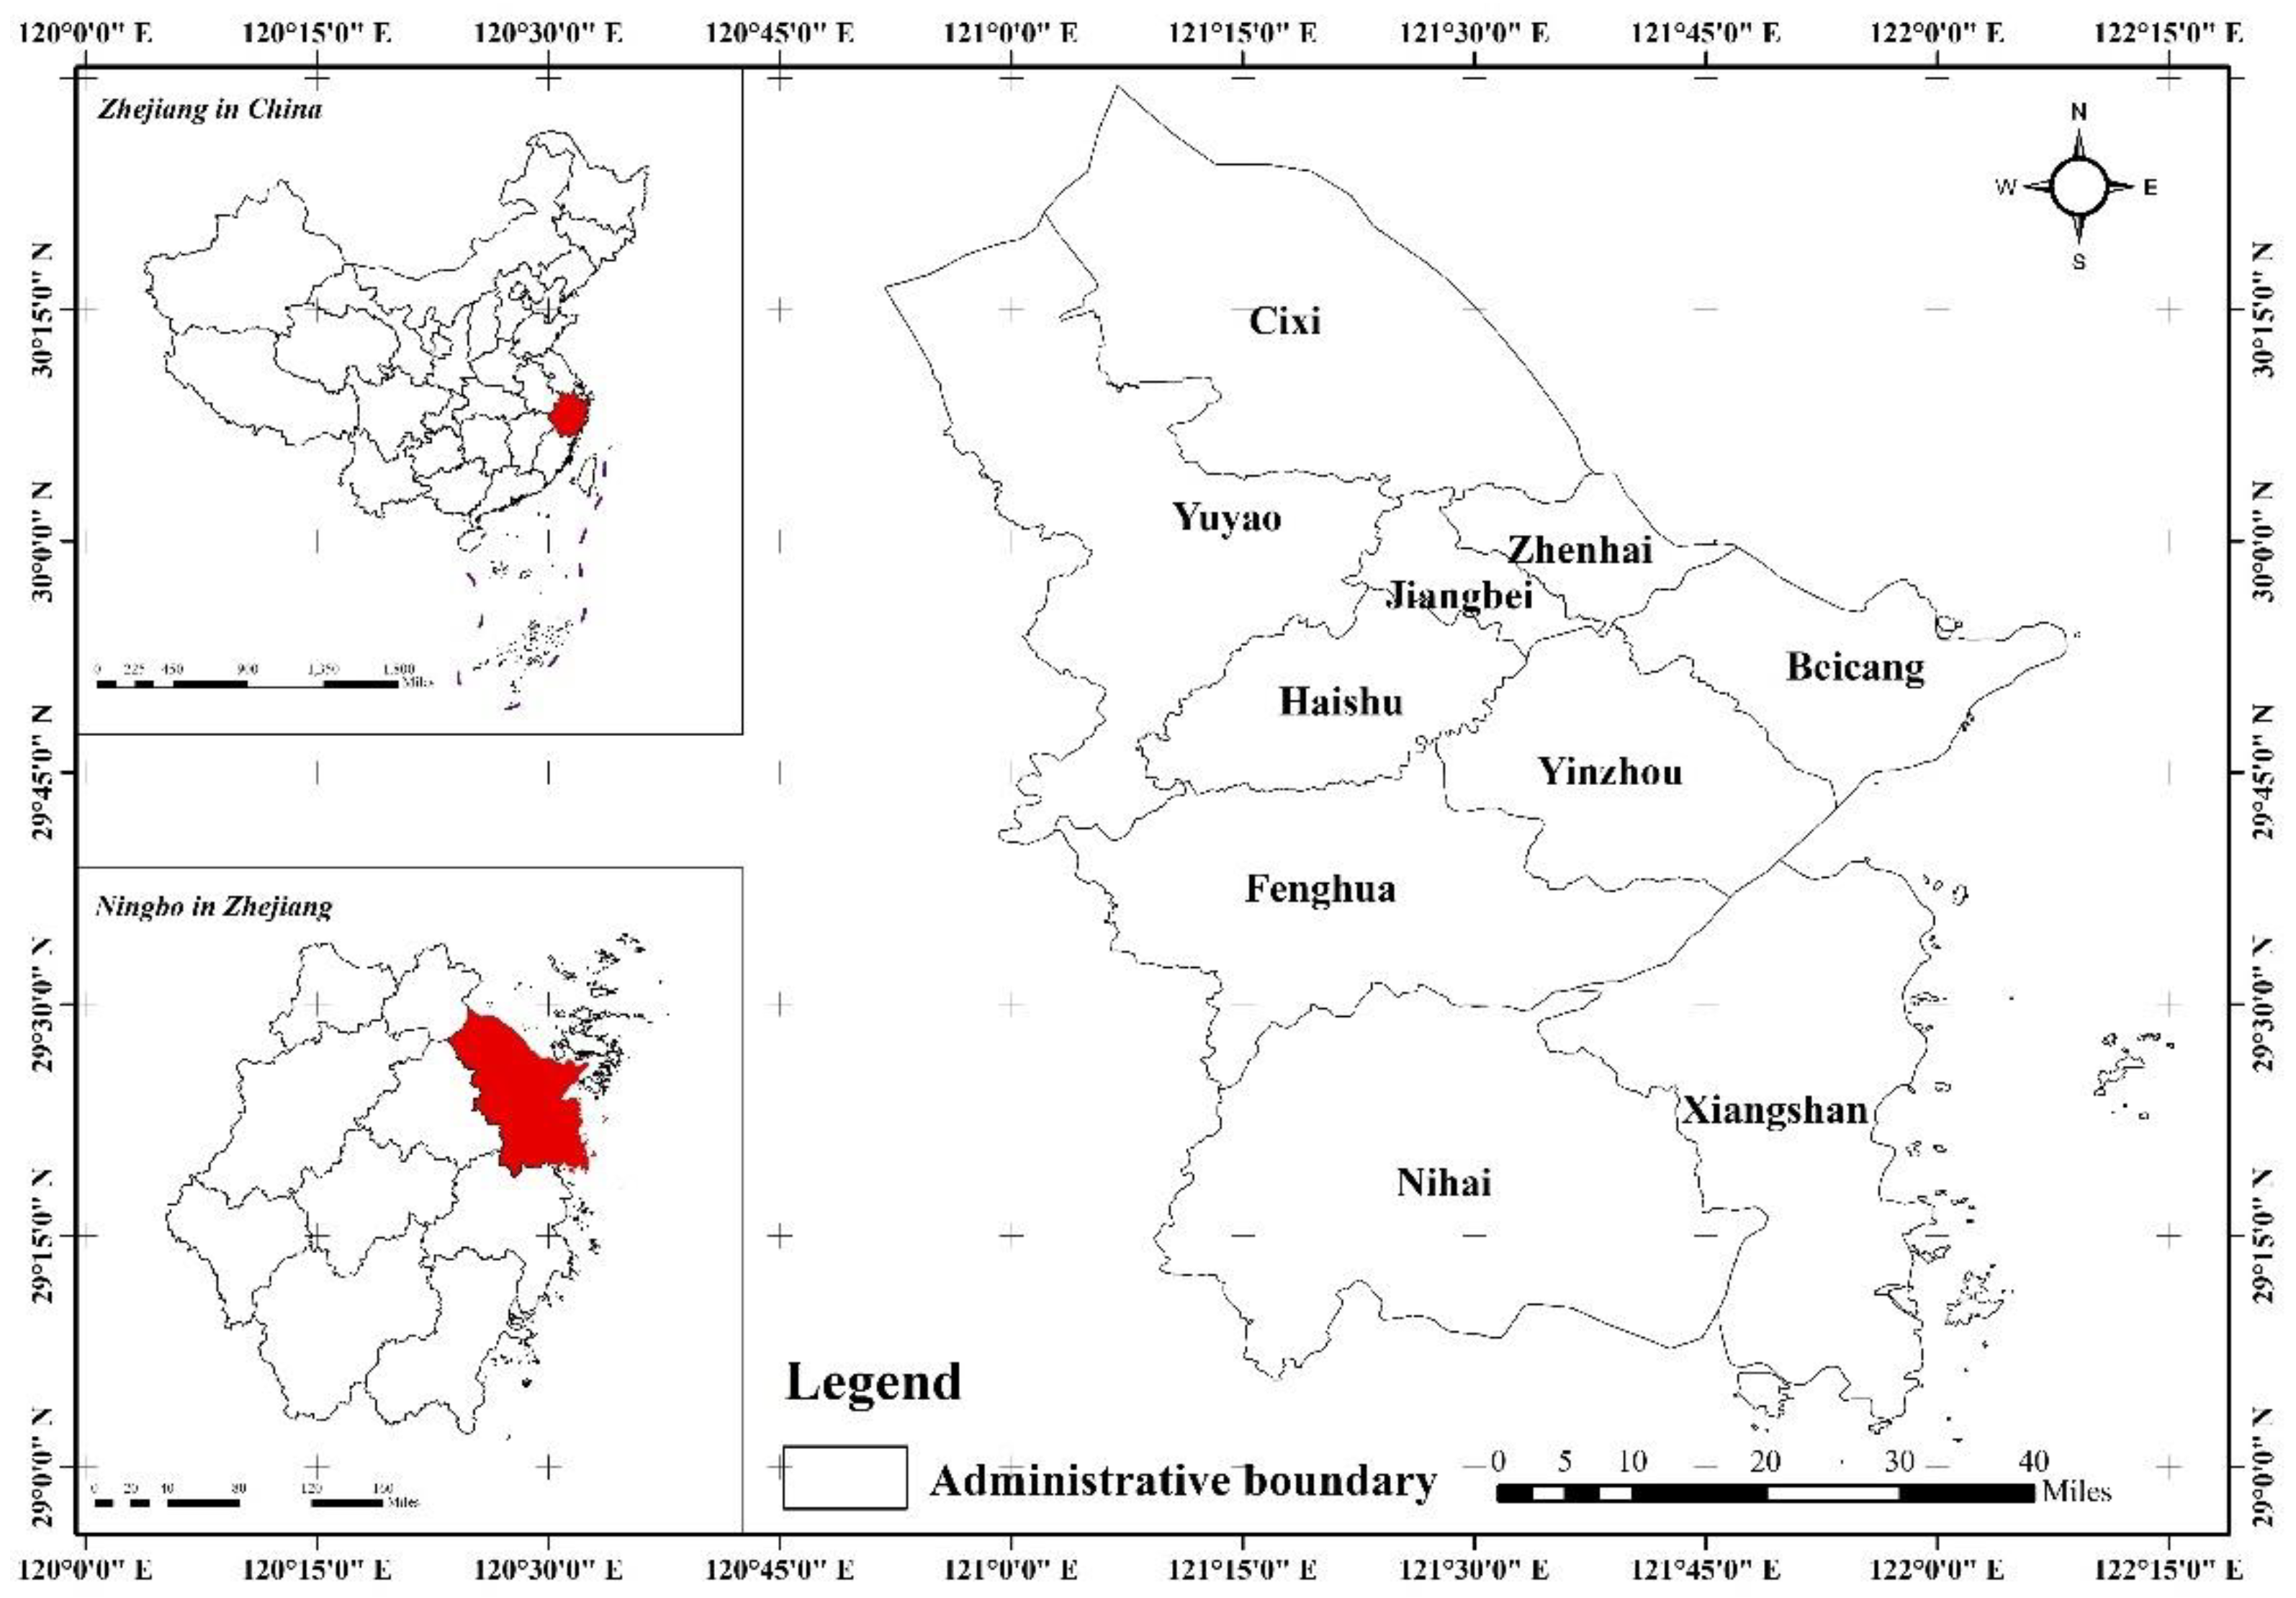
2.1. Study Area
2.2. Data Sources
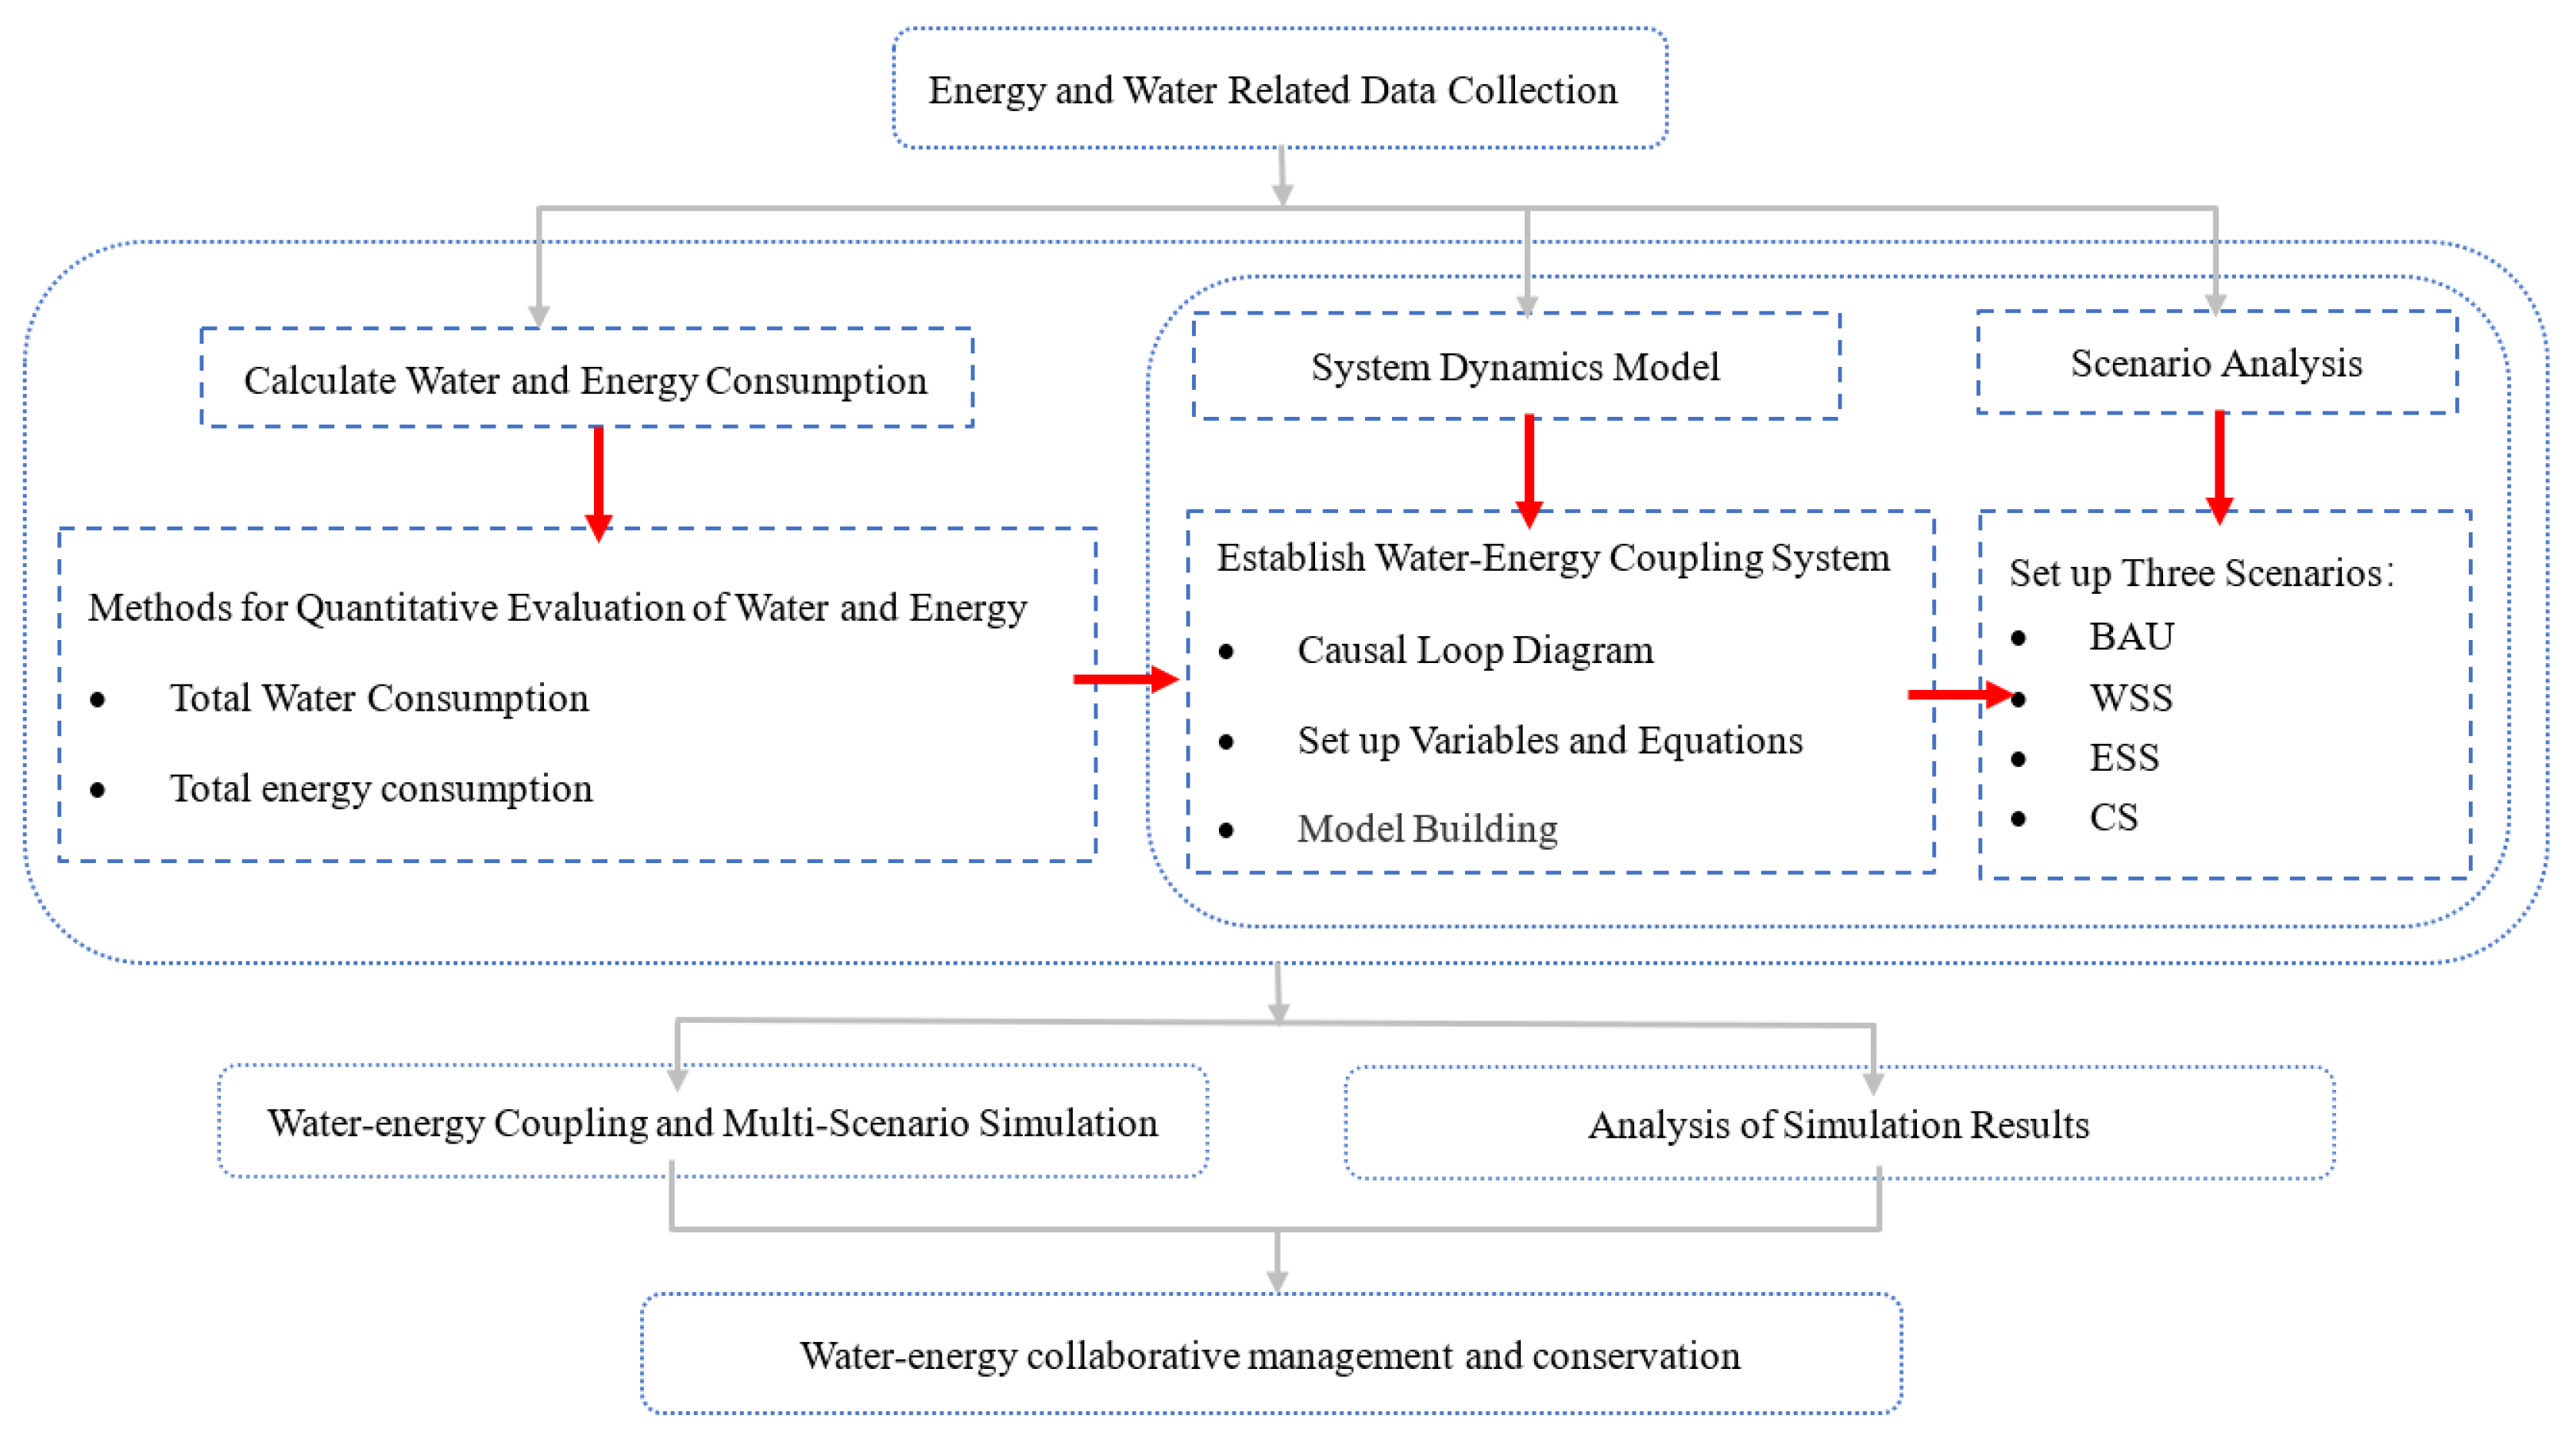
2.3. Technical Route
2.4. Methods for Quantitative Evaluation of Water and Energy
2.5. System Dynamics Model
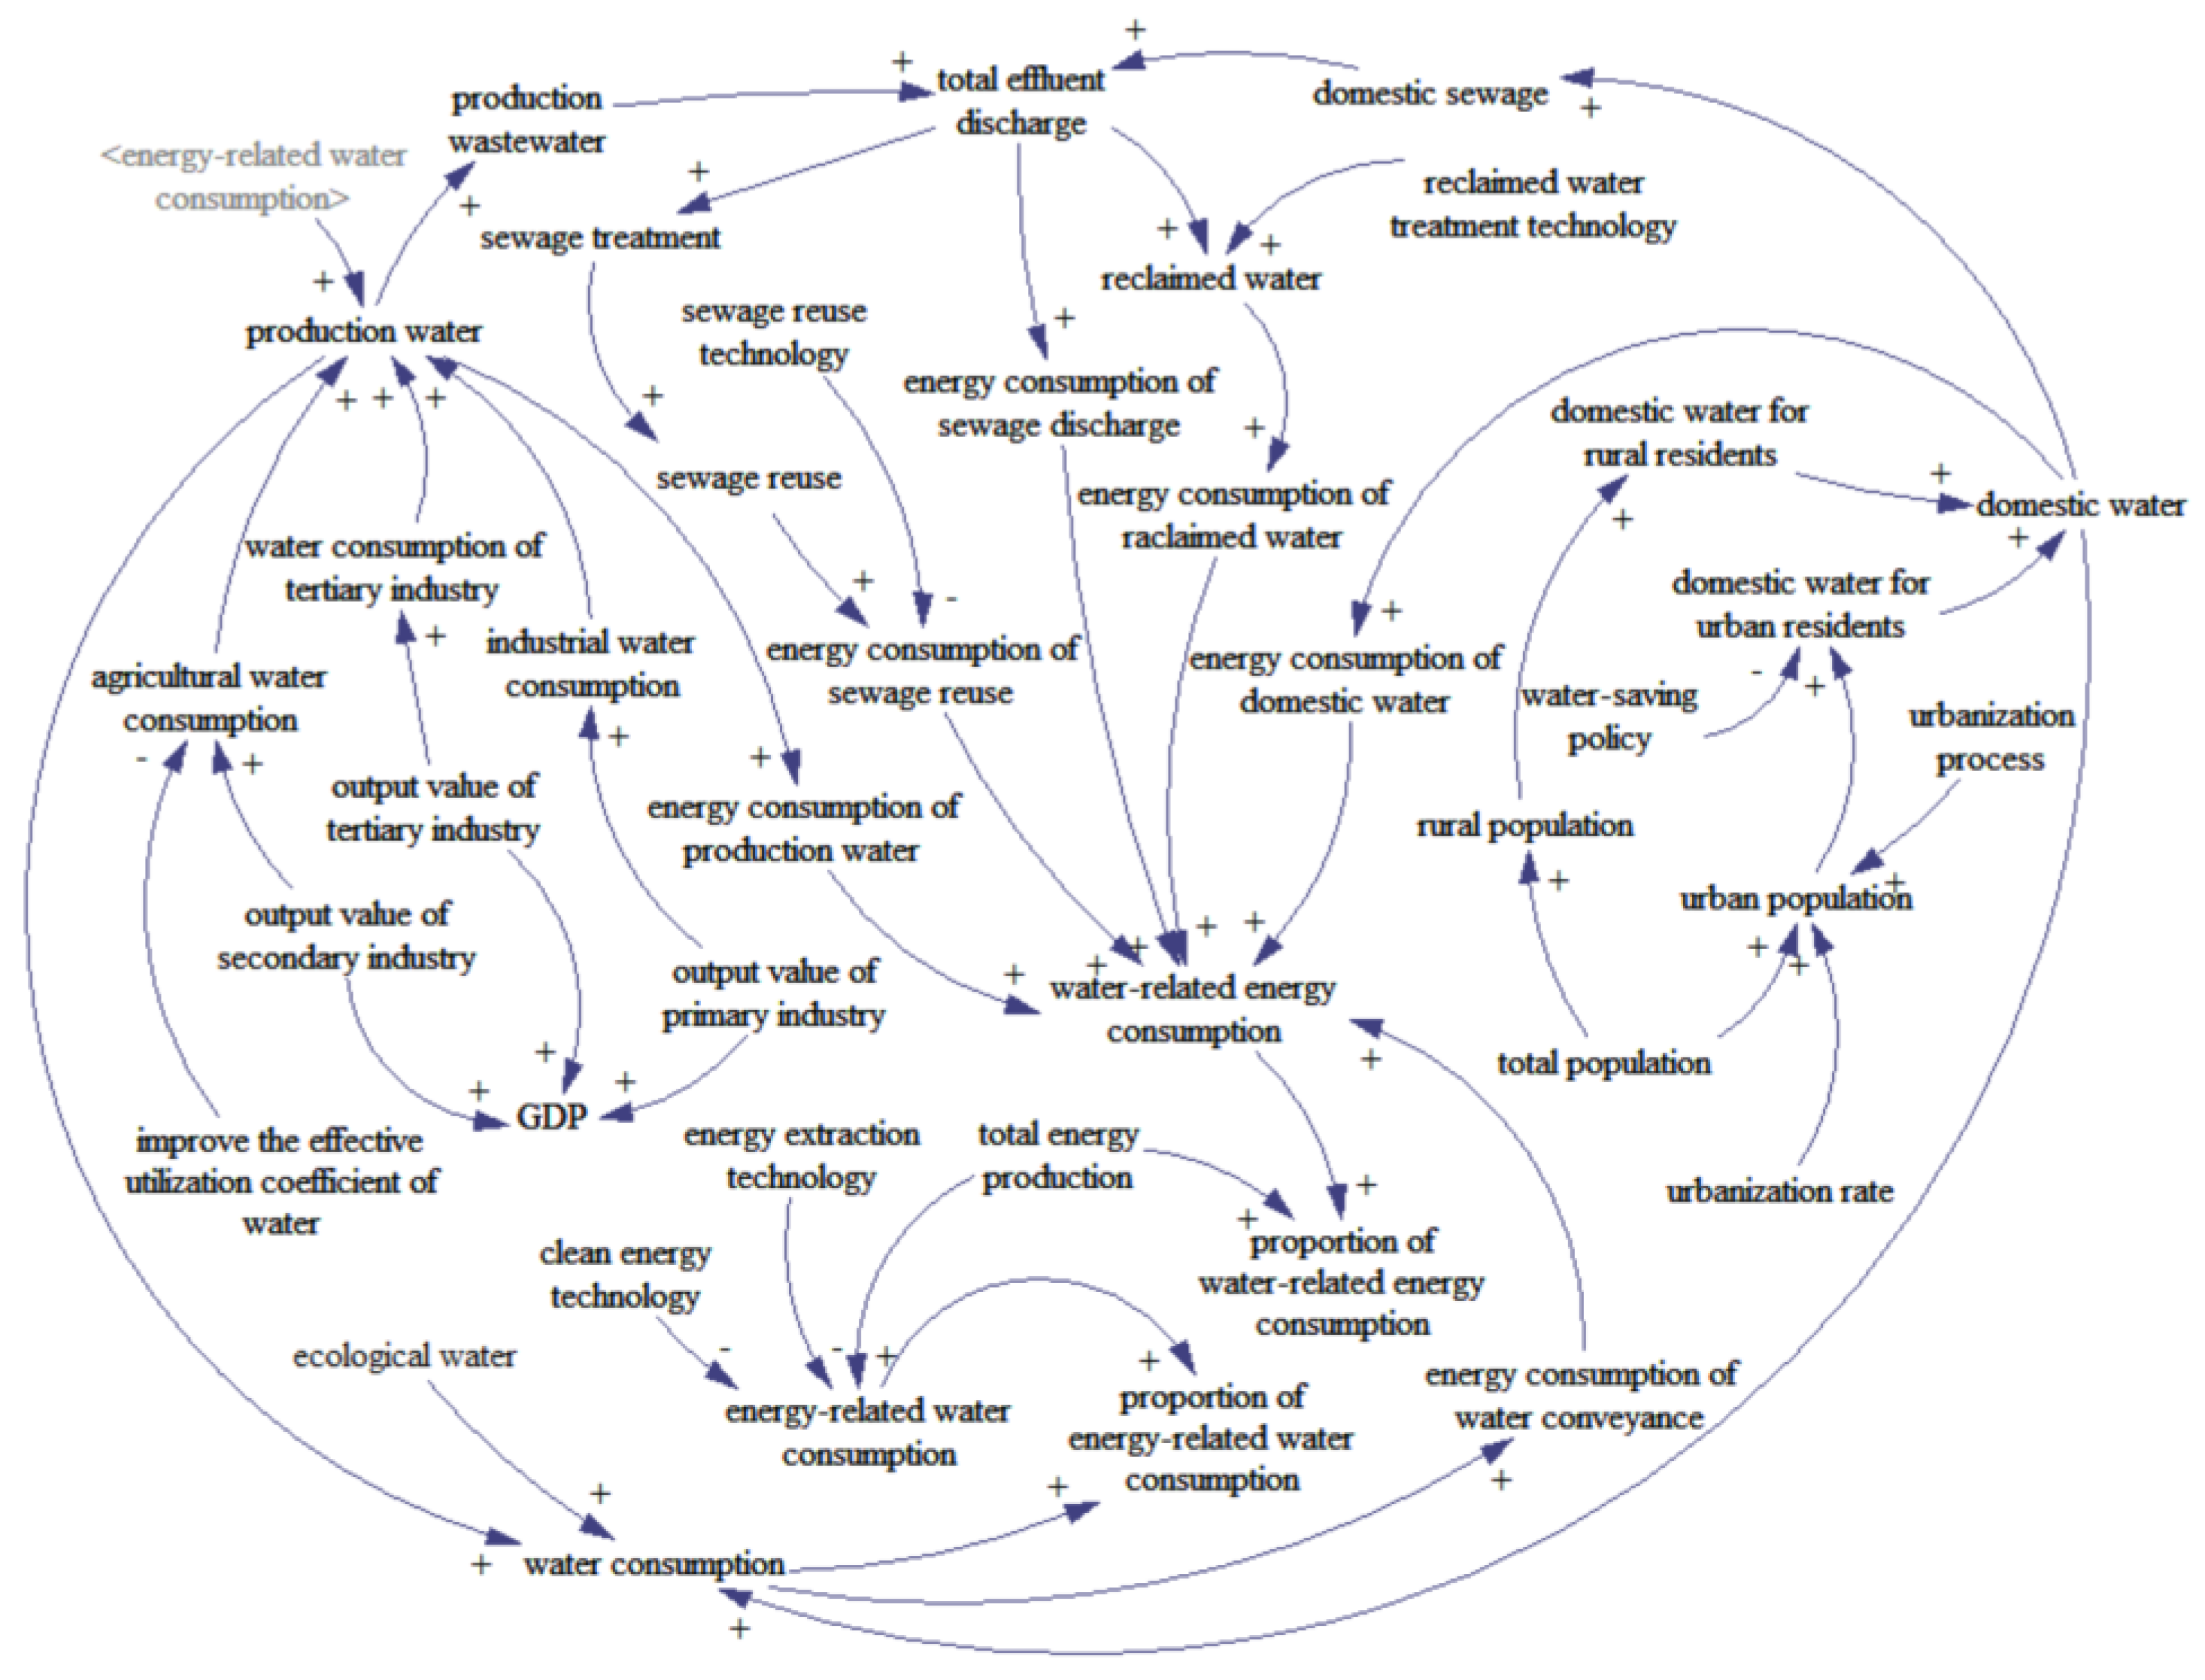
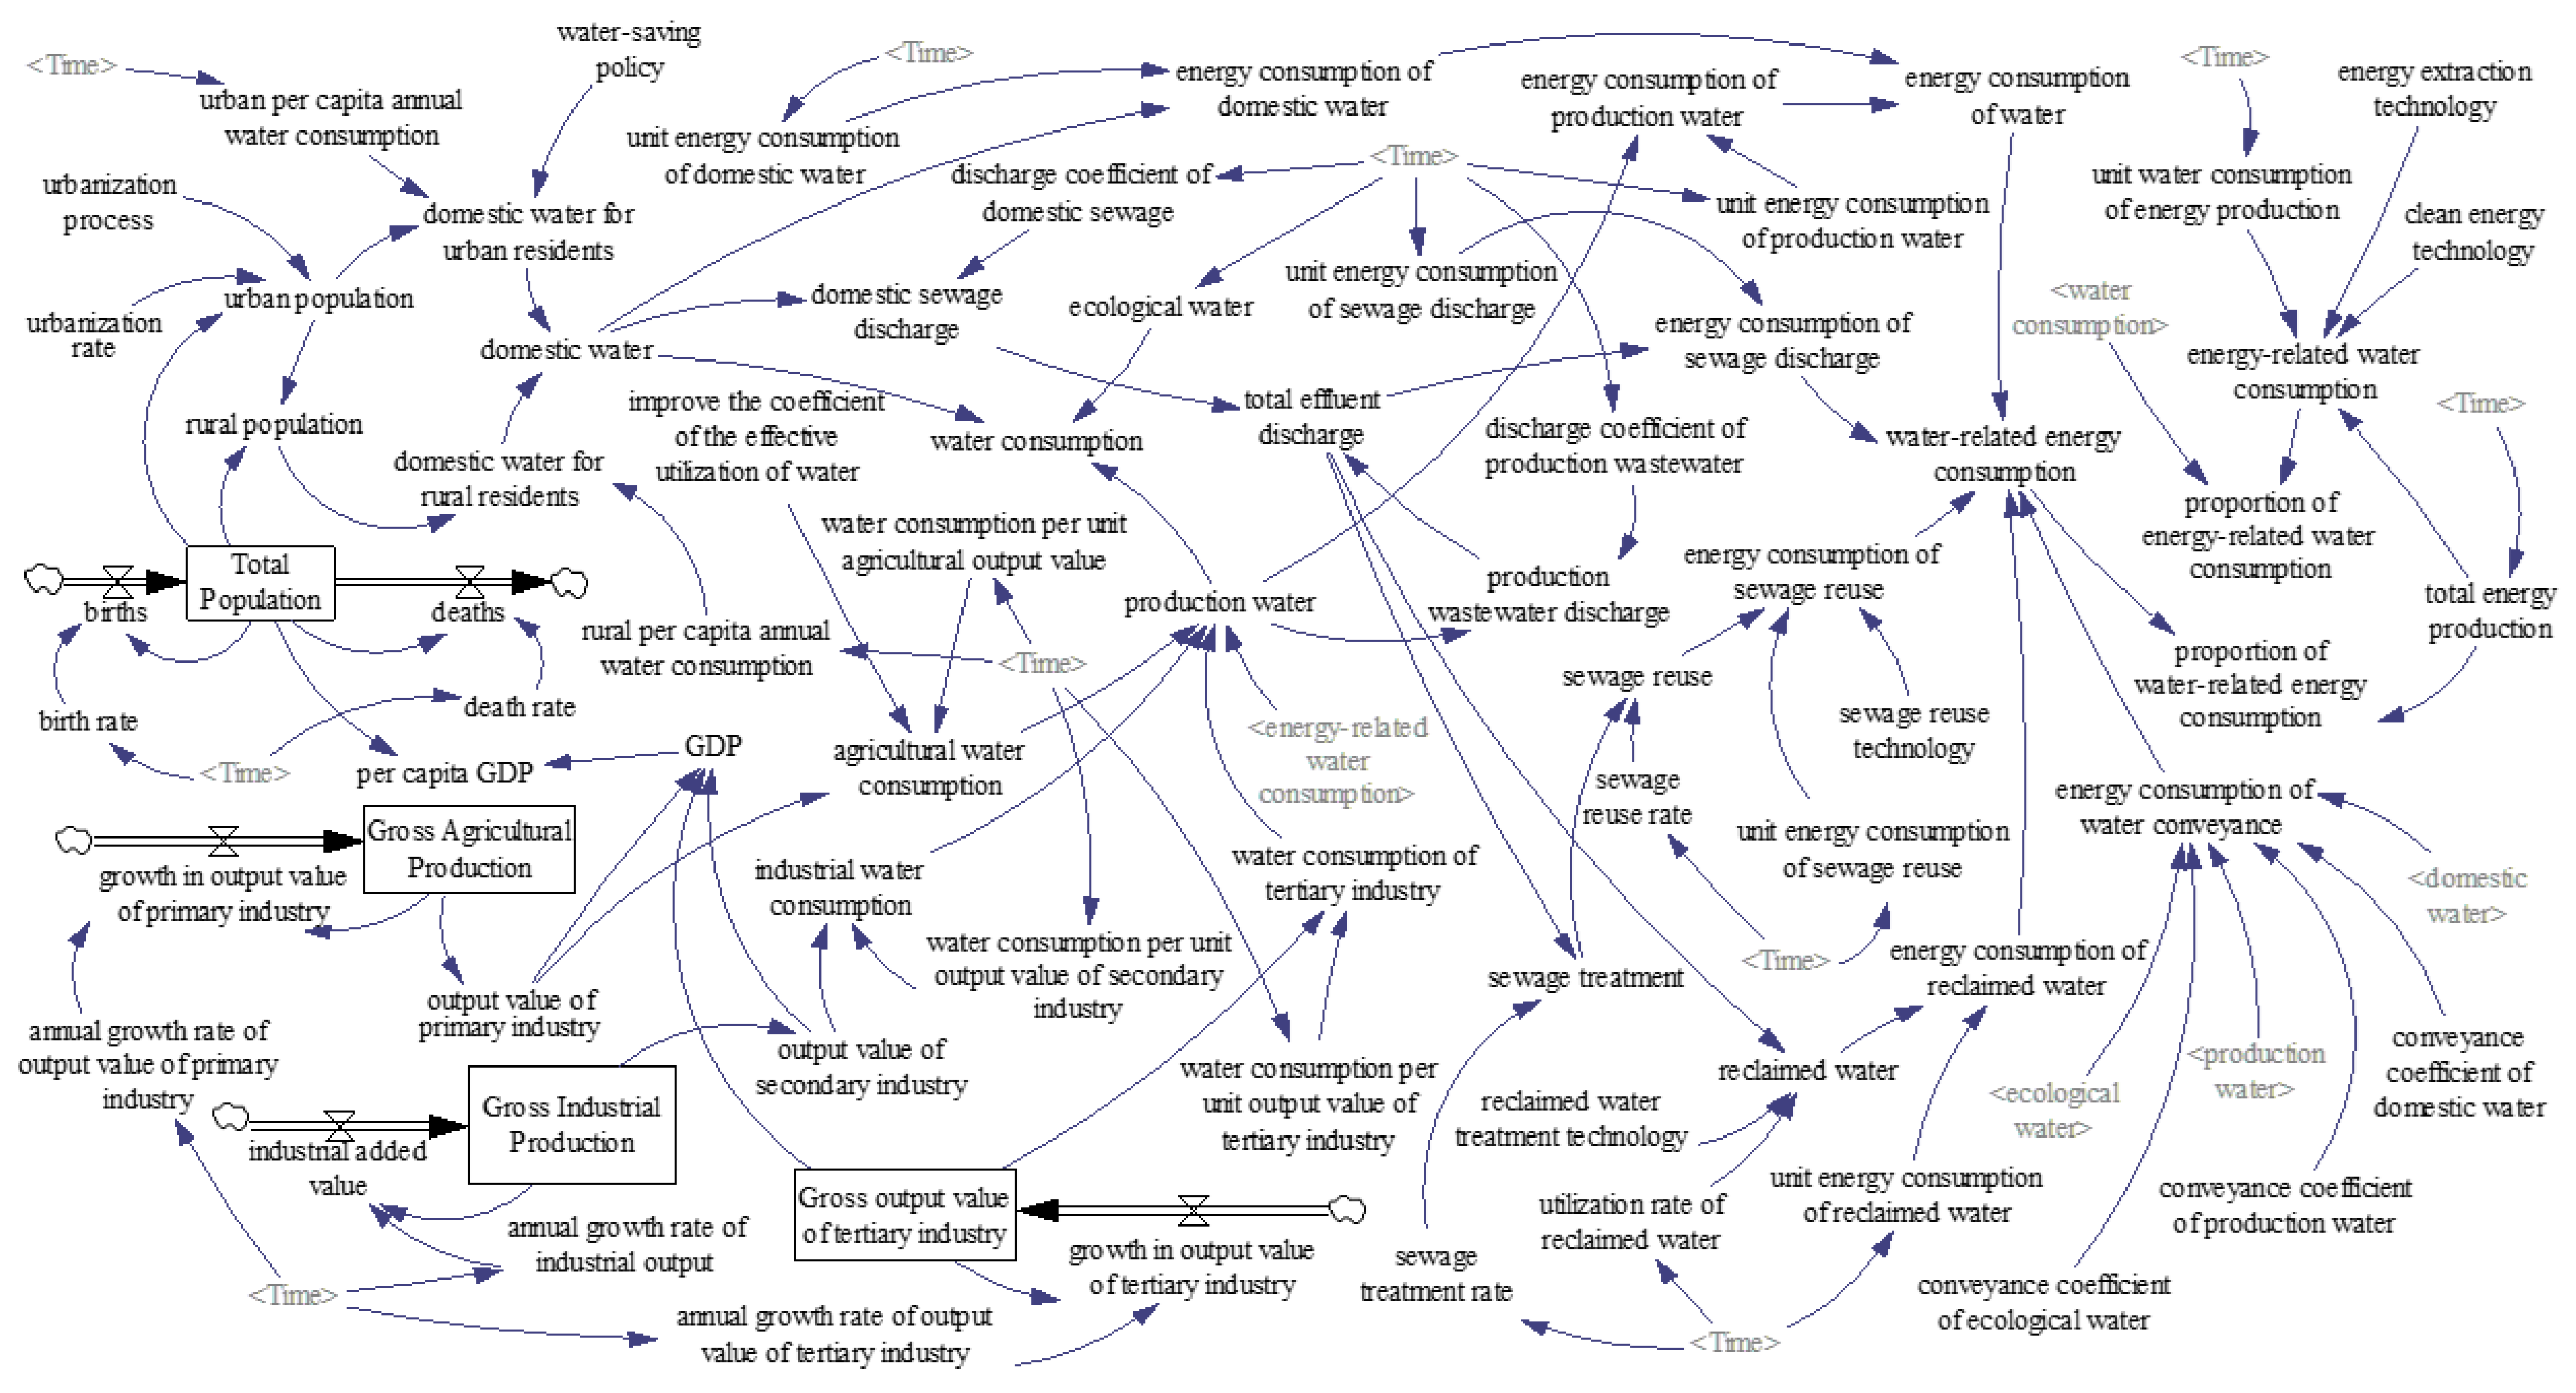
2.5.1. Causal Loop Diagram
2.5.2. Variables and Equations
2.5.3. Model Building
2.5.4. Model Checking
Unit Consistency Check
Structural Rationality Check
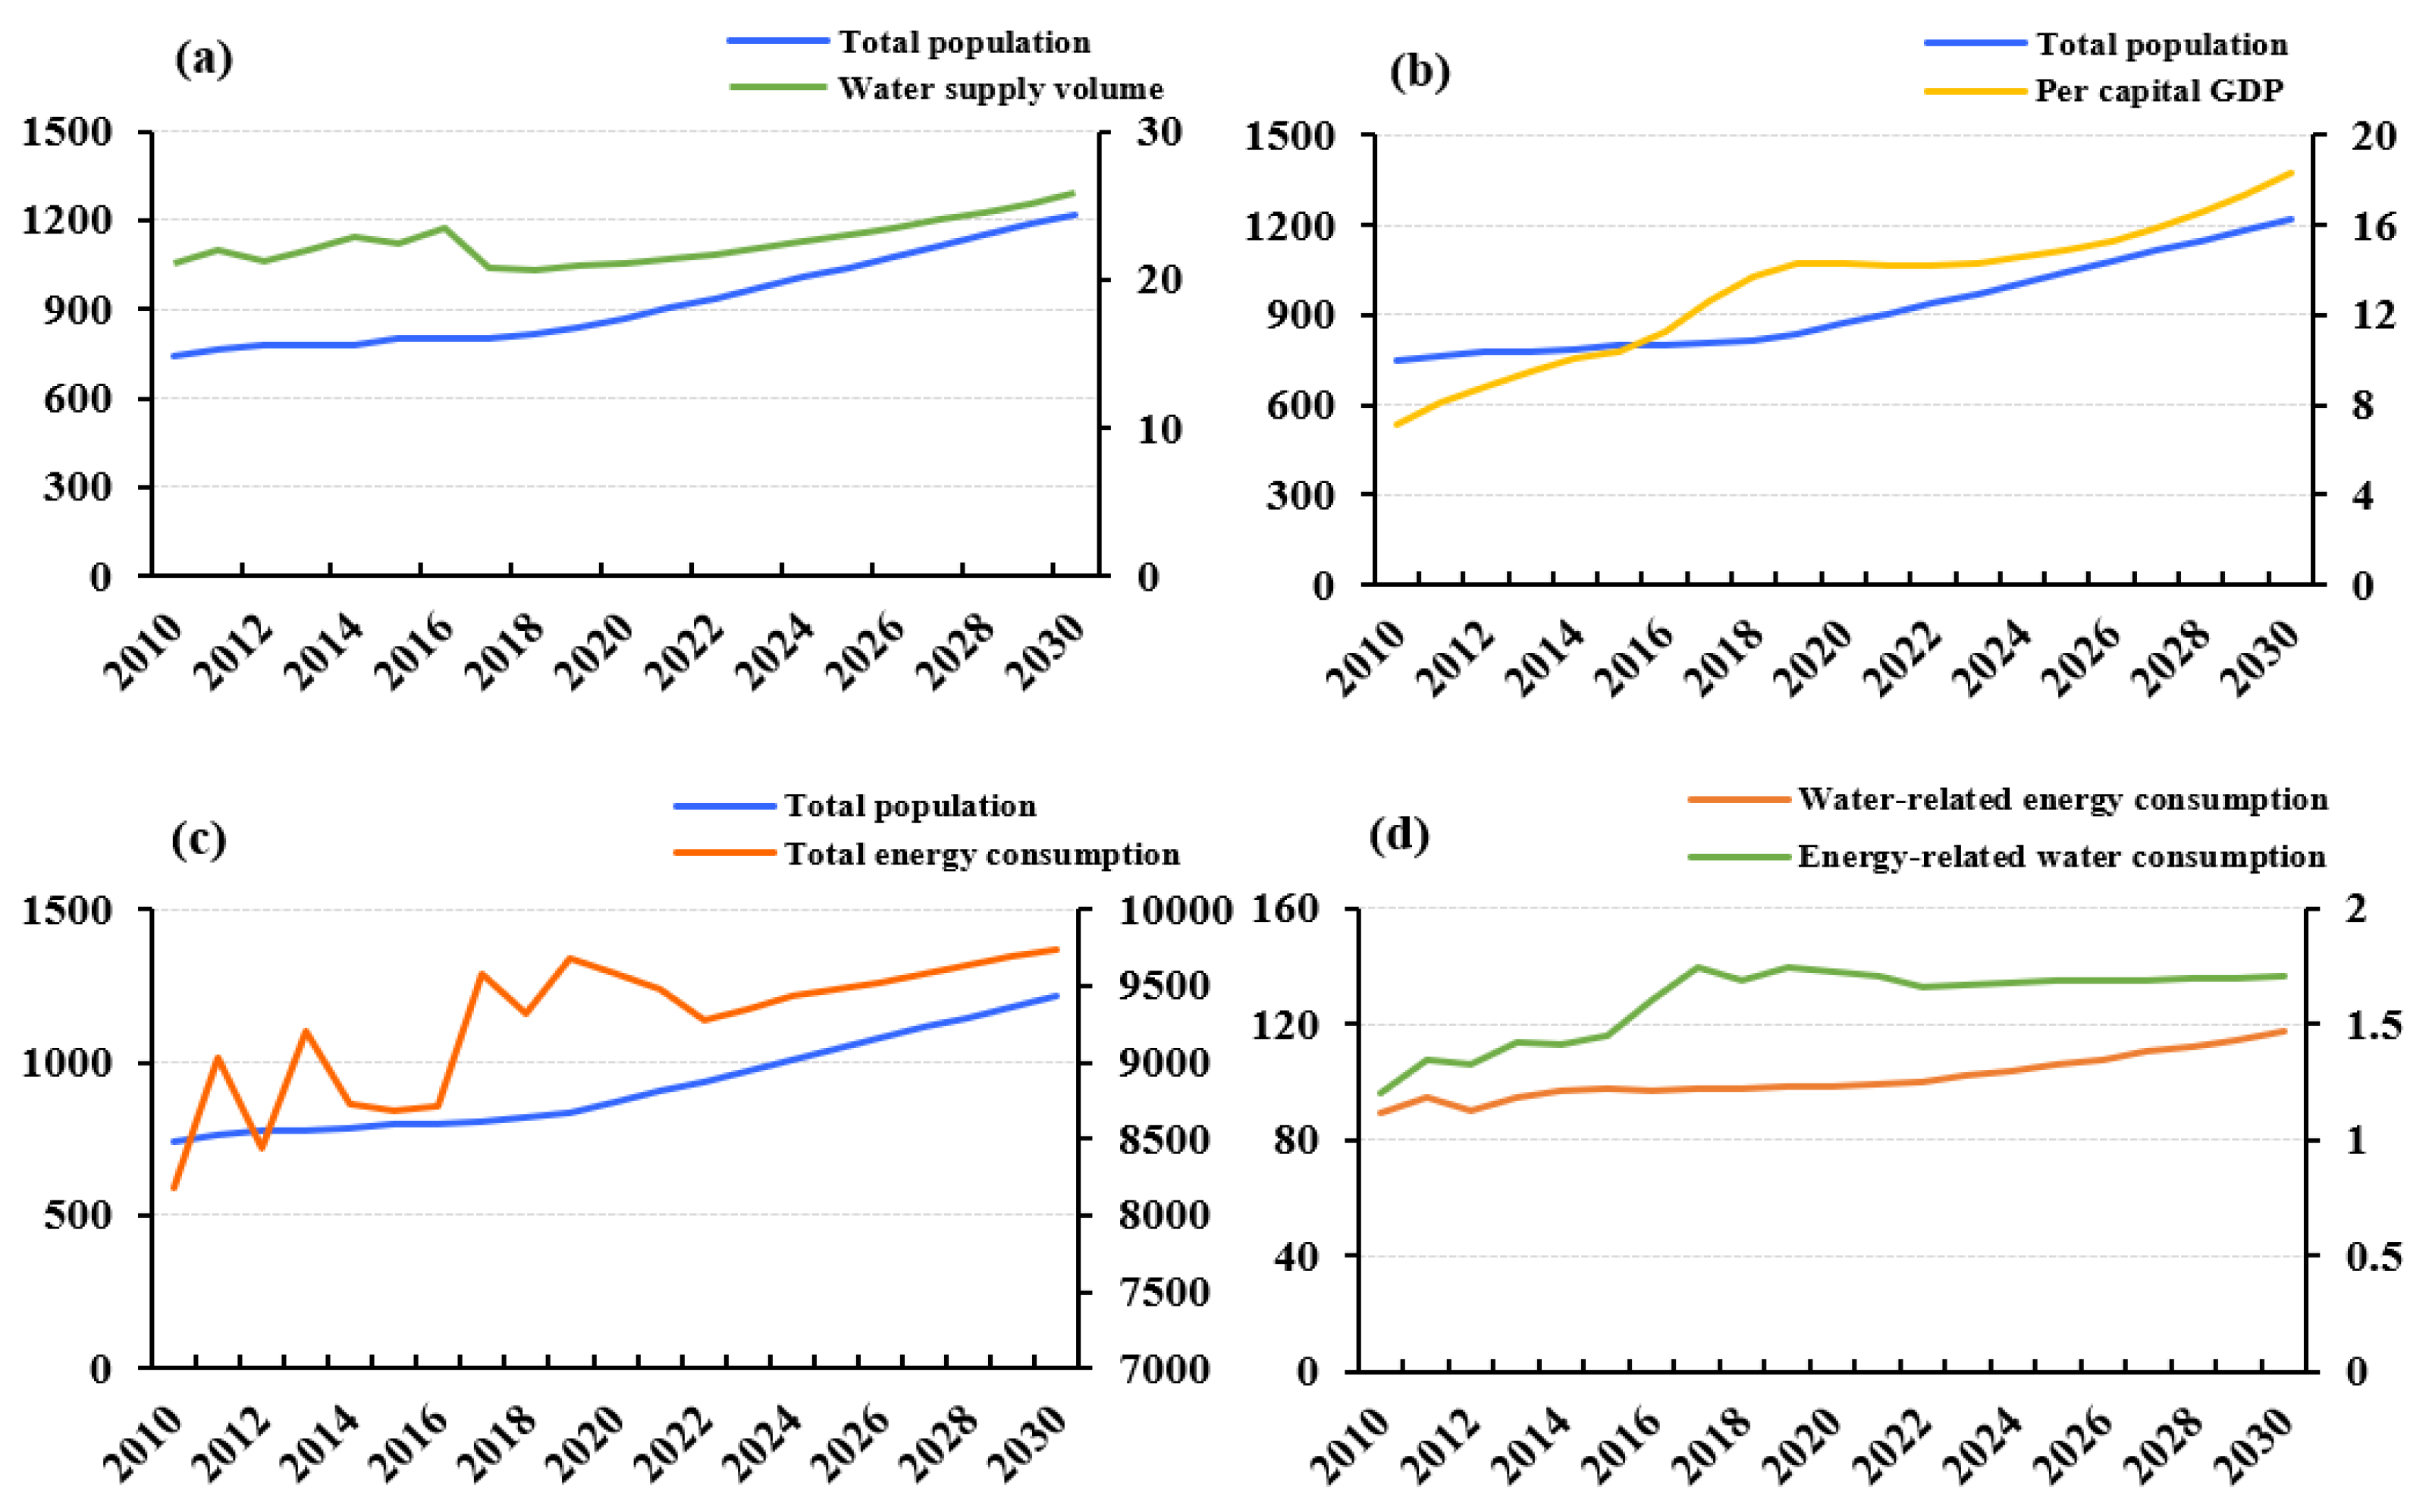
Model Validity Check
2.6. Scenario Analysis
2.6.1. Water-Saving Scenario Setting
2.6.2. Energy-Saving Scenario Setting
2.6.3. Comprehensive Scenario Setting

| Scheme | First-Level Indicators | Second-Level Indicators (Coefficient) | Parameter Setting [1,27,28,29,31] | |
|---|---|---|---|---|
| BAU | / | / | / | |
| Scenario 1 | WSS | Strengthening the control of water-saving policies | Water-saving policy | 0.6 |
| Improve the coefficient of the effective utilization of water | Coefficient of the efficient utilization of water | 1.1 | ||
| Scenario 2 | ESS | Optimization of industry energy structure | Clean energy technology | 0.85 |
| Improvement of the energy-saving-related technology level | Sewage reuse technology | 0.9 | ||
| Reclaimed water treatment technology | 1.1 | |||
| Energy extraction technology | 1.15 | |||
| Scenario 3 | CS | WSS + ESS + Continuous advancement of the urbanization process | Urbanization is advancing | 0.85 |
3. Results
3.1. Analysis of the Simulation Results of the BAU
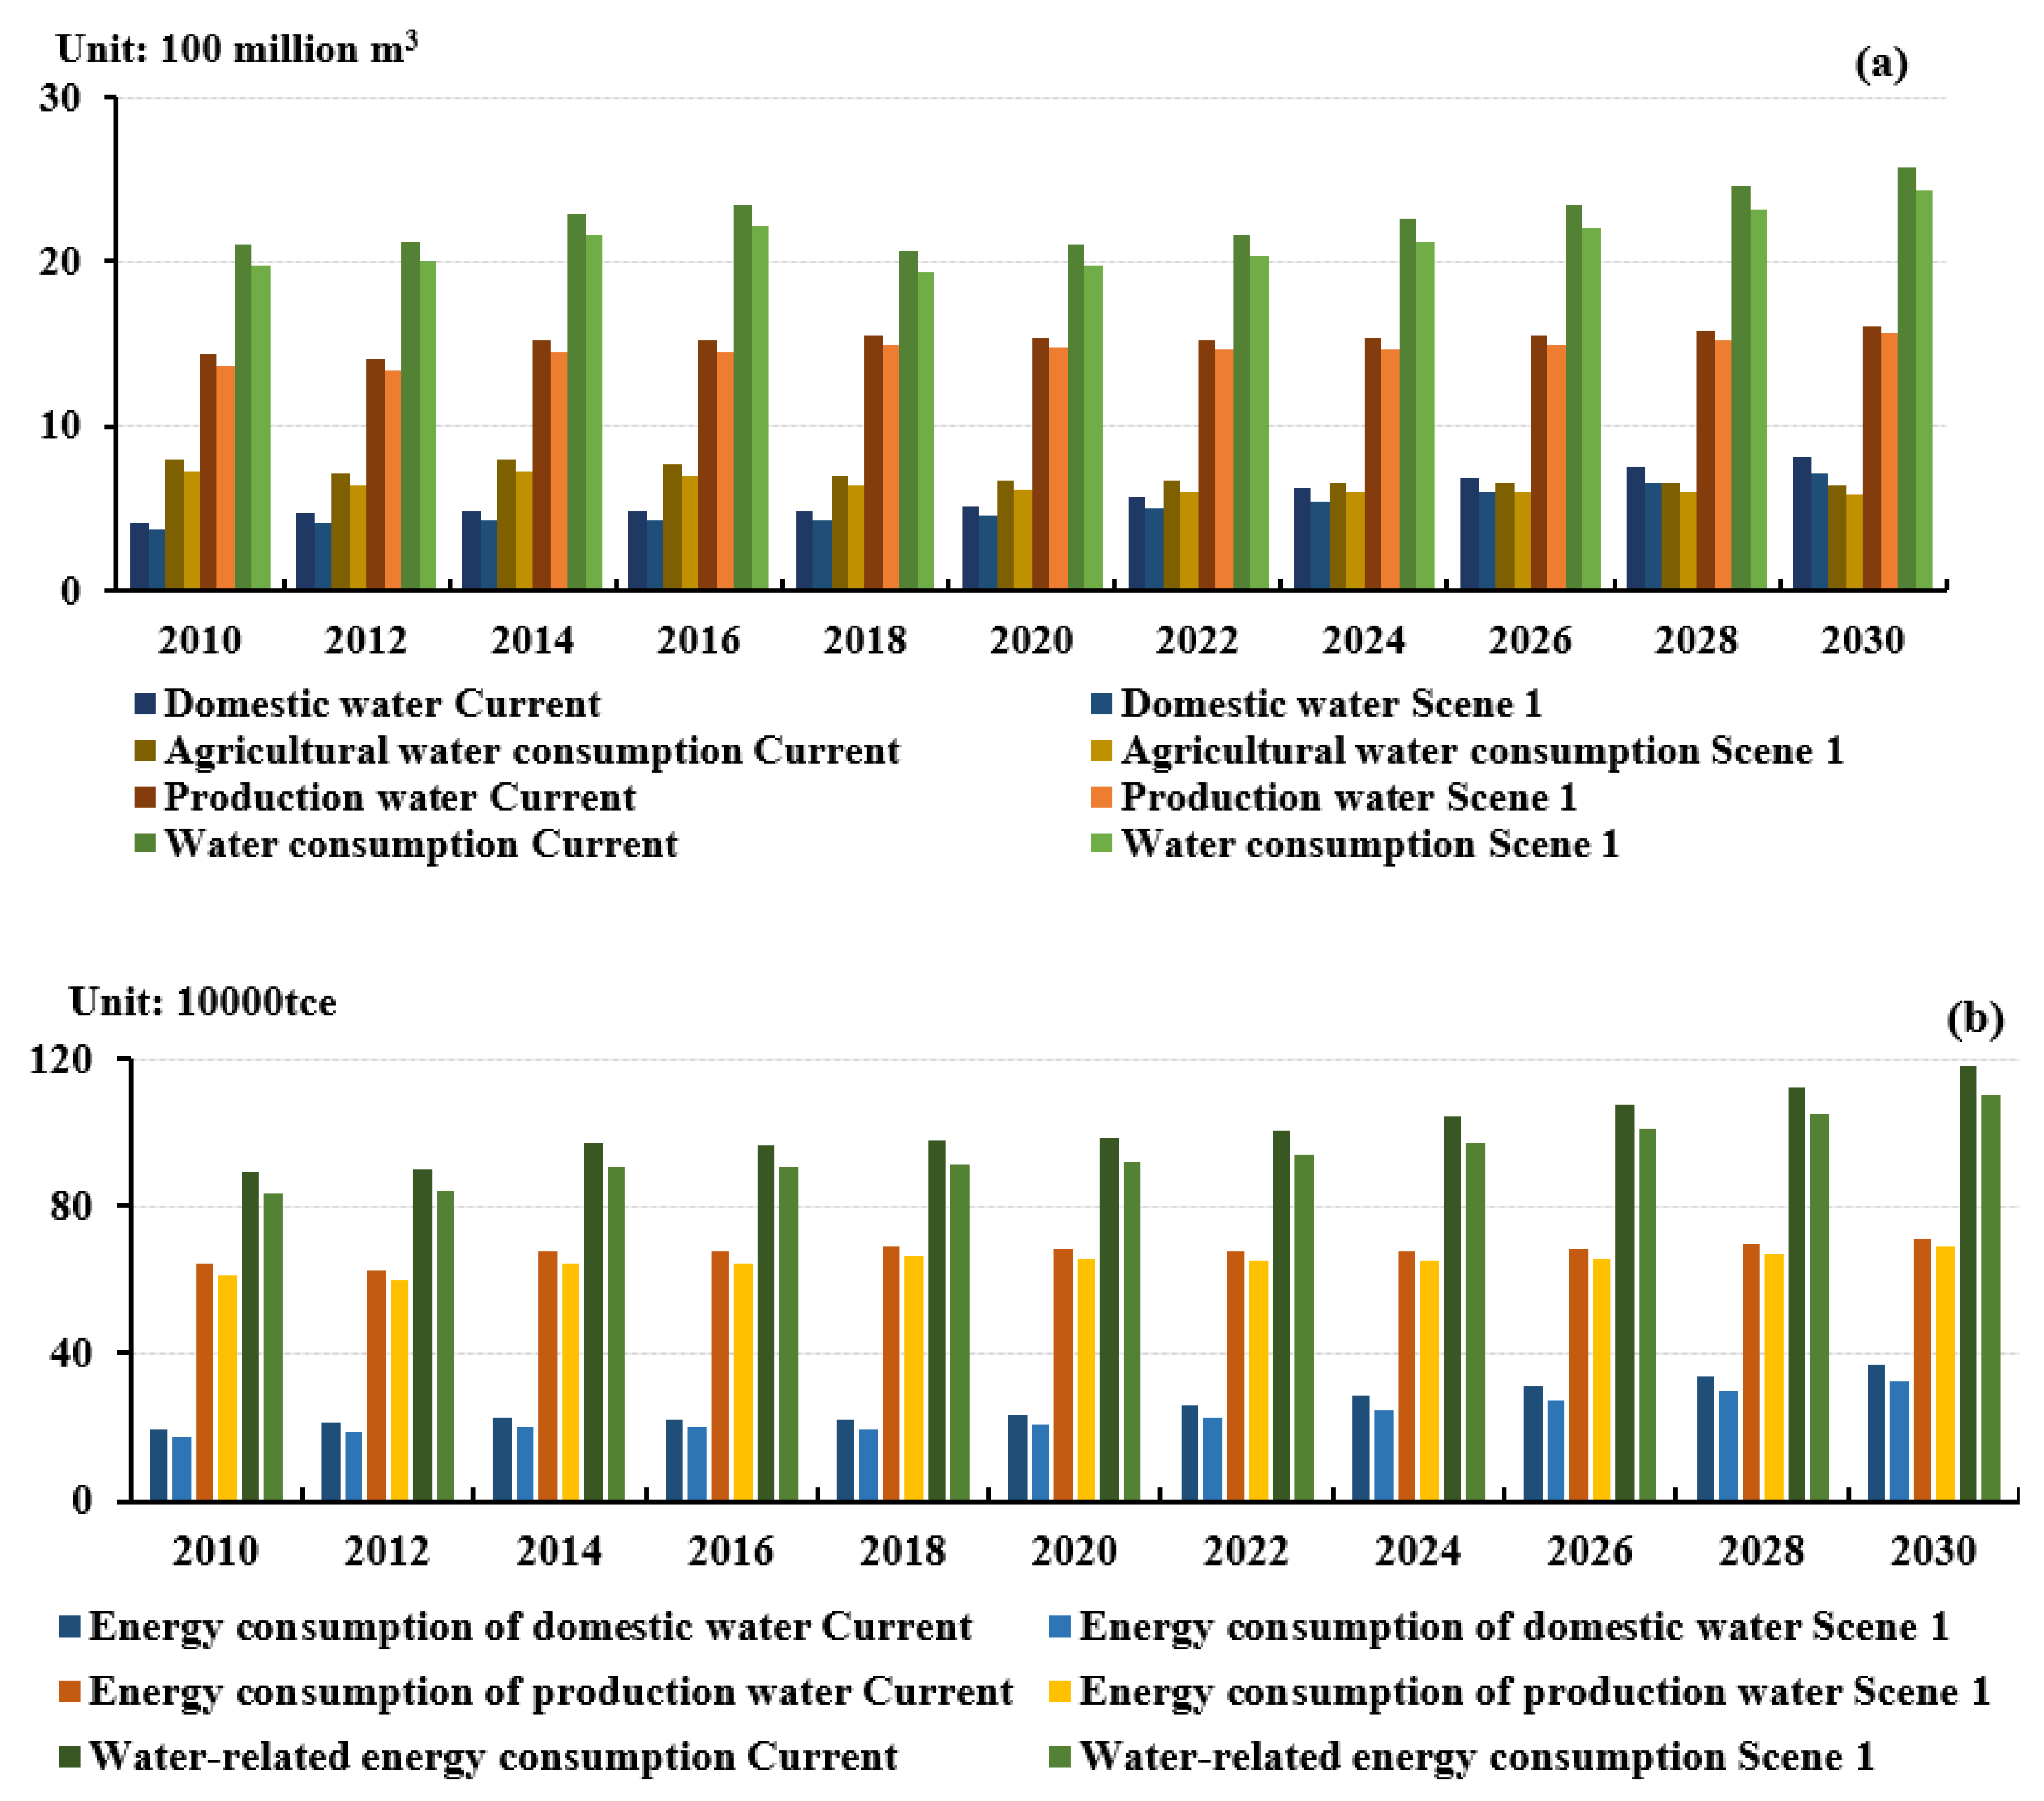
3.2. Analysis of the Simulation Results of the WSS
3.3. Analysis of the Simulation Results of the ESS
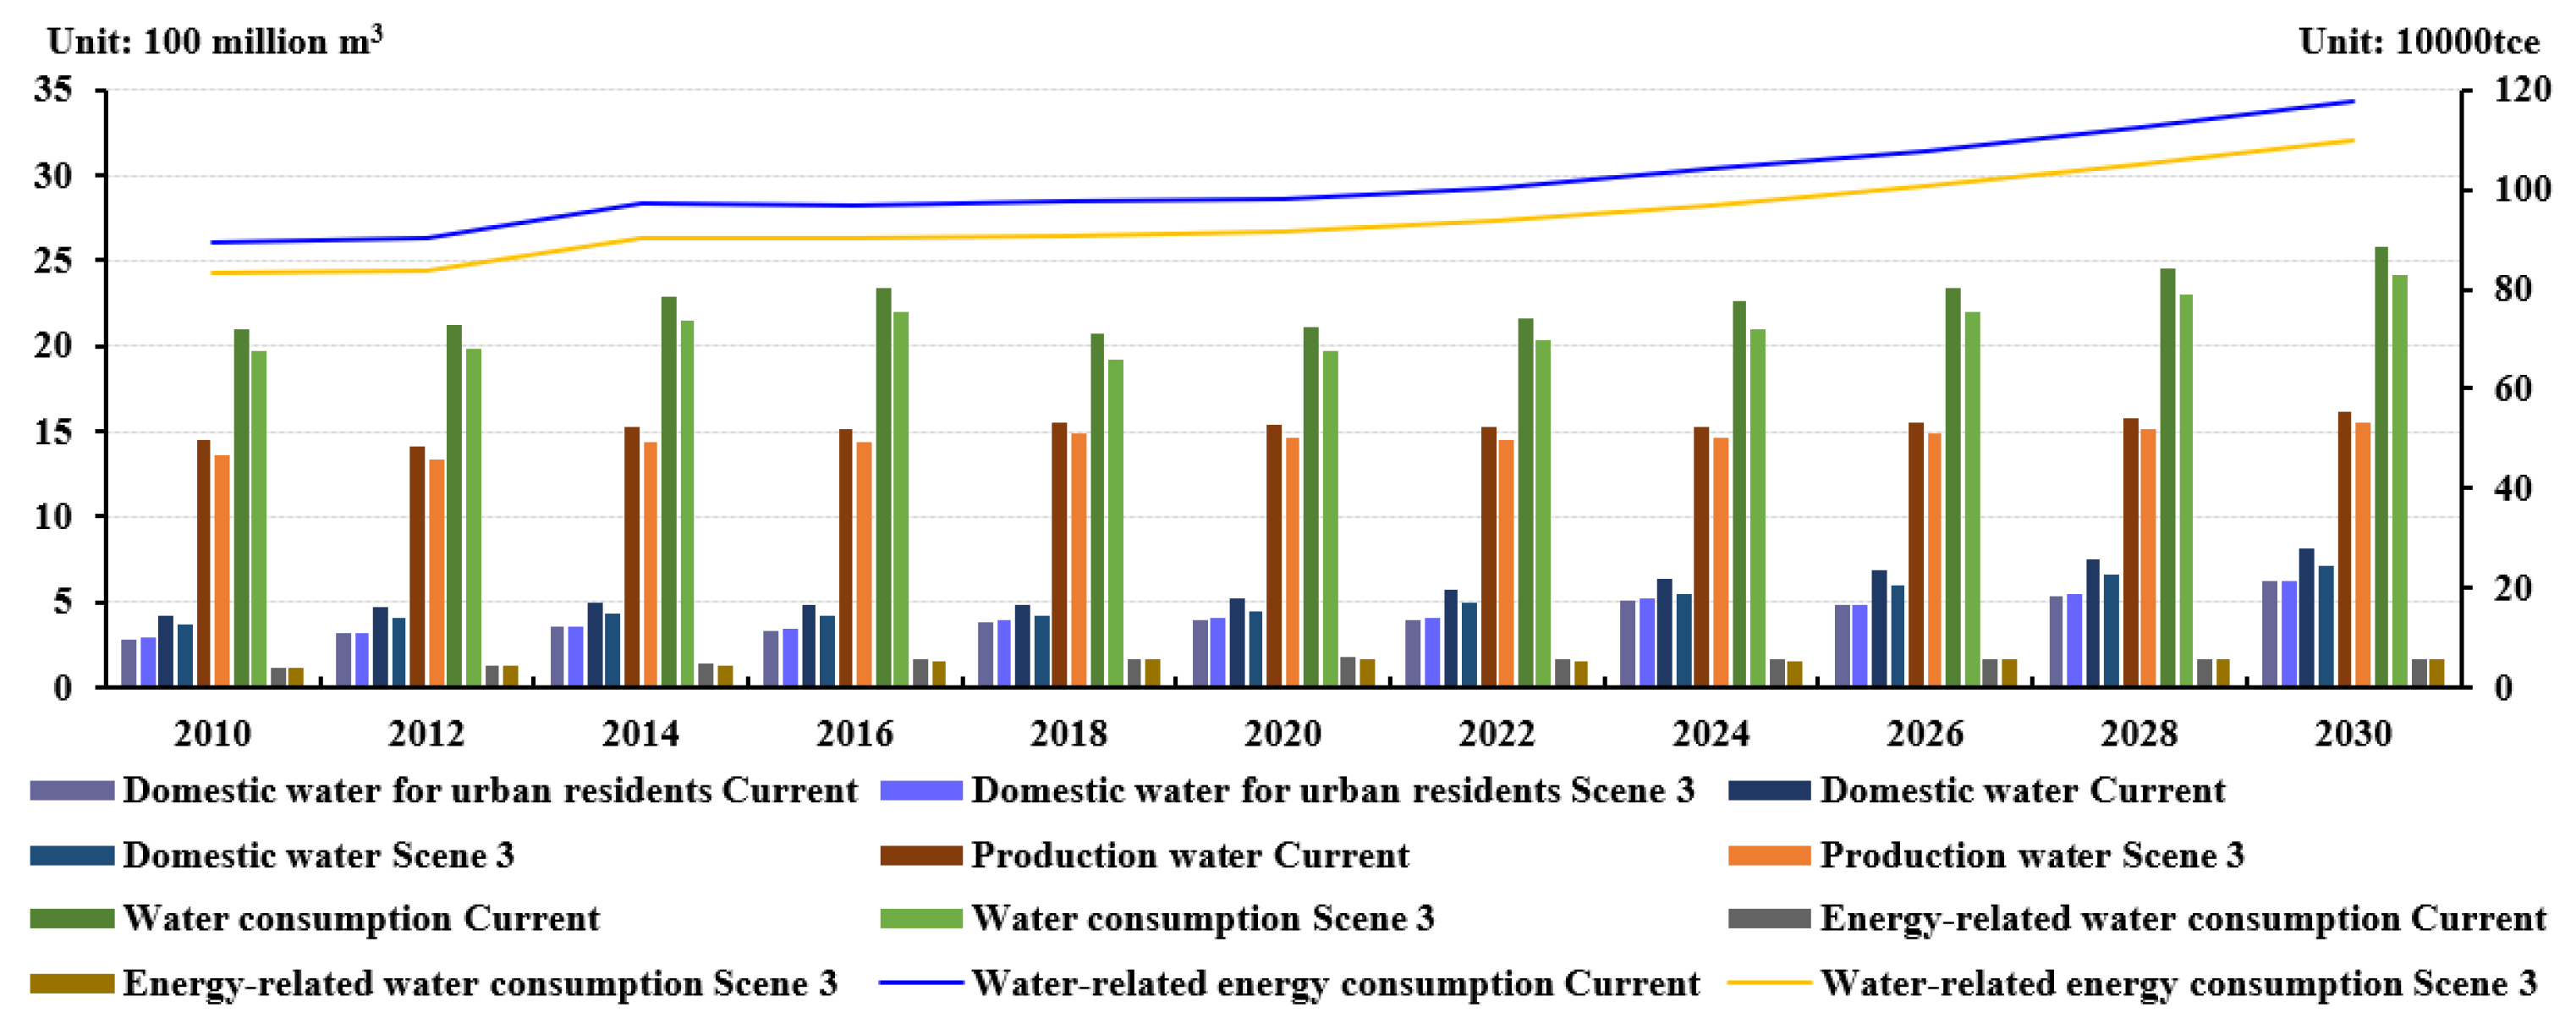
3.4. Analysis of the Simulation Results of the CS
3.5. Analysis of Multi-Scenario Simulation Results
4. Discussion
5. Conclusions
Author Contributions
Funding
Institutional Review Board Statement
Informed Consent Statement
Data Availability Statement
Conflicts of Interest
References
- Yue, Y. Coupling Analysis and Prediction of Water-Energy Nexus in Beijing. Master’s Thesis, Beijing Forestry University, Beijing, China, 2019. [Google Scholar]
- Matija, P.; Matteo, D.F.; Sebastian, B.; Ignacio, H.G.; Sylvain, Q. Water-energy nexus in African power pools—The Dispa-SET Africa model. Energy 2021, 228, 120623. [Google Scholar]
- Roxana, B.; Rodrigo, F. Energy and water policies in Chile, two different endings with implications in the water-energy nexus. Energies 2021, 14, 3286. [Google Scholar]
- Yun, L. The Research of Energy-Water Policy Cooperative Control in China Based on System Dynamics. Master’s Thesis, China University of Petroleum, Beijing, China, 2018. [Google Scholar]
- Cai, Y.; Cai, J.; Xu, L.; Tan, Q.; Xu, Q. Integrated risk analysis of water-energy nexus systems based on systems dynamics, orthogonal design and copula analysis. Renew. Sustain. Energy Rev. 2019, 99, 125–137. [Google Scholar] [CrossRef]
- Xue, F.; Xinyu, S.; Tyson, K.P.; Peng, D.; Weijun, G. The coupling coordinated development of urban environment towards sustainable urbanization: An empirical study of Shandong Peninsula, China. Ecol. Indic. 2021, 129, 107864. [Google Scholar]
- International Energy Agency. World Energy Outlook 2016; International Energy Agency: London, UK, 2016; p. 2016. [Google Scholar]
- Giyong, P.; Hana, K. Water conservation and regional equity: An Energy–Water nexus perspective on how Seoul’s efforts relieve energy burdens on electricity-producing areas. J. Clean. Prod. 2021, 305, 127222. [Google Scholar]
- Shirkey, G.; Belongeay, M.; Wu, S.; Ma, X.; Tavakol, H.; Anctil, A.; Marquette-Pyatt, S.; Stewart, R.A.; Sinha, P.; Corkish, R.; et al. An environmental and societal analysis of the US electrical energy industry based on the water–energy nexus. Energies 2021, 14, 2633. [Google Scholar] [CrossRef]
- Hui, W.; Qiong, Y.; Ping, G.; Qi, P.; Shanshan, G. Sustainable regional water allocation under water-energy nexus: A chance-constrained possibilistic mean-variance multi-objective programming. J. Clean. Prod. 2021, 313, 127934. [Google Scholar]
- Serena, R.; Enrico, M.; Çağrı, A.; Laura, E.A.; Vasileia, V.; Adriano, M.; Emanuele, F.; Battista, B.G.; Claudio, G.; Evina, K.; et al. Urban water-energy-food-climate nexus in integrated wastewater and reuse systems: Cyber-physical framework and innovations. Appl. Energy 2021, 298, 117268. [Google Scholar]
- Thuc, D.P.; Edoardo, B.; Rodney, A.S. Critical review of system dynamics modelling applications for water resources planning and management. Clean. Environ. Syst. 2021, 2, 100031. [Google Scholar]
- Naval, N.; Yusta, J.M. Water-energy management for demand charges and energy cost optimization of a pumping stations system under a renewable virtual power plant model. Energies 2020, 13, 2900. [Google Scholar] [CrossRef]
- Grafton, R.Q.; McLindin, M.; Hussey, K.; Wyrwoll, P.; Wichelns, D.; Ringler, C.; Garrick, D.; Pittock, J.; Wheeler, S.; Orr, S.; et al. Responding to global challenges in food, energy, environment and water: Risks and options assessment for decision-making. Asia Pac. Policy Stud. 2016, 3, 275–299. [Google Scholar] [CrossRef] [Green Version]
- Huai, A. China in Research on Strategy to Promote the Coordinated Development of Energy, Economy and Employment. In Proceedings of the Internet-based Business Management Conference in 2011, Wuhan, China, 7 May 2011; p. 4. [Google Scholar]
- Wen, L.Y.; Hong, S.M.; Wen, C.H. Simulation research on the ecological and economic effects for the paid use system of water resources based on system dynamics: Take Zhejiang province a case. Syst. Eng. Theory Pract. 2017, 37, 664–676. [Google Scholar]
- Ali, A.M.; Yaghoub, F. New hydro-economic system dynamics and agent-based modeling for sustainable urban groundwater management: A case study of Dehno, Yazd Province, Iran. Sustain. Cities Soc. 2021, 72, 103078. [Google Scholar]
- Yanjuan, W.; Yanzhao, Y.; Zhiming, F.; Tong, S. Exploitation, Utilization status, and development prospects of water resources in Ningbo city. J. Resour. Ecology 2017, 8, 205–211. [Google Scholar] [CrossRef]
- Ling, S.; Li, L.Z.; Jie, Y.J. Analysis on Water Consumption Structure in Ningbo. Water Resour. Hydropower Eng. 2013, 44, 12–16. [Google Scholar]
- Mehran, H.; Rachata, M. On coupled dynamics and regime shifts in coupled human–water systems. Hydrol. Sci. J. 2021, 66, 769–776. [Google Scholar]
- Abdi-Dehkordi, M.; Bozorg-Haddad, O.; Salavitabar, A.; Goharian, E. Developing a sustainability assessment framework for integrated management of water resources systems using distributed zoning and system dynamics approaches. Environ. Dev. Sustain. 2021, 1–37. [Google Scholar]
- Hao, L.; Yuhuan, Z.; Lu, Z.; Song, W.; Jianing, K.; Ya, L.; Hongxian, L.; Long, S.; Yuli, S. Dynamic characteristics and drivers of the regional household energy-carbon-water nexus in China. Environ. Sci. Pollut. Res. Int. 2021, 1–13. [Google Scholar] [CrossRef]
- Regulations of Ningbo City on the Management of Urban Water Supply and Water Saving; Ningbo City Administration: Ningbo, China, 2010; p. A04.
- Yen, P.; Kathryn, R.-S.; Ravinesh, C.D. Evaluating management strategies for sustainable crop production under changing climate conditions: A system dynamics approach. J. Environ. Manag. 2021, 292, 112790. [Google Scholar]
- Zhao, L.; Zhang, L.; Cui, N.; Liang, C.; Feng, Y. The evaluation of regional water-saving irrigation development level in humid regions of Southern China. Water 2019, 11, 172. [Google Scholar] [CrossRef] [Green Version]
- Bo, C.N.; Ping, Z.Z.; Hong, L.Y.; Zhi, G.D.; Zhi, L.X. Comprehensive evaluation model of regional agricultural water-saving development level based on TOPSIS. J. Basic Sci. Eng. 2016, 24, 978–994. [Google Scholar]
- Tian, L.; Ni, Z.Q. Calculation and analysis of effective utilization coefficient of farmland irrigation water in Ningbo city. China Water Resour. 2020, 27–29. [Google Scholar]
- Ying-Chu, C.; Hsiao-Man, L. Evaluation of greenhouse gas emissions and the feed-in tariff system of waste-to-energy facilities using a system dynamics model. Sci. Total Environ. 2021, 792, 148445. [Google Scholar]
- Yang, D.; Liu, B.; Ma, W.; Guo, Q.; Li, F.; Yang, D. Sectoral energy-carbon nexus and low-carbon policy alternatives: A case study of Ningbo, China. J. Clean. Prod. 2017, 156, 480–490. [Google Scholar] [CrossRef]
- Plan for the development of energy conservation and environmental protection industry during the 13th Five-Year Plan Period. Energy Sav. Nonferr. Metall. 2017, 33, 1–7+13.
- Chen, L.; Xu, L.; Velasco-Fernández, R.; Giampietro, M.; Yang, Z. Residential energy metabolic patterns in China: A study of the urbanization process. Energy 2020, 215, 119021. [Google Scholar] [CrossRef]
- Pei, S.; Guo Ping, T. Power problems in the process of ecological city construction in Ningbo. Renew. Energy Resour. 2005, 82–83. [Google Scholar]
- Irene, P.; Alessandro, P.; Tudorel, V.; Sangaralingam, A.; Leon, K.; Shaun, M.; Vladimir, K.; Colin, T.; Emily, O.D. A participatory system dynamics model to investigate sustainable urban water management in Ebbsfleet Garden City. Sustain. Cities Soc. 2021, 67, 102709. [Google Scholar]
- Mutao, H.; Xiaojuan, L.; Jinmeng, W. Research on regional water demand prediction of the upper and middle reaches of The Pearl River Basin based on system dynamics. IOP Conf. Ser. Earth Environ. Sci. 2021, 784, 012003. [Google Scholar]
- Gozini, H.; Zahraie, B.; Ravar, Z. System dynamics modeling of water–energy nexus for resource-saving policy assessment. Int. J. Environ. Res. 2021, 15, 349–367. [Google Scholar] [CrossRef]
- Yang, B.; Liu, Y. Evaluation on the sustainability of urbanization process based on biological footprint model. Int. J. Sustain. Develop. Plan. 2019, 14, 367–378. [Google Scholar] [CrossRef]
- Peng, Z.; Hong, Y.; Deng, W. Evaluating the sustainable development of urban built environment: Case study of Ningbo, China. IOP Conf. Ser. Earth Environ. Sci. 2019, 227, 062022. [Google Scholar] [CrossRef]
- Zhou, L.; Xu, J.F.; Xu, X.B. Construction of scientific evaluation system for energy saving and emission reduction oriented to product full life-cycle. Appl. Mech. Mater. 2013, 2279, 693–695. [Google Scholar] [CrossRef]
- Wenjuan, B.; Jiang, Y. A research on water environment pollution status and water ecological governance measures: The case of Ningbo city. IOP Conf. Ser. Earth Environ. Sci. 2020, 546, 032009. [Google Scholar] [CrossRef]
- Zhu, L.; Qin, C.; Peng, C. Analysis on energy saving and emission reduction of clean energy technology in ports. IOP Conf. Ser. Earth Environ. Sci. 2018, 121, 052060. [Google Scholar] [CrossRef]
- Yuan, B.; Ren, S.; Chen, X. Can environmental regulation promote the coordinated development of economy and environment in China’s manufacturing industry?—A panel data analysis of 28 sub-sectors. J. Clean. Prod. 2017, 149, 11–24. [Google Scholar] [CrossRef]
- Yang, Z.F.; Su, M.R.; Zhang, B.; Zhang, Y.; Hu, T.L. Limiting factor analysis and regulation for urban ecosystems—A case study of Ningbo, China. Commun. Nonlinear Sci. Numer. Simul. 2010, 15, 2701–2709. [Google Scholar] [CrossRef]
- Wu, Y.; Feng, Z.; Yang, Y. Spatial-Temporal Evolution Pattern and Future Scenario Analysis of Water Resources Carrying Capacity of Ningbo City; Springer: Singapore, 2017; pp. 3–12. [Google Scholar]


| Subsystems | Indexes | Equations |
|---|---|---|
| Society | Total population | INTEG (Births—Deaths, 744.3) |
| Births | Total population × Birth rate | |
| Deaths | Total population × Death rate | |
| Urban population | Total population × Urbanization rate × urbanization process/0.7 | |
| Rural population | Total population—Urban population | |
| Urbanization rate | 0.7 + RANDOM NORMAL (−0.09, 0.09, 0, 0.78, 2) | |
| Economic | Gross agricultural production | INTEG (Growth in output value of primary industry, 216.66) |
| Output value of primary industrial | Gross agricultural production | |
| Gross industrial production | INTEG (Industrial added value, 2915.09) | |
| Output value of secondary industrial | Gross industrial production | |
| Gross output value of tertiary industrial | INTEG (Growth in output value of tertiary industry, 2132.95) | |
| GDP | Output value of primary industrial + Output value of secondary industrial + Gross output value of tertiary industrial | |
| Per capita GDP | GDP/Total population | |
| Water | Domestic water for urban residents | Urban population × Urban per capita annual water consumption/ 10,000 × 0.5/Water-saving policy |
| Domestic water for rural residents | Rural population × Rural per capita annual water consumption/10,000 | |
| Domestic water | Domestic water for urban residents + Domestic water for rural residents | |
| Agricultural water consumption | Water consumption per unit agricultural output value × Output value of primary industrial/Improve the effective utilization coefficient of water | |
| Industrial water consumption | Water consumption per unit output value of secondary industry × Output value of secondary industrial | |
| Water consumption of tertiary industry | Water consumption per unit output value of tertiary industry × Gross output value of tertiary industrial | |
| Production water | Agricultural water consumption + Industrial water consumption + water consumption of tertiary industry +Energy-related water consumption | |
| Ecological water | WITH LOOKUP (Time, ([(2001, 0)—(2030, 10)], (2001, 1.1), (2006, 1.33), (2007, 1.19), (2008, 1.75), (2009, 1.83), (2010, 2.38), (2011, 2.14), (2012, 2.47), (2013, 2.41), (2014, 2.74), (2015, 2.57), (2016, 3.39), (2017, 0.25), (2018, 0.24), (2019, 0.24), (2020, 0.58), (2030, 1.5))) | |
| Water consumption | Domestic water + Production water + Ecological water | |
| Domestic sewage discharge | Domestic water × Discharge coefficient of domestic sewage | |
| Production wastewater discharge | Production water × Discharge coefficient of production wastewater | |
| Total effluent discharge | Domestic sewage discharge + Production wastewater discharge | |
| Sewage treatment | Total effluent discharge × Sewage treatment rate | |
| Sewage reuse | Sewage treatment × Sewage reuse rate | |
| Reclaimed water | Total effluent discharge × Utilization rate of reclaimed water × Reclaimed water treatment technology/0.8 | |
| Energy | Energy consumption of domestic water | Unit energy consumption of domestic water × Domestic water |
| Energy consumption of production water | Unit energy consumption of production water × Production water | |
| Energy consumption of water | Energy consumption of domestic water + Energy consumption of production water | |
| Energy consumption of sewage discharge | Unit energy consumption of sewage discharge × Total effluent discharge | |
| Energy consumption of sewage reuse | Unit energy consumption of sewage reuse × Sewage reuse × 0.8/Sewage reuse technology | |
| Energy consumption of reclaimed water | Unit energy consumption of reclaimed water × Reclaimed water | |
| Energy consumption of water conveyance | Domestic water × Conveyance coefficient of domestic water + Production water × Conveyance coefficient of production water + Ecological water × Conveyance coefficient of ecological water | |
| Water-related energy consumption | Energy consumption of water + Energy consumption of water conveyance + Energy consumption of sewage discharge + Energy consumption of sewage reuse + Energy consumption of reclaimed water | |
| Proportion of water-related energy consumption | Water-related energy consumption /Total energy production | |
| Energy-related water consumption | Unit water consumption of energy production × Total energy production/10,000 × (Energy extraction technology × (0.7/Clean energy technology)) | |
| Proportion of energy-related water consumption | Energy-related water consumption /Water consumption |
| Input Layer | Middle Layer | Result Layer |
|---|---|---|
| Total population | Per capita GDP | / |
| Rural population | Domestic water for rural residents | |
| Births | (Total population) | |
| Urban population | (Rural population) | |
| Domestic water for urban residents | ||
| Deaths | (Total population) |
| Cause Layer | Middle Layer | Output Layer |
|---|---|---|
| Agricultural water consumption | Production water | Water consumption |
| Industrial water consumption | ||
| Water consumption of tertiary industry | ||
| Energy-related water consumption | ||
| Time | Ecological water | |
| Domestic water for rural residents | Domestic water | |
| Domestic water for urban residents |
| Cause Layer | Middle Layer | Output Layer |
|---|---|---|
| reclaimed water | Energy consumption of reclaimed water | Water-related energy consumption |
| Unit energy consumption of reclaimed water | ||
| Unit energy consumption of sewage reuse | Energy consumption of sewage reuse | |
| Sewage reuse technology | ||
| Sewage reuse | ||
| Total effluent discharge | Energy consumption of sewage discharge | |
| Unit energy consumption of sewage discharge | ||
| Energy consumption of production water | Energy consumption of water | |
| Energy consumption of domestic water | ||
| Production water | Energy consumption of water conveyance | |
| Conveyance coefficient of production water | ||
| Domestic water | ||
| Conveyance coefficient of domestic water | ||
| Ecological water | ||
| Conveyance coefficient of ecological water |
| Index | Total Population /10,000 People | GDP /10,000 Yuan | Water Consumption/100 Million | Domestic Water /100 Million | Production Water/100 Million | Sewage Reuse/100 Million |
|---|---|---|---|---|---|---|
| % | Relative Error | Relative Error | Relative Error | Relative Error | Relative Error | Relative Error |
| 2010 | 0.00 | 0.00 | 1.04 | 4.92 | 0.02 | 0.32 |
| 2011 | 0.04 | 0.03 | 0.26 | 4.45 | 1.75 | 0.51 |
| 2012 | 1.98 | 0.00 | 0.54 | 0.15 | 0.86 | 0.58 |
| 2013 | 1.98 | 0.01 | 0.72 | 0.46 | 1.22 | 0.19 |
| 2014 | 0.14 | 0.00 | 0.14 | 0.28 | 0.12 | 0.27 |
| 2015 | 1.96 | 0.02 | 2.25 | 0.79 | 3.58 | 0.44 |
| 2016 | 1.45 | 0.05 | 0.09 | 0.10 | 0.10 | 0.47 |
| 2017 | 0.47 | 0.04 | 0.97 | 0.95 | 1.59 | 0.91 |
| 2018 | 0.35 | 0.05 | 0.29 | 1.62 | 0.12 | 0.31 |
| 2019 | 2.00 | 0.04 | 2.37 | 1.61 | 3.72 | 1.75 |
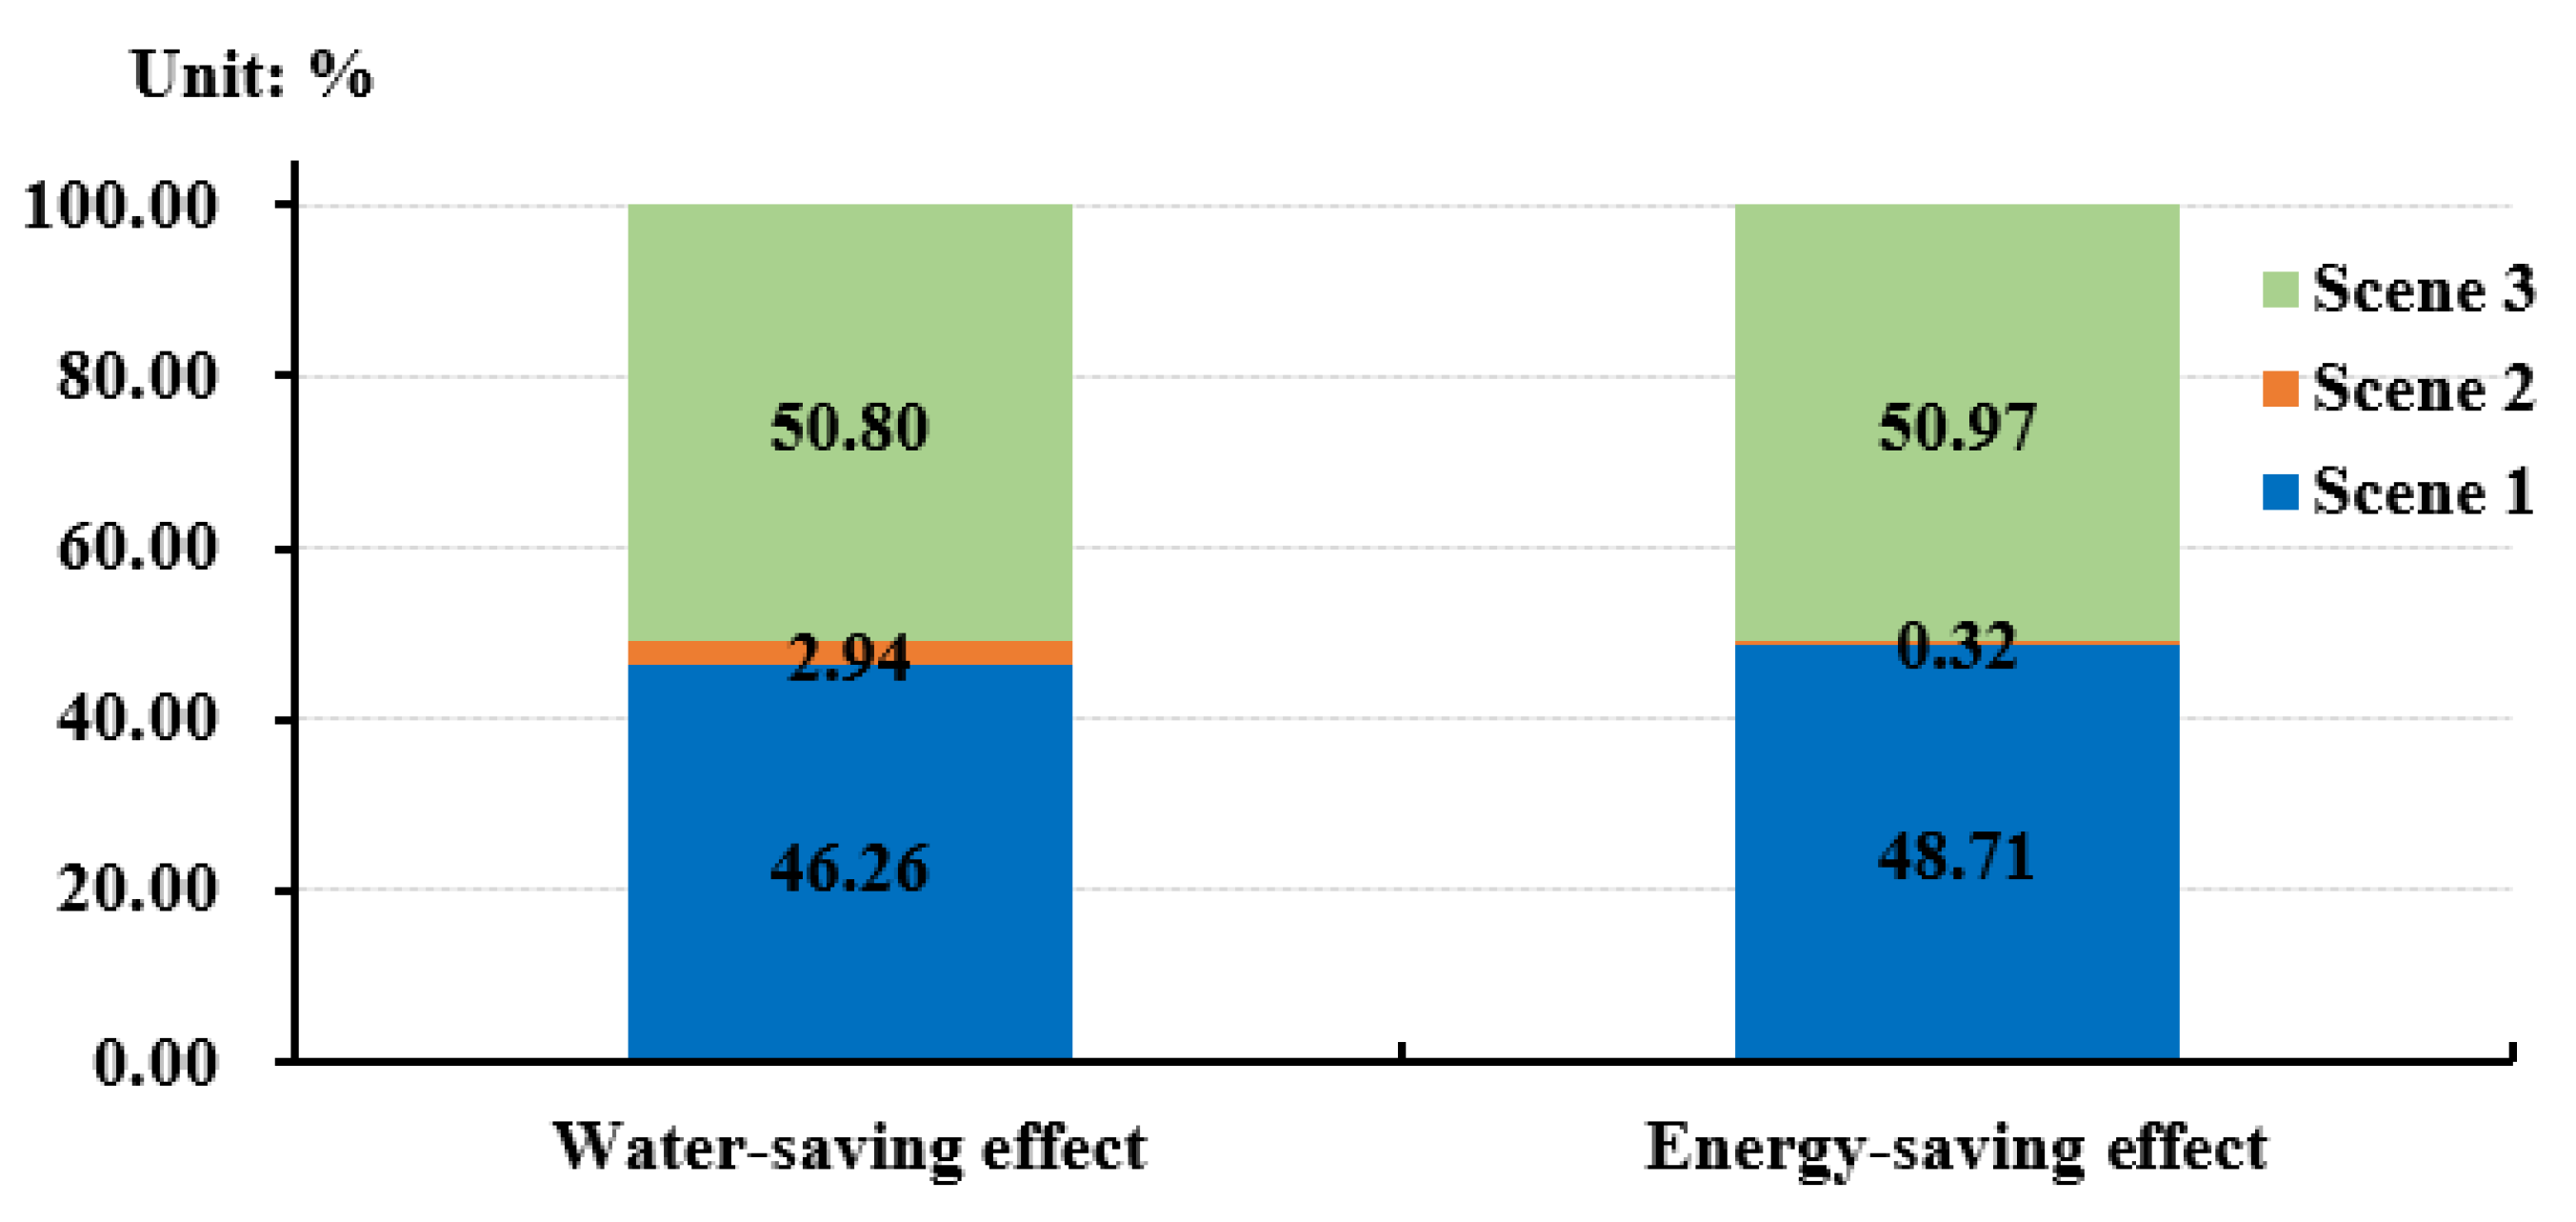
| Scenario Setting | Changes in Water and Energy Consumption | WS and ES Effect | ||
|---|---|---|---|---|
| Water-Saving | Energy-Saving | |||
| WSS | Water-saving policy | All decrease | 46.26% | 48.71% |
| Improve the coefficient of the effective utilization of water | ||||
| ESS | Optimization of industry energy structure | All decrease | 2.94% | 0.32% |
| Improvement of energy-saving-related technology | ||||
| CS | WSS + ESS + Continuous advancement of the urbanization process | All decrease | 50.8% | 50.97% |
Publisher’s Note: MDPI stays neutral with regard to jurisdictional claims in published maps and institutional affiliations. |
© 2021 by the authors. Licensee MDPI, Basel, Switzerland. This article is an open access article distributed under the terms and conditions of the Creative Commons Attribution (CC BY) license (https://creativecommons.org/licenses/by/4.0/).
Share and Cite
Yin, Y.; Lin, G.; Jiang, D.; Fu, J.; Dong, D. Multi-Scenario Simulation of a Water–Energy Coupling System Based on System Dynamics: A Case Study of Ningbo City. Energies 2021, 14, 5854. https://doi.org/10.3390/en14185854
Yin Y, Lin G, Jiang D, Fu J, Dong D. Multi-Scenario Simulation of a Water–Energy Coupling System Based on System Dynamics: A Case Study of Ningbo City. Energies. 2021; 14(18):5854. https://doi.org/10.3390/en14185854
Chicago/Turabian StyleYin, Yitong, Gang Lin, Dong Jiang, Jingying Fu, and Donglin Dong. 2021. "Multi-Scenario Simulation of a Water–Energy Coupling System Based on System Dynamics: A Case Study of Ningbo City" Energies 14, no. 18: 5854. https://doi.org/10.3390/en14185854
APA StyleYin, Y., Lin, G., Jiang, D., Fu, J., & Dong, D. (2021). Multi-Scenario Simulation of a Water–Energy Coupling System Based on System Dynamics: A Case Study of Ningbo City. Energies, 14(18), 5854. https://doi.org/10.3390/en14185854