Article

Exploring the Relationship between Residential CO2 Emissions, Urbanization, Economic Growth, and Residential Energy Consumption: Evidence from the North Africa Region

1
Department of Engineering, Industrial Management and Innovation, Faculté des Sciences et Techniques, Settat 26000, Morocco
2
Department of Industrial and Computer Engineering, Ecole Supérieure de Technologie, Safi 46000, Morocco
*
Author to whom correspondence should be addressed.
Energies 2021, 14(18), 5849; https://doi.org/10.3390/en14185849
Submission received: 17 August 2021 / Revised: 8 September 2021 / Accepted: 8 September 2021 / Published: 15 September 2021
(This article belongs to the Special Issue Energy Efficiency and Shadow Pricing)

Abstract

:
Rapid urbanization, coupled with income growth, will inevitably cause the residential energy consumption in the North Africa region to continue to increase, with adverse effects on the climate, human health, and the economy. In these regards, this paper explores the relationship between residential carbon dioxide emissions (RCO2), urbanization, economic growth, and residential energy use in four North African countries (Morocco, Tunisia, Algeria, and Egypt) over the period 1990–2016. To do this, we used the bounds cointegration and the Toda–Yamamoto Granger causality test. The existence of cointegration relationships was confirmed for the four countries. In the long run, the environment Kuznets curve relationship between increased income per capita and RCO2 emissions was verified for only Morocco and Tunisia. The causality analysis also reveals a combination of neutral, unidirectional, and bidirectional relationships for all countries. The RCO2 emissions have not proved to be a limiting factor in any country’s economic growth. The findings of this study certainly contribute to advancing the existing literature by emphasizing the income–pollution nexus in African countries. Policy makers and government regulators should implement the necessary policies that accelerate the development of renewable technologies to drive sustainable cooling and heating as well as water management.

1. Introduction

In the context of global climatic warming and the consequences of greenhouse gas emissions on the whole planet, understanding the social and economic growth impact on the environment becomes crucial, especially for developing countries. The North Africa region has undergone substantial economic and demographic growth over the last 10 years, which is anchored in the sense of global warming. While the region is a weak greenhouse gas emitter [1], it remains vulnerable to the effect of climate crisis, and its natural resources are under rising threat. The region of North Africa, conscious of this fact, is strongly committed to combating climate change. The countries of the region have adopted numerous sectoral strategies that incorporate the environmental dimension into various main economic areas, such as energy [2,3], transport [4], agriculture [5], etc.
As in developed countries, more systematic and comprehensive energy and environmental studies must be carried out in African countries. These studies should target all sectors that contribute to GHG greenhouse gas emissions, especially the building sector, which contributes 28% of the world’s total carbon emissions [6]. Thus, the housing stock provides tremendous potential for CO2 emissions reduction [7,8]. Residential energy consumption (REC) in the North Africa region has continued to grow since 2000 and attained 30,481 Ktoe in 2016 [1], representing an average annual growth rate of 3.87%. Demand growth is explained by the conjunction and combination of several factors: the improvement of living conditions, the modernization, the decrease in household size, and the introduction of new uses in homes. Meanwhile, over the period 2000–2016, a 3.5% annual increase in CO2 emissions was induced by REC. The region’s absolute share of total residential pollution achieved 17.6% in 2016 [1]. In fact, the residential sector is the fourth main source of CO2 emissions in the North Africa region, after the electric power, transport, and industrial sectors. As a result of rapid urbanization, coupled with per capita GDP growth, residential energy consumption will inevitably continue to increase, with adverse effects on the climate, human health, and the economy.
Researchers have focused more on examining gross term energy use and CO2 emissions in the existing literature while ignoring the gap between the residential sector and other production sectors [9]. Therefore, the current study is an attempt to empirically examine the residential CO2 emissions, urbanization, GDP, and REC nexus in the North Africa region. Using annual data from 1990 to 2016, the study’s goal is presented under the assumption that (i) REC boosts residential pollutant emissions in the North Africa region, (ii) high incomes are the main generator for pollutant emissions in the North Africa region, and (iii) a dynamic and causal nexus exists between REC, urbanization, income, and RCO2 emissions in the North Africa region. By primarily addressing the influence of urbanization and wealth on environmental pollution in the North Africa region, this study is intended to fill the gaps in the previous studies of Poumanyvong et al. (2012) [10] and Boukhelkhal et al. (2018) [11]. This study differs from the earlier studies in that it employs distinct regression models for each country based on their unique features. While Algeria and Egypt are energy producers and exporters, Morocco and Tunisia are highly dependent on energy imports (93% for Morocco; 48% for Tunisia in 2018) [1]. With panel regression models, such features are hard to capture. Furthermore, the research sought to determine whether there was an EKC association between environmental pollution and economic development, as several prior studies had failed to do so. Finally, a rigorous interpretation can be yielded from the integrated use of the econometric techniques such as the autoregressive distributed lag (ARDL) bounds testing approach to cointegration, ARDL short and long-run estimations, and the Toda–Yamamoto Granger causality testing [12].
The remainder of this paper is structured as follows: The literature review is stated in Section 2; Section 3 presents the sources of data and methods employed in the analysis; Section 4 focuses on empirical findings and discussions, and the key conclusions and policy recommendations are given in Section 5.

2. Review of Related Literature

There has been little attention paid to the nexus among RCO2 emissions, urbanization, and economic growth in the existing literature. Most studies have examined the scale or influential factors of emissions from the residential sector. For instance, Venkataraman et al. [13] conducted a study on residential biofuels, and they reported that the primary contributor of black carbon emissions in India is biofuel combustion in particular. They concluded that controlling biofuels consumption would help in the mitigation of climate change in South Asia. Liu et al. [14] performed an analysis of rural RCO2 emissions in China, which revealed that traditional biomass use presents the greatest potential for GHG mitigation. Still, in China, Zhu et al. [15] used the structural decomposition method to examine the residential indirect CO2 emissions from 1992 to 2005. They found that the use of residential energy has a positive and dominant role in the promotion of RCO2. In addition, they noticed that population growth, contrary to population size, causes indirect residential emissions. In the Iberian Peninsula, Carpio et al. [16] selected six cities with different environmental conditions to assess the impact of the use of biomass boilers on carbon dioxide gas emissions. They found that the use of biomass could achieve a potential decrease of up to 95% in RCO2 emissions. They also noted that climate, financial costs, and improving the energy rating affect reducing RCO2 emissions. Poumanyvong and Kaneko [10] are the first, to our knowledge, who analyzed the nexus between RCO2 and urbanization from 88 nations by employing the Stochastic Impacts by Regression on Population, Affluence, and Technology (STIRPAT) model. The results indicate that the nexus between RCO2 emissions and urbanization in high-income nations is an inverted U-shape, whereas urbanization in the middle and lowest per capita income countries raises RCO2 emissions. Most of these studies were conducted in China [17,18,19,20,21].
Regarding Morocco, Tunisia, Algeria, and Egypt, studies have often addressed them during the investigation of the Middle East and North Africa (MENA) region. These investigations have concentrated on the nexus among GDP, energy use, and CO2 emissions as a gross term and can be categorized into three main groups: the first explores the nexus of economic growth–energy consumption; the second examines the nexus of economic growth–carbon dioxide emissions; however, the third, focuses on the nexus between CO2 emissions, economic development, and the use of oil. A summary of the selected empirical studies is presented in Table 1.

2.1. CO2 Emissions and GDP Nexus

Narayan and Narayan [22] used samples from 43 developing nations (including Morocco, Algeria, and Egypt) to examine the EKC hypothesis. They found that CO2 emissions had decreased significantly as the incomes of the countries concerned increased. Using data from three African countries (Senegal, Ghana, and Morocco) over the period 1971–2007, Adom et al. [23] suggest that the emissions of carbon dioxide will be a major constraint on Morocco’s economic development. Chaabouni and Saidi [24] studied the case of 51 nations during the period 1995–2013. Their findings show that economic growth impacts CO2 emissions positively and significantly, and that there is a bidirectional causality between them for the case of Morocco, Tunisia, Algeria, and Egypt. However, other studies have reported a neutral effect between carbon dioxide emissions and GDP. For instance, Gorus and Aydin [25] found that there is no causal nexus between income growth and CO2 emissions in eight MENA nations (including Algeria, Egypt, and Tunisia).

2.2. CO2 Emissions and Energy Consumption Nexus

Al-mulali et al. [26] noted the presence of bidirectional causality between carbon dioxide emissions and energy consumption in the long and short run by analyzing 20 MENA countries, even if the significance rate of the long-run relationship between the variables varied by educational level, level of economic growth, and income. Based on data from 10 MENA countries in 1980–2009, Farhani and Shahbaz [27] found a causality running from the use of renewable and non-renewable electricity to CO2 emissions in the short run, while it is bidirectional in the long run. Another analysis conducted by Charfeddine and Kahia [28] for 24 countries in the MENA region from 1980 to 2015 revealed that renewable energy consumption has a low impact and could only marginally describe CO2 emissions.

2.3. CO2 Emissions, Energy Consumption, and GDP Nexus

For the period 1973–2008, the analysis conducted by Farhani and Ben Rejeb [29] on 15 MENA countries supports the presence of univariate causality running from GDP and CO2 emissions to energy consumption. However, they support the absence of short-run causality between all variables. Arouri et al. [30] studied 12 MENA countries covering the period 1981–2005, and they concluded that energy use impacts CO2 emissions positively in the long run. They also noted that as GDP per capita continues to rise in the MENA region, CO2 emissions per capita could be reduced. By studying 14 MENA countries and using data from 1990 to 2011, Omri [31] found that there is unidirectional causality from energy consumption to CO2 emissions, while there is a bidirectional causality between economic growth and CO2 emissions throughout the region. Kais and Ben Mbarek [32] reported that income and energy consumption increase the CO2 emissions in Algeria, Tunisia, and Egypt. The same conclusion was drawn by Muhammad [33], who supported the conservation hypothesis in MENA countries. From all the above literature, the findings were found to be mixed and inconsistent. This may be due to the different characteristics of the countries and different frameworks employed to capture the linkage among CO2 emissions, income, and energy use.
In this paper, we deviate partly from the existing literature by treating the same concern within a specific framework. We are particularly interested in exploring the residential sector, as it is an important source of total CO2 emissions. Therefore, the current study underpins the RCO2 emissions, urbanization, GDP, and REC nexus in the North Africa region. To the best of our knowledge, no study has examined this nexus before. This study partially fills the research gaps by using a more recent dataset, a more robust model, and various modeling approaches that reflect the specificities of each nation. Our findings certainly contribute to advancing the existing literature and will aid policymakers in the four Northern African nations in developing effective policies to control the impacts of urbanization, income, and residential energy use on residential CO2 emissions.

3. Methodology and Model Specification

3.1. Data Presentation

The current study uses time-series data of urbanization (URB expressed as urban population per total population), real GDP per capita (GDPPC in the thousand US dollars) as a proxy of economic growth, residential energy consumption per capita (RECPC expressed in Koe), and RCO2 emissions per capita (RCO2PC expressed in metric tons) for 4 North African countries from 1990 to 2016. All the data were obtained from the International Energy Agency [1] except urbanization, which has been gathered from the World Development Indicators [34].
Descriptive statistics related with the variables analyzed are summarized in Table 2. The Jarque–Bera (JB) test [35] indicates that all the series are normally distributed. The analysis of the values of the coefficient of variation (CV) shows that Egypt’s GDP has the highest variability followed by one of Algeria and Morocco. Moreover, the lowest variability is identified in Egypt’s urbanization series. However, Tunisia has the highest mean urbanization rate, while Algeria has the highest mean of RCO2PC emissions, GDP per capita, and RECPC by 175 Koe. This means that energy consumption in the Algerian residential sector is more pronounced compared to the other countries and this will, of course, affect the RCO2 emissions. As shown in Figure 1, the RCO2 emissions from Morocco are significantly lower than those of the North African countries such as Tunisia, Algeria, and Egypt. Nevertheless, in recent years, Tunisia and Egypt have managed to keep their RCO2PC emissions stable, whereas those of Morocco are rising slightly. Finally, Algeria’s RCO2 emissions are the most pronounced and have continued to rise over the years. Thereafter, all the variables are expressed into log-form for consistent and reliable empirical results.

3.2. Model Specifications

This paper follows an econometric approach that has been used by many researchers in recent studies [36,37,38], and it has shown promising results when investigating the “economic growth–environmental pollution” nexus. According to the results of numerous studies [39,40], residential CO2 emissions can be divided into direct and indirect emissions as follows:
RCO 2 = RCO 2 Direct +   RCO 2 Indirect
where direct RCO2 emissions are related to direct energy use by households (petroleum gas, electricity, etc.) to meet the needs of lighting, space heating, appliances, cooking, etc. Thus, the RCO 2 Direct emissions function can be written as follows:
RCO 2 Direct = f REC .
Furthermore, indirect RCO2 emissions are generally defined as resulting from daily human activities related to services and product waste [41]. Several studies [15,18] have shown that urbanization and income are potential determinants of indirect energy consumption and household CO2 emissions. Then, RCO 2 Indirect emissions can be expressed as follows:
RCO 2 Indirect = f URB , GDP .
Therefore, residential CO2 emission per capita are modeled as a function of economic growth, urbanization, and REC as follows:
RCO 2 PC t = f URB t ,   GDPPC t , RECPC t
where RCO 2 PC t , URB t ,   GDPPC t and RECPC t stand respectively for RCO2 emissions per capita, urbanization, the real gross domestic product per capita, and residential energy consumption per capita, at time t.
In addition, the current study includes a squared term of GDPPC ( GDPPC 2 ) to investigate the EKC hypothesis when examining the impacts of high-level incomes on environment. Indeed, the EKC is a hypothesized relationship between several environmental indices and wealth. The relationship between income and environmental quality has been mainly described as an environmental Kuznets U curve, which asserts that there is a negative relationship between low income and environmental quality in the early stages of economic development, but that the relationship becomes positive later on. Finally, as no study has looked for the existence of the EKC relationship between economic growth and environmental pollution related to residential sector for the countries of North Africa, this study aims to investigate it. Thus, our model can be represented as follows:
RCO 2 PC t = f URB t ,   GDPPC t , GDPPC t 2 ,   RECPC t .
For testing the long-term equilibrium relationship, known as cointegration, among RCO2 emissions and the other variables, Equation (5) was transformed into logarithmic form to make the estimate easier and free of heteroscedasticity. That is:
LnRCO 2 PC t = α 0 + α 1 LnURB t + α 2 LnGDPPC t + α 3   LnGDPPC t 2 + α 4 LnRECPC t + μ t
where α k are the parameters of the model to be determined, with k = 0… 4, and μ t is the error term. The procedure followed for achieving the goal of the study is shown in more detail in Figure 2. After collecting data, we first verified the stationarity of the variables since most economic, energy, and demographic variables are non-stationary, and Granger and Newbold [42] suggested that a non-stationary time series might lead to a misleading conclusion. Second, we used an ARDL bounds cointegration test to determine whether there is a long-run relationship among the series under study. An ARDL bounds cointegration test consists of many steps: determining the optimal Lag; checking the presence of cointegration using an F-statistics test; estimating long and short-run results; and ensuring that the model is stable. Upon the validation of cointegration between the variables, the third step is to establish the direction of the causal link using the Toda–Yamamoto Granger causality test.

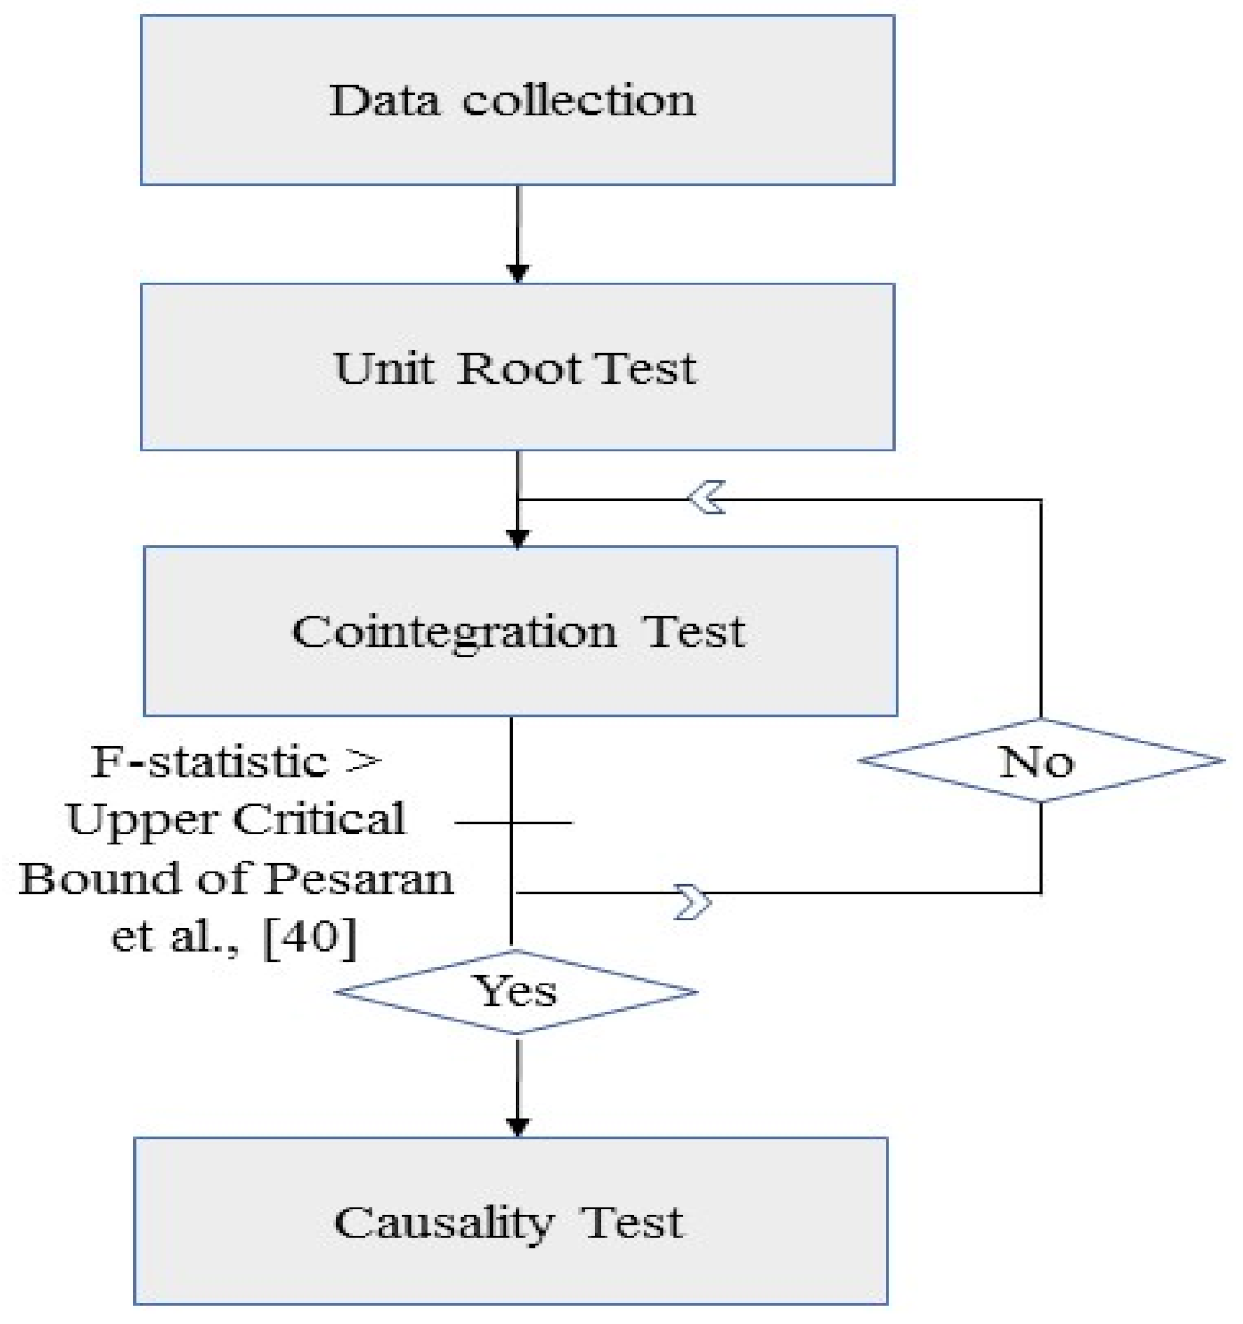
3.3. Estimation Procedure

3.3.1. ARDL Bounds Cointegration Test

Verifying the nature of the data series is mandatory before exploring the time-series model. As shown in Table 3, the Augmented Dickey–Fuller (ADF) and Phillips–Peron (PP) unit root tests reveal that the test statistics for the log levels of the four variables are statistically insignificant, except for LnURB of Algeria and LnURB of Egypt. The order of integration is necessary to determine which cointegration technique should be applied, and since none of our series is I(2), we used the ARDL bounds testing approach to investigate whether there is a long-run association between variables. The choice of ARDL method was considered more suitable for our analysis for many reasons: Firstly, the ARDL model outperforms all traditional cointegration testing methods for small sample data. Secondly, the ARDL approach can be used whether the variables are stationary at I(0) or I(1) or a combination of I(0) and I(1). Moreover, this approach provides both the short and long-run relationships between variables at the same time. Indeed, in an econometric context, the short run generally is defined as the time horizon over which the inputs deviate or are inflexible; however, the long run is measured over the period of time required for these inputs to adjust. Lastly, the ARDL model is not impacted by the endogeneity, since the lags of dependent and independent variables are added into the model. Therefore, using this approach, the functional form of the unrestricted error correction model is modeled as follows:
Δ LnRCO 2 PC t =   α 0 + i = 1 n 1 α 1 i   Δ LnRCO 2 PC t i + i = 0 n 2 α 2 i   Δ LnURB t i + i = 0 n 3 α 3 i   Δ LnGDPPC t i + i = 0 n 4 α 4 i   Δ LnGDPPC t i 2 + i = 0 n 5 α 5 i   Δ LnRECPC t i + λ 1 LnRCO 2 PC t 1 + λ 2 LnURB t 1 + λ 3 LnGDPPC t 1 + λ 4 LnGDPPC t 1 2 + λ 1 LnRECPC t 1 +   ε t
where I refers to country, and t is the time period.
The bounds testing approach to cointegration guarantees performing an F-test on the estimated equation with suitable lag lengths. Equation (7) was first estimated using ordinary least squares. The presence of long-run relationships among variables is confirmed by the standard F-test or Wald test on the null hypothesis, λ 1 = λ 2 = λ 3 = λ 4 = λ 5 = 0 , meaning that no cointegration exists between the variables, against the alternative hypothesis, λ 1 λ 2 λ 3 λ 4 λ 5 0 , indicating that variables are cointegrated. Then, we calculate the F-statistic and compare it with the critical values bound values proposed by Pesaran et al. [43]. In fact, the null hypothesis of no cointegration is rejected once the F-statistic is above the upper critical bound (UCB) value. If the lower critical bound (LCB) value exceeds our calculated F-statistic, there is no cointegration between the variables. If the F-statistic lies somewhere in between the critical bounds, the “Bounds Test” is deemed inconclusive. Once we find that the variables are cointegrated, then, the error correction model that defines short-run impacts can be estimated using the following equation:
Δ LnRCO 2 PC t =   α 0 + i = 1 n 1 α 1 i   Δ LnRCO 2 PC t i + i = 0 n 2 α 2 i   Δ LnURB t i + i = 0 n 3 α 3 i   Δ LnGDPPC t i + i = 0 n 4 α 4 i   Δ LnGDPPC t i 2 + i = 0 n 5 α 5 i   Δ LnRECPC t i + μ ECM t 1 + ε t
where ECM t 1   refers to the estimate of the lagged error correction term. Furthermore, the ARDL approach offers the possibility of incorporating “dummy variables” in the model that define the different regime shifts. Generally, external factors such as war, conflicts, and natural disasters can impact the trend of variables; thus, dummy variables are used in the model to account for this. In the case of our study, the set of popular protests that occurred in many countries of the Arab world from December 2010, known as the Arab Spring or Jasmine Revolution [44], was the catalyst for political instability in North Africa, particularly in Tunisia and Egypt. The Jasmine Revolution [44] has had far-reaching consequences for the economy and many sectors in North African countries. Therefore, a dummy variable was introduced into each country’s ARDL model, reflecting the years of the Jasmine Revolution [44], and it is expressed as follows:
Dummy Morocco = 0   f o r   a l l   y e a r s   e x c e p t   2011   a n d 1 f o r   2011     Dummy Tunisia = 0   f o r   1990 2010 a n d 1 f o r   2011 2017  
Dummy Algeria = 0   f o r   a l l   y e a r s   e x c e p t   2011 a n d 1 f o r   2011     Dummy Egypt = 0   f o r   1990 2010 a n d 1 f o r   2011 2017 .

3.3.2. Toda and Yamamoto Granger Causality Test

The ARDL bound testing will reveal the presence of the long-run relationship between the mixed or non-stationary form of variables; however, it will not be able to show the causal direction between the considered variables. Granger suggests a sequential procedure to test the causality between the series, notably by using either the Vector Error Correction Model Granger causality or the Engle and Granger [45] causality test. However, many criticisms have been formulated as to their effectiveness. The weakness of cointegration results coupled with the biased nature of unit root tests, especially for small samples, reduces the effectiveness of the Granger causality test, and that induced Toda and Yamamoto [12] to propose non-sequential procedures for testing the causality between the series. Thus, given our limited sample size, the Toda–Yamamoto approach appears to be a good fit for our research. The use of the Toda and Yamamoto approach is based on the augmented VAR model in levels with the maximum order of integration of the series. Hence, the current study explores the causal relationships among RCO2 emissions, urbanization, GDP, and residential energy consumption by employing the Modified Wald test (MWALD) as proposed by Toda and Yamamoto [12]:
y m =   α m + i = 1 p μ 1 mi   LnRCO 2 PC t i + j = p + 1 p + d max μ 2 mj   LnRCO 2 PC t j + i = 1 p β 1 mi LnURB t i   + j = p + 1 p + d max β 2 mj LnURB t j + i = 1 p η 1 mi   LnGDPPC t i + j = p + 1 p + d max η 2 mj   LnGDPPC t j + i = 1 p ρ 1 mi   LnRECPC t i + j = p + 1 p + d max ρ 2 mj   LnRECPC t j + ε mt
where m = 1,…,4 and y 1 , y 2 , y 3 ,   y 4 represent Ln RCO2PC, LnURB, LnGDPPC, and LnRECPC respectively; p is the optimal lag length of VAR, and d max is the maximum order of integration of the variables in the VAR model.

4. Empirical Results and Discussion

The first step entails testing the cointegration relationship between Ln RCO2PC and other variables. To this end, we used an unrestricted VAR to determine an appropriate lag length of the series of all models. Appendix A summarizes the results that illustrate that lag length 1 for Morocco and lag length 2 for other countries are appropriate according to the Akaike Information Criteria (AIC). This criterion was particularly chosen due to its high explanatory power. Thereafter, the F-statistic was computed, and the outputs are displayed in Table 4. The values found for F-statistics are higher than the UCB values of Pesaran et al. [40] at 1% and 5% significance levels for Algeria and Egypt, respectively, and at 10% in the case of Morocco and Tunisia. This ensures that variables should not diverge too far in the long run. To conclude, our findings confirm a long-run relationship between RCO2PC emissions, urbanization, GDPPC, and RECPC for the four neighboring countries.

4.1. ARDL Long-Run Results

The ARDL long-run results are presented in Table 5 and reveal that urbanization is the first main factor influencing RCO2 emissions per capita in Morocco, Algeria, and Egypt. The RCO2PC emissions are affected negatively by urbanization for both Algeria and Egypt. The results suggest that a 1% addition in urbanization reduces RCO2PC emissions by 0.90% in Algeria and 8.31% in Egypt. Our findings join the ones found by Hu and Tang [17], but they are contradictory with those of Poumanyvong et al. [10], who stated that the urbanization process contributes to increasing the RCO2PC emissions in the low and middle-income countries. For Morocco, urbanization appears as a positive factor. A 1% add in the urbanization rate boosts RCO2PC emissions by 2.76%. These findings are consistent with Bai et al. [21]. Indeed, the sign (+) of the coefficient attached with the urbanization variable was expected, as the process of urbanization in Morocco is closely linked to the consumption of electricity and butane (more butane, since it is subsidized). However, in Algeria and Egypt, energy subsidies cover electricity, natural gas, and hydrocarbons. This explains the fact that the share of less polluting energies (electricity, biomass, and natural gas) in the residential energy mix of Algeria and Egypt is 85% and 65%, respectively, while that of Morocco is 37% [1]. It should also be noted that the Moroccan residential energy mix does not include natural gas.
The estimated coefficients related to GDPPC and GDPPC 2 appear to be significant for both Morocco and Tunisia. As shown in Table 5, the results suggest that increasing GDPPC reduces RCO2PC emissions in Morocco; a 1% add in GDPPC is associated with a 0.34% decrease in RCO2PC emissions. However, after reaching a turning point (the GDPPC level of US$ 1,701), further increases in GDPPC increase RCO2PC emissions (a 1% add in GDPPC is associated with a 0.32% increase in RCO2PC emissions). Therefore, our findings support a U-shaped relationship between wealth and RCO2PC emissions in Morocco. However, an inverted U-shaped relationship exists among GDPPC and RCO2PC emissions in Tunisia. This means that Tunisia’s RCO2PC emissions initially increase with an increase in GDPPC and then decrease exactly after GDPPC reaches a level of US$ 2,427. This outcome is coherent with the findings of Fujii et al. [46].
Regarding the effect of RECPC on RCO2PC emissions per capita, it is positive and significant at 1% for all North African countries. The results suggest that a 1% add in RECPC is related to RCO2PC emissions by 0.23% in Morocco, 0.89% in Tunisia, 0.82% in Algeria, and 0.55% in Egypt. More energy consumption leads to more residential carbon dioxide emissions and hence more environmental degradation, which is coherent with many studies, such as Wang and Yang [47] as well as Wang and Zhao [48]. Moroccan residential energy use is noted to have the smallest effect on RCO2PC. This may be attributed to the fact that Morocco relies heavily on energy imports and that it remains a low-income country by international standards. This, of course, affects Moroccan households’ energy use patterns and explains the recent interest in using intermittent renewable energy sources.

4.2. ARDL Short-Run Results

As per the short-run ARDL results presented in Table 6, the four countries’ environments are not significantly polluted as a result of urbanization. However, the lagged values of the urbanization have a significant negative association with RCO2PC emissions in Algeria and Egypt. This outcome may be because both countries have invested heavily in clean energy by completing gas market reforms. Egypt has invested in several projects that allow the most isolated and poorest citizens to be better connected to the natural gas network. In 2018, local natural gas arrived at 2.3 million homes. Moreover, economic growth affects RCO2PC emissions negatively in Morocco, meaning that growth is in favor of environmental health. On the other hand, the GDP-squared term has a significant positive association with RCO2PC emissions in Morocco. The short-run results further show that the relation between RECPC and RCO2PC emissions is positive and significant at a 1% significance level in all countries, except Morocco.
As shown in Table 6, the dummy variable of Tunisia is significant and positive. This implies that since the Jasmine Revolution [44], RCO2 emissions have accelerated in Tunisia. In addition, the sign (-) with the statistical significance of the Error Correction term ( E C M t 1 ) supports the long-term equilibrium relationships defined for the four countries. E C M t 1 suggests that the system shocks will be adjusted by 89% in Morocco, 86% in Tunisia, 58% in Algeria, and 94% in Egypt, over the following year.
To evaluate the accuracy of all individual ARDL models, four standard diagnostic tests are applied and presented in Table 7. The Lagrange Multiplier (LM) test confirms the absence of serial correlation at the 5% significance level in all models. The JB normality test reveals that all residuals have a normal distribution. The Ramsey RESET test results show that the short model is well specified, except for Egypt. Furthermore, the Autoregressive Conditional Heteroscedasticity (ARCH) test shows that the error terms are free from heteroscedasticity problems in all models. The CUSUM and CUSUMQ graphs developed by Brown et al. [49] are plotted to test the stability of the estimated models. As indicated in Figure 3, the trend of both graphs shows that models are stable as they are lying between upper and lower limits in all countries, except for Egypt. Indeed, Figure 3 shows that the CUSUM plot for Egypt is completely stable within 5% of the critical bands contrary to the CUSUMQ plot, which deviates for a small period; nevertheless, the deviation seems to be transient as the CUSUMQ plot returns completely toward the criteria’s bounds. Therefore, we argue that the estimated ARDL Egypt model is roughly stable. At the same time, we should bear in mind that our findings should be considered with caution.

4.3. Granger Causality

To complete the aim of this study, we proceeded to define the sense of causal relationships using the standard Modified Wald test of Toda and Yamamoto [12]. The Wald test’s results and hence the causality directions are summarized in Table 8. Firstly, economic growth Granger causes RCO2PC emissions in Morocco and Tunisia, which supports the findings of Liddle and Lung [50]. This suggests that energy policy decisions geared toward reducing CO2 emissions in the Moroccan and Tunisian residential sector can be made without fear of disrupting economic growth. Secondly, in the same countries, the casual effect is running from urbanization to RCO2PC emissions. In fact, urbanization increases resident income and reduces household size, impacting RCO2PC emissions in multiple aspects. Therefore, a reasonable urban policy should be developed within the two countries. This result is in line with Yazdi and Dariani [51] who reported a causality relationship from urbanization to CO2 emissions in Bahrain, Bangladesh, Indonesia, Iran, Iraq, and the Philippines. The results reveal also that the Moroccan and Tunisian residential energy use is driven by urbanization. This means that urbanization contributes to an increase or a decrease in the overall use of residential resources. In addition, the casual effect from the RECPC to RCO2PC emissions was expected, as Morocco’s residential energy mix is dominated by fossil fuels, especially Liquefied Petroleum Gas (LPG), which leads to a significant RCO2 emission. Furthermore, the renewable energies introduced into the residential energy mix have not yet met the necessary threshold to begin mitigating CO2 emissions. No feedback impact between the RECPC and RCO2PC emissions means that a policy in favor of the environment will not harm a household’s habits or energy use.
In the case of Tunisia, no direct link was observed between RECPC and RCO2PC emissions. Indeed, the RECPC crosses economic growth to indirectly explain the dynamics of RCO2 emissions. Therefore, Tunisia should pay attention to this indirect relation, as the feedback hypothesis between economic growth and RECPC was found to be relevant. This means that unlike Morocco, RECPC and income growth are complementary. In this context, policies that focus on reducing residential emissions by reducing residential energy consumption would have an effect on the economy of Tunisia. In parallel, this result may suggest exploring for new sources of energy supply and encouraging the use of clean energy to support long-term economic development.
The Algerian case shows three causal relationships that are unidirectional. Urbanization causes economic growth, RECPC, and RCO2PC emissions. Then, any policy initiated regarding urbanization can affect Algeria’s economic growth, energy use, and CO2 emission in the residential sector. Therefore, to support urbanization along with economic growth and reduce RCO2 emissions, an urban policy aimed at improving urban infrastructure and using additional economically-viable energy sources should be promoted. However, no causal effect was detected between RECPC or economic growth and RCO2PC emissions.
For Egypt, there is unidirectional causality from RCO2PC emissions to RECPC. Therefore, introducing new policies to reduce RCO2PC emissions can lead the country to an energy crisis and thus impact the development of the Egyptian economy. The unidirectional causality from RECPC to economic growth confirms this conclusion. It means that economic growth is a function of RECPC and therefore, RECPC is a determinant factor of economic growth. The results also revealed that economic growth causes urbanization; i.e., economic growth leads to urbanization. In contrast to Morocco, Tunisia, and Algeria, there is an inverse causality running from RCO2PC emissions to urbanization. Hence, a direct strategy to curb RCO2PC emissions may have many negative impacts, such as fluctuations in energy prices and unemployment, leading to a slowdown in the urbanization process.

5. Conclusions and Policy Implications

This paper investigated the relationship between residential carbon dioxide emissions, urbanization, economic growth, and residential energy consumption for Morocco, Tunisia, Algeria, and Egypt from 1990 to 2016. To explore that linkage, we opted for the two-stage procedure: first, we examined the long-run relationships between the variables by using the ARDL bounds testing approach. Second, we employed the Toda–Yamamoto non-Granger causality test to examine the causal relationships between variables.
The empirical findings support the occurrence of cointegration between variables for all countries. In the long run, urbanization is the first main factor driving the changes in RCO2PC emissions in the four Northern African countries. It has a positive effect on RCO2 emissions in Morocco, unlike Algeria and Egypt, meaning the increase in urbanization has been to the detriment of environmental quality in Morocco. This outcome can be justified as Morocco is highly dependent on the use of non-renewable energies to meet the residential energy needs. The study also supports the presence of the EKC relationship between GDPPC and RCO2PC emissions under the conventional EKC turning point formula in Morocco and Tunisia. The nonlinear relationship between GDPPC and RCO2PC emissions, in the long run, is U-shaped in Morocco and inverted U-shaped in Tunisia. This implies that economic growth in Morocco will keep raising residential carbon dioxide emissions if no improvements are applied in the residential energy policy. Instead, the impacts of the linear and nonlinear terms of GDPPC are not statistically significant in Algeria and Egypt. The long-run results also revealed that RECPC has a significant positive impact on RCO2 emissions in all countries.
Furthermore, the Toda–Yamamoto non-Granger causality test reveals a multiple causal relationship. The results show that there is a unidirectional causality running from GDP to RCO2PC emissions in Morocco and Tunisia. Moreover, urbanization Granger causes RCO2PC emissions in Morocco, Tunisia, and Algeria. Regarding Egypt, the causality is running from RCO2PC emissions to urbanization. The results reveal also that there is a unidirectional Granger causality from residential energy consumption to RCO2PC emissions in Morocco. However, in Egypt, the causal link runs in the reverse sense. For Tunisia, residential energy use does not directly affect CO2 emissions from the residential sector. They use economic growth to explain the RCO2PC emissions dynamics in an indirect way. Finally, in the case of Algeria, no causal relationship was found between RECPC and RCO2PC emissions.
The empirical results discussed above have the following important policy implications for the four Northern African countries: (i) The current paper confirms that urbanization is the first main factor influencing RCO2 emissions per capita in Morocco. Moreover, it has been proved that increased urbanization boosts RCO2 emissions. Limiting urbanization to control RCO2 emissions cannot be considered, as reducing urbanization could have an adverse effect on the country’s development. However, it seems more relevant to try to limit the consumption of butane gas in the sector. In this regard, policymakers should review the programs of subventions, and quite frankly, some subsidies must be removed. Concerning Morocco, butane subsidies widen the gap with other energy sources consumed in the residential sector and must be removed as soon as feasible to minimize the sector’s consumption growth and emissions. Indeed, direct support for renewable energy projects in all countries would be more effective. For instance, support and subsidy programs should be put in place to install non-emitting and sustainable heating and cooling systems. (ii) Secondly, the results reveal that income is strongly linked with RCO2 emissions in Tunisia and Morocco, and since economic development cannot be restrained, a pressure on the environment is expected. Obviously, the households will seek high comfort and luxury in their residences. Therefore, it is important for policy-makers to review existing building standards to take sustainability goals to the next level. Such policies will accelerate the transition of households toward renewable energies, and hence, they will not only reduce residential greenhouse gas emissions but will also relieve the public funds of governments. Notably, the two countries can save a considerable amount of imported energy. (iii) The positive link between RCO2 emissions and REC in all countries calls for the need to control residential energy consumption in order to mitigate residential GHG emissions. Nevertheless, this is only possible with the involvement of civil society, i.e., social acceptance of the necessary transformations and citizen engagement. In this regard, awareness campaigns should be planned to educate and train households regarding mitigation and adaptation for environmental degradation. In addition, encouraging the direct participation of citizens in decision making in residential energy policy or the context of energy-saving projects would be of value. (iv) Finally, the governments should allocate more funds for research and development activities to improve energy efficiency and develop low-carbon technology. This will ensure energy security, urbanization development, and hence sustainable economic growth.

Author Contributions

Conceptualization, C.H., B.M. and I.M.; methodology, C.H. and B.M.; software, I.M. and A.F.; validation, C.H. and B.M.; formal analysis, C.H.; investigation, C.H. and B.M.; resources, A.F.; data curation, C.H.; writing—original draft preparation, C.H.; writing—review and editing, B.M. and I.M.; visualization, C.H. and A.F.; supervision, B.M., A.F. and I.M.; project administration, A.F.; funding acquisition, not applicable. All authors have read and agreed to the published version of the manuscript.

Funding

This research received no external funding.

Institutional Review Board Statement

Not applicable.

Informed Consent Statement

Not applicable.

Data Availability Statement

The data can be accessed upon request from any of the authors.

Conflicts of Interest

The authors declare no conflict of interest.

Appendix A

Table A1. VAR lag order selection criteria. Endogenous variables: LnRCO2PCLnURBLnGDPPC Ln GDPPC 2 LnRECPC. Sample: 1990–2016. Included observations: 25.
Morocco
Lag logLLRFPEAICSICHQ
0 191.6882NA2.25 × 10 13 −14.93506−14.69128−14.86745
1 328.4334207.8527 *3.09 × 10 17 *−23.87467 *−22.41202 *−23.46900 *
2 346.236919.939937.23 × 10 17 −23.29895−20.61743−22.55521
Tunisia
Lag logLLRFPEAICSICHQ
0 204.3014NA8.19 × 10 14 −15.94411−15.70034−15.87650
1 346.1456215.60327.49 × 10 18 −25.29165−23.82900 *−24.88597
2 385.083243.61011 *3.23 × 10 18 *−26.40666 *−23.72513−25.66292 *
Algeria
Lag logLLRFPEAICSICHQ
0 129.3950NA3.28 × 10 11 −9.951602−9.707827−9.883989
1 315.9160283.51198.41 × 10 17 −22.87328−21.41063 *−22.46760
2 354.885743.64603 *3.62 × 10 17 *−23.99085 *−21.30933−23.24711 *
Egypt
Lag logLLRFPEAICSICHQ
0 187.4360NA3.16 × 10 13 −14.59488−14.35110−14.52727
1 342.9579236.39339.66 × 10 18 −25.03663−23.57398−24.63095
2 402.488166.67386 *8.03 × 10 19 *−27.79905 *−25.11752 *−27.05531 *
LR: sequential modified LR test statistic (each test at 5% level). FPE: Final prediction error. AIC: Akaike information criterion. SC: Schwarz information criterion. HQ: Hannan–Quin information criterion. * indicates lag order selected by the criterion.

References

  1. International Energy Agency (IEA). 2016. Available online: www.iea.org (accessed on 28 August 2020).
  2. Energy Information Administration (EIA) USA. Total electricity net generation. 2014. Available online: https://www.eia.gov/beta/international/data/browser/#/?pa=00000000000000000000000000000fvu&c=0000000000005000%200000000000g000000000000000001&ct=0&tl_id=2-A&vs=INTL.2-12-DZA-BKWH.A&vo=0&v=H&start=1980&end=2017 (accessed on 14 April 2021).
  3. IRENA. Renewable Energy in the Arab Region. Overview of Developments; International Renewable Energy Agency: Abu Dhabi, United Arab Emirates, 2016. [Google Scholar]
  4. Wong, R. Evaluation of UNDP/GEF Project: Egypt Sustainable Transport (PIMS No: 3523); Mid-Term Evaluation Report. 2013. Available online: https://erc.undp.org (accessed on 22 March 2021).
  5. Iyigun, S. Agrofood in North Africa: A Strategic Sector at Nature’s Mercy; COFACE Economic Publications: Bois-Colombes, France, 2016. [Google Scholar]
  6. Global Status Report, World Green Building Council. 2017. Available online: https://www.worldgbc.org/news-media/global-status-report-2017 (accessed on 12 March 2021).
  7. Cheekatamarla, P.K. Decarbonization of residential building energy supply: Impact of cogeneration system performance on energy, environment, and economics. Energies 2021, 14, 2538. [Google Scholar] [CrossRef]
  8. Grande-Acosta, G.K.; Islas-Samperio, J.M. Boosting energy efficiency and solar energy inside the residential, commercial, and public services sectors in Mexico. Energies 2020, 13, 5601. [Google Scholar] [CrossRef]
  9. Fan, J.L.; Zhang, Y.J.; Wang, B. The impact of urbanization on residential energy consumption in China: An aggregated and disaggregated analysis. Renew. Sustain. Energy Rev. 2017, 75, 220–233. [Google Scholar] [CrossRef]
  10. Poumanyvong, P.; Kaneko, S.; Dhakal, S. Impacts of Urbanization on National Residential Energy Use and CO2 Emissions: Evidence from Low, Middle and High-Income Countries; Hiroshima University, Graduate School for International Development and Cooperation (IDEC): Hiroshima, Japan, 2012; Volume 2, pp. 1–35. [Google Scholar]
  11. Boukhelkhal, A.; Benganab, I. Cointegration and causality among electricity consumption, economic, climatic and environmental factors: Evidence from North-Africa region. Energy 2018, 163, 1193–1206. [Google Scholar] [CrossRef]
  12. Toda, H.Y.; Yamamoto, T. Statistical inference in vector autoregressions with possibly integrated processes. J. Econom. 1995, 66, 225–250. [Google Scholar] [CrossRef]
  13. Venkataraman, C.; Habib, G.; Fernandez, A.E.; Miguel, A.H.; Friedlander, S.K. Residential biofuels in South Asia: Carbonaceous aerosol emissions and climate impacts. Science 2005, 307, 1454–1456. [Google Scholar] [CrossRef] [PubMed] [Green Version]
  14. Liu, W.; Wang, C.; Mol, A.P.J. Rural residential CO2 emissions in China: Where is the major mitigation potential? Energy Policy 2012, 51, 223–232. [Google Scholar] [CrossRef]
  15. Zhu, Q.; Peng, X.; Wu, K. Calculation and decomposition of indirect carbon emissions from residential consumption in China based on the input-output model. Energy Policy 2012, 48, 618–626. [Google Scholar] [CrossRef]
  16. Carpio, M.; Zamorano, M.; Costa, M. Impact of using biomass boilers on the energy rating and CO2 emissions of Iberian Peninsula residential buildings. Energy Build. 2013, 66, 732–744. [Google Scholar] [CrossRef]
  17. Hu, Z.; Tang, L. Exploring the Relation between Urbanization and Residential CO2 Emissions in China: A PTR Approach; MPRA Paper; University Library LMU: Munich, Germany, 2013. [Google Scholar]
  18. Yuan, B.; Ren, S.; Chen, X. The effects of urbanization, consumption ratio and consumption structure on residential indirect CO2 emissions in China: A regional comparative analysis. Appl. Energy 2015, 140, 94–106. [Google Scholar] [CrossRef]
  19. Zang, X.; Zhao, T.; Wang, J.; Guo, F. The effects of urbanization and household-related factors on residential direct CO2 emissions in Shanxi, China from 1995 to 2014: A decomposition analysis. Atmos. Pollut. Res. 2017, 8, 297–309. [Google Scholar] [CrossRef]
  20. Cai., J.; Yin, H.; Varis, O. Impacts of urbanization on water use and energy-related CO2 emissions of residential consumption in China: A spatio-temporal analysis during 2003–2012. J. Clean. Prod. 2018, 194, 23–33. [Google Scholar] [CrossRef]
  21. Bai., Y.; Deng, X.; Gibson, J.; Zhao, Z.; Xu, H. How does urbanization affect residential CO2 emissions? An analysis on urban agglomerations of China. J. Clean. Prod. 2019, 209, 876–885. [Google Scholar] [CrossRef]
  22. Narayan, P.K.; Narayan, S. Carbon dioxide emissions and economic growth: Panel data evidence from developing countries. Energy Policy 2010, 38, 661–666. [Google Scholar] [CrossRef]
  23. Adom, P.K.; Bekoe, W.; Amuakwa, M.F.; Mensah, J.T.; Botchway, E. Carbon dioxide emissions, economic growth, industrial structure, technical efficiency: Empirical evidence from Ghana, Senegal, Morocco on the causal dynamics. Energy 2012, 47, 314–325. [Google Scholar] [CrossRef]
  24. Chaabouni, S.; Saidi, K. The dynamic links between carbon dioxide (CO2) emissions, health spending and GDP growth: A case study for 51 countries. Environ. Res. 2017, 158, 137–144. [Google Scholar] [CrossRef] [PubMed]
  25. Gorus, M.S.; Aydin, M. The relationship between energy consumption, economic growth, and CO2 emission in MENA countries: Causality analysis in the frequency domain. Energy 2019, 168, 815–822. [Google Scholar] [CrossRef]
  26. Al-Mulali, U.; Fereidouni, H.G.; Lee, J.Y.M.; Sab, C.N.B.C. Exploring the relationship between urbanization, energy consumption, and CO2 emission in MENA countries. Renew. Sustain. Energy Rev. 2013, 23, 107–112. [Google Scholar] [CrossRef]
  27. Farhani, S.; Shahbaz, M. What role of renewable and non-renewable electricity consumption and output is needed to initially mitigate CO2 emissions in MENA region? Renew. Sustain. Energy Rev. 2014, 40, 80–90. [Google Scholar] [CrossRef] [Green Version]
  28. Charfeddine, L.; Kahia, M. Impact of renewable energy consumption and financial development on CO2 emissions and economic growth in the MENA region: A panel vector autoregressive (PVAR) analysis. Renew. Energy 2019, 139, 198–213. [Google Scholar] [CrossRef]
  29. Farhani, S.; Ben Rejeb, J. Energy consumption, economic growth and CO2 emissions: Evidence from panel data for MENA region. Int. J. Energy Econ. Policy 2012, 2, 71–81. [Google Scholar]
  30. Arouri, M.E.; Youssef, A.B.; M’henni, H.; Rault, C. Energy consumption, economic growth and CO2 emissions in Middle East and North African countries. Energy Policy 2012, 45, 342–349. [Google Scholar] [CrossRef] [Green Version]
  31. Omri, A. CO2 emissions, energy consumption, economic growth nexus in MENA countries: Evidence from simultaneous equations models. Energy Econ. 2013, 40, 657–664. [Google Scholar] [CrossRef] [Green Version]
  32. Kais, S.; Mbarek, B.M. Dynamic relationship between CO2 emissions, energy consumption and economic growth in three North African countries. Int. J. Sustain. Energy 2015, 36, 840–854. [Google Scholar] [CrossRef]
  33. Muhammad, B. Energy consumption, CO2 emissions and economic growth in developed, emerging and Middle East and North Africa countries. Energy 2019, 179, 232–245. [Google Scholar] [CrossRef]
  34. World Bank, World Development Indicator. 2017. Available online: https://databank.worldbank.org/source/world-development-indicators (accessed on 1 September 2019).
  35. Jarque, C.M.; Jarque-Bera, T.; Lovric, M. International Encyclopedia of Statistical Science; Springer: Berlin/Heidelberg, Germany, 2011. [Google Scholar]
  36. Ang, J. CO2 emissions, energy consumption, and output in France. Energy Policy 2007, 35, 4772–4778. [Google Scholar] [CrossRef]
  37. Soytas, U.; Sari, R.; Ewing, T. Energy consumption, income, and carbon emissions in the United States. Ecol. Econ. 2007, 62, 482–489. [Google Scholar] [CrossRef]
  38. Ang, J. Economic development, pollutant emissions and energy consumption in Malaysia. J. Policy Modeling 2008, 30, 271–278. [Google Scholar] [CrossRef]
  39. Weber, C.; Adriaan, P. Modeling lifestyle effects on energy demand and related emissions. Energy Policy 2000, 28, 549–566. [Google Scholar] [CrossRef]
  40. Wei, Y.M.; Liu, L.C.; Fan, Y.; Wu, G. The impact of lifestyle on energy use and CO2 emission: An empirical analysis of China’s residents. Energy Policy 2007, 35, 247–257. [Google Scholar] [CrossRef]
  41. Hirano, Y.; Ihara, T.; Hara, M.; Honjo, K. Estimation of direct and indirect household CO2 emissions in 49 Japanese cities with consideration of regional conditions. Sustainability 2020, 12, 4678. [Google Scholar] [CrossRef]
  42. Granger, C.W.J.; Newbold, P. Spurious regressions in econometrics. J. Econom. 1974, 2, 111–120. [Google Scholar] [CrossRef] [Green Version]
  43. Pesaran, M.H.; Shin, Y.; Smith, R. Bounds testing approaches to the analysis of level relationships. J. Appl. Econ. 2001, 16, 289–326. [Google Scholar] [CrossRef]
  44. The Editors of Encyclopaedia Britannica, Jasmine Revolution—Tunisian History. 2019. Available online: https://www.britannica.com/event/Jasmine-Revolution (accessed on 25 December 2020).
  45. Engle, R.F.; Granger, C.W.G. Cointegration and error correction representation: Estimation and testing. Econometrica 1987, 55, 251–276. [Google Scholar] [CrossRef]
  46. Fujii, H.; Iwata, K.; Chapman, A.; Kagawa, S.; Managi, S. An analysis of urban environmental Kuznets curve of CO2 emissions: Empirical analysis of 276 global metropolitan areas. Appl. Energy 2018, 228, 1561–1568. [Google Scholar] [CrossRef] [Green Version]
  47. Wang, Z.; Yang, Y. Features and influencing factors of carbon emissions indicators in the perspective of residential consumption: Evidence from Beijing, China. Ecol. Indic. 2016, 61, 634–645. [Google Scholar] [CrossRef]
  48. Wang, Y.; Zhao, T. Panel estimation for the impacts of residential characteristic factors on CO2 emissions from residential sector in China. Atmos. Pollut. Res. 2018, 9, 595–606. [Google Scholar] [CrossRef]
  49. Brown, R.L.; Durbin, J.; Evans, J.M. Techniques for testing the constancy of regression relationships over time. J. R. Stat. Soc. Ser. B 1975, 37, 149–192. [Google Scholar] [CrossRef]
  50. Liddle, B.; Lung, S. Revisiting energy consumption and GDP causality: Importance of a priori hypothesis testing, disaggregated data, and heterogeneous panels. Appl. Energy 2015, 142, 44–55. [Google Scholar] [CrossRef]
  51. Yazdi, S.K.; Dariani, A.G. CO2 emissions, urbanisation and economic growth: Evidence from Asian countries. Econ. Res. Ekon. Istraživanja 2019, 32, 510–530. [Google Scholar] [CrossRef] [Green Version]
Figure 1. Residential CO2 emissions in the four North African counties.
Energies 14 05849 g001
Figure 2. Steps of the methodology.
Energies 14 05849 g002
Figure 3. Plots of CUSUM and CUSUMQ of recursive residuals of the estimated models.
Energies 14 05849 g003
Table 1. Summary of main studies on CO2 emissions–energy consumption–GDP nexus for MENA countries.
AuthorsPeriodsCountriesMethodologiesMain Findings and Causality
CO2 emissions–GDP nexus
Narayan and Narayan [22]1980–200443 developing countriesThe panel cointegration test based on the Pedroni’s suiteCO2 emissions fall with a rise in income
Adom et al. [23]1971–2007Senegal, Ghana, and MoroccoToda–Yamamoto’s Granger causalityCO2 emissions ↔ GDP
Chaabouni and Saidi [24]1995–201351 developing countriesDynamic simultaneous-equations modelsCO2 emissions ↔ GDP
Gorus and Aydin [25]1975–20148 MENA countriesGranger causality testno causal relationship
CO2 emissions–energy consumption nexus
Al-mulali et al. [26]1980–200920 MENA countriesGranger causality testCO2 emissions ↔ EC
Farhani and Shahbaz [27]1980–200910 MENA countriesGranger causality testEC ➔ CO2 emissions
Charfeddine and Kahia [28]1980 to 201524 countriesThe panel vector autoregressiveEC has a low impact on CO2 emissions.
CO2 emissions–energy consumption–GDP nexus
Farhani and Ben Rejeb [29]1973–200815 MENA countriesPanel causality testGDP ➔ EC, CO2 ➔ EC
Arouri et al. [30]1981–200512 MENA countriesPanel cointegrationEC impacts CO2 emissions positively in the long run
Omri [31]1990 to 201114 MENA countriesThe Cobb–Douglas production functionEC ➔ CO2,
GDP ↔ CO2
Kais and Ben Mbarek [32]1980 to 2012Algeria, Tunisia, and EgyptGranger causality testGDP➔ CO2
EC ➔ CO2
Muhammad [33]2001 to 201768 countriesUnrelated regression (SUR) and dynamic modelGDP ➔ CO2
EC ➔ CO2 (for MENA countries)
Table 2. Descriptive statistics of the variables.
VariablesRCO2PCURBGDPPCRECPC
MoroccoMean0.12505255.078652.04775584.38872
Median0.11585954.966121.74477276.20643
Maximum0.18415561.300003.207488111.1678
Minimum0.06792648.648981.20636451.48714
Std. Dev.0.0339963.5000280.74983720.06324
Jarque–Bera1.6496640.7622713.4379693.010739
Probability0.4383090.6830850.179248 0.221935
CV0.2718540.0635460.3661750.237747
Observation27272727
TunisiaMean0.16601964.130372.934106164.1850
Median0.16651764.580002.761871172.3340
Maximum0.19366368.350004.309030191.6350
Minimum0.13487257.950001.493439124.0583
Std. Dev.0.0138672.9648561.00328520.58662
Jarque–Bera0.1646191.6212962.7435302.810612
Probability0.9209870.4445700.2536590.245292
CV0.0835260.0462310.341938 0.125386
Observation27272727
AlgeriaMean0.35143462.117782.990250175.8553
Median0.32963062.280002.394635171.9444
Maximum0.51271671.460005.564520255.2546
Minimum0.25441952.090001.445121121.2273
Std. Dev.0.0770496.0111331.49002639.83590
Jarque–Bera2.9795831.7613073.0710842.189626
Probability0.2254200.4145120.2153390.334602
CV0.2192410.0967690.4982940.226526
Observation27272727
EgyptMean0.16287842.948151.710651107.9414
Median0.16054742.950001.321740102.1492
Maximum0.18519543.480003.547643143.9539
Minimum0.13214842.660000.63639177.25196
Std. Dev.0.0127310.1955280.95947420.88595
Jarque–Bera0.4656503.0893333.6717422.490613
Probability0.7922920.2133830.1594750.287853
CV0.0781620.004552 0.5608820.193493
Observation27272727
Table 3. Unit root test results for different countries.
VariablesADFPPOrder of Integration
Level1st DifferenceLevel1st Difference
Morocco
LnRCO2PC−2.548−5.563 ***−2.236−5.563 ***I (1)
LnURB−1.696−2.919 *−1.240−2.919 **I (1)
LnGDPPC−0.648−4.059 ***−0.685−4.064 ***I (1)
LnRECPC−1.600−5.257 ***−1.628−5.261 ***I (1)
Tunisia
LnRCO2PC−2.654−4.674 ***−2.625−4.686 ***I (1)
LnURB−1.125−2.762 *−6.242 ***−4.076 ***I (1)
LnGDPPC−1.759−3.882 ***−1.759−3.849 ***I (1)
LnRECPC−2.452−5.138 ***−2.452−5.141 ***I (1)
Algeria
LnRCO2PC0.067−5.018 ***0.067−5.018 ***I (1)
LnURB−10.222 *** −11.107 *** I (0)
LnGDPPC−0.518−4.767 ***−0.590−4.760 ***I (1)
LnRECPC−0.379−4.447 ***−0.439−4.436 ***I (1)
Egypt
LnRCO2PC−1.650−5.261 ***−1.699−5.462 ***I (1)
LnURB−3.748 *** −2.689 *** I (0)
LnGDPPC−1.584−3.375 **−0.188−3.493 **I (1)
LnRECPC−0.221−5.043 ***−0.189−5.045 ***I (1)
Notes: The regressions in first difference include intercept; ***, **, * indicate the significance of the statistic at the 1%, 5%, and 10% level, respectively. ADF: Augmented Dickey–Fuller (ADF, 1979). PP: Phillips–Peron (PP, 1988).
Table 4. Bounds test results.
CountryMoroccoTunisiaAlgeriaEgypt
F-statistics3.773.719.185.05
F-critical values
1% level 5% level10% level
Lower bound3.74 2.862.45
Upper bound5.06 4.013.52
Table 5. Long-run elasticities; the dependent variable is Ln RCO2PC emissions.
CountryVariables
CLnURBLnGDPPCLnGDPPC2LnRECPC
Morocco−6.89 ***(0.00)2.67 *** (0.00)−0.34 *** (0.00)0.32 *** (0.00)0.23 ***(0.00)
Tunisia6.77 (0.11)−1.58 (0.18)0.94 **(0.02)−0.53 ***(0.00)0.89 *** (0.00)
Algeria5.72 *** (0.00)−0.90 *** (0.00)0.09 (0.30)−0.00 (0.99)0.82 *** (0.00)
Egypt33.73 ** (0.02)−8.31 ** (0.03)−0.12 (0.18)0.01 (0.81)0.55 ***(0.00)
EKCTurning point formulaTurning point valueGDPPC highest valueConclusion
MoroccoAntilog of –(0.5 × C o e f f i c i e n t   a t t a c h e d   w i t h     G D P P C C o e f f i c i e n t   a t t a c h e d   w i t h   t h e   q u a d r a t i c     t e r m   o f   G D P P C US$ 1701US $2900EKC relationship
TunisiaUS$ 2427US $3698EKC relationship
Notes: The value in parenthesis is p-values. ***, and ** indicate the significance of the statistic at 1% and 5% levels, respectively.
Table 6. Short-run estimates; the dependent variable is LnRCO2PC emissions.
Independent VariablesDependent Variable: LnRCO2PC
Morocco Tunisia Algeria Egypt
Coefficientt-ValueCoefficientt-ValueCoefficientt-ValueCoefficientt-Value
Constant−6.14−4.14 ***5.881.77 *3.344.09 ***31.962.33 **
ΔLnURB−0.55−0.41−1.37−1.47−3.78−1.058.590.82
ΔLnURB (−1)2.941.91 * −14.98−3.47 ***−31.49−2.10 *
ΔLnURB (−2) 18.233.56 ***15.011.98 *
ΔLnGDPPC−0.30−3.08 ***0.310.930.051.15−0.12−1.16
ΔLnGDPPC (−1) 0.511.62
ΔLnGDPPC (−2)
Δ LnGDPPC 2 0.294.24 ***−0.19−1.26−0.02−0.890.090.72
Δ LnGDPPC 2 (−1) −0.26−1.87 *0.021.79 *0.131.87 *
Δ LnGDPPC 2 (−2) −0.02−0.32
ΔLnRECPC0.081.080.782.96 ***0.8716.95 ***1.006.69 ***
ΔLnRECPC (−1)0.121.70 −0.39−4.34 ***0.772.07 *
ΔLnRECPC (−2) −1.25−2.98 **
Dummy−0.01−0.850.072.41 **0.010.79−0.03−1.65
E C M t 1 −0.89−5.90 ***−0.86−4.62 ***−0.58−5.85 ***−0.94−3.27 ***
Note: ***, **, and * indicate the significance of the statistic at 1%, 5%, and 10% levels, respectively. Dummy Morocco and Dummy Algeria are 0 for all years and 1 for 2011. Dummy Tunisia and Dummy Egypt are 0 for 1990–2010 and 1 for 2011–2016.
Table 7. Diagnostic test.
Country χ 2 NORMAL χ 2 SERIAL χ 2 ARCH χ 2 REMSAY
Morocco5.44 (0.06)1.23 (0.31)0.78 (0.38)1.51 (0.15)
Tunisia0.55 (0.75)0.53 (0.59)0.32 (0.57)1.68 (0.11)
Algeria1.24 (0.53)0.54 (0.59)0.08 (0.77)0.99 (0.33)
Egypt0.98 (0.60)2.09 (0.19)0.02 (0.86)2.41 (0.04)
Notes: F-statistics appear above the parentheses, whereas p-values appear between the parenthesis. Normality of error term, serial correlation, autoregressive conditional heteroskedasticity, and functional of the short-run model is indicated by χ 2 NORMAL , χ 2 SERIAL , χ 2 ARCH , and χ 2 REMSAY respectively.
Table 8. Toda and Yamamoto non-causality test results.
Dependent VariablesWald Test Statistics Causality Direction
LnRCO2PCLnURBLnGDPPCLnRECPC
Morocco
LnRCO2PC-0.6062.3352.599URB ➔ RCO2PC
LnURB5.261 **-2.1165.136 *GDPPC ➔ RCO2PC
LnGDPPC5.896 ***1.639-8.820 **RECPC ➔ RCO2PC
LnRECPC6.675 **1.0532.673-URB ➔ RECPC
GDPPC ➔ RECPC
Tunisia
LnRCO2PC-2.0914.0193.327URB ➔ RCO2PC
LnURB10.031 ***-0.12211.921 ***GDPPC ➔ RCO2PC
LnGDPPC6.880 **0.570-16.286 ***RECPC ↔ GDPPC
LnRECPC0.5830.6356.133**-URB ➔ RECPC
Algeria
LnRCO2PC-2.7474.8932.908URB ➔ GDPPC
LnURB9.582 **-11.190 **16.404 ***URB ➔ RECPC
LnGDPPC2.7181.009-1.789URB ➔ RCO2PC
LnRECPC4.0341.7123.820-
Egypt
LnRCO2PC-5.622 *0.5508.148 **RECPC ➔ GDPPC
LnURB0.437-1.8934.010GDPPC ➔ URBPC
LnGDPPC1.8515.084 *-3.649RCO2PC ➔ RECPC
LnRECPC0.8354.1325.314 *-RCO2PC ➔ URB
*, **, and *** indicate the significance of the statistic at 1%, 5% and 10% levels, respectively.
Publisher’s Note: MDPI stays neutral with regard to jurisdictional claims in published maps and institutional affiliations.

