1. Introduction
Energy monitoring is not a new topic, ever since the first electric grid was created, some kind of energy monitoring technology started to be installed for billing or control [
1]. As the electric grid evolved, so did the monitoring technologies, returning more frequent, fine-grained, and precise data. Promoted by the advent of the smart grid, these advancements eventually reached the edge of the grid into the houses of electricity end-consumers, with the deployment of Advanced Metering Infrastructure and smart-meters [
2]. A multitude of services that rely on smart-meter data are currently under extensive research, and demonstration [
3,
4]. Services, such as Demand Side Management (DSM), Electric Vehicle Charging (EVC), Distributed Storage and Generation, rely on precise and continuous data [
5]. However, a new set of services developed for the household are emerging, which cannot all be met by the smart-metering infrastructure alone [
6,
7,
8,
9]. For example, services in which the consumption/production information is not the primary purpose, for example, household occupation detection, automation or comfort [
10,
11]. It is common for these services to deploy some kind of energy monitoring solution that meets their requirement, for example, the SMA
TM portal needs the installation of a gateway in the mains, LG
TM batteries need a separated inverter, which in their turn could need dedicated monitoring equipment. These solutions are often proprietary and rely upon unique protocols which cannot be shared between services or vendors or were simply built without considering integration [
12,
13]. This leads to households with duplicated or competing monitoring solutions, increasing installation, update, or maintenance costs.
Energy monitoring is still a very prolific field of research with contributions often focusing on the evaluation of particular aspects of monitoring solutions (e.g., [
9,
14,
15]). Or the development of monitoring solutions for particular scenarios in which the monitoring is not the main outcome of the research (for example Abdulsalam Alghamdi employed a monitoring solution to collect data as the input for an viability study of PV installations in Saudi Arabia [
16]).
In both cases, most of the systems proposed by academia are often one-off prototypes developed with a specific goal, with limited applicability in the real world. Furthermore, buildings go through several improvements and renovations during their long lifespan [
17]. Consequently, monitoring solutions in the real world are expected to be retrofitted in the existing infrastructure, hindering the viability of certain academic contributions in the real world. These limitations mean that researchers often have to build monitoring from scratch for particular needs. This phenomenon delays the knowledge transfer from academia to industry, and it also increases the development time of new academic contributions.
Against this background, this paper presents the EnnerSpectrum, an energy monitoring platform that emerged from academic research and was later expanded and demonstrated in a real-world demonstrator in the scope of the Horizon 2020 SMILE project. This system proposes an energy monitoring infrastructure composed of the monitoring hardware, a server to aggregate the consumption data, and a set of custom-made hardware and software components needed for integration. EnnerSpectrum provides a completely open platform for energy monitoring, allowing the undemanding integration of monitoring hardware, new data sources, visualizations for end consumers, and making all the collected information available to interested parties. This approach pursuits a centralized energy monitoring service for the household, addressing the shortcomings of having multiple closed solutions for different systems. The remainder of this article first presents the state-of-the-art in energy monitoring, highlighting the contributions that motivated the proposed approach. The following section presents the EnnerSpectrum system, all its components, and integration. The paper then presents a case study of the EnnerSpectrum System in 13 sites. To finalize, a discussion of the findings and conclusions are presented.
2. The State of the Art of Electricity Monitoring
Electricity monitoring is an essential aspect of a broad scope of studies. Ranging from work that looked purely at the technology to accurately measure electricity to studies that focused on the human side of energy consumption and research which conceptualizes how different technologies could consolidate into new services. The work presented bellow, represents a diverse sample from the state of the art which leveraged electricity monitoring, either as the main contribution of the work, or as a tool to a goal. Therefore, this literature review aims to focus on the implemented monitoring technologies that motivated the proposed approach.
Several authors opted to purposely custom-made hardware and software to measure electricity consumption. Anbya et al. [
15] propose an entirely custom-made system based on IC ADE7753 energy meter, which uses a Zigbee mesh to communicate with a base station. Depending on the conditions, the proposed system measured electricity consumption with a precision error between 0.03% and 1.23%. In [
18], the authors propose an energy monitoring solution using a notebook. The built-in audio Analog to Digital Converter (ADC) was used to sample current and voltage, whereas the mini display and the speakers provided feedback to the consumers. The Wi-Fi card enabled communication over the Internet. Another approach followed by the same authors [
19] employs an energy monitoring solution based on a multi-channel data acquisition system (DAQ) that was developed to be installed in the main entry point of apartment blocks, hence enabling the collection of consumption data without having to install equipment in each apartment. Pereira et al. disclosed a set of lessons learned and a comparison of the two approaches presented before [
20].
Another custom-made system was proposed by Yang et al. [
21]. The authors propose an infrastructure for real-time electricity monitoring, which uses a non-invasive sensor and an energy harvester to power the data capture module. These modules are to be installed in the internal grid of a building and operate in a completely autonomous manner and periodically push the data to a central unit connected to a desktop computer. Frei et al. [
22] developed a series of wireless sensors for estimating building performance. The sensors are organized in a Zigbee
TM mesh and measure different aspects of the building. The proposed system measures electricity consumption through a light sensor to measure the pulse flashes from the household electricity meters. The sensor kit contains a gateway based on an Arduino
TM(
https://www.arduino.com, accessed on 10 August 2021) microprocessor that pushes the data to a web server containing a database and graphical user interface.
Nevertheless, the most common approach is to develop monitoring infrastructures that combine commercial equipment (e.g., sensors or meters) with custom-made hardware or software (web servers, gateways). This approach often allows the implementation of more flexible solutions (compared with using only commercial systems), with a lower development time (compared to the custom-made equipment presented before).
Abdulsalam Alghamdi [
16] presented a viability study for the potential of rooftop-mounted PV Power Generation to meet electrical demand in Saudi Arabia. The author used a Raspberry Pi, connected to a series of sensors, to measure electricity consumption, but also other metrics such as CO
2. This custom-made solution also allowed the data to be easily pushed to an online server.
Chen et al. [
23] used an electricity monitoring infrastructure that combined off-the-shelf equipment with custom-made integration and communication. Intending to measure disaggregated per-plug consumption, the authors modified a Kill-a-Watt
TM meter, which communicated with a central gateway pushed the data to a web server. A user study with the system disclosed that 78% of participants were encouraged to reduce their consumption, and 20% reduced their consumption once it was made public. Weiss et al. [
24] also presented a combined approach, this contribution focuses on the human-computer-interaction aspect of behavior change to reduce electricity consumption. To measure electricity the authors used an common smart meter (from Landis + Gyr
TM,
https://www.landisgyr.com/, accessed on 10 August 2021). A custom-made gateway connected to the meter incorporated a parser, database, and local web-server, which participants could connect and query their electricity consumption. Another study focused on the human side of the energy field was performed by Sundramoorthy et al. [
25]. In this study, the author proposes a system that uses commercial sensors, RF clamps, and commercial smart-plugs that push data to a gateway. The gateway then publishes the data in a server that contains a series of graphical representations intended for the end-user.
Modern electric installations are often deployed with monitoring solutions, although mostly proprietary with limited interface options. Researchers from the energy field presented studies that used exclusively commercial systems. One of the most popular is the SMA
TM SunnyBoy (
https://www.sma.de/en/products/solarinverters/sunny-boy-30-36-40-50-60.html, accessed on 10 August 2021), which can be installed with a two-way energy meter, and provides a Web Portal for their customers. Conceptually this system is very similar to the approaches discussed above, which employ metering equipment, a gateway, and a web server.
Cieslik et al. [
26] leveraged the data collected from a PV installation through the SMA web portal to perform an experimental analysis of the installation’s output to meet the demand of an electric vehicle. The broad deployment of smart meters also allowed researchers to obtain consumption data for their studies. Geelen et al. [
27] used electricity and gas data from 519 smart meters in the Netherlands. Participants were divided into two groups. One of the groups used an application that allowed the monitoring of household consumption. Among other results, the authors disclose that participants using the monitoring application invested in changing their behavior to conserve energy. Schultz et al. [
28] carried out a similar study focused on measuring the energy conservation behaviors from a sample of 431 single-family homes. For this study, the smart meter data was paired with a custom-made in-home display.
From the body of work presented above its clear that all the reviewed approaches have their own strengths, weaknesses and challenges. A common trend is that when researchers need more fine-grained and frequent data, they will opt for a fully custom-built solution or combine capable commercial equipment with custom-built hardware/software. For research focused on offline studies such as viability analysis, algorithm development, or studies focused on the human aspect of sustainability, the data from commercial systems is often adequate. Withal, the most common approaches found in the literature are a combination of custom-built and commercial equipment. In most of the reviewed work, the primary purpose of this integration is to retrieve that data from the sensing equipment, and push it to a centralized location, usually a web server. The proposed approach, which will be discussed in detail in the following sections, aims at combining the strengths of both approaches presented in this literature review, employing a flexible infrastructure that can be adapted to different scenarios while allowing the integration of industry-grade equipment for precise measurements.
3. EnnerSpectrum System
Motivated by the work presented above, the proposed system aims at collecting precise and accurate electricity data while providing a flexible solution that allows the integration of new data sources and services. The EnnerSpectrum System is a software-based solution for monitoring energy at a selected site. On top of the monitoring, EnnerSpectrum can also provide services such as, for example, visualizations for the end consumer and administrator. In most scenarios, EnnerSpectrum requires employing one hardware device to assure smooth integration with other local grid components. In the remainder of this article, the site device will be referred to as the gateway (GT) and the cloud component as the EnnerSpectrum Back End (ESB).
3.1. Architecture
The flexibility goal discussed before is mainly achieved by a set of architectural decisions in the development of the ESB. The back end is organized into five main concepts: sources schemas, sources, producers, devices and devices groups The architecture was developed to facilitate solubility and integration with different parties, for example monitoring equipment or visualizations.
A source schema describes a particular kind of data that the system is capable of capturing. For instance, “webScraper” is a source schema corresponding to sources that are capable of capturing information by parsing HTML pages. Currently, there are two types of schemas, “webScraper“ and “jsonListener”, both structured in JSON format. A source is an implementation of a source schema. Each source handles converting its samples to the appropriate type and writing them to the data store.
A producer is an entity that produces data for a particular source. In many cases, each installation A producer may have multiple devices which access the system. The distinction is made between producers and devices so that access tokens can be generated per device instead of storing the user’s credentials at each location. Devices can be grouped to show their data aggregated in the same view. Every device has its group in order to see its data individually, and another group has to be created containing all the devices of the producer to have a global view.
Other groups can be created combining only devices that share the same type of installation, for example, having one device measuring grid and many devices measuring production or one device measuring consumption and many devices measuring production. The device groups are created through the administrator interface.
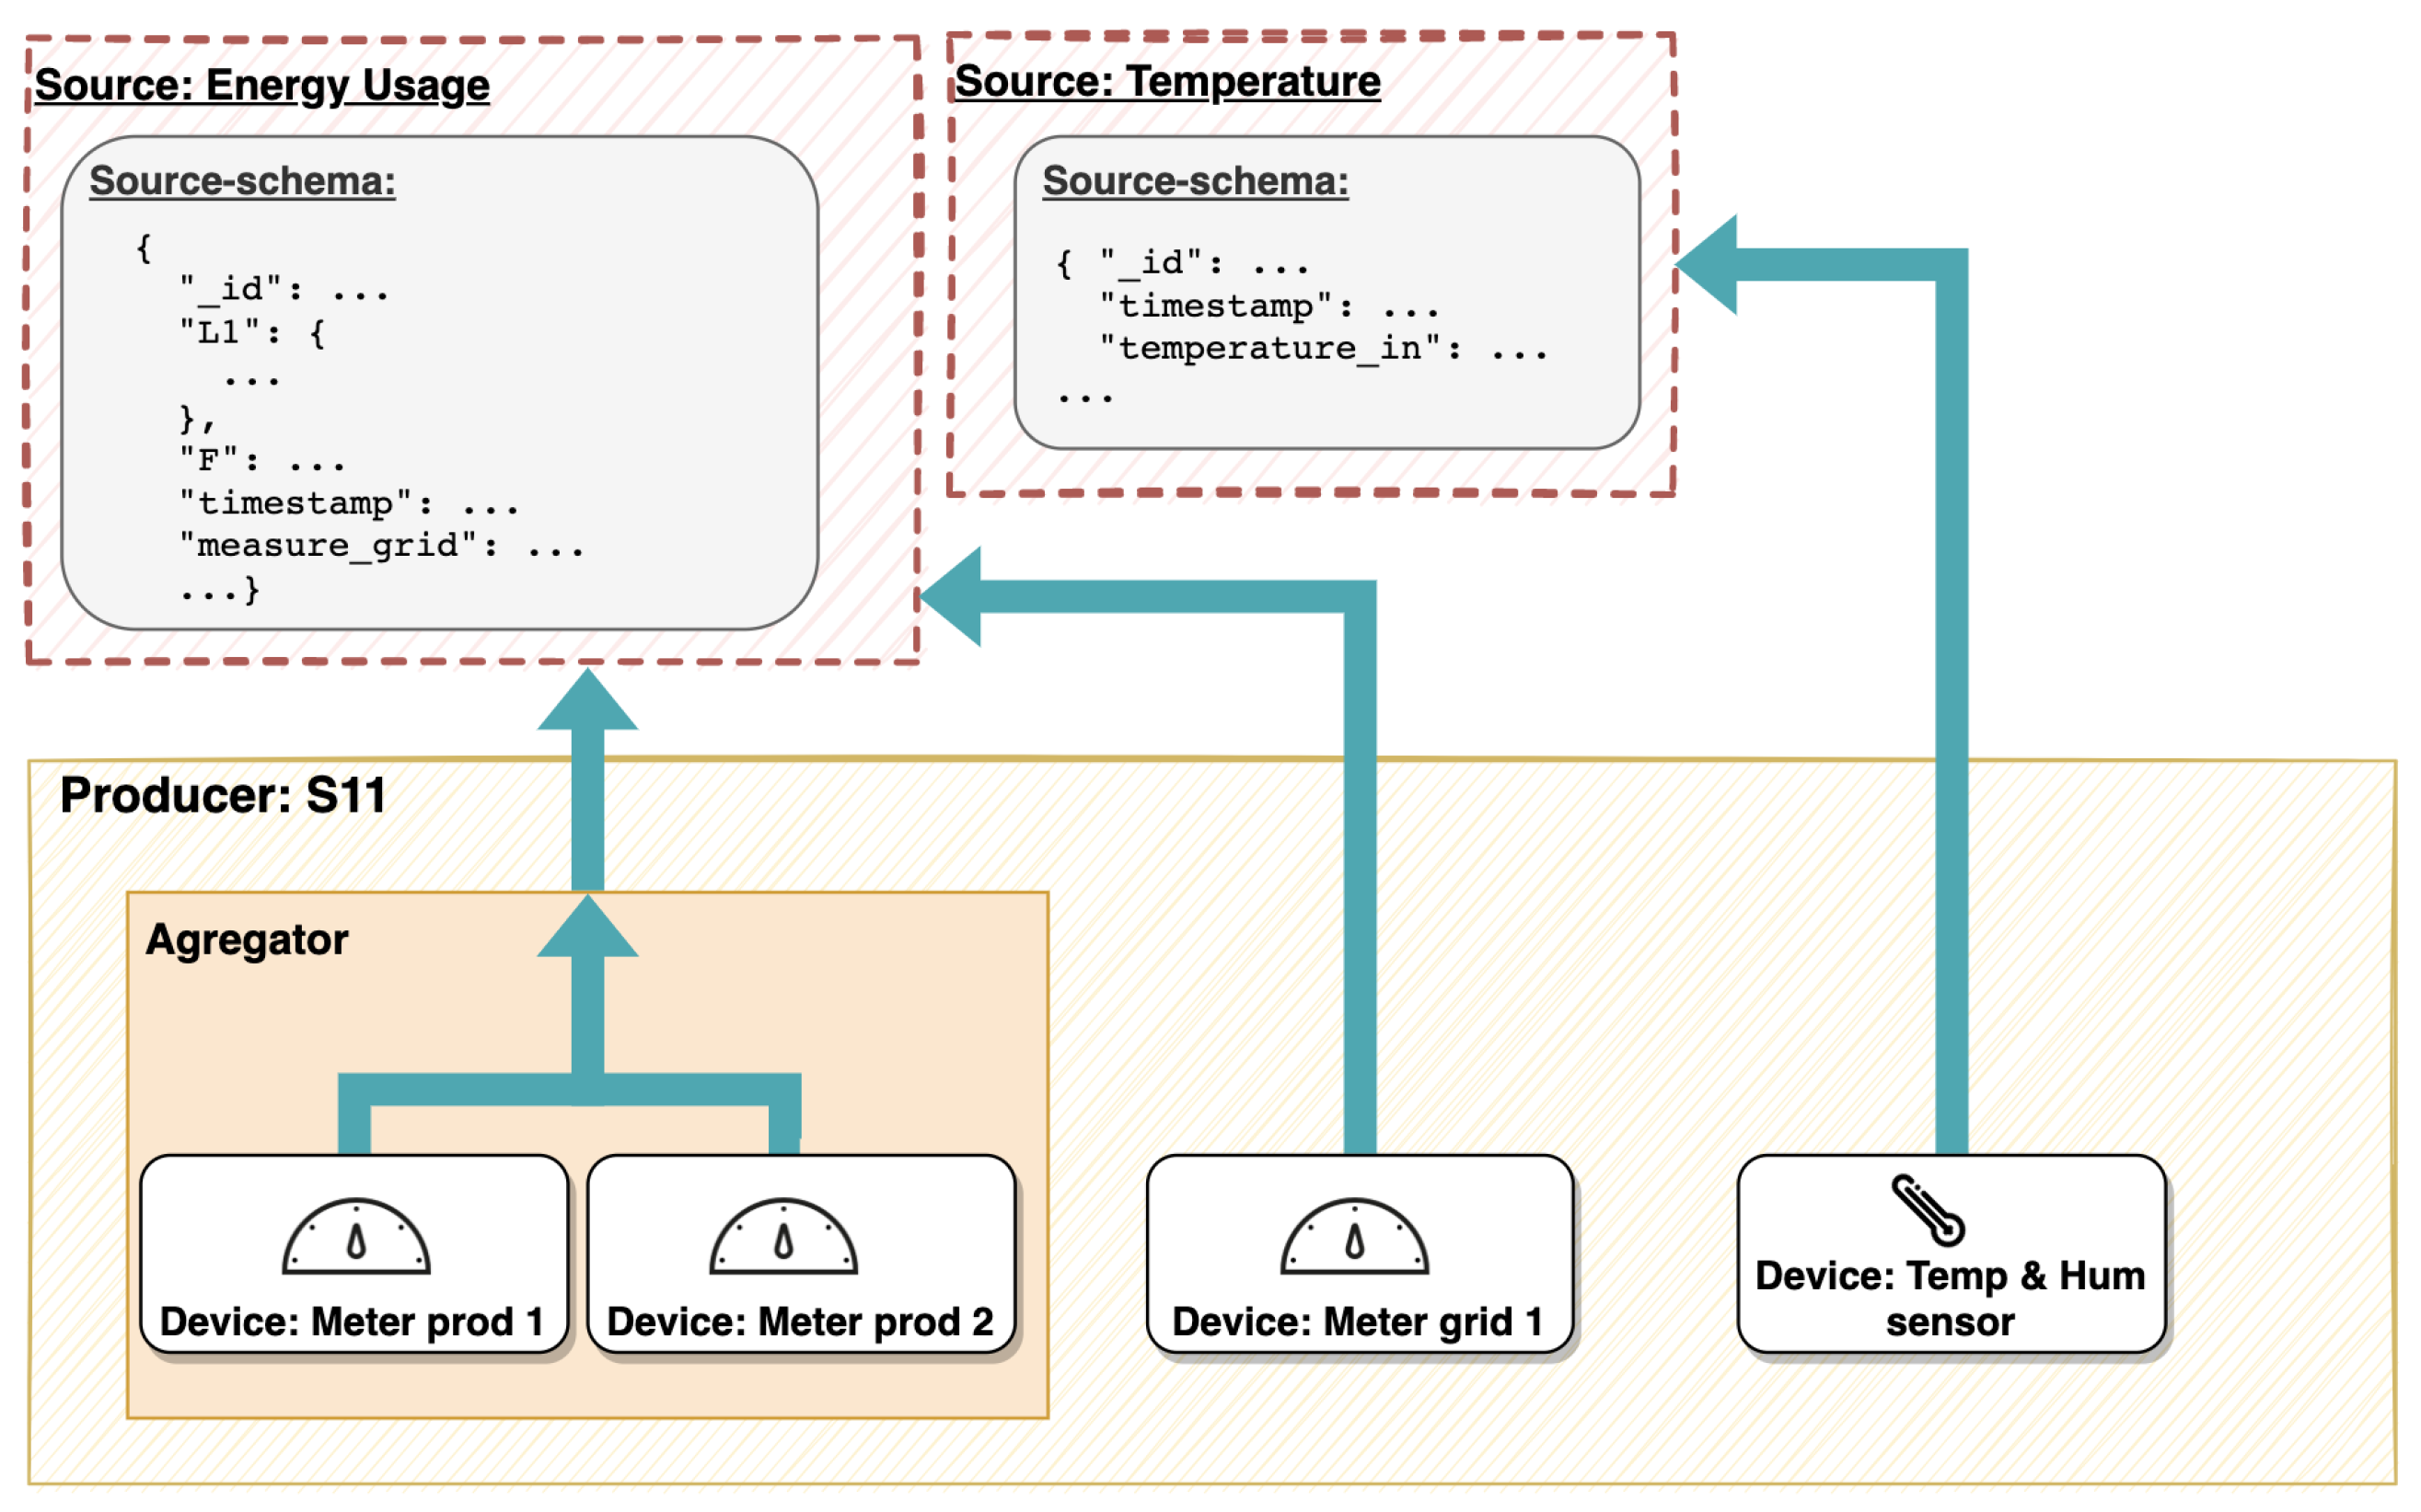
Figure 1 presents the configuration and relation between the Producer, Source, and Schema entities for monitoring at a particular site.
3.2. Gateway
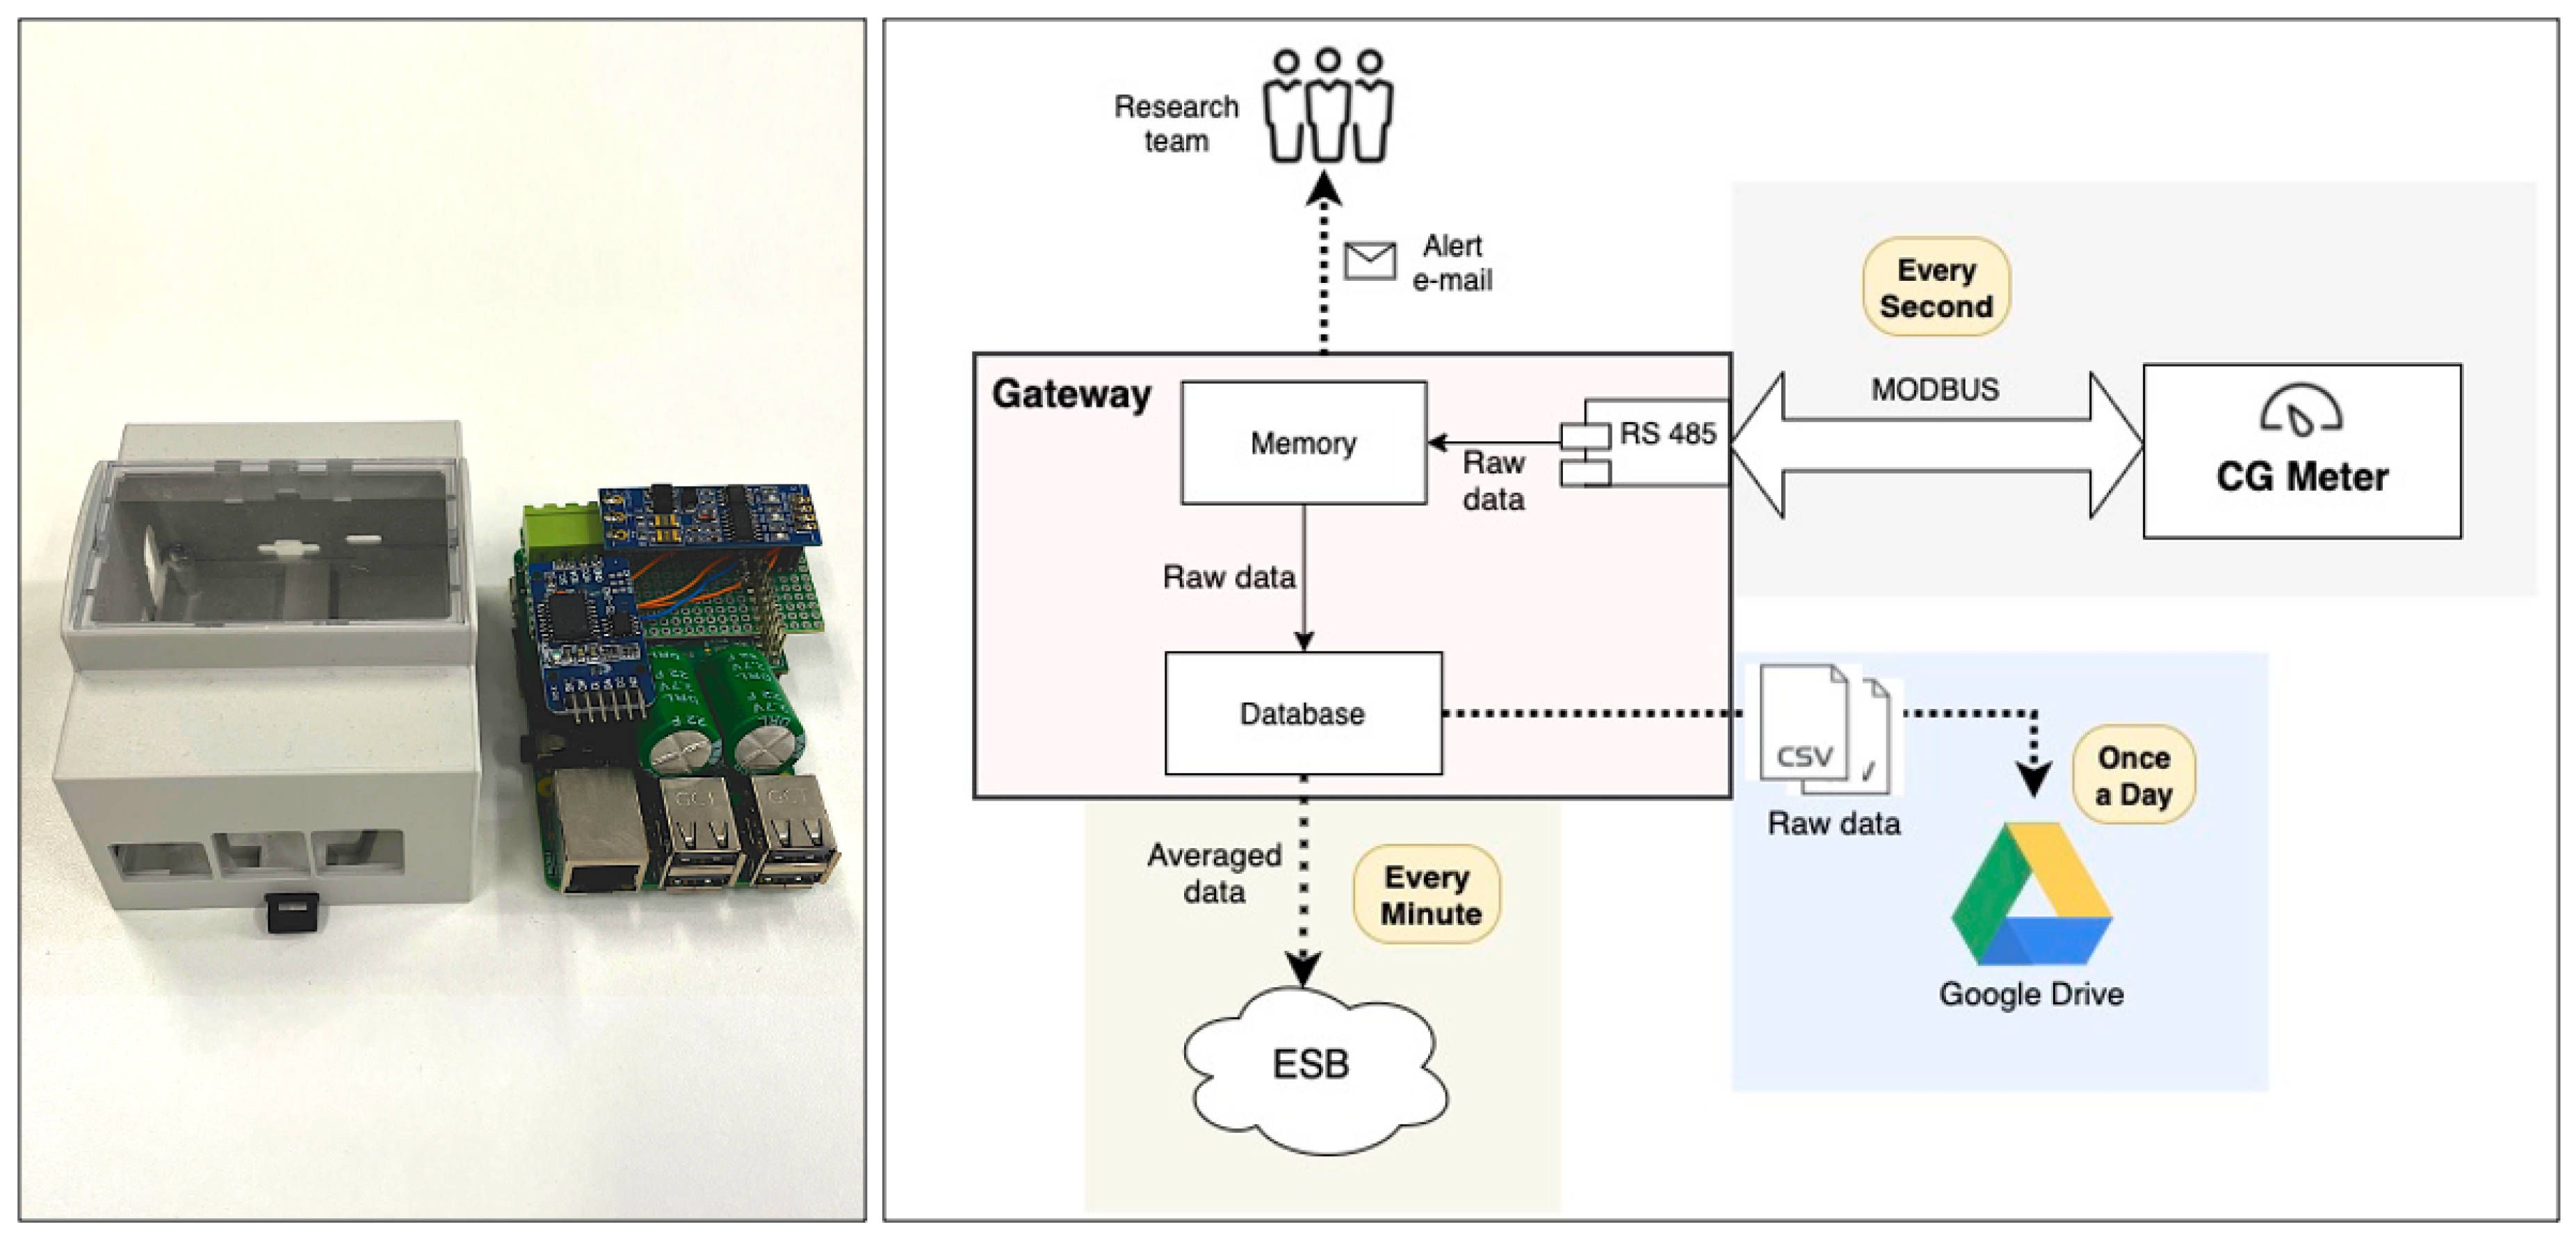
The main hardware component is the GT, this device is composed of a Raspberry Pi 3B+ microcomputer, together with a Juice4Halt (
https://juice4halt.com/, accessed on 10 August 2021) UPS to protect the equipment from sudden drops in the supply of electricity. The UPS shield also bundles a Real-Time-Clock and RS485 modules, which are used for communication using the MODBUS protocol. This protocol is commonly used by energy meters and similar equipment. This interface guarantees that the GT can communicate with a plethora of monitoring solutions. All these components are enclosed in a plastic box with DIN fixing points. Each GT was fitted with a 32GB SD card.
The decision of using Raspberry Pi running RasbianOS without a GUI, allowed to take advantage of significant performance when considering the small size of the device. It also allowed custom code development to interact with monitoring equipment and run third-party applications for services such as performance monitoring or remote access. The Raspberry Pi also provides effective I/O options, which were especially useful when connecting the device to the internet, either by WiFi, Ethernet or with a 3G USB dongle.
Energy Monitoring
The GT communicates with the CG meter, and communication requests are forwarded through the RS485 module using the MODBUS protocol. The consumption and production data are saved locally (in the GT) in a database. Each data point is composed of a: timestamp, active power, reactive power, apparent power, frequency, power factor, current, and voltage. The measurements are collected each second and aggregated in memory. Every 60 s, the database is updated with the data collected in the past minute. If the readings fail for more than 60 consecutive attempts, the system notifies the research team about a possible issue with the GT or CG monitors.
Every minute the GT also calculates the average of all the collected fields and sends it to the ESB. There is also an inspection for any previously unsent data, which is also pushed to the ESB. Furthermore, every day at 01:00 the GT creates a backup with all raw data in a GoogleDrive (
https://drive.google.com/, accessed on 10 August 2021) account, the data is sent as two CVS files, one for the production and another for consumption, with a unique name that matches the day that data belongs too. After a successful backup, the data is removed from the local database in the GT to keep any database transactions as fast as possible.
Certain sites already had monitoring equipment installed. In those cases, the GT is used to interact with the metering equipment at the site.
Figure 3 depicts the components, communication, and architecture of all the elements that comprise the gateway. In some situations, a site could already have monitoring equipment installed. In those cases, the GT can directly interact with the equipment at the site.
When this approach was not possible EnnerSpectrum used an HTML-Scrapper to retrieve consumption information from the equipment vendors’ website. In these situations, there was no need to install the GT.
3.3. Services
As mentioned before, one of the goals of the EnnerSpectrum system is to provide services on top of the aggregated consumption data. The ESB contains an API with more than sixty endpoints for all the services provided by the system. These services range from traditional CRUD operations like reading the consumption from a site within a set time frame or averaged by the hour, day, week, or month, to other functions that provide all the operations needed to set up new producers and sources or devices at a site. There is also the opportunity to develop new services that combine different endpoints to provide value to the end electricity consumer, or to, the TSO and DSO. Two examples of services enabled by EnnerSpectrum are an end-consumer visualization and administration tool described in the following sub-sections.
3.3.1. Graphical User Interface for the End Consumer
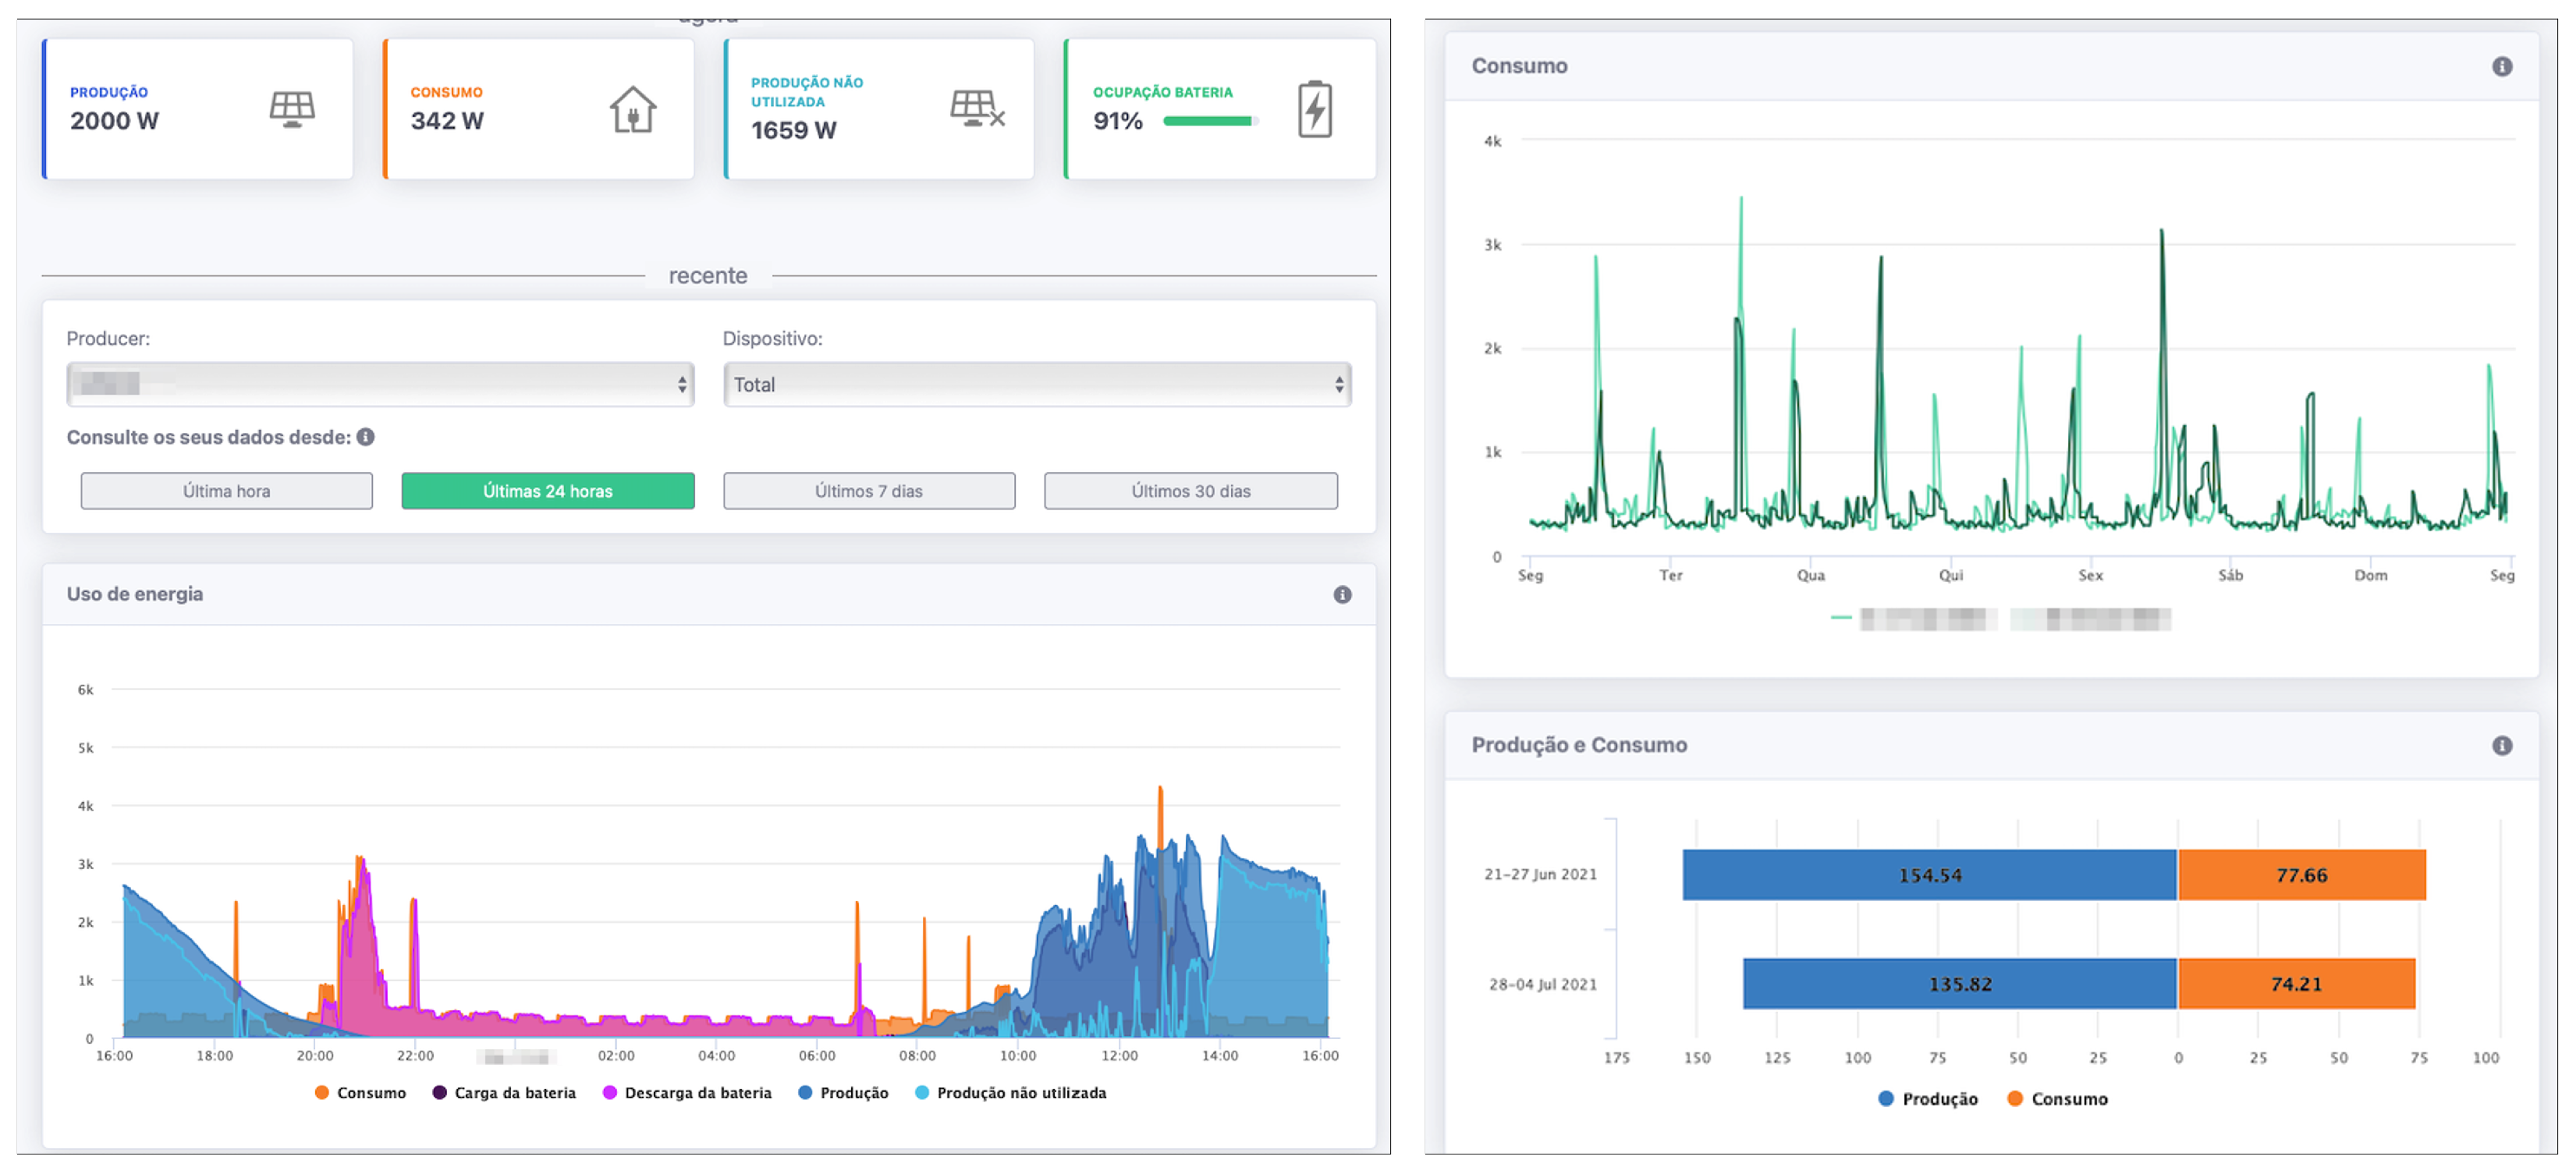
The ESB interface directed at end consumers has three main areas, see
Figure 4. Current consumption, historical consumption, and comparisons. The energy information is displayed using metrics such as kWh, Euros, or grams of CO
2. In these areas, the end-user can query graphs that display consumption and production information. More concretely, the current consumption area displays the real-time production, consumption, and waste information. It can also group the data by 1 h, 24 h, one week, and one month, the energy saved by the PV installation is also displayed here (again in kWh, CO
2 and Euros). The history page allows the user to visualize the consumed, produced, and wasted energy for a selected date. This page also allows the user to group the data by day, week, and month for a more comprehensive overview of the consumption. The day visualization presents 60 data points per hour, while the week and month graphs use 2 and 1 sample per hour, respectively. Finally the comparison provides a tool in which users can select 2 different dates, which could 2 days, weeks or months (see
Figure 4 right). The result of the selection is then presented in three different graphs that show the energy metrics for the selected dates.
3.3.2. Administration Tool
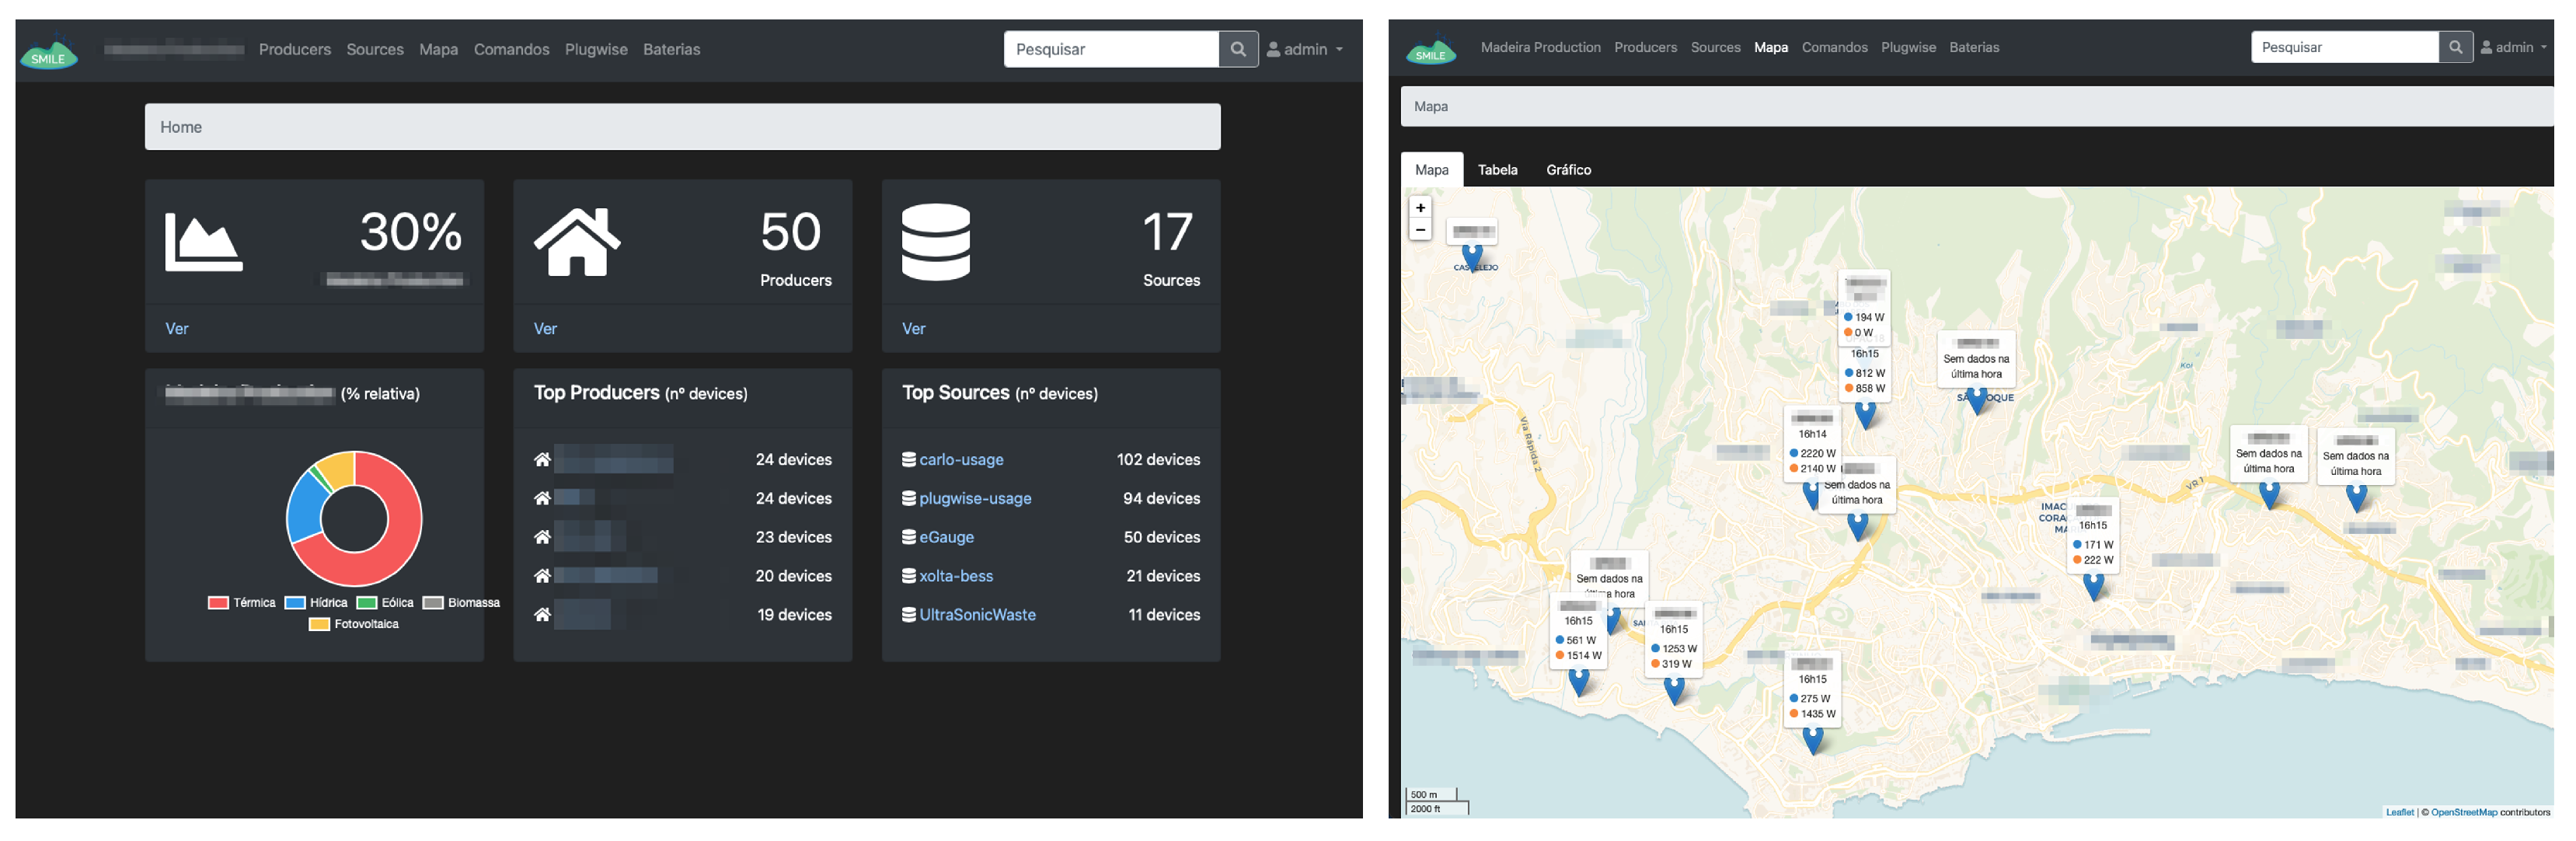
The EBS Administration tool is where the research team managed the deployed equipment and monitored the status of the pilot, see
Figure 5. This service allows its users to create, remove and edit producers, and view its data. It also allows the creation and removal of devices associated with a producer and the management of groups. The Administration tool permits creating an access token for each device and cleaning all the device’s data. The administrator can also create, edit and remove sources and set up which devices push data to it. Other features were implemented, which are helpful during a real-world pilot’s progress, such as cleaning the ESB cashes, managing data backups, exporting data for a CSV file, and a Map visualization with an overview of all the deployed equipment (see
Figure 5, right).
3.4. Cyber-Security and Privacy Considerations
Several privacy and security measures were adopted during the development of EnnerSpectrum. Currently, the ESB is configured to use HTTPS, which guarantees the privacy and integrity of the exchanged data while in transit to the server. It also protects against man-in-the-middle attacks. HTTP requests are automatically redirected to HTTPS. Currently, authentication is required for producers and devices. This is intended to prevent spurious data from being posted to an account and disallow the querying of private information. HTTP Basic authentication is the strategy used for the API. Concerning web interfaces (admin and client), a login is used. To avoid access to sensitive data stored at the ESB, this kind of information is hashed in the database. This includes passwords, device auth tokens, and producer tokens, which means that they’re no longer recoverable once in the database.
4. Case Study: Prosumer Monitoring
This section reports the findings during the deployment of the EnnerSpectrum system. Installation sites were recruited with an advertisement campaign in the local newspapers and with the help of the local, and only, electricity company. More than forty sites were considered, and eventually, twenty-seven sites were recruited. This paper presents the findings for a subset of thirteen sites, which entered the case study in similar periods. The recruitment process was aligned with the goals of the H2020 SMILE project since one of the project’s goals was to study the viability of installing battery storage systems to optimize PV installations. All the selected sites had a PV installation directed for self-consumption, no feed-in tariff was in place, and the feed-in was restricted in certain installations. EnnerSpectrum system was responsible for monitoring both the electricity consumption and production in all the installation sites. The monitoring equipment was installed between May and August of 2018, and its been continuously ruining until the present day. This section describes the general results from running the pilot until the 31 March 2021.
4.1. Installation and Integration
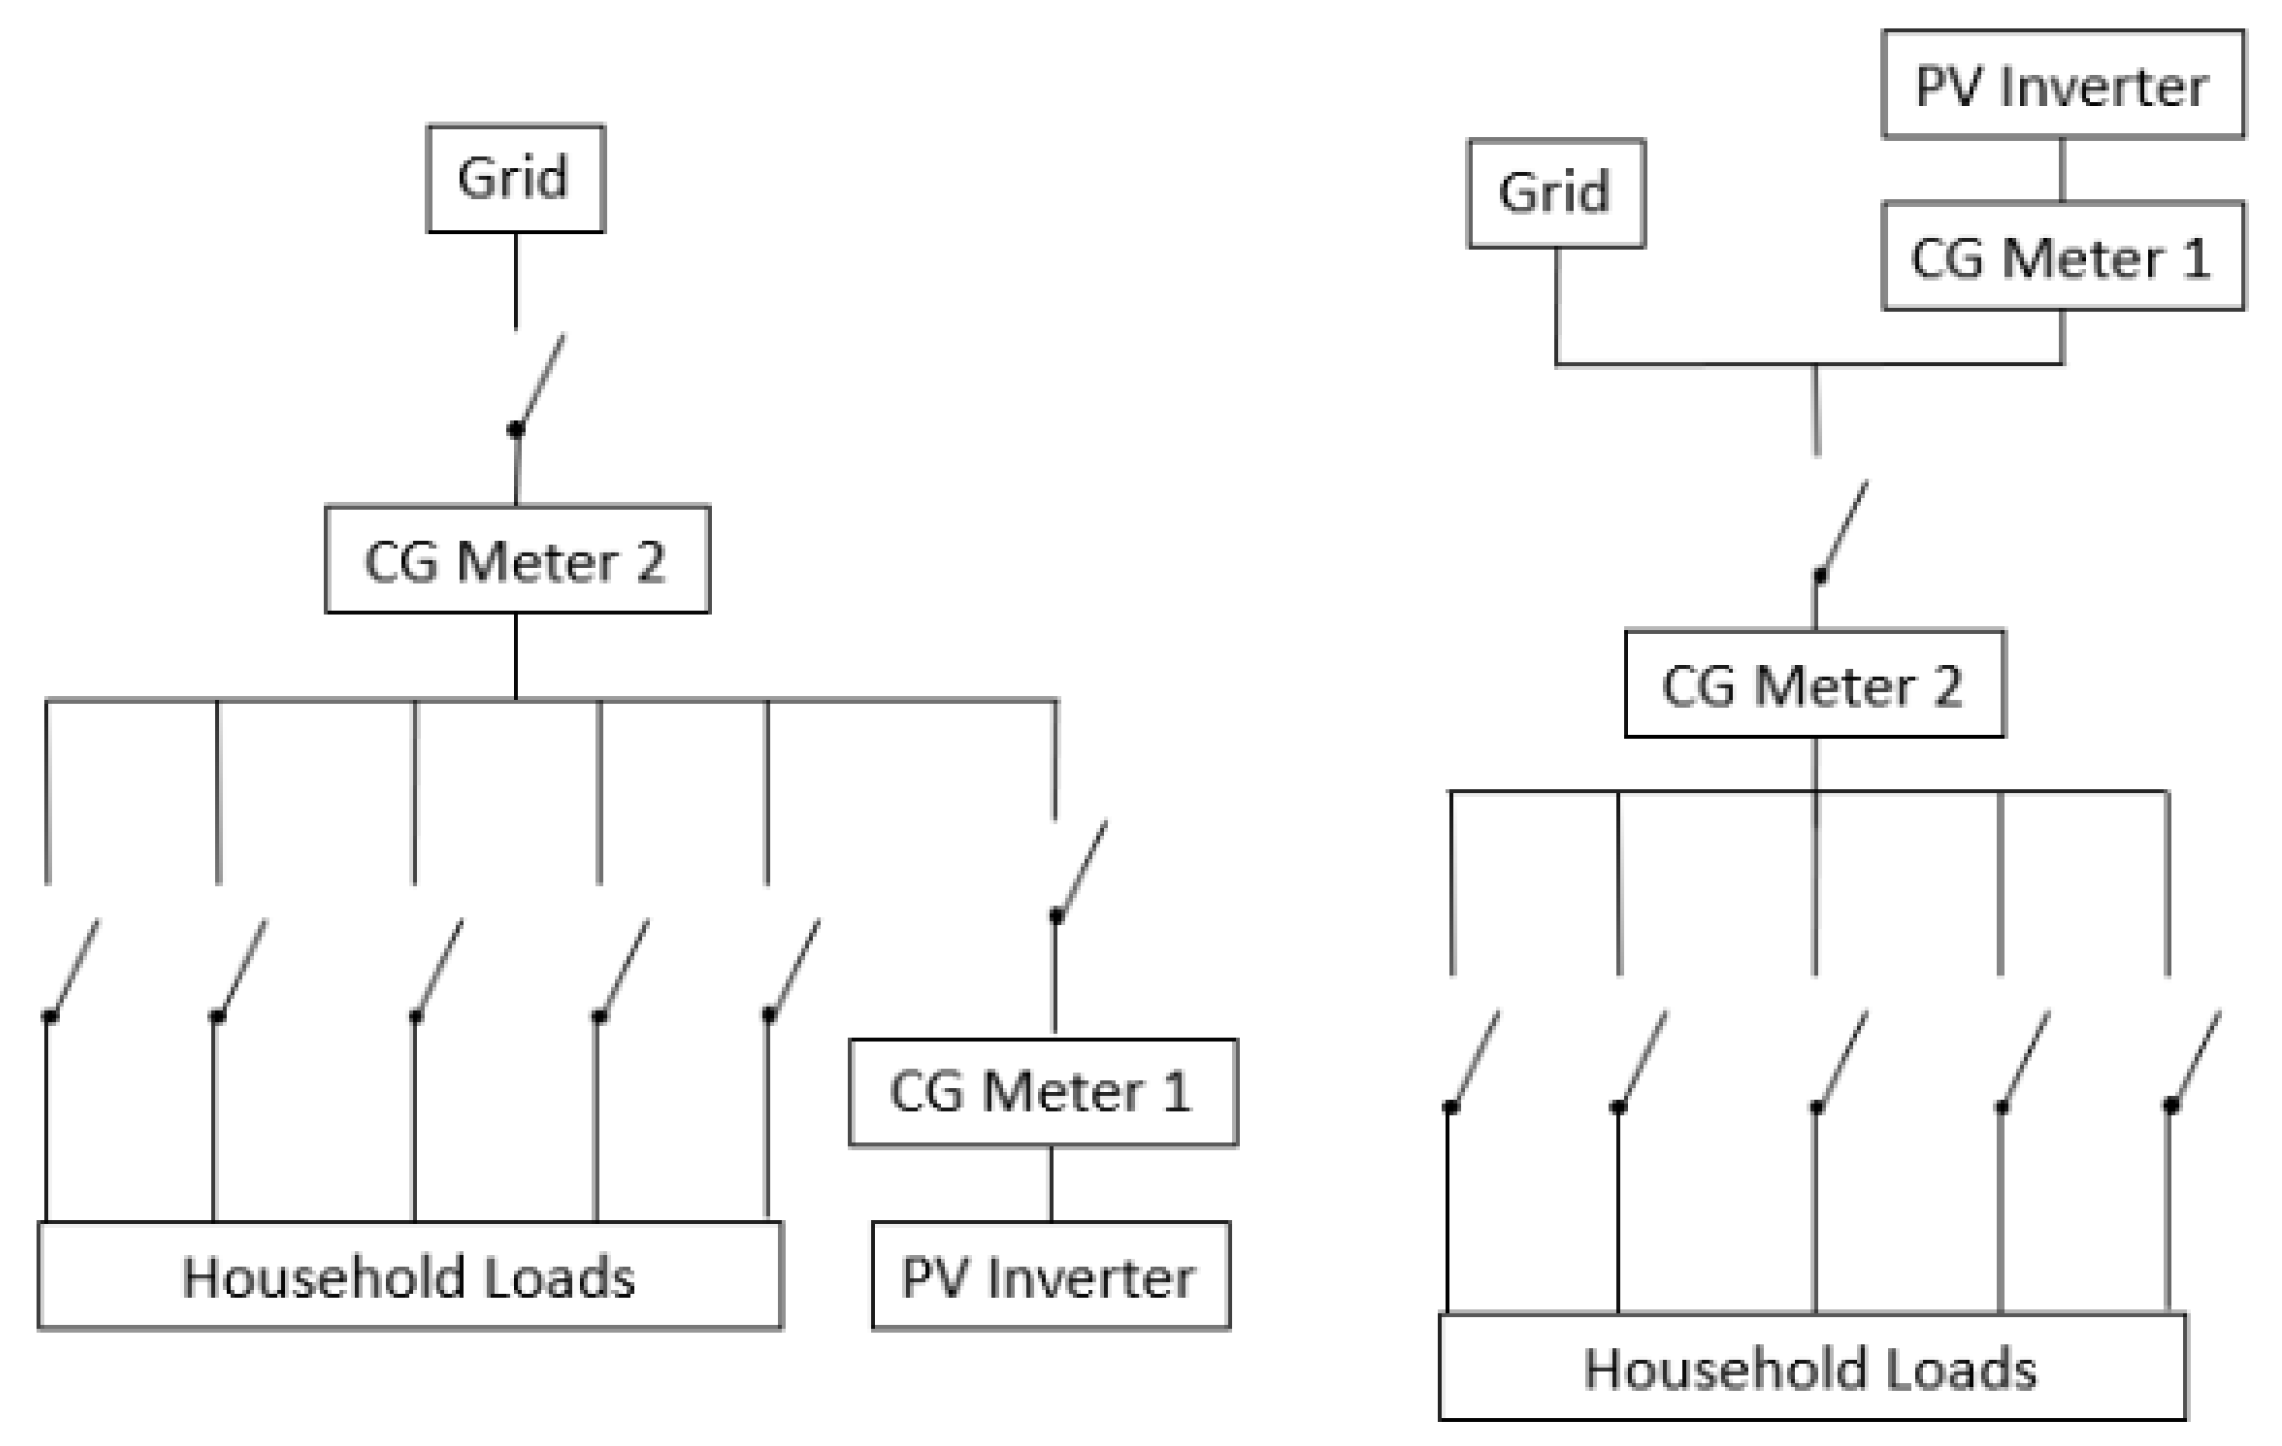
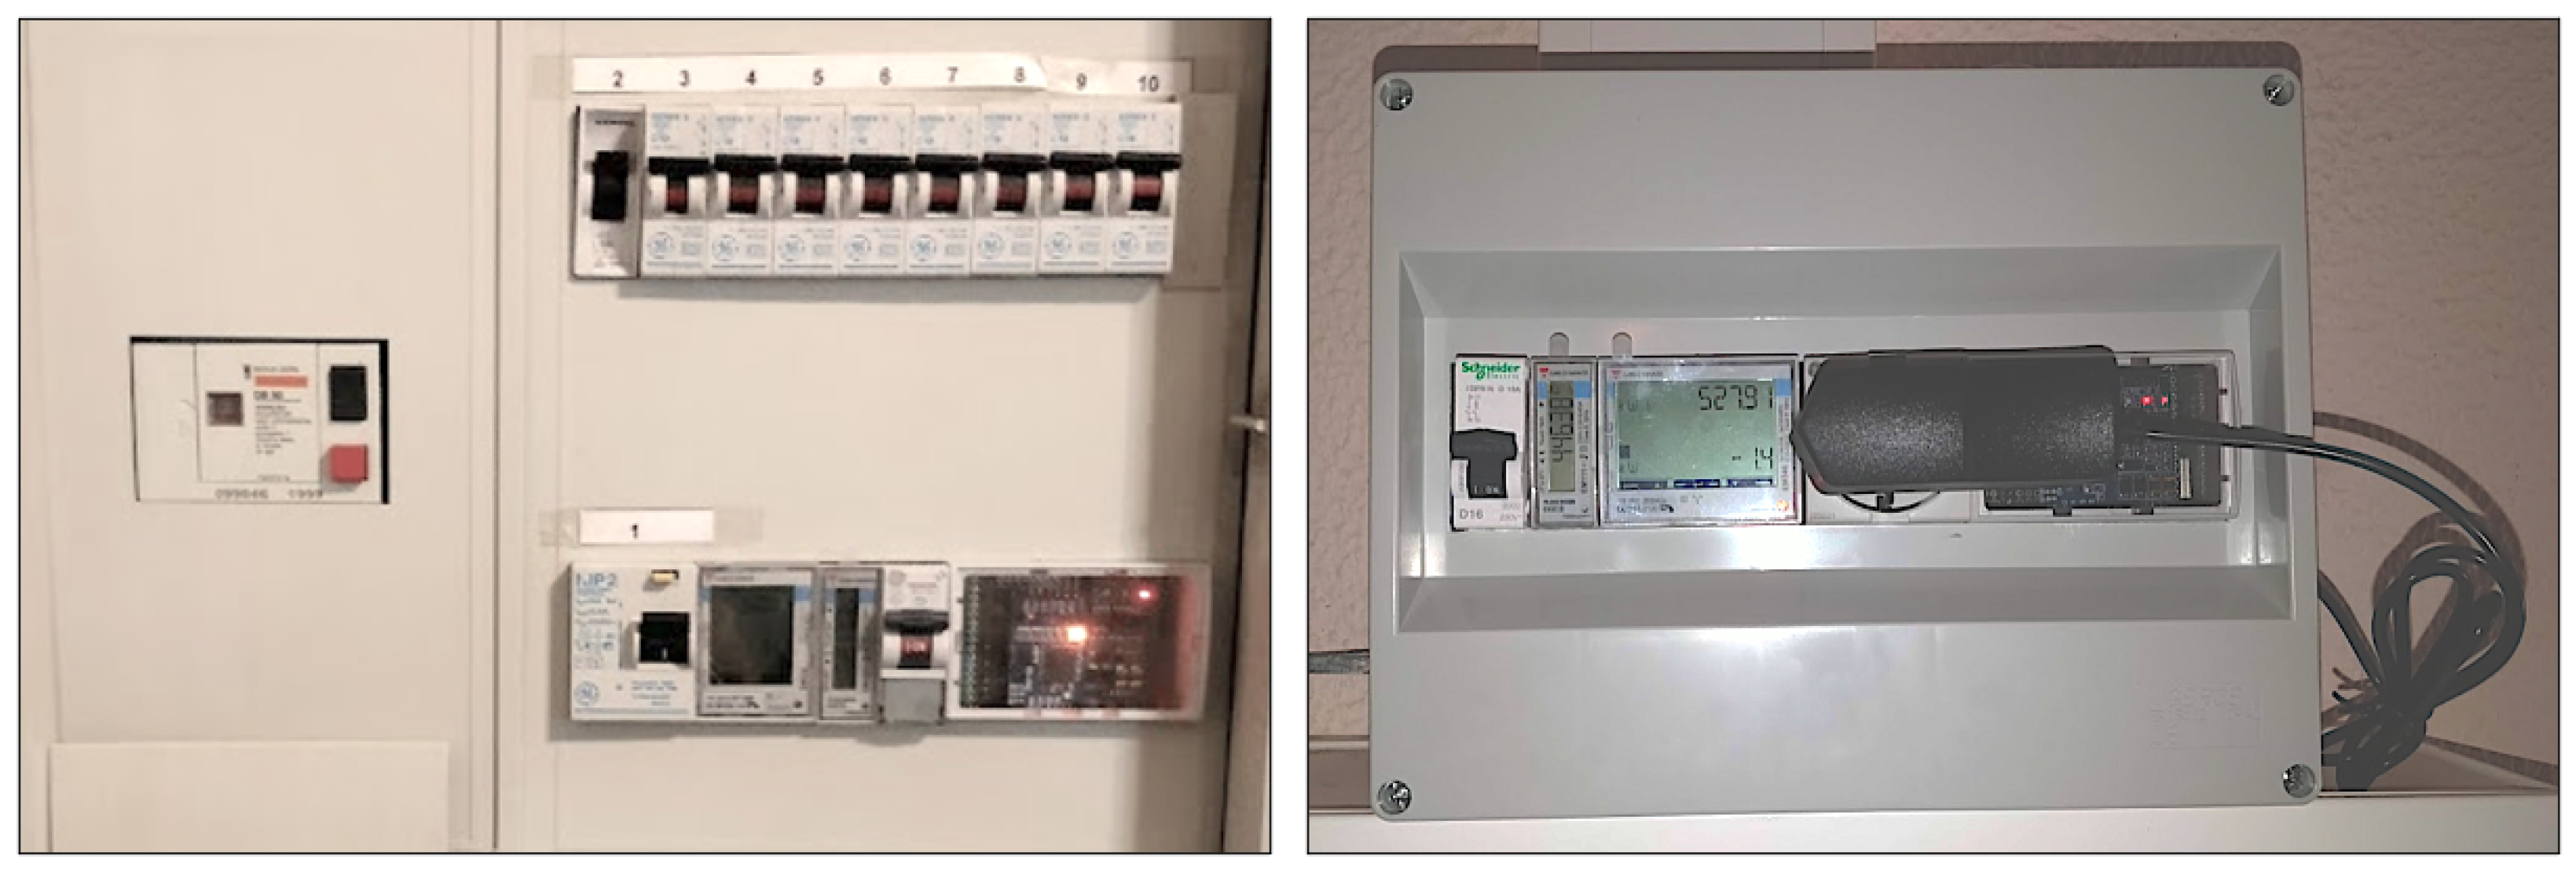
Nine of the 13 sites had no metering equipment installed. In those situations, all the monitoring had to be retrofitted. Hence the GT and the CG energy monitors were installed in the mains. The objective was to measure electricity consumption and production accurately. Therefore, the CG meters were positioned between the grid and local loads to measure the grid consumption and between the inverted and the local loads to measure PV production. Two major typologies were found, see
Figure 6, CG Meter 1 is responsible for measuring the PV production, and CG meter 2 measures the consumption. The installation was different for every site, in some instances all the equipment was enclosed in the main fuse-box, in other cases a box had to be installed adjacent to the rest of the equipment.
Figure 2 presents an example of two of the installations. There was also a situation (S11), in which the consumption and production had to be measured apart, in that situation another gateway had to be installed.
In the remaining four installations, a hybrid approach was followed. In those sites, there was already equipment responsible for monitoring electricity consumption and(or) production. Such cases were addressed by querying the already installed device for the needed consumption/production data. This procedure could be accomplished by the GT or the ESB, connecting directly to the monitoring equipment, or parsing content from a vendor website.
Table 1 presents the installation approach followed at each site.
4.2. Running the Case Study
In general, it was observed that even though the proposed infrastructure is still a prototype, it behave robustly during the pilot. All the sites reported in this article are using the system continuously for approximately three years.
Nonetheless, specific issues resulted in data missing at the ESB. These issues affected the GT and made it impossible to push the site’s data to the server. The leading cause of problems was the SD card used by the Raspberry Pi at the GT. In specific usage scenarios, the SD card got corrupted. These issues were more common during blackouts (which turned the system off without notice) and in periods where there was an overload of writing and reading commands. Since the Raspberry Pi’s SD cards holds the operating system, programs, and all the user data, an event such as described above effectively disabled the GT. The only solution for this issue was to write a copy of the operating system and programs to a new SD card and replace the damaged one at the affected sites. During the case study, those issues were solved by adding a UPS to the GT, which assured a smoother electricity delivery and shut down during a blackout. An higher rate SD cards were also installed at the GT, and finally, the writing procedures were re-designed so that all the writes happen in bulk every minute, reducing the stress in the SD card. In tandem, these procedures eliminated the issues mentioned above.
Other obstacles encountered during the case study were mainly related to the GT communication to the ESB. Several conditions could cause this issue, for example, the site owner changed the WiFi password, or the location of the router (which could reduce the WiFi signal strength), or even the 3G USB dongle got loose. In all these situations, the research team first attempted to solve the issue remotely. If no solution was found, a visit to the site had to be scheduled to solve the problem. A common solution was to changed the communication method, for example, from WiFi to 3G if the WiFi coverage was compromised.
Finally, it is also important to consider that the monitoring does not happen in a vacuum. Each site represents a household or small commercial area. During this long-term case study, site owners often needed to introduce changes to their installation, such as increasing the PV installation capacity, improving the reliability or safety of the site grid, or even more broad renovations at the site. This fact meant that the sensing also had to evolve,
Table 1 presents the sensing approaches employed. It is noticeable that for sites S1,S8 and S11 the approach changed during this period, and new strategies had to be implemented. The flexibility of the proposed system allowed it to cope with all the introduced changes at the sites.
4.2.1. Data Collection Campaign
The monitoring approach returned the expected results. When using the GT meters the system was able to acquire detailed information about the site’s consumption and production. The GT managed to push the consumption data at 1 minute intervals whenever it was possible to establish a connection with the ESB. The GT also managed to recover from periods without an internet connection, pushing all the data accumulated in that period. This situation happened in several sites, in which systems remained offline for more than two weeks but were able to recover once the internet connection was re-established. This behavior was verifiable both for the low and high-frequency data. This strategy is, of course, limited by the memory of the GT. If the systems remain offline for a longer period (>1 month), their memory could fill up, rendering the system unusable. There were no instances of this phenomenon during the presented case study. During the case study,
EnnerSpectrum was capable of capturing 95% of all the production and consumption samples measured by the system.
Table 2 presents a summary of all the captured electricity consumption and production data.
4.2.2. Interfacing
One of the goals of retrofitting monitoring equipment in existing buildings is to make the consumption information available for other services. In this case study, after the consumption data was pushed to ESB, it was made available for services such as the administration and end user services already mentioned in this article. The ESB also made the information available to other services, such as a battery energy storage system control algorithm. Furthermore the high frequency data was also used offline, to study each site consumption patterns.
5. Lessons Learned and Recommendations
This section discusses the results presented above and provides several recommendations that emerged from the long-term case study.
5.1. Buildings Characteristics
When running the pilot, one of the biggest challenges was adapting the monitoring equipment to the building characteristics(see
Table 1). As discussed before,
EnnerSpectrum had a standard configuration that fitted most sites but had to be adapted for particular installations. However, the most significant challenge was not adapting the metering but understanding the installation at each site. In some of the sites, the installations were new and well documented. In other sites, the electric installations were old, complex, and were subject to more than one renovation intervention throughout the years. The screening visits organized before the deployment were crucial to learn the installation characteristics and prepare the
EnnerSpectrum system before the deployment. The presence of a qualified technician who accompanied the team during these visits was essential since he provided hints about necessary equipment, a fitting location, installation duration, and the overall feasibility of the site.
5.2. Hardware Deployment
As discussed before, the different typologies and building characteristics (see
Figure 6 and
Table 1) can significantly hinder installing new monitoring equipment. It is clear that for most buildings monitoring services such as presented here need to be retrofitted since the cost of significantly changing the installation to accommodate monitoring equipment is prohibitive. This requires a platform that can adapt to different equipment, data models, locations, or acquisition frequency. In the presented case study, the infrastructure interacted with the standard CG meters. Nonetheless, it also collected data from DC meters, web services, web parsers, totaling six different metering approaches and two different typologies. Since the start of the case study, the
EnnerSpectrum system was also used to control battery storage systems, electric vehicle charging, monitor humidity and temperature from the sites, aggregate sub-station level data, and even monitoring electricity and water usage in industrial kitchens, further validating its flexibility. This was possible since the
EnnerSpectrum architecture employs two main computational elements. The GT and the ESB. The GT interacted directly with the hardware on the site, organizing the data in a consistent data model and working as a local database for periods without an internet connection. The ESB aggregated all the data and provided services that combined different data sources, such as the visualizations presented here. This way, one can argue that the proposed architecture allows interaction with almost all monitoring equipment that uses open protocols for communication.
5.3. Running the Pilot
Running a pilot of electricity monitoring for more than 2 years presents its challenges and lessons learned. The research team encountered some issues during the first months of the case study, primarily related to the internet connection and the SD-Card. After those initial issues, the (non-planed) visits to each site were rare. The installation of a GT with a constant internet connection allowed the team to update the sensing software several times during the study without visiting the site. One of the updates was installing a third-party service to monitor the state of each installation and, if necessary, alert the research team through a Slack bot. Withal, perhaps the main challenge running this study in the real-world is related to the “real world” aspect. The equipment was installed in households, which sometimes introduced changes in routines that had to be assimilated by the occupants. Participants had questions and were seldom apprehensive regarding the equipment and the impact on their household. Questions regarding the interface directed and the participants were also typical. After approximately 15 months, it was decided to hire a new member to the research team whose primary job was to handle the human side of the study, answering participants queries, scheduling routine visits, and actively engaging with participants regarding updates in the pilot (for example informing about a new visualization added to the front end). This decision significantly improved the pilot’s handling for both the participants and the rest of the research team.
6. Limitations
It is crucial to scrutinize the results as an exercise to uncover limitations and opportunities for future research. Firstly, the cloud nature of EnnerSpectrum requires an internet connection at the site. Even though this requirement seems uncomplicated since most households have Internet access, this observation is not accurate in all countries, and, as it was experienced during the case study, even modern sites with a good internet connection can have dead spots, especially in the more concealed places. This issue was mitigated using a 3G USB dongle for communication, yet this solution was not effective 100% of the time. As it was broadly discussed in the introductory sections, some monitoring equipment vendors do not provide easy cloud access to the data. To tackle this issue, the proposed system employed the use of HTML parsers from ESB. This approach was practical during the case study. However, it relies on the vendors not changing the organization of those HTML documents. Lastly, it is relevant to note that retrofitting the sensing approach can be cumbersome for particular sites since the GC are pass-through meters. The installation needs to cut the electricity from the site. However, the research team remains confident that this was the best decision given the quality of the data returned from GC, which was required for other studies during the case study.
7. Conclusions
This paper presented the EnnerSpectrum system, a sensing agnostic infrastructure to monitor electricity consumption in buildings. The system was deployed in 13 sites for approximately 36 months. In this case study, the infrastructure was adapted to different scenarios to measure electricity consumption and production. On average, the infrastructure was capable of capturing 95% of all the possible data points. Considering that three sites had interventions that left the site offline for several days, it is conceivable to argue that the proposed approach successfully reach its purpose in a heterogeneous sample of prosumers.
The presented work also uncovered other results regarding running a long-term pilot in the real world. The EnnerSpectrum system managed to cope with several changes in the site’s infrastructure. Furthermore, the research team also had to adapt for such long-term deployment, incorporating human resources to meet participants’ expectations regarding the communication of the pilot progress and to assess the state of each site infrastructure before and during the study.
This paper focused on the method used to measure electricity consumption and production. However, since the start of the deployment, EnnerSpectrum integrated other data sources, such as vehicle charging or battery consumption. The centralized nature of the proposed architecture also allowed to develop services that consider data from different sources, such as vehicle or battery charging optimization and control. It is also essential to consider that, while this paper focused on the technical description of the sensing approach used by EnnerSpectrum, further studies should consider how households adopted the technology and if it produced any changes in behavior.
To finalize, it is suitable to lay out future research paths for the proposed approach. Apart from the user and data-centric possibilities mentioned in the previous paragraph, further research should also consider the technological aspects of the solution. The system already evolved to integrate the control of battery storage systems and to acquire plug-level data. However, the energy field is in constant evolution, and new services will emerge that can challenge the flexibility of EnnerSpectrum for example, the integration with specific loads like cooling and heating or other sensors, furthermore the centralized nature of EnnerSpectrum can enable the development of new services which take into account data from different sources. On a more practical level, other improvements should consider an offline mode that could rely on the data present on the GT if no internet connection is available. Furthermore, a real-time connection to the GT would be an interesting improvement. Currently, new data is available every minute. With real-time communication, services could push some of the processing to the GT, to, for example, directly alert consumers once an unusual event happens. Another important improvement to the solution would be implementing a cashing system for the most common queries to improve the system’s scalability.


 ,
, 


