Article

Macroeconomic Efficiency of Photovoltaic Energy Production in Polish Farms

by
Marcin Bukowski
1,
Janusz Majewski
2 and
Agnieszka Sobolewska
2,*
1
Institute of Economics, The State University of Applied Sciences in Elbląg, Wojska Polskiego 1, 82-300 Elbląg, Poland
2
Institute of Economics and Finance, Warsaw University of Life Science-SGGW, Nowoursynowska 166, 02-787 Warsaw, Poland
*
Author to whom correspondence should be addressed.
Energies 2021, 14(18), 5721; https://doi.org/10.3390/en14185721
Submission received: 29 July 2021 / Revised: 3 September 2021 / Accepted: 7 September 2021 / Published: 10 September 2021
(This article belongs to the Section A: Sustainable Energy)

Abstract

:
The public’s awareness of threats to the natural environment, as well as the hazard to human lives and health posed by the use of fossil fuels to generate energy has resulted in the growing interest in renewable energy sources, thus promoting attempts to reduce the dependency on conventional energy sources. Among the former, solar energy is one of the most promising. The aim of this study is to assess the macroeconomic efficiency of investments in photovoltaic installations to meet the demand for electricity of farms and agricultural production. Calculations were prepared for 48 variants comprising three farm types (dairy farms, field cropping farms, and mixed production farms), as well as 16 locations throughout Poland. The obtained results indicate high efficiency of electricity production using photovoltaic installations to cover the needs of farms in Poland. In macroeconomic accounting, NPV ranges from EUR 8200 to almost EUR 23,000, with the payback period depending on the farm type ranging from 4.3 up to 6 years, while the internal rate of return amounts to 21–32%. Increasing the scope of investments in photovoltaics (PV) to cover the electricity demand not only of the household, but also of the agricultural production leads to improved economic efficiency of energy production both in the macro- and microeconomic terms.

1. Introduction

The growing human population, together with the socio-economic development and the resulting efforts to improve living conditions globally, are factors contributing to the increasing demand for energy observed worldwide [1,2,3]. The awareness of environmental threats as well as the health hazards brought about by the use of fossil fuels to produce energy [4,5,6] promote growing interest in renewable energy sources and attempt to reduce our dependency on conventional energy sources [3]. In 2020, the share of renewable energy sources in the gross final energy consumption was 20% for the EU as a whole and 15% in Poland, with an upward trend observed for the use of renewable energy sources in power engineering, the heating and cooling sector, and transport [7]. According to Ślusarz et al. [8], mobilisation of the potential renewable energy sources in Poland will make it possible to cover 73% of the national electricity demand. The increased utilisation of renewable energy sources is considered to be a key factor in determining the transition to a prosperous, sustainable, and environmentally friendly economy.
Solar energy is considered to be a highly promising and major renewable energy source [9,10,11]. Its use was previously limited mainly by economic factors (high cost of infrastructure and low efficiency) [12]. The greater efficiency of photovoltaic panels (PV), reduced investment costs [12], along with an increase in electricity prices on the energy market [13,14] and numerous programmes supporting investments in technologies utilising solar radiation [15,16,17,18,19], have made it possible to overcome the economic barriers. The conducted analyses indicate the economic efficiency of these investments [20,21,22,23,24,25,26]. In 2019, solar energy in the EU accounted for 6.7% of the energy generated from renewable sources, whereas in Poland it was 1.4% [7].
Agriculture plays a key role in the national economy, primarily by producing food. Over 10% of the working age population in Poland are employed in agriculture [27] and the share of agriculture in GDP is approx. 3% [28]. Most of the agricultural machines and equipment are driven by energy generated from fossil fuels [29]. The promotion of the use of renewable sources in rural areas is essential in view of its high potential. According to Ślusarz et al. [8], in Poland, only urban and industrial centers would require support from the conventional power engineering sector.
Problems related to the use of photovoltaics have been investigated in many studies and analyses. Among other things, they focused on satisfying the demand for electricity in agricultural settlements located on islands or in remote areas, having no access to the energy transmitted by the power grid. The conducted analyses indicate that such installations may meet the demand of both households and agricultural production (primarily the irrigation of field crops). However, they require financial support in order to reach economic efficiency [30,31,32].
Particular attention needs to be focused on agrivoltaics (also called agrophotovoltaics), which combine the generation of electricity with agricultural production in the same area [33]. Such an approach assumes that farmlands, on which photovoltaic installations have been constructed, will not be excluded from agricultural production—in contrast to typical photovoltaic farms requiring changes in land use [25,34]. The research conducted in this respect was mainly concerned with the effect of PV installations on greenhouse roofs on plant growth, as well as the volume and quality of crop yields. The obtained results show several benefits of this solution [20,21,26,35,36,37,38,39,40]. Greenhouse cultivation requires considerable amounts of energy to control the internal environment, which depending on the climate, is used in cooling, heating or lighting [41]. This energy is frequently derived from fossil fuels and collected from the grid [3], thus leading to the considerable interest in the potential application of photovoltaics. The effect of PV on field crops grown outdoors and outside greenhouses was investigated, e.g., by Cho et al. [42], who compared the quality and volume of grape yields from plantations, in which various panel types (conventional, bifacial, and transparent) were used with those of crops grown with no such installations or by Amaducci et al. [38], who conducted simulations for maize culture in northern Italy.
Photovoltaics are also used to meet the electricity demand of farms specialising in animal rearing and breeding. The use of photovoltaic systems attached to the grid in dairy farms producing energy for the household and for animal production (lighting of buildings, milking, water heating and pumping, milk cooling, etc.) was studied, e.g., by Bey et al. in Algeria [22] and Neto and de Carvalho Lopes in Brazil [43]. Studies are also being conducted on the potential use of energy generated by photovoltaic cells, particularly to maintain the thermal comfort of animals in pig [20,39] and poultry production systems [44,45].
Most of the studies have been primarily concerned with the effect of photovoltaic installations on the volume and quality of production [3,39,40,42,43,46,47,48], while only to a very limited extent considering economic aspects. Querikiol and Taboada [31] compared the economic efficiency of the use of solar energy and diesel oil to cover the demand for energy to irrigate agricultural crops in the Camotes Islands (Phillipines). Depending on the assumed oil price, a greater efficiency was recorded for PV or the mixed system. The application of PV replacing diesel oil to provide electricity to households and to pump water in Palestine was investigated by Ibrik [30], who showed a greater economic efficiency of photovoltaic systems. Bey et al. [22] as well as Dinesh and Pearce [25] compared the costs of photovoltaic installations with the value of energy they generated. The results obtained by Dinseh and Pearce [25] showed a 30% increase in the economic value of farms after they implemented agrivoltaics. The economic effects attainable thanks to agrivoltaics to a considerable extent depend on the amount of energy which may be generated, while maintaining the required production quality [49]. The analyses concerning the cost of generating 1 kWh were conducted, e.g., by Nacer et al. [21] in dairy farms, Valino et al. [20] in piggeries, and Schindele et al. [26] in field crop cultivation.
The production of electricity using solar panels is an example of an investment, in which both costs and benefits affect a greater social group. In accordance with the theory of welfare economics, functioning within the framework of normative economics, the social aim of resource allocation in a free market economy is to maximise social welfare. The distribution of resources between the individual members of the society needs to follow the Pareto criterion. Pareto optimality is a situation preventing such a reallocation of resources, which would lead to the increased welfare of an individual(-s) at a simultaneous welfare deterioration of the other individuals [50,51]. The present-day market economy does not always guarantee the optimal utilisation of resources. In all the situations, the equilibrium is within free, unregulated markets (i.e., markets not subjected to a direct price or quantitative and do not lead to an efficient allocation of resources are termed “market failure” [52,53,54]). The main sources of market failure include imperfect competition, unfair distribution of goods, economic instability, imperfect information, the existence of public goods, and externalities. The latter consists of the transfer of a portion of costs or results from the operations of one’s entity to other entities with no compensation. These effects are not considered in the transactions and appraisals/costing and are not reflected in the costs or benefits of their producer.
Externalities result from the difference in final costs and in marginal utility between the micro- and macroeconomic. In the case of negative externalities, the marginal social costs exceed the marginal costs of the entity, which cause the externality. Taking environmental effects into account in the economic calculus puts the issues of this article into the “green economy” trend [55,56,57]. A green economy can be defined as one that improves welfare and social equity, while significantly reducing environmental risks and ecological scarcities [58]. It has low carbon, is resource efficient, and inclusive. In practice, a green economy is one where income and employment growth is driven by public and private investments that reduce dioxide carbon emissions and pollution, increase energy and resource efficiency, and prevent the loss of biodiversity and ecosystem services [59,60].
The concept of “green growth” [61,62,63] points to the need to develop and diffuse technologies that bring environmental benefits [64]. From an economic point of view, however, there may be concerns as to whether investments in green technologies, including renewable energy technologies, are socially optimal [65]. In this situation, there are challenges related to taking into account the positive and negative aspects, both environmental and social, of the valued goods and services [66]. This is especially important since the development of green technologies, green energy, and low-energy sectors, which are the essence of what is understood as green economy, is possible thanks to the support of investments from public funds. The analyses conduced so far, to evaluate the efficiency of energy production from renewable sources, focused primarily on microeconomic accounting, disregarding the externalities of such operations. In our study, it was decided to conduct a macroeconomic evaluation (from the social point view, in the perspective of the entire population) for the efficiency of investment in a photovoltaic installation to meet the demand for electricity in three farm types (dairy farms, field cropping farms, and mixed production farms) operating in Poland. Local conditions and regulations were taken into consideration, as they distinguish the energy market in Poland from that of other EU countries [67] and have a considerable impact on profitability of such investments [68,69]. To date, the studies conducted have focused on the microeconomic efficiency (from the point of view of a single farm) for the PV system [20,21,22,25,26,30,31,35]. A novel element in this study is connected with the evaluation of economic efficiency of electricity production using a PV installation from the point of view of the entire society (macroeconomic accounting). Therefore, it expands the approach applied to date, according to which the economic evaluation of an enterprise was conducted solely from the point of view of an investor (microeconomic accounting). Following the economic theory, there are many differences between micro- and macroeconomic accounting [70,71,72]. In this study, the conducted evaluation of macroeconomic efficiency was based on the volume of costs and benefits determined in microeconomic accounting. In social accounting, these values were adjusted based on:
Elimination of the effect of these elements on flows of values, which constitute cash transfers;
Correction of the amounts of flows of values based on the value of externalities.
The identified externalities resulting from the construction of PV installations include the contribution to improved atmospheric air quality. The estimate of environmental external benefits was based on the estimate of prevented environmental losses, thanks to the replacement of energy generated from fossil fuels with that produced using solar panels.
Additionally, a novel element in this study is connected with the macroeconomic aspect of benefits and costs of photovoltaics used to satisfy the demand for electricity both for the household and agricultural production. A major part of this paper is devoted to the regional variability in the macroeconomic efficiency of investments in photovoltaic panels depending on the farm type. In the opinion of the authors, in view of the extensive public subsidising of photovoltaic systems in agricultural areas, it is an important problem and thus, requires extensive research.

2. Materials and Methods

2.1. Indicators in the Evaluation of Investment Economic Efficiency

The aim of this study was to assess the economic efficiency of electricity production using solar panels, from the point of view of the entire population (macroeconomic accounting). This accounting is particularly important in the case of projects having an environmental impact, e.g., production of energy using renewable sources, since outlays and particularly the effects of such economic activity affect large groups within the society. This evaluation concerned the efficiency of PV installations mounted on the ground and used to generate electricity to cover the needs of the household and the demand related to the agricultural production. Ground-mounted photovoltaic modules facilitate the optimisation of module settings in order to reach the best possible insolation (solar panel orientation—southern exposure, tilt angle of 30°), and thus to generate the greatest amount of energy. An additional factor influencing the selection of this PV system is connected with the limited rooftop area of farm buildings, which in many cases is insufficient to mount a sufficient number of solar panels, in order to ensure that the produced energy covers the entire demand for electricity in the household, together with the energy used for agricultural production processes [43]. This results from a study by Zeraatpisheh, Arababadi, and Saffari Pour [73], in which the rooftop photovoltaic system produces more energy than the ground-mounted PV in regions of hot climates. In contrast, no such dependence was observed for temperate climate regions.
The production of electricity using solar panels is a long-term enterprise. For this reason, the economic evaluation of such investments should be conducted using the cost-benefit methods, considering the timing of various related outlays and effects [74]. The following indexes evaluating the economic efficiency were used in this study:
  • Net present value—constitutes the difference between the sum of discounted future cash flows generated by the project and the value of incurred investment outlays. NPV is calculated according to the following formula [75]:
NPV = t = 1 n C t ( 1 + r ) t
where Ct is the stream of cash flows generated by the project in a given subperiod t (e.g., year), and R is the discount rate reflecting the capital acquisition cost to finance the project. A condition of efficiency is to have NPV ≥ 0 [76];
  • Internal rate of return—indicates the value of the discount rate, in which the net present value of investment (NPV) is 0 [77]. This means that IRR determines the maximum level of capital acquisition cost, in which the project remains economically efficient. Mathematically, IRR may be calculated using the following formula:
t = 1 n C t ( 1 + r ) t = 0
in which the discount rate r is the searched IRR value [75,76];
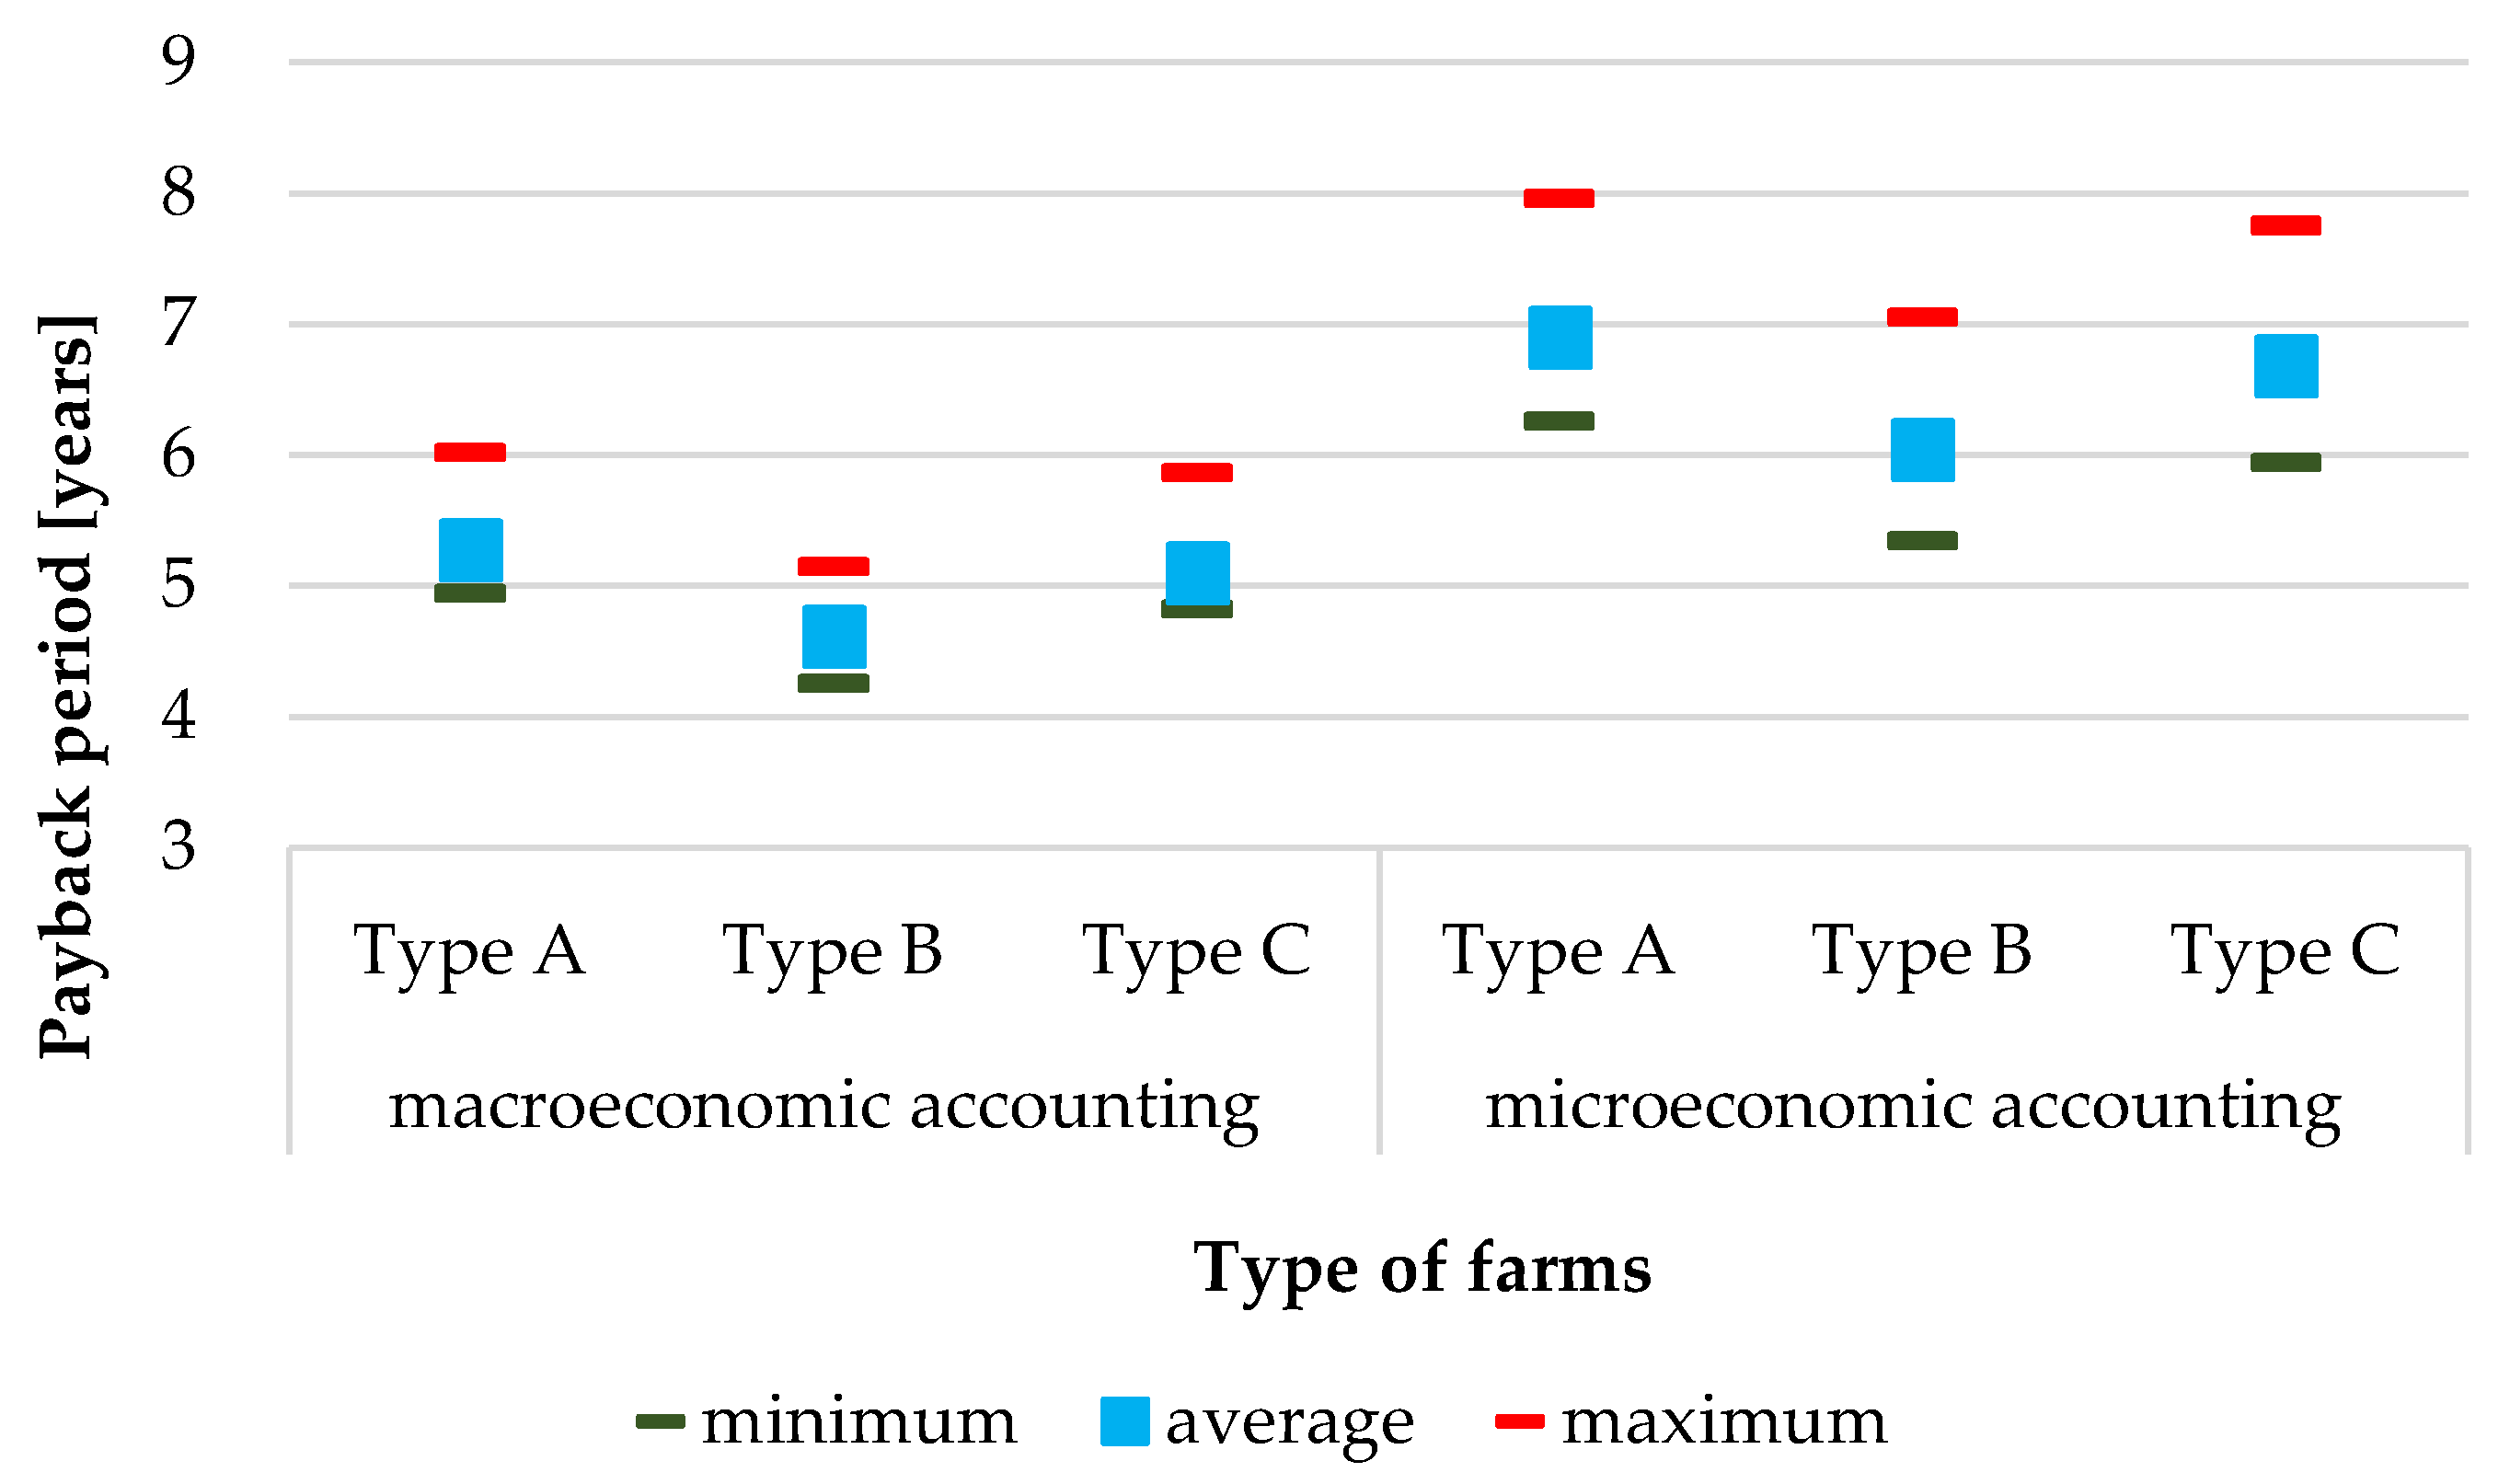
  • Payback period—defines the period of time needed to generate sufficient, positive cash flows by the investment project, to cover the initial investment outlays together with all the earlier negative flows. This is a period, in which the project’s accumulated present net value of cash flows, is zero. A project is acceptable if the period of return is shorter than the period of its economic utility or is shorter than the period of return of incurred outlays accepted by the investor [77,78].
In order to apply the cost-benefit methods to assess the macroeconomic efficiency of investments, it is necessary to determine an adequate social discount rate (SDR). The literature on the subject indicate various approaches to the determination of an adequate SDR. On the one hand, it is recommended to apply the lowest possible discount rate to adequately take the future into account. In a long-term perspective, the adoption of a zero discount rate would mean that the interests of future generations are considered in the accounting to the same extent as the interests of the present generation. In a short-term perspective, this would mean no time preference in relation to the benefits, which contradicts with the general social belief. In turn, a too low discount rate may lead to excessive investments, which will result in increased external costs. A too high discount rate eliminates long-term costs and benefits. In this study, the authors applied the commonly accepted method [6] to calculate the social discount rate, i.e., social time preference (STP) [79,80,81,82]. This method is based on the long-run economic growth rate and takes into consideration the preference for near-term benefits. It also considers the effect of the diminishing marginal utility of consumption, resulting from the assumption that future generations will be richer than the present. For this reason, a unit of future consumption will have less value for the future generations. In other words, it will provide less utility than a unit of consumption for the recent generation. The study results, connected with the calculation of the social discount rate using the social time preference method, were presented by Freeman, Groom, and Spackman [83]. In the opinion of those authors, an adequate discount rate, which may be used when assessing economic efficiency from the social perspective, is an SDR of 3.5%. The value of the discount rate was also adopted in this study.
The investment time horizon, i.e., the period of time, for which a forecast was prepared for cash flows generated by the investment, starting from the first outlays incurred in relation with its realisation, was established for 25 years. This period results from the service life of photovoltaic installations specified based on warranties for materials given by the best solar panel producers [73].

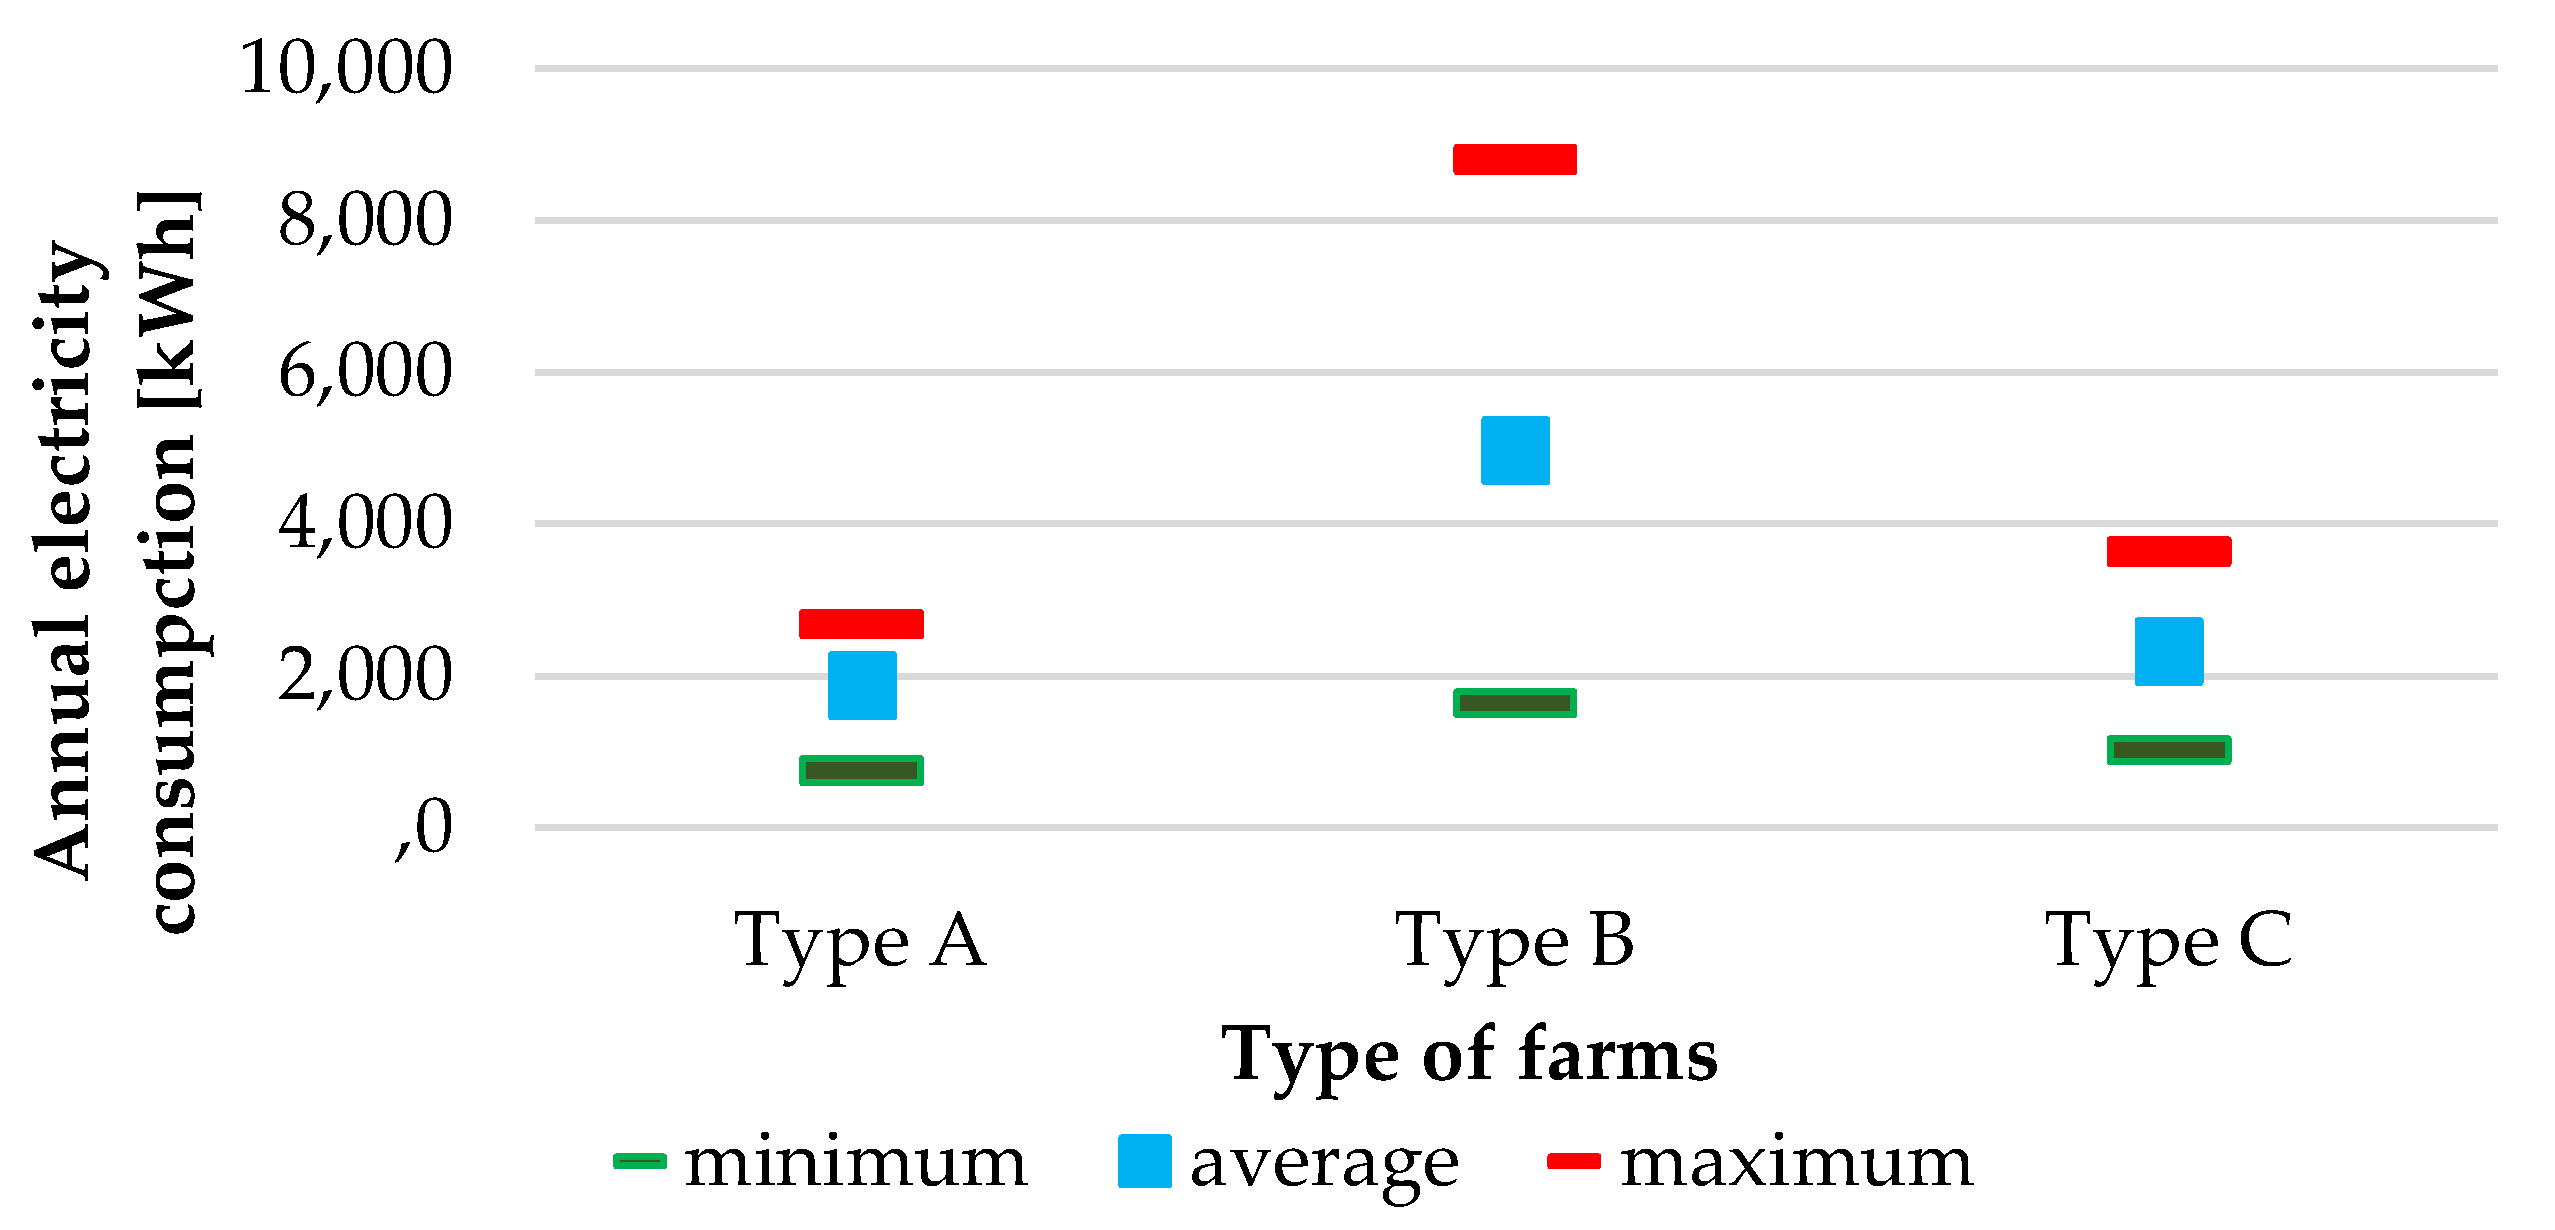
2.2. Technical Characteristics of Analysed Variants

The macroeconomic efficiency of energy production using photovoltaic installations was evaluated for 48 calculation variants, identified based on:
  • Location of the installations—with 16 locations analysed—in accordance with the administrative division of Poland into 16 provinces. The analyses conducted at the level of provinces result from the different characteristics of farms in various regions of Poland and the diversification of provinces in terms of the operator involved in the distribution of electricity. Depending on the geographical location of the province, the solar radiation density also varies. Therefore, the conducted analyses differentiate the economic efficiency of photovoltaic installations depending on environmental and climatic conditions;
  • Farm types—for each location, three farm types most commonly found in Poland, were selected:
    (a)
    Type A—farms specialising in field crops, including, e.g., farms specialising in growing cereals and oil crops;
    (b)
    Type B—dairy cow farms;
    (c)
    Type C—mixed production farms.
Among the Polish farms participating in the European Farm Accountancy Data Network (FADN), these three farm types account for over 80% of the total number of farms covered by FADN [84].
The data presented in this paper concern the photovoltaics installed in Poland and the evaluation of their efficiency results, e.g., from the binding support system for renewable energy production based on the national legal acts and documents of strategic character [85,86,87]. However, the assessment method presented by the authors taking into consideration the social costs and benefits may be applied on a global scale. It only requires the adaptation of the adopted assumptions to the specific character of a given country, while taking into consideration both its geo-climatic and legal condition.
The economic efficiency of electricity production using solar panels is evaluated based on the installed capacity of the installation. In the case of a microinstallation, the best method to select the capacity is to apply the approach related to the annual balance, in which the capacity of panels needs to be selected in order to minimise the difference between the energy demand of the household within a year and the energy generated by the installation [88]. For this reason, in this study, the determination of the value of investment outlays related to the production of electricity using solar panels was based on the annual electricity demand of the farm, including household energy consumption and the demand resulting from the agricultural production processes.
According to the data of Statistics Poland (formerly the Central Statistical Office), the electricity demand for a model Polish household in a rural area is 3006 kWh per year [89]. The level of electricity demand related to the agricultural production of a farm was determined based on FADN data. The greatest electricity consumption is observed in the case of dairy cow farms, while it is lowest in farms with the predominance of field crop production (Figure 1). This is connected primarily with the production technology used. In this case, animal production due to the use of many additional machines and equipment (e.g., automatic milking machines, milk transport, and cooling systems) is all powered by electricity, and thus is characterised by greater energy consumption compared to plant production. A considerable variation in energy consumption for the needs of agricultural production may be observed between the individual provinces. In all the farm types, the lowest energy consumption is recorded in the Świętokrzyskie and Podkarpackie provinces. In turn, those with the greatest electricity consumption related to agricultural production processes include the Kujawsko-pomorskie, Warmińsko-mazurskie, and Wielkopolskie provinces. The observed differences are caused by the regional diversification of farms in terms of their size measured by the farm area and stocking rates.
The insolation of Poland does not differ markedly from that observed in the countries of Central Europe at comparable latitudes. In terms of the utilisation of solar energy by photovoltaic installations, the most important parameter is the annual insolation, which determines the amount of solar energy per surface unit area over a specific time. Considering this parameter, it may be stated that insolation conditions in Poland show considerable regional diversification—annual solar irradiation ranges from 830 to 1050 kWh/m2 [90]. Such an amount of solar radiation reaching a given area is sufficient to cover 60% of the demand for electricity (in the winter months) up to over 100% (in the summer months). A region with the highest annual irradiance is located in southern Poland (the Podkarpackie, Małopolskie, Śląskie, and Opolskie provinces). In turn, north-western Poland is the region with the least advantageous insolation conditions and comprises the Lubuskie, Zachodniopomorskie, and Kujawsko-pomorskie provinces.

2.3. Investment Outlays and Operating Costs of Photovoltaic Installations

The economic efficiency assessment of an enterprise consists of a comparison of the volume of income (benefits) resulting from its realisation with its costs, while also taking into consideration the investment outlays connected, e.g., with its construction. The calculations presented in this study were made at a fixed, current price level (recorded in June 2021). The values calculated by the other authors expressed using the other price levels were updated using the consumer price index [91] and the European Union Consumer Price Index (CPI) [92]. The values expressed in PLN were converted to EUR based on the mean EUR exchange rate of the National Bank of Poland for June 2021 [93].
The value of investment outlays was determined based on the insolation recorded in a given province and the annual demand for electricity of the farm depending on its type. The minimum number of solar panels required to cover the total annual electricity demand calculated for the analysed variants ranges from 10 to 31. Further calculations are based on data for the JA SOLAR 385 W solar panel with the following technical parameters:
  • Rated power: 385 W;
  • Maximum power: 291 W;
  • Module efficiency: 20.7%;
  • Temperature coefficient of power: −0.350%/°C;
  • Inverter type—5.0 kW, three-phase.
For comparison, the analyses conducted by the authors concerning the installation of a photovoltaic system to produce electricity only to cover the needs of the household, indicate that this number should be from 8 to 12 [94]. Including the additional demand related to agricultural production processes increases the size of the required photovoltaic system, particularly in the case of a type B farm. Investment outlays for PV installations producing electricity for the needs of farms range from EUR 4340 including tax (in the case of 10 solar panels providing energy for a type A farm in the Świętokrzyskie province) to EUR 9670 (in the case of 31 panels providing electricity for a type B farm in the Kujawsko-pomorskie province).
In view of the considerable social benefits resulting from the replacement of hard coal in electricity production with solar energy, investments involving renewable energy sources are subsidised using public funds. This support is provided through a system of subsidies, tax benefits, and preferential loans. An example of a support programme dedicated to owners or lessees of agricultural land in Poland is Agroenergia. The subsidy granted within this programme for a microinstallation may reach 20% of the eligible costs of this investment and amounts to a maximum of EUR 3330 [95].
From a social point of view, subsidies and tax benefits are transfers of funds. For this reason, when efficiency was determined the macroeconomic accounting considered the total value of investment outlays, which would have to be incurred at a lack of government support. The adjustment of the value of investment outlays consisted solely in the elimination of the value added tax (VAT).
Apart from the investment outlays, the production of energy using PV systems requires annual operating costs. From the point of view of the installation owner, the following operating costs are distinguished:
  • Costs related to the installation insurance—according to the terms and conditions of the insurance applied by an insurance company operating in Poland, the premium ranges from 0.6 to 0.72% of the installation value [96].
  • Costs of repairs and costs related to the elimination of breakdowns—for the first 12 years of the installation operation, such works are performed based on the warranty granted by the firm installing the solar panels. At the expiry of the warranty period, it may be extended for another few years. The cost of servicing is EUR 30/year.
  • Costs of solar panel disposal—the cost of solar panel disposal was established based on the current price list of a firm providing such services and amounts to EUR 0.33/kg. This cost includes the cost of transport amounting to EUR 0.55/km [97]. It was assumed in this study that the mean distance, which decommissioned solar panels that need to be transported, is 100 km.
Moreover, the above costs are an element of the calculations in macroeconomic accounting, which were used in the calculation of macroeconomic efficiency excluding VAT.
The electricity produced using photovoltaic installations is primarily used to meet the current needs of a farm. If the current production of energy exceeds the current consumption, the surplus is released to the grid. In accordance with the legal regulations binding in Poland within the framework of the so-called net-metering, i.e., a periodical billing system, the installation owner may collect from the grid (in the case of an installation of max. 10 kW) 0.8 kWh for each 1 kWh of energy released to the grid [98].
In the case when the owner of a photovoltaic installation collects from the grid the electricity he produced earlier, no purchase costs are charged. Therefore, economic efficiency depends on the amount of energy consumed directly to meet the current needs. Energy, which is not directly consumed by the energy producer is released to the grid, from which only 80% may be redeemed with no sale fees charges. The rest of the energy has to be purchased based on the rates and tariffs applied by individual suppliers, i.e., differing from region to region depending on the energy supplier in a given area. According to a study by Chwieduk, Bujalski, and Chwieduk [99], the consumption of energy generated by their owners in photovoltaic systems depending on the energy consumption profile of the user, ranges from 27 to 35%. On average, the auto-consumption rate is 30% and this value is adopted in these calculations.
The level of electricity production from PV systems depends on the degree of their wear. The wear of solar panels is estimated at 80% of their initial efficiency after 25 years of service life, according to the warranty granted by the producer for the efficiency of photovoltaic panels [100]. In view of the above, it was assumed that the efficiency of energy production in the successive years of the system operation will decrease exponentially to 80% after 25 years.
From a social point of view, energy production from renewable sources provides additional benefits resulting from a lower level of subsidies to hard coal extraction and reduction of environmental damage, which is caused by conventional power engineering. The estimated value of state financial assistance in the case of electricity production from coal is EUR 2.50/kWh [4]. This value defines the unit social benefit resulting from the replacement of coal power engineering with photovoltaics. The society by replacing coal in energy generation with solar energy saves this amount as an unrealised expense, which would have been paid from public funds as a subsidy to coal mining.
The production of electricity using solar panels is also connected with smaller external costs compared to coal power engineering. From a social point of view, the replacement of coal with renewable energy sources brings benefits due to lower losses resulting from environmental pollution. The external costs of power generation systems refer to all the negative effects related to a given technology of electricity and heat generation, at all the technical stages, such as the construction and then decomissioning of the power plant, extraction and transport of energy materials, as well as emission of pollutants during energy production. In this approach, external costs are determined for the entire life cycle of the process and are not limited to energy production. Such calculated external costs are specific to individual energy generation technologies.
A review of the current studies on external costs related to energy production from various sources is given in a study by Samadi [4]. Based on the estimate of external costs, provided by Samadi for external costs generated as a result of electricity production from combustion of hard coal and its production using PV systems, its difference may be calculated as a unit value of social benefits resulting from an improved environmental quality. The unit value of social benefits from the replacement of energy generated from coal combustion with solar energy is EUR 10.35/kWh.

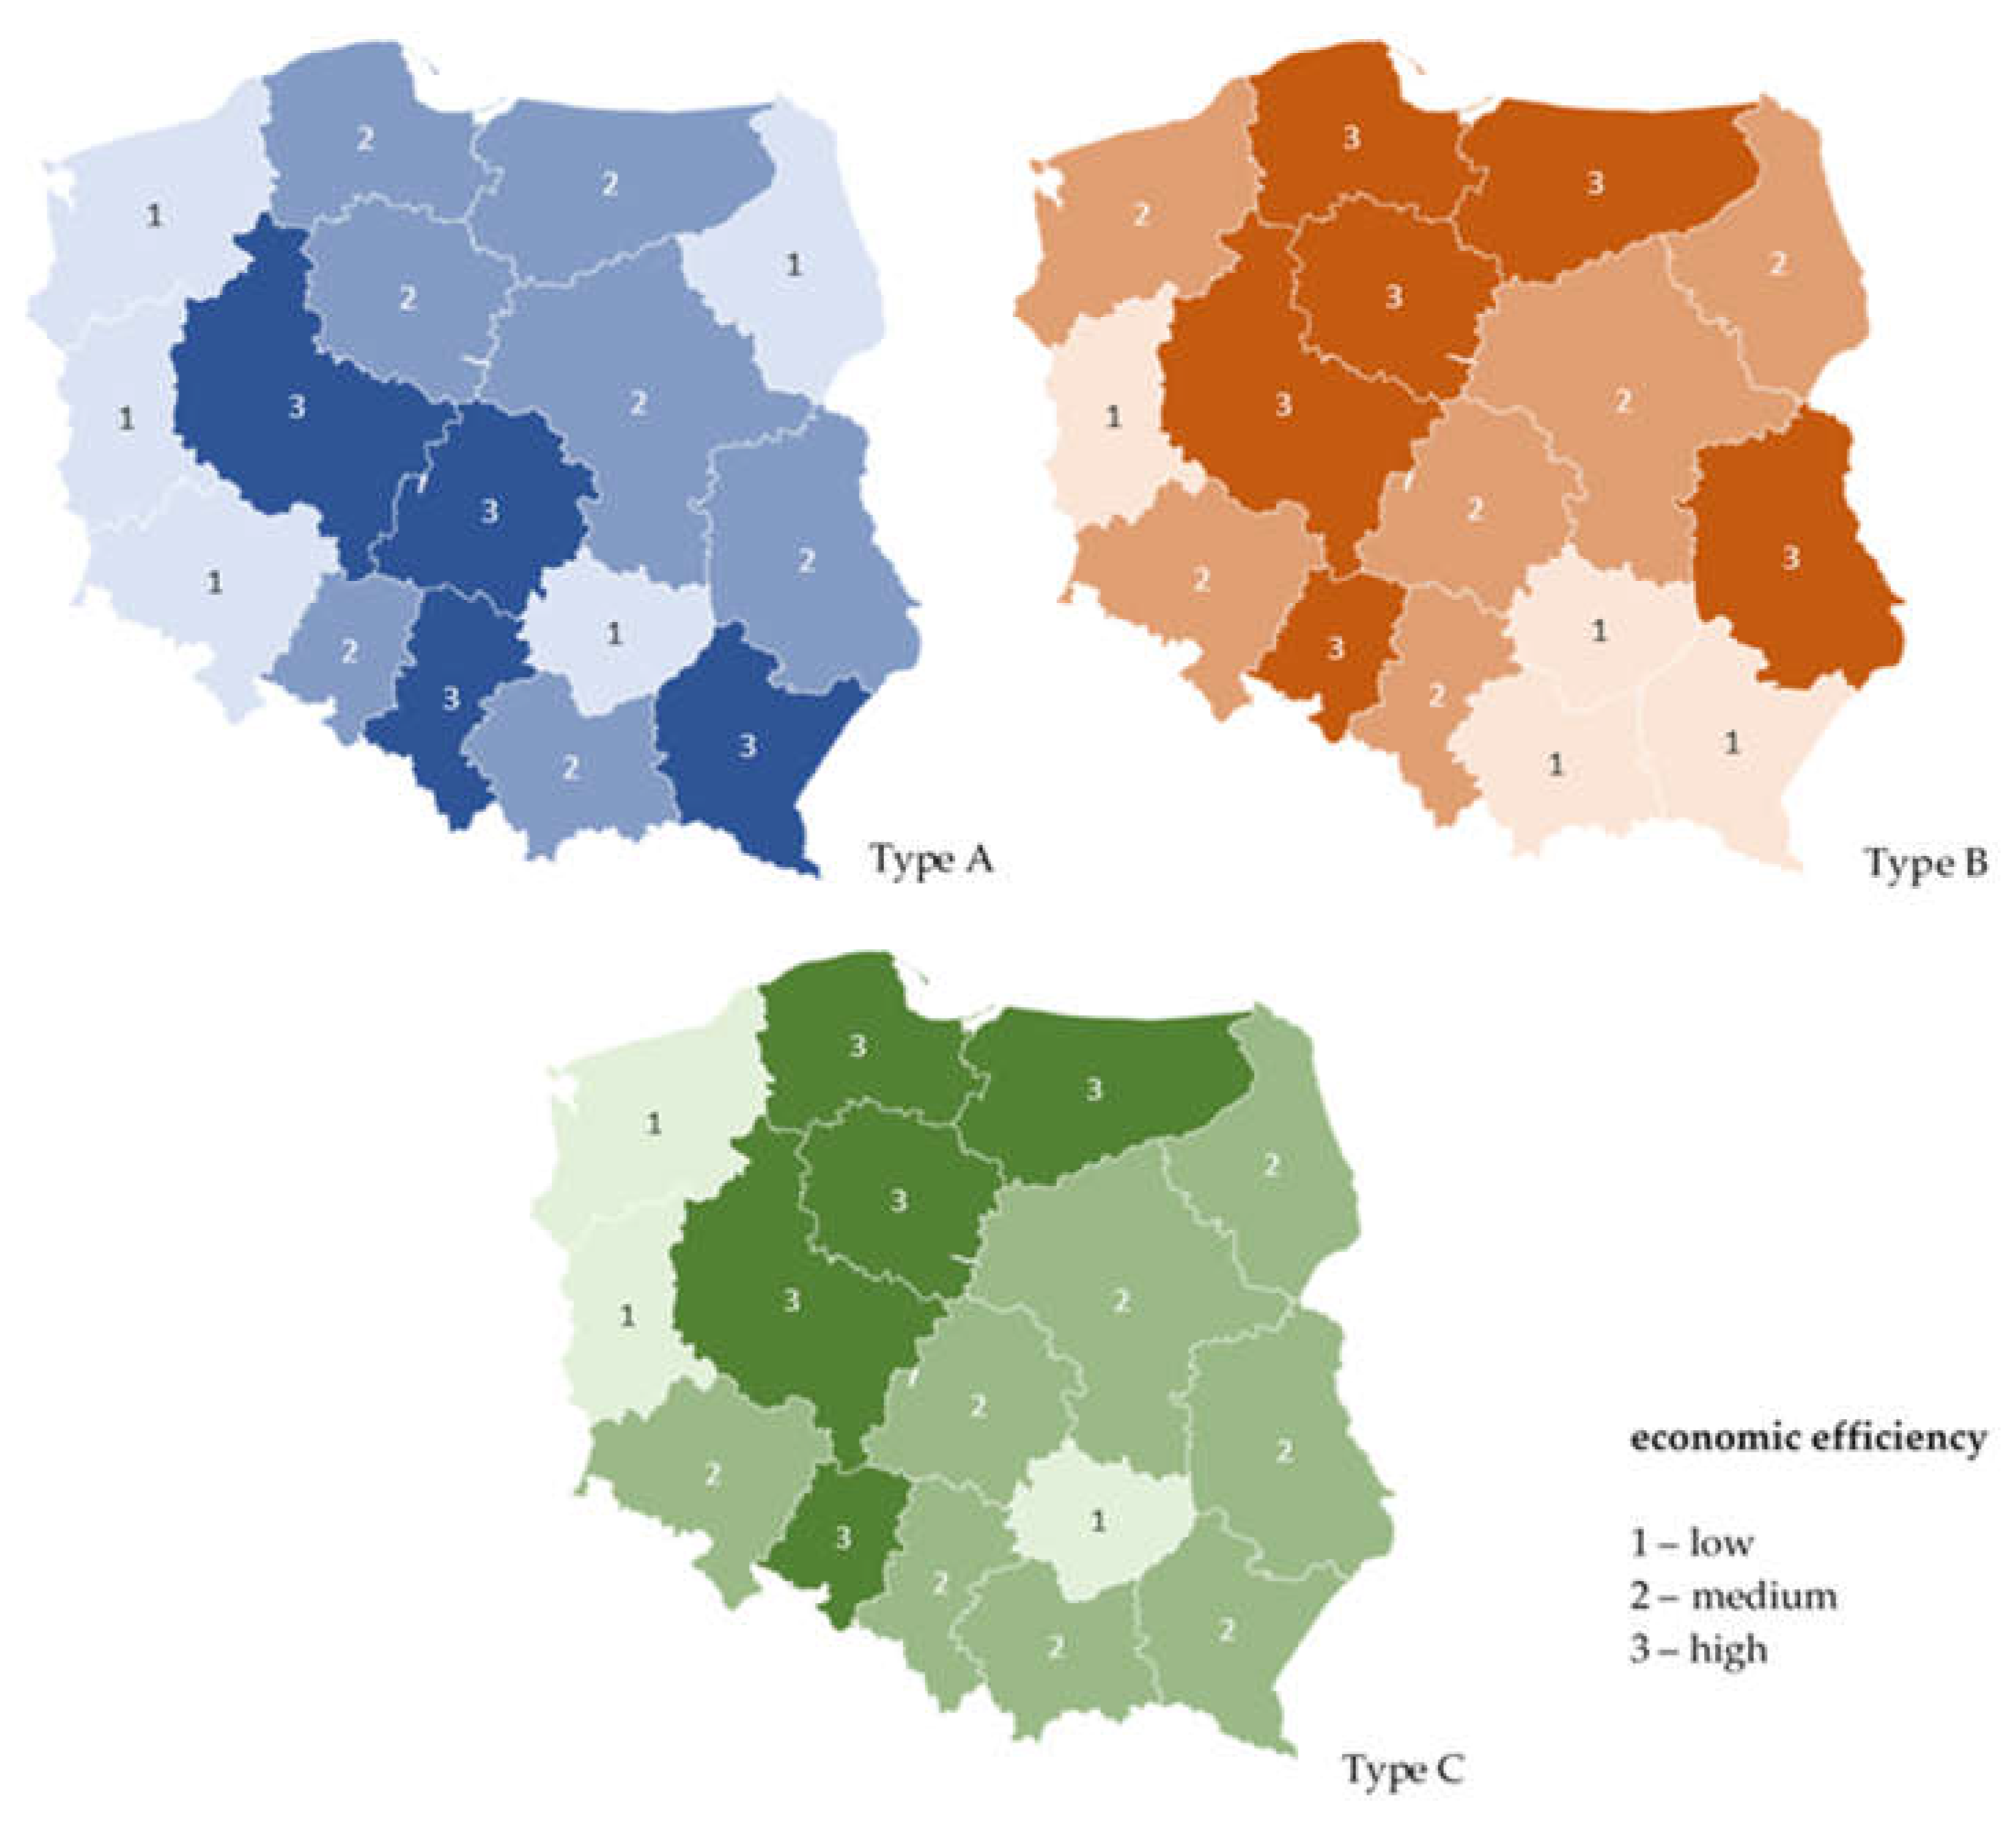
3. Results and Discussion

When comparing macroeconomic efficiency with the microeconomic assessment it may be stated that in macroeconomic accounting this operation is characterised by greater efficiency. This concerns the evaluation conducted based on all the three indexes of economic efficiency. Depending on the variant, the calculated NPV in social accounting is 40–80% higher than in microeconomic terms. The highest NPV amounting to EUR 22,920 in macroeconomic accounting and EUR 16,625 in microeconomic accounting was recorded in the case of a type B farm located in the Kujawsko-pomorskie province. In turn, the lowest efficiency was observed for the investment in the case of a type A farm in the Świętokrzyskie province, where NPV was EUR 8240 in macroeconomic accounting and EUR 5550 in microeconomic accounting, respectively. A greater efficiency of this investment in macroeconomic accounting is caused by the incorporation of additional effects resulting from benefits in the form of reduced external costs and savings in public funds, thanks to the decreased subsidies to mining. The value of additional effects offsets the initial difference in the level of investment outlays between these types of accounting. In the case of microeconomic accounting, the value of investment outlays is lower, which results from the potential subsidy to install the PV system.
The NPV calculated in microeconomic accounting may be compared with other data obtained for Poland. According to a study by Drzymała and Korzeniewska [101], the NPV for a 50 kW photovoltaic installation is EUR 19,068 at investment outlays connected with the realisation of investments exceeding EUR 40,000. Thus, a high NPV results from the high value of investment outlays connected with the construction of photovoltaic installation. From the data obtained for Morocco, the case of a much smaller installation (4.08 kWp), is the NPV, depending on the adopted discount rate range from EUR 4000 (in the case of the rate of 0%) to approx. EUR 0 (for the rate of 6%) [102].
Another index in the evaluation of economic efficiency calculated in this study is the payback period. This index is of particular importance for the investor, since it defines the time which needs to pass for all the outlays incurred so far (including the investment outlays) to be reimbursed, thanks to the benefits resulting from this enterprise. The calculated payback period in macroeconomic accounting, depending on the calculated variant, ranges from 4.3 to 6 years. For comparison, the payback period in microeconomic accounting (from the point of view of the investor) is 1–2.4 years longer. Both in macro- and microeconomic accounting, the fastest return of the incurred outlays and expenses is recorded in the case of the PV systems installed in a type B farm (Figure 2). Due to the greatest demand for energy, the mean payback period for such farms in macroeconomic accounting is 4.6 years. For comparison, the period for a type C farm is 5.1 years and for a type A farm is 5.3 years.
The payback period calculated in this study for microeconomic accounting may be compared with values given by other authors. Among the studies conducted for Polish conditions, we need to mention here a paper by Soliński and Kapała [103] which refers to the economic efficiency of a PV system in a small rural household in the southern part of Poland. The payback period established by those authors was 9–10 years when considering subsidies. However, without this support, the analysed investment was not paid back within the 15 years adopted as the investment time horizon. In turn, Bartecka et al. [104] obtained a payback period of 9 years for public buildings. Górnowicz and Castro [10], when studying rooftop photovoltaic systems of 20 and 40 kWp installed in Poland, received the payback period of 6–11 years. For an installation of 100 kW, Knutel et al. [67] showed the potential return of investment within 8.8 up to 14.74 years, depending on whether the investor undertakes the storage of energy. In the case of a photovoltaic farm of 1.4 MW, Gradziuk and Gradziuk [105] reported the payback period of 9 years when a subsidy is granted and 13 years without subsidies. Our results for microeconomic accounting indicate that the payback period for a PV system, which is to satisfy the electricity demand of a farm, depending on its type ranges from 5.4 to 8 years. Shorter payback periods than those cited above are mainly a consequence of reduced costs of photovoltaic systems, increased efficiency of solar panels, and changes in the system of financial support for such investments in Poland. Additionally, we need to mention a study by Ibrik concerning the replacement of energy generated using diesel oil with energy from photovoltaic panels in agricultural areas in Palestine. For such an investment, the payback period is 3.5 years [106]. An equally short return period—3 years—was recorded in the case of a photovoltaic installation mounted on the roof of a university in Jordan, which is composed of tracking modules with the total power exceeding 15,000 kWp [107].
The last analysed index in the evaluation of efficiency of photovoltaic installations covering demand for electricity in a farm is the internal rate of return (IRR). According to Awomewe and Ogundele [108], IRR may be defined as the economic rate of return from a project, thus this index may be used as a criterion in the decision-making process when selecting various alternative investments. The conducted calculations indicate that the internal rate of return in the case of macroeconomic accounting, depending on the farm type, ranges from 21 to 32%, while in microeconomic accounting, it is from 14 to 20% (Table 1). Similarly, as in the case of the previous indexes, the highest economic efficiency was observed for the PV systems installed in a type B farm. Higher rates of return in macroeconomic accounting result from the greater value of social effects compared to the values of effects from the point of view of the investor.
The IRR values calculated in microeconomic accounting are higher than those indicated by other authors. The internal rate of return given in a study by Brodziński, Brodzińska, and Szadziun [11] for photovoltaic farms, depending on the installed power, ranges from 9.33% to 11.84%. The results presented by Gnatowska and Moryń-Kucharczyk [109] indicate that the internal rate of return for photovoltaic systems depends on the values of investment outlays, electricity prices, and the share of funds from a bank loan in the financing of the investment. In the case of the system financed solely from the investor’s own funds, IRR ranges from 12% to 18% for investment outlays of EUR 533.3 thousand and from 3% to 6% for the installation worth EUR 777.7 thousand. With an increase in the share of the investor’s capital obtained from a bank loan, the efficiency of this investment decreases. Apart from the factors indicated by those authors as influencing the efficiency of photovoltaics, the internal rate of return from such an investment depends on the adopted financial support system from public funds. According to Klepacka and Pawlik [110], in the case of 60% subsidisisation of investment outlays, the IRR for photovoltaic installations is 7–11%, depending on the level of investment outlays. However, these values were calculated taking into consideration the previous mechanism of purchasing energy generated by PV installations, the so-called green certificate system. In the opinion of Górnowicz and Castro [10], in the case of optimal configuration of a photovoltaic system using the currently binding support system for energy purchase, i.e., net-metering, the internal rate of return may even exceed 17%. The value of the internal rate of return is also dependent on the time horizon of the conducted analyses. The calculations made by Bertsch and Di Cosmo [30] for the evaluation of photovoltaic systems producing electricity in various European countries indicate that a shortening of the analysed period from 20 to 15 years results in a decrease of IRR on average by 2 p.p. In contrast, an extension of the period from 20 to 25 years causes an increase in IRR on average by 1 p.p, while its extension to 30 years leads to an increase by a further 0.5 p.p. In the case of Sudan, the IRR for the variant of an investment realised with no state support was 4% and 10% in the case of government support provided by tariff rates [111].
The economic efficiency of photovoltaic systems producing electricity to cover the needs of farms depends not only on the farm type, but also on its location. Due to different insolation conditions and the diversity of farm size, as well as characteristics of their production, the efficiency of photovoltaic systems varies in Poland. For this reason, the next stage of analysis was to identify homogeneous areas in terms of calculated values of indexes for economic efficiency in macroeconomic accounting. For this purpose, the provinces were grouped using the K-Means method and assuming K = 3 [112]. As a result, for each farm type, these provinces were indicated, in which energy production using photovoltaic panels to cover the needs of farms showed low (group 1), medium (group 2), and high economic efficiency (group 3) (Figure 3).
Based on the conducted calculations, it may be stated that the regions with the highest macroeconomic efficiency of energy production using photovoltaic systems to cover the needs of farms include the Wielkopolskie province (high efficiency for all the three types of farms), as well as the Kujawsko-pomorskie, Pomorskie, Warmińsko-mazurskie, and Opolskie provinces (high efficiency for type B and C farms, and medium efficiency for a type A farm). In turn, the provinces, in which efficiency of photovoltaic systems producing energy to cover the needs of farms is lowest, include the Świętokrzyskie, Lubuskie (low efficiency for all the farm types), and the Zachodniopomorskie province (low efficiency for type A and C farms, as well as medium for a type B farm). The main factor affecting the observed variation between the individual provinces is connected with the size of farms, characteristic to specific regions of Poland. In the regions belonging to group 3 (high economic efficiency), the size of farms determined based on the mean farm area [ha] and stocking rate [LU/farm] is several times greater than that of farms in the Świętokrzyskie province (low economic efficiency). Additionally, the group of regions with the lowest economic efficiency included the Zachodniopomorskie and Lubuskie provinces. In terms of insolation, they are areas with the lowest annual solar irradiance. However, the efficiency of photovoltaic installations producing energy to cover the demand of farms depends to a greater extent on the size of those farms, rather than climatic conditions. This is confirmed by the example of the Kujawsko-pomorskie province, which despite low insolation belongs to the group of provinces characterised by high economic efficiency thanks to the size of its farms.
In view of the above statement, econometric models were constructed to describe the dependence between macroeconomic efficiency and farm size for each farm type. For this purpose, the following variables and ranges of their variability were adopted:
Explained variable Y—NPV in macroeconomic accounting [EUR];
  • Explanatory variables:
  • X1—mean farm area in the province, with the range of variation from 7.5 to 55.4 [ha];
  • X2—mean stocking per farm in the province, with the range of variation from 0.4 to 12.1 [LU/farm].
As a result of the applied least squares method, the following regression equations were obtained:
  • For a type A farm    Y ̂= 365∙X_1    R^2 = 0.85;
  • For a type B farm    Y ̂= 555∙X_2    R^2 = 0.95;
  • For a type C farm    Y ̂= 583∙X_1    R^2 = 0.94;
  • For all the farms regardless of their type:
Y ̂= 346∙X_1 + 256∙X_2    R^2 = 0.92
An evaluation of the estimation quality of structural parameters for these models indicates that all the parameters are significantly different from zero at the significance level α = 0.05. Moreover, the models were validated by the verification that they meet the criteria of correctness both for the degree of consistency with empirical data and for meeting the assumptions concerning random components. Therefore, it may be stated that under Polish conditions, the macroeconomic efficiency of energy production using photovoltaic systems to cover the needs of farms, measured based on NPV, depends on:
  • Farm size in the case of farms specialising in plant production (type A) and mixed production farms (type C);
  • Stocking rate in the case of dairy cattle farms (type B);
  • Both the farm size and stocking rate in the case of analysis covering all the farms regardless of their type.
With an increase in farm size (an increase in farm area, greater stocking rate), the economic efficiency is growing. This is caused by the fact that with an increase in the volume of agricultural production the demand for electricity on farms is growing, which leads to an increase in the value of social effects resulting from the replacement of coal in electricity production with solar energy. The increase in the social benefits exceeds the increase in the operating costs and investment outlays recorded in the case of the greater installed power of the PV system.

4. Conclusions

The conducted calculations indicate that the production of electricity using photovoltaic installations to cover the needs of farms in Poland shows high efficiency—both in the micro- and macroeconomic accounting. The NPV in macroeconomic accounting, depending on the type of farms, ranges from EUR 8200 to almost EUR 23,000. For comparison, the calculated NPV in microeconomic accounting is 27% to 45% lower. Similarly, the evaluation of efficiency based on the payback period shows that the analysed investment projects show higher efficiency in macroeconomic accounting. The calculated payback period for the macroeconomic accounting, depending on the type of farms, ranges from 4.3 to 6 years and is, approx., 1–2.4 years shorter compared to the payback period calculated in the microeconomic terms. The internal rate of return determined in macroeconomic accounting ranges from 21% to 32% and is, on average, 9 p.p. higher compared to the IRR calculated in microeconomic accounting.
The presented values are slightly higher than those obtained by the other authors concerning the economic evaluation of photovoltaic installations in Poland. This results from the fact that most of the studies conducted to date were limited only to the assessment of a single, specific investment project covering the household demand for energy. An extension of the scope of analysis to include energy consumed in the agricultural production processes resulted in an increased economic efficiency of this investment. With an increase in the demand for energy, both investment outlays and operating costs are growing, while an increase is also observed for the benefits resulting from this PV system. However, since the rate of increase in the value of positive cash flows exceeds the rate of increase in negative cash flows, economic efficiency increases with the growing demand for energy. For this reason, the most preferable farms in terms of the economic evaluation of photovoltaic installations are dairy cow farms (type B). The high demand for electricity resulting from the specific character of milk production technology is reflected in the high economic efficiency of energy production using solar panels on those farms.
The greater economic efficiency in macroeconomic accounting terms compared to the results obtained for microeconomic accounting is due to the greater value of benefits. In microeconomic accounting, a PV installation brings benefits only in the form of savings due to the lower variable costs related to the purchase of electricity. In contrast, in macroeconomic accounting, the production of electricity from renewable sources, including solar energy, produces benefits thanks to the elimination of environmental damage caused by the extraction and processing of conventional energy carriers. This results in lower levels of external costs in the case of PV installations when compared to external costs generated by the production of energy in coal-fired power plants. Additionally, in Poland, an increased share of renewable energy sources in electricity production may contribute to a reduction of public funds expenditure, otherwise incurred for subsidies to coal mining.
By definition, externalities are not included in market price calculations. Therefore, the cost-benefit account presented in the paper differs from the microeconomic point of view from the social valuation. The calculations carried out indicate the legitimacy of identifying the external effects of various energy systems, and determining the level of the related external costs. Only this approach will make it possible to compare external costs with internal costs of energy production and compare competing energy systems, including conventional technologies with renewable energy. As markets by their nature do not internalize external costs, internalisation can be achieved by appropriate policy measures such as taxes, adjusted electricity rates, subsidies or other forms of public support. The calculations presented in this work indicate that the inclusion of external costs and benefits in the economic calculation justifies the support of renewable energy from public funds. The need for public aid is due to the higher costs of producing energy from renewable sources compared to conventional technologies. A comparison of the costs of regulations promoting renewable energy sources with externalities shows that the mechanism introduced in many countries is a response to some market imperfections: Positive externalities of renewable energy, such as reduction of greenhouse gas emissions and other pollutants, contribution to technological progress, and lower production costs over a longer period of time perspective. The results of the work are in line with the theory of welfare economics, which indicate the need to take actions leading to the maximization of social welfare. In this context, the objective of the RES support mechanisms should be to maximize the difference between the benefits and costs caused by taking a given public decision. An alternative, identical decision criterion may be minimization of total costs, being the sum of one’s own costs and external costs.
The higher efficiency in the macroeconomic calculation obtained for each of the analyzed calculation models indicates that the photovoltaic support system applied in Poland does not lead to a reduction in the level of social welfare. Rather, the social cost of regulation is lower than the social benefits resulting from the quality improvement of the natural environment.
Moreover, we need to focus on the results that show a regional diversification in macroeconomic efficiency of investments in photovoltaics generating electricity on farms in Poland. In this respect, the most advantageous provinces include the Wielkopolskie, Kujawsko-pomorskie, Warmińsko-mazurskie, and Opolskie. This results primarily from the large-sized farms found in those provinces. The regions least advantageous, when considering the location of photovoltaic installations producing electricity for the needs of households and to cover the energy demand of agricultural production, include the Świętokrzyskie, Lubuskie, and Zachodniopomorskie provinces. This is caused by the lowest annual irradiance in those regions (the Lubuskie and the Zachodniopomorskie), as well as the small farm size resulting in low demand for electricity (the Świętokrzyskie province).
The econometric models developed based on the obtained results, indicate that in the case of photovoltaic installations producing energy to cover the needs of farms, their macroeconomic efficiency measured by NPV may be determined based on the parameters characterising the volume of agricultural production, such as farm size [ha] and/or stocking rate of the farm [LU/ha].
The presented results concerning micro– and macroeconomic efficiency of energy production using PV installations may be applied to modify the national policy to support photovoltaics in Poland. In microeconomic accounting, the condition ensuring the efficiency of energy production using photovoltaic systems is to apply an adequate level of financial assistance from public funds as subsides to PV installations and an appropriate settlement mechanism for the produced electricity. Adoption of such solutions makes investments in photovoltaics profitable. On the other hand, the calculations presented in this study indicate that the mechanism currently used in Poland to support the development of photovoltaics, which is based on the system of subsidies and settlements on net-metering is economically justified. The value of additional social benefits from the replacement of coal in electricity production with solar energy exceeds the volume of financial support from public funds received by PV installation owners for their investment. However, it needs to be mentioned that these benefits will appear only when energy production using PV systems leads to an adequate reduction of energy generation in conventional power plants. This may be attained in the case of further support for the entire renewable energy sector aiming at increasing its share in the energy balance of Poland. Nevertheless, it needs to be stressed that in Poland, due to considerable differences in insolation in individual solar power, production requires supplementation with energy produced from other sources, including grid energy. This is particularly important in the case of installations covering the demand for energy and for the needs of agricultural production requiring a continuous electricity supply.
The results presented in this study indicate that the economic efficiency of photovoltaic installations in Polish farms depends on the type of economic operations. There may be many factors determining this efficiency. In this situation, it seems to be justified to conduct further studies on the economic efficiency of photovoltaic panels, taking into consideration various calculation variants, including, e.g., the application of different discount rates and different sizes of farms located in the same provinces.

Author Contributions

Conceptualization, M.B. and A.S.; literature review A.S.; methodology, M.B., J.M. and A.S.; formal analysis, M.B.; writing—original draft preparation, M.B. and A.S.; writing—review and editing, J.M. All authors have read and agreed to the published version of the manuscript.

Funding

This research received no external funding.

Institutional Review Board Statement

Not applicable.

Informed Consent Statement

Not applicable.

Data Availability Statement

Data on farm types are obtained from the Farm Accountancy Data Network provided by the Institute of Agricultural and Food Economics National Research Institute. The remaining data are contained within the article.

Conflicts of Interest

The authors declare no conflict of interest.

References

  1. Owusu, P.A.; Asumadu-Sarkodie, S. A Review of Renewable Energy Sources, Sustainability Issues and Climate Change Mitigation. Cogent Eng. 2016, 3, 1167990. [Google Scholar] [CrossRef]
  2. Maśloch, P.; Maśloch, G.; Kuźmiński, Ł.; Wojtaszek, H.; Miciuła, I. Autonomous Energy Regions as a Proposed Choice of Selecting Selected EU Regions—Aspects of Their Creation and Management. Energies 2020, 13, 6444. [Google Scholar] [CrossRef]
  3. Li, Z.; Yano, A.; Cossu, M.; Yoshioka, H.; Kita, I.; Ibaraki, Y. Electrical Energy Producing Greenhouse Shading System with a Semi-Transparent Photovoltaic Blind Based on Micro-Spherical Solar Cells. Energies 2018, 11, 1681. [Google Scholar] [CrossRef] [Green Version]
  4. Samadi, S. The Social Costs of Electricity Generation—Categorising Different Types of Costs and Evaluating Their Respective Relevance. Energies 2017, 10, 356. [Google Scholar] [CrossRef] [Green Version]
  5. Solarin, S.A. An Environmental Impact Assessment of Fossil Fuel Subsidies in Emerging and Developing Economies. Environ. Impact Assess. Rev. 2020, 85, 106443. [Google Scholar] [CrossRef]
  6. Perera, F. Pollution from Fossil-Fuel Combustion Is the Leading Environmental Threat to Global Pediatric Health and Equity: Solutions Exist. Int. J. Environ. Res. Public Health 2018, 15, 16. [Google Scholar] [CrossRef] [PubMed] [Green Version]
  7. GUS. Energia 2021. Enegry 2021. Available online: https://stat.gov.pl/obszary-tematyczne/srodowisko-energia/energia/energia-2021-folder,1,9.html (accessed on 15 July 2021).
  8. Ślusarz, G.; Gołębiewska, B.; Cierpiał-Wolan, M.; Twaróg, D.; Gołębiewski, J.; Wójcik, S. The Role of Agriculture and Rural Areas in the Development of Autonomous Energy Regions in Poland. Energies 2021, 14, 4033. [Google Scholar] [CrossRef]
  9. Gulaliyev, M.G.; Mustafayev, E.R.; Mehdiyeva, G.Y. Assessment of Solar Energy Potential and Its Ecological-Economic Efficiency: Azerbaijan Case. Sustainability 2020, 12, 1116. [Google Scholar] [CrossRef] [Green Version]
  10. Górnowicz, R.; Castro, R. Optimal Design and Economic Analysis of a PV System Operating under Net Metering or Feed-In-Tariff Support Mechanisms: A Case Study in Poland. Sustain. Energy Technol. Assess. 2020, 42, 100863. [Google Scholar] [CrossRef]
  11. Brodziński, Z.; Brodzińska, K.; Szadziun, M. Photovoltaic Farms—Economic Efficiency of Investments in North-East Poland. Energies 2021, 14, 2087. [Google Scholar] [CrossRef]
  12. Santos, A.Q.; Ma, Z.; Olsen, C.G.; Jørgensen, B.N. Framework for Microgrid Design Using Social, Economic, and Technical Analysis. Energies 2018, 11, 2832. [Google Scholar] [CrossRef] [Green Version]
  13. Paska, J.; Surma, T. Electricity Generation from Renewable Energy Sources in Poland. Renew. Energy 2014, 71, 286–294. [Google Scholar] [CrossRef]
  14. Piotrowska–Woroniak, J.; Woroniak, G.; Załuska, W. Energy Production from PV and Carbon Reduction in Great Lakes Region of Masuria Poland: A Case Study of Water Park in Elk. Renew. Energy 2015, 83, 1315–1325. [Google Scholar] [CrossRef]
  15. Iwaszczuk, N.; Trela, M. Analysis of the Impact of the Assumed Moment of Meeting Total Energy Demand on the Profitability of Photovoltaic Installations for Households in Poland. Energies 2021, 14, 1637. [Google Scholar] [CrossRef]
  16. Chmielowiec, K.; Topolski, Ł.; Piszczek, A.; Hanzelka, Z. Photovoltaic Inverter Profiles in Relation to the European Network Code NC RfG and the Requirements of Polish Distribution System Operators. Energies 2021, 14, 1486. [Google Scholar] [CrossRef]
  17. Olczak, P.; Olek, M.; Matuszewska, D.; Dyczko, A.; Mania, T. Monofacial and Bifacial Micro PV Installation as Element of Energy Transition—The Case of Poland. Energies 2021, 14, 499. [Google Scholar] [CrossRef]
  18. Dusonchet, L.; Telaretti, E. Comparative Economic Analysis of Support Policies for Solar PV in the Most Representative EU Countries. Renew. Sustain. Energy Rev. 2015, 42, 986–998. [Google Scholar] [CrossRef]
  19. da Silva, P.P.; Dantas, G.; Pereira, G.I.; Câmara, L.; De Castro, N.J. Photovoltaic Distributed Generation–An International Review on Diffusion, Support Policies, and Electricity Sector Regulatory Adaptation. Renew. Sustain. Energy Rev. 2019, 103, 30–39. [Google Scholar] [CrossRef]
  20. Valiño, L.; Sarasa, C.; Duarte, R. Economy-Wide Effects of a Sustainable Pathway in the Pig Sector: A Case Study in Aragon (Spain). J. Environ. Manag. 2019, 239, 84–89. [Google Scholar] [CrossRef]
  21. Nacer, T.; Hamidat, A.; Nadjemi, O.; Bey, M. Feasibility Study of Grid Connected Photovoltaic System in Family Farms for Electricity Generation in Rural Areas. Renew. Energy 2016, 96, 305–318. [Google Scholar] [CrossRef]
  22. Bey, M.; Hamidat, A.; Benyoucef, B.; Nacer, T. Viability Study of the Use of Grid Connected Photovoltaic System in Agriculture: Case of Algerian Dairy Farms. Renew. Sustain. Energy Rev. 2016, 63, 333–345. [Google Scholar] [CrossRef]
  23. Touil, S.; Richa, A.; Fizir, M.; Bingwa, B. Shading Effect of Photovoltaic Panels on Horticulture Crops Production: A Mini Review. Rev. Environ. Sci. Bio Technol. 2021, 20, 1–16. [Google Scholar]
  24. Alhammami, H.; An, H. Techno-Economic Analysis and Policy Implications for Promoting Residential Rooftop Solar Photovoltaics in Abu Dhabi, UAE. Renew. Energy 2021, 167, 359–368. [Google Scholar] [CrossRef]
  25. Dinesh, H.; Pearce, J.M. The Potential of Agrivoltaic Systems. Renew. Sustain. Energy Rev. 2016, 54, 299–308. [Google Scholar] [CrossRef] [Green Version]
  26. Schindele, S.; Trommsdorff, M.; Schlaak, A.; Obergfell, T.; Bopp, G.; Reise, C.; Braun, C.; Weselek, A.; Bauerle, A.; Högy, P. Implementation of Agrophotovoltaics: Techno-Economic Analysis of the Price-Performance Ratio and Its Policy Implications. Appl. Energy 2020, 265, 114737. [Google Scholar] [CrossRef]
  27. GUS. Statistical Yearbook of Agriculture 2020. Available online: https://stat.gov.pl/obszary-tematyczne/roczniki-statystyczne/roczniki-statystyczne/rocznik-statystyczny-rolnictwa-2020,6,14.html (accessed on 13 July 2021).
  28. GUS. Rolnictwo w 2019 Roku. Available online: https://stat.gov.pl/obszary-tematyczne/rolnictwo-lesnictwo/rolnictwo/rolnictwo-w-2019-roku,3,16.html (accessed on 14 July 2021).
  29. Chel, A.; Kaushik, G. Renewable Energy for Sustainable Agriculture. Agron. Sustain. Dev. 2011, 31, 91–118. [Google Scholar] [CrossRef]
  30. Ibrik, I. Micro-Grid Solar Photovoltaic Systems for Rural Development and Sustainable Agriculture in Palestine. Agronomy 2020, 10, 1474. [Google Scholar] [CrossRef]
  31. Querikiol, E.M.; Taboada, E.B. Performance Evaluation of a Micro Off-Grid Solar Energy Generator for Islandic Agricultural Farm Operations Using HOMER. J. Renew. Energy 2018, 2018, 2828173. [Google Scholar] [CrossRef] [Green Version]
  32. Kyriakarakos, G.; Balafoutis, A.T.; Bochtis, D. Proposing a Paradigm Shift in Rural Electrification Investments in Sub-Saharan Africa through Agriculture. Sustainability 2020, 12, 3096. [Google Scholar] [CrossRef] [Green Version]
  33. Dupraz, C.; Marrou, H.; Talbot, G.; Dufour, L.; Nogier, A.; Ferard, Y. Combining Solar Photovoltaic Panels and Food Crops for Optimising Land Use: Towards New Agrivoltaic Schemes. Renew. Energy 2011, 36, 2725–2732. [Google Scholar] [CrossRef]
  34. Patel, M.T.; Khan, M.R.; Sun, X.; Alam, M.A. A Worldwide Cost-Based Design and Optimization of Tilted Bifacial Solar Farms. Appl. Energy 2019, 247, 467–479. [Google Scholar] [CrossRef] [Green Version]
  35. Trommsdorff, M.; Kang, J.; Reise, C.; Schindele, S.; Bopp, G.; Ehmann, A.; Weselek, A.; Högy, P.; Obergfell, T. Combining Food and Energy Production: Design of an Agrivoltaic System Applied in Arable and Vegetable Farming in Germany. Renew. Sustain. Energy Rev. 2021, 140, 110694. [Google Scholar] [CrossRef]
  36. El Kolaly, W.; Ma, W.; Li, M.; Darwesh, M. The Investigation of Energy Production and Mushroom Yield in Greenhouse Production Based on Mono Photovoltaic Cells Effect. Renew. Energy 2020, 159, 506–518. [Google Scholar] [CrossRef]
  37. Friman-Peretz, M.; Ozer, S.; Geoola, F.; Magadley, E.; Yehia, I.; Levi, A.; Brikman, R.; Gantz, S.; Levy, A.; Kacira, M. Microclimate and Crop Performance in a Tunnel Greenhouse Shaded by Organic Photovoltaic Modules–Comparison with Conventional Shaded and Unshaded Tunnels. Biosyst. Eng. 2020, 197, 12–31. [Google Scholar] [CrossRef]
  38. Amaducci, S.; Yin, X.; Colauzzi, M. Agrivoltaic Systems to Optimise Land Use for Electric Energy Production. Appl. Energy 2018, 220, 545–561. [Google Scholar] [CrossRef]
  39. Khan, F.; Waqas, Q.; Basak, J.K.; Okyere, F.G.; Park, J.; Arulmozhi, E.; Lee, Y.J.; Kim, H.T. Control Indoor Thermal Environment Using MOACON System and Solar Panel in Experimental Pig Barn. J. Korean Soc. Agric. Mach. 2018, 23, 126. [Google Scholar]
  40. Kwak, Y.; Shin, H.; Kang, M.; Mun, S.-H.; Jo, S.-K.; Kim, S.-H.; Huh, J.-H. Energy Modeling of Pig Houses: A South Korean Feasibility Study. Energy Strategy Rev. 2021, 36, 100672. [Google Scholar] [CrossRef]
  41. Hassanien, R.H.E.; Li, M.; Yin, F. The Integration of Semi-Transparent Photovoltaics on Greenhouse Roof for Energy and Plant Production. Renew. Energy 2018, 121, 377–388. [Google Scholar] [CrossRef]
  42. Cho, J.; Park, S.M.; Park, A.R.; Lee, O.C.; Nam, G.; Ra, I.-H. Application of Photovoltaic Systems for Agriculture: A Study on the Relationship between Power Generation and Farming for the Improvement of Photovoltaic Applications in Agriculture. Energies 2020, 13, 4815. [Google Scholar] [CrossRef]
  43. Neto, A.J.S.; de Carvalho Lopes, D. Technical Analysis of Photovoltaic Energy Generation for Supplying the Electricity Demand in Brazilian Dairy Farms. Environ. Dev. Sustain. 2021, 23, 1355–1370. [Google Scholar] [CrossRef]
  44. Cui, Y.; Theo, E.; Gurler, T.; Su, Y.; Saffa, R. A Comprehensive Review on Renewable and Sustainable Heating Systems for Poultry Farming. Int. J. Low Carbon Technol. 2020, 15, 121–142. [Google Scholar] [CrossRef]
  45. Bogdan, A.V.; Bogdan, V.A.; Garkavyi, K.A. Optimization of Power and Place of Connection of Photovoltaic System for Power Supply of Poultry Farm. In Proceedings of the 2018 International Ural Conference on Green Energy (UralCon), Chelyabinsk, Russia, 4–8 October 2018; pp. 57–62. [Google Scholar]
  46. Cossu, M.; Yano, A.; Solinas, S.; Deligios, P.A.; Tiloca, M.T.; Cossu, A.; Ledda, L. Agricultural Sustainability Estimation of the European Photovoltaic Greenhouses. Eur. J. Agron. 2020, 118, 126074. [Google Scholar] [CrossRef]
  47. Moretti, S.; Marucci, A. A Photovoltaic Greenhouse with Variable Shading for the Optimization of Agricultural and Energy Production. Energies 2019, 12, 2589. [Google Scholar] [CrossRef] [Green Version]
  48. Ntinas, G.K.; Neumair, M.; Tsadilas, C.D.; Meyer, J. Carbon Footprint and Cumulative Energy Demand of Greenhouse and Open-Field Tomato Cultivation Systems under Southern and Central European Climatic Conditions. J. Clean. Prod. 2017, 142, 3617–3626. [Google Scholar] [CrossRef]
  49. Premier, A. A Review of the Attributes of Successful Agriphotovoltaic. In Proceedings of the APRU 2020 Sustainable Cities and Landscapes PhD Symposium, Virtual Event, 14–18 December 2020; pp. 1–8. [Google Scholar]
  50. Samuelson, P.A.; Nordhaus, W.D. Economics; Mcgraw-Hill Irwin: New York, NY, USA, 2010. [Google Scholar]
  51. Setiawan, I. Maqashid Sharia’s Criticism of the Pareto Optimum Theory. Muqtasid: J. Ekon. Dan Perbank. Syariah 2020, 11, 14–28. [Google Scholar] [CrossRef]
  52. Begg, D.; Fischer, S.; Dornbusch, R. Economics; McGraw-Hill Education: Maidenhead, UK, 2008. [Google Scholar]
  53. Ledyard, J.O. Market failure. In Allocation, Information and Markets; Springer: Berlin, Germany, 1989; pp. 185–190. [Google Scholar]
  54. Medema, S.G. The Hesitant Hand: Mill, Sidgwick, and the Evolution of the Theory of Market Failure. Hist. Political Econ. 2007, 39, 331–358. [Google Scholar] [CrossRef] [Green Version]
  55. Loiseau, E.; Saikku, L.; Antikainen, R.; Droste, N.; Hansjürgens, B.; Pitkänen, K.; Leskinen, P.; Kuikman, P.; Thomsen, M. Green Economy and Related Concepts: An Overview. J. Clean. Prod. 2016, 139, 361–371. [Google Scholar] [CrossRef]
  56. Ekins, P.; Zenghelis, D. The Costs and Benefits of Environmental Sustainability. Sustain. Sci. 2021, 16, 949–965. [Google Scholar] [CrossRef]
  57. Georgeson, L.; Maslin, M.; Poessinouw, M. The Global Green Economy: A Review of Concepts, Definitions, Measurement Methodologies and Their Interactions. Geo Geogr. Environ. 2017, 4, e00036. [Google Scholar] [CrossRef]
  58. Cavallo, M. Industrial Symbiosis and Productive Areas. Environ. Eng. Manag. J. 2013, 12, 265–268. [Google Scholar]
  59. Permanent Secretariat of the Alpine Convention. Greening the Economy in the Alpine Region. Report on the State of the Alps. Alpine Convention; Alpine Signals—Special Edition 6; Permanent Secretariat of the Alpine Convention: Innsbruck, Austria, 2017. [Google Scholar]
  60. Sulich, A.; Zema, T. Green Jobs, a New Measure of Public Management and Sustainable Development. Eur. J. Environ. Sci. 2018, 8, 69–75. [Google Scholar] [CrossRef] [Green Version]
  61. Bowen, A.; Hepburn, C. Green Growth: An Assessment. Oxf. Rev. Econ. Policy 2014, 30, 407–422. [Google Scholar] [CrossRef]
  62. Smulders, S.; Toman, M.; Withagen, C. Growth Theory and ‘Green Growth. Oxf. Rev. Econ. Policy 2014, 30, 423–446. [Google Scholar] [CrossRef] [Green Version]
  63. Hickel, J.; Kallis, G. Is Green Growth Possible? New Political Econ. 2020, 25, 469–486. [Google Scholar] [CrossRef]
  64. Chang, R.-D.; Zuo, J.; Zhao, Z.-Y.; Zillante, G.; Gan, X.-L.; Soebarto, V. Evolving Theories of Sustainability and Firms: History, Future Directions and Implications for Renewable Energy Research. Renew. Sustain. Energy Rev. 2017, 72, 48–56. [Google Scholar] [CrossRef]
  65. Mealy, P.; Teytelboym, A. Economic Complexity and the Green Economy. Res. Policy 2020, 103948. [Google Scholar] [CrossRef]
  66. Hudson, R. Life on the Edge: Navigating the Competitive Tensions between the ‘Social’and the ‘Economic’ in the Social Economy and in Its Relations to the Mainstream. J. Econ. Geogr. 2009, 9, 493–510. [Google Scholar] [CrossRef] [Green Version]
  67. Knutel, B.; Pierzyńska, A.; Dębowski, M.; Bukowski, P.; Dyjakon, A. Assessment of Energy Storage from Photovoltaic Installations in Poland Using Batteries or Hydrogen. Energies 2020, 13, 4023. [Google Scholar] [CrossRef]
  68. Andrews, R.W.; Pollard, A.; Pearce, J.M. The Effects of Snowfall on Solar Photovoltaic Performance. Sol. Energy 2013, 92, 84–97. [Google Scholar] [CrossRef] [Green Version]
  69. Heidari, N.; Gwamuri, J.; Townsend, T.; Pearce, J.M. Impact of Snow and Ground Interference on Photovoltaic Electric System Performance. IEEE J. Photovolt. 2015, 5, 1680–1685. [Google Scholar] [CrossRef] [Green Version]
  70. Heijman, W.J.M. Applied Macroeconomics; Cereales: Wageningen, The Netherlands, 2000. [Google Scholar]
  71. Garrido, A.; Gil, M.; Gómez-Ramos, A. Disentangling the Social, Macro and Microeconomic Effects of Agricultural Droughts: An Application to Spanish Irrigated Agriculture. Options Mediterr. 2010, 95, 149–158. [Google Scholar]
  72. Wilson, J.R.; Boncoeur, J. Micro-Economic Efficiencies and Macro-Economic Inefficiencies: Theoretical Reflections on Renewable Resource Policies in Very Poor Countries. In Proceedings of the 10th Biannual Conference of the IIFET, Corvallis, OR, USA, 10–14 July 2020. [Google Scholar]
  73. Zeraatpisheh, M.; Arababadi, R.; Saffari Pour, M. Economic Analysis for Residential Solar PV Systems Based on Different Demand Charge Tariffs. Energies 2018, 11, 3271. [Google Scholar] [CrossRef] [Green Version]
  74. Solorzano, V.; Garcia, L.; Ramos, M.; Vargas, O. Economic Value Added (EVA) as an Indicator for Financial Decisions: An Application to the Province of Santa Elena, Ecuador. Ecorfan J. 2013, 4, 1077–1086. [Google Scholar]
  75. Maroyi, V. Capital Budgeting Practices: A South African Perspective. Unpubl. Master’s Thesis, Wagening University, Wagening, The Netherlands, 2011. [Google Scholar]
  76. IFAD Economic and Financial Analysis of Rural Investment Projects. IFAD’S Internal Guidelines. 2015. International Fund for Agricultural Development. Available online: https://www.google.com/search?client=firefox-b-d&q=Economic+and+Financial+Analysis+of+rural+investment+projects.+IFAD%E2%80%99S+Internal+guidelines+%5B2015%5D+International+Fund+for+Agricultural+Development (accessed on 17 July 2021).
  77. Vélez Pareja, I. Ranking and Optimal Selection of Investments with Internal Rate of Return and Benefit-Cost Ratio: A Revision. Contaduría y Administración 2012, 57, 29–51. [Google Scholar]
  78. Bhandari, S.B. Discounted Payback Period-Some Extensions. J. Bus. Behav. Sci. 2009, 21, 28–38. [Google Scholar]
  79. Spackman, M. Discount Rates and Rates of Return in the Public Sector: Economic Issues; HM Treasury: London, UK, 1991.
  80. Spackman, M. Time Discounting and of the Cost of Capital in Government. Fisc. Stud. 2004, 25, 467–518. [Google Scholar] [CrossRef]
  81. A Social Time Preference Rate for Use in Long-Term Discounting, A Report for ODPM. 2002. Available online: https://www.google.com/search?client=firefox-b-d&q=A+social+time+preference+rate+for+use+in+long-term+discounting%2C+a+report+for+ODPM+%5B2002%5D+Oxera (accessed on 27 July 2021).
  82. Evans, D.J. The Elasticity of Marginal Utility of Consumption: Estimates for 20 OECD Countries. Fisc. Stud. 2005, 26, 197–224. [Google Scholar] [CrossRef]
  83. Freeman, M.; Groom, B.; Spackman, M. Social Discount Rates for Cost-Benefit Analysis: A Report for HM Treasury; HM Treasury: London, UK, 2018.
  84. Agriculture and Rural Development. Farm Accountancy Data Network. European Commission. Available online: Https://Ec.Europa.Eu/Agriculture/Rica/Database/Report—SzukajwGoogle (accessed on 27 July 2021).
  85. Marks-Bielska, R.; Bielski, S.; Pik, K.; Kurowska, K. The Importance of Renewable Energy Sources in Poland’s Energy Mix. Energies 2020, 13, 4624. [Google Scholar] [CrossRef]
  86. Trela, M.; Dubel, A. Comparing the Support Systems for Renewable Energy Sources in Poland Green Certificates vs Auction Systems. Polityka Energetyczna Energy Policy J. 2017, 20, 105–116. [Google Scholar]
  87. Śleszyński, P.; Nowak, M.; Brelik, A.; Mickiewicz, B.; Oleszczyk, N. Planning and Settlement Conditions for the Development of Renewable Energy Sources in Poland: Conclusions for Local and Regional Policy. Energies 2021, 14, 1935. [Google Scholar] [CrossRef]
  88. Kwaśniewski, D.; Akdeniz, C.; Durmaz, F.; Kömekçi, F. Economic Analysis of the Photovoltaic Installation Use Possibilities in Farms. Agric. Eng. 2020, 24, 47–60. [Google Scholar]
  89. GUS. Zużycie Energii w Gospodarstwach Domowych w 2018 Roku. Available online: https://stat.gov.pl/obszary-tematyczne/srodowisko-energia/energia/zuzycie-energii-w-gospodarstwach-domowych-w-2018-roku,12,1.html (accessed on 27 July 2021).
  90. Photovoltaics PV Calculator. Available online: https://www.hewalex.pl/fotowoltaika/kalkulator/ (accessed on 14 July 2021).
  91. Half-Yearly Price Indices of Consumer Goods and Services from 1989. Available online: https://stat.gov.pl/en/topics/prices-trade/price-indices/price-indices-of-consumer-goods-and-services/half-yearly-price-indices-of-consumer-goods-and-services-from-1989/ (accessed on 14 July 2021).
  92. European Union. Consumer Price Index (Cpi). 1999–2021 Data. 2022–2023 Forecast. Available online: https://tradingeconomics.com/european-union/consumer-price-index-cpi (accessed on 14 July 2021).
  93. Kurs Euro 2021-06—Dane Archiwalne, Średnie—EUR-PLN.Pl. Available online: https://eur-pln.pl/2021/6/ (accessed on 14 July 2021).
  94. Bukowski, M.; Majewski, J.; Sobolewska, A. Macroeconomic Electric Energy Production Efficiency of Photovoltaic Panels in Single-Family Homes in Poland. Energies 2021, 14, 126. [Google Scholar] [CrossRef]
  95. Księżopolski, K.; Drygas, M.; Pronińska, K.; Nurzyńska, I. The Economic Effects of New Patterns of Energy Efficiency and Heat Sources in Rural Single-Family Houses in Poland. Energies 2020, 13, 6358. [Google Scholar] [CrossRef]
  96. Vienna Insurance Group. Ubezpieczenie Instalacji Energii Odnawialnej. Wiener TU S.A. Available online: https://www.wiener.pl/ubezpieczenie-instalacji-energii-odnawialnej (accessed on 14 July 2021).
  97. GLOBEnergia. Recykling Modułów PV w Polsce—Ile Kosztuje? Co Się Odzyskuje? Available online: https://globenergia.pl/recykling-modulow-pv-w-polsce-ile-kosztuje-co-sie-odzyskuje/ (accessed on 14 July 2021).
  98. Gaj, K. Three-Year Exploitation Tests of a Photovoltaic Plant in a Zero-Energy Single-Family House under the Polish Conditions. J. Ecol. Eng. 2020, 21, 160–168. [Google Scholar] [CrossRef]
  99. Chwieduk, D.; Bujalski, W.; Chwieduk, B. Possibilities of Transition from Centralized Energy Systems to Distributed Energy Sources in Large Polish Cities. Energies 2020, 13, 6007. [Google Scholar] [CrossRef]
  100. Dubel, A.; Trela, M. Financial Efficiency Analysis of PV Plants in Poland under the Evolving Support Scheme. Ekon. I Środowisko Econ. Environ. 2019, 71, 18. [Google Scholar]
  101. Drzymała, A.J.; Korzeniewska, E. Economic Efficiency of a Photovoltaic Power Plants. In Proceedings of the 2019 IEEE International Conference on Modern Electrical and Energy Systems (MEES), Kremenchuk, Ukraine, 23–25 September 2019; pp. 238–241. [Google Scholar]
  102. Elamim, A.; Hartiti, B.; Haibaoui, A.; Lfakir, A.; Thevenin, P. Comparative Study of Photovoltaic Solar Systems Connected to the Grid: Performance Evaluation and Economic Analysis. Energy Procedia 2019, 159, 333–339. [Google Scholar] [CrossRef]
  103. Soliński, B.; Kapała, J. Efektywność Ekonomiczna Funkcjonowania Mikroinstalacji Fotowoltaicznych Wykorzystywanych Przez Prosumenta. Economic Cost-Effectiveness of Photovoltaic Micro-Installations Used by Prosumer. Probl. Drob. Gospod. Rol. Probl. Small Agric. Hold. 2017, 4, 105–116. [Google Scholar]
  104. Bartecka, M.; Terlikowski, P.; Kłos, M.; Michalski, Ł. Sizing of Prosumer Hybrid Renewable Energy Systems in Poland. Bull. Pol. Acad. Sciences. Tech. Sci. 2020, 68, 721–731. [Google Scholar]
  105. Gradziuk, P.; Gradziuk, B. Economic Profitability of Investment in a Photovoltaic Plant in South-East Poland. Ann. Pol. Assoc. Agric. Agrobus. Econ. 2019, 21, 124–133. [Google Scholar] [CrossRef]
  106. Bertsch, V.; Di Cosmo, V. Are renewables profitable in 2030? In A Comparison between Wind and Solar across Europe; Fondazione Eni Enrico Mattei: Milan, Italy, 2018. [Google Scholar]
  107. Ayadi, O.; Al-Assad, R.; Al Asfar, J. Techno-Economic Assessment of a Grid Connected Photovoltaic System for the University of Jordan. Sustain. Cities Soc. 2018, 39, 93–98. [Google Scholar] [CrossRef]
  108. Awomewe, A.F.; Ogundele, O.O. The Importance of the Payback Method in Capital Budgeting Decision. Master’s Thesis, Blekinge Institute of Technology, Karlshamn, Sweden, 2008. [Google Scholar]
  109. Gnatowska, R.; Moryń-Kucharczyk, E. The Place of Photovoltaics in Poland’s Energy Mix. Energies 2021, 14, 1471. [Google Scholar] [CrossRef]
  110. Klepacka, A.M.; Pawlik, K. Zwrot z Inwestycji Farmy Fotowoltaicznej w Ramach Zmieniających Się Przepisów. Zagadnienia Ekon. Rolnej 2018, 3, 168–192. [Google Scholar] [CrossRef]
  111. Ismail, E.A.; Hashim, S.M. An economic evaluation of grid connected photovoltaic system for a residential house in khartoum. In Proceedings of the 2018 International Conference on Computer, Control, Electrical, and Electronics Engineering (ICCCEEE), Khartoum, Sudan, 12–14 August 2018; pp. 1–6. [Google Scholar]
  112. Umargono, E.; Suseno, J.E.; Gunawan, S.V. K-means clustering optimization using the elbow method and early centroid determination based on mean and median formula. In Proceedings of the 2nd International Seminar on Science and Technology (ISSTEC 2019), Yogyakarta, Indonesia, 25 November 2019; pp. 121–129. [Google Scholar]
Figure 1. Statistical values of annual electricity consumption related to agricultural production depending on the farm type.
Energies 14 05721 g001
Figure 2. Statistical values of the payback period from investment in macro- and microeconomic accounting depending on the farm type.
Energies 14 05721 g002
Figure 3. The division of Poland into regions, homogeneous in terms of economic efficiency of electricity production using photovoltaic systems, depending on the farm type.
Energies 14 05721 g003
Table 1. Statistical values of the internal rate of return from investment in macro- and microeconomic accounting depending on the farm type.
Type of AccountingValueType of FarmsAverage
ABC
macroeconomicMinimum21.3%25.7%22.0%21.3%
Average25.1%29.5%26.0%26.9%
Maximum27.0%32.5%27.8%32.5%
microeconomicMinimum13.6%16.0%14.1%13.6%
Average16.6%19.8%17.3%17.9%
Maximum18.7%22.9%20.0%22.9%
Publisher’s Note: MDPI stays neutral with regard to jurisdictional claims in published maps and institutional affiliations.

