Article

Sand Production of the Shale Gas Well in Different Production Periods: Structure and Component

State Key Laboratory of Oil and Gas Reservoir Geology and Exploitation, Southwest Petroleum University, Chengdu 610500, China
*
Author to whom correspondence should be addressed.
Energies 2021, 14(17), 5588; https://doi.org/10.3390/en14175588
Submission received: 21 August 2021 / Revised: 1 September 2021 / Accepted: 2 September 2021 / Published: 6 September 2021

Abstract

:
Complex geology and fracturing operations have led to frequent sand production problem in the shale gas well. Sand production brings huge engineering risks and seriously affects the normal production of the shale gas well. In order to study the property and source of the yielded sand, sand samples in three production periods of flowback, production test and gas production are collected from Sichuan Basin of China. Combining the methods of particle size analysis, microscope observation, scanning electron microscope, CT scanning, infrared spectroscopy and energy dispersive spectrum analysis, the multi-scale structure and composition characteristics of the yielded sand from different production periods were investigated. Results show that the sand size is the largest in the production test period and the smallest in the gas production period. The large-size sand is blocky in the flowback period, while it is flaky in the period of production test and gas production. The roundness of sand becomes worse as the sand size decreasing. Sand composition has the characteristics of fracturing proppant and shale mineral. Cementing material between large-size sands has the network structure and the higher content of aluminum and iron. Organic chemicals are found to be adhered to the sand surface in all three periods. Both shale fracture and proppant failure can generate particles that provide the material source for sand production. This research provides the source of the yielded sand and a theoretical guidance for the sand production mechanism.

Graphical Abstract

1. Introduction

Staged fracturing of the horizontal well is the dominant technology for commercial exploration of shale gas, but the consequent problem of sand production has become an inevitable problem in oil and gas exploration. Sand production can increase the risk of downhole operations, reduce the life of equipment and even lead to the scrapping of oil and gas wells, incurring serious economic losses to the industry. Therefore, it is essential to study the issue of sand production. The causes of sand production are divided into two main steps: the first step is stress-induced shear or tensile damage to the rock, and the second step is fluid action [1].
Drilling into reservoirs and exploration of oil and gas can cause redistribution of stresses in the formation, and changes in stresses often result in rock failure that can trigger sand production. The classical rock failure criteria include the Mohr-Coulomb criterion and the Drucker-Prager criterion, and new models of rock failure and borehole instability have been developed on this basis for the prediction of sanding [2,3]. Furthermore, the choice of completion method is crucial. By studying the effect of different completion methods on sand production, it was found that sand production is closely related to the perforation method, formation stress, wellbore pressure, rock strength, etc [4,5]. Commonly used perforation completion tends to alter the circumferential stress and increase the risk of sand production in the near-well zone [6]. During oil and gas exploration, scholars have used the stress redistribution caused by oil and gas exploration to obtain a formation fracture model and critical production pressure difference for predicting sand production [7,8].
Fluid action is the main force behind sand production and transport. Sand production caused by fluid action is often considered a negative factor in oil and gas exploration, but it can have a positive effect in heavy oil exploration [9]. When the fluid flows in the loose formation, it will erode the formation and trigger sand production from formation skeleton [10]. In addition, proppant reflux is also considered to be an act of sand production. The main factor of proppant reflux is the drag force exerted by fluid, and the critical flow velocity to prevent proppant reflux is obtained based on that [11,12].
Currently, flow-solid coupling has become one of the prevailing trends in the study of sand production. Many scholars have used modelling to study the sand production. The finite element method is used to model the sand production and ’wormhole’ propagation problem, and the simulated results of the porosity field closely matched the CT images of the experimental results [13]. Computational Fluid Dynamics-Discrete Element (CFD-DEM) coupling method is used to study liquid-induced erosion in loosen formation and found that increased axial pressure exacerbated erosion and increased radial pressure caused continuous sand production [14]. The effect of variables such as fluid pressure, particle size and fluid type on sand production is investigated using CFD-DEM [15]. In conclusion, sand production is the result of the combined effect of fluid and reservoir rock properties.
Sand production hinders shale gas exploration in Sichuan province of China. Some scholars have compared the main shale gas production areas and found that shale in Sichuan basin has high fracture pressure and brittleness [16]. Recent field production has shown that large-scale hydraulic sand fracturing is often employed to shale gas wells for increasing production. However, the shale is susceptible to shear damage during the fracturing process, resulting in the production of shale particles. Meanwhile, deficiencies in the fracturing regime and the properties of the fracturing fluid and proppant contributed to the proppant flowback in various gas wells. Sand production has become a tough problem for shale gas exploration. Over the years, scholars have studied sand production from different perspectives. But there are few reports on the property and source of the yielded sand.
In order to study the property and source of the yielded sand, sand samples in three production periods of flowback, production test and gas production are collected from Sichuan Basin of China. In this paper, we conducted a series of properties evaluation on the multi-scale structure and composition of the yielded sand and combining methods of SEM, CT, infrared spectroscopy (FTIR) and energy dispersive spectrum analysis (EDS) were used to investigated the source of the yielded sand. Base on the results of experimental evaluation and theoretical analysis, the formation mechanism and influencing factors of the yielded sand was demonstrated.

2. Experimental Section

2.1. Project Overview

Shale gas resource in the Sichuan basin is abundant and has huge development potential. At present, some shale gas wells in the Changning district have been experiencing different degrees of sand production during the periods of flowback, production test, and gas production. Statistics show that the proppant flowback of a single platform is usually greater than 20 t. The daily produced sand of a single well varies from 5 m3 to 20 m3 during the flowback. The sand production reached 100 g/s in some wells at the early period of gas production. And the highest erosion rate of the ground pipeline can reach 779.82 mm/a, even causing sewage pipeline elbow of the monitoring platform to rapidly thin by 42.71 mm in 20 days. Thus, the sand production in the Changning district has become a very serious engineering problem.

2.2. Sand Samples

The sand samples used in this paper were collected from the same platform in the Changning district of Sichuan Basin, China. The burial depth of shale gas reservoir is less than 3500 m in this district. Rock mechanics experiments of this platform show that the maximum horizontal principal stress is about 91.77 MPa, the minimum horizontal principal stress is about 80.92 MPa and the vertical principal stress is about 86.67 MPa. Natural fractures are developed here. Large-scale hydraulic sand fracturing was carried out on this platform, using a combination of 100 mesh quartz and 40/70 mesh ceramsite as fracturing proppant. Samples were collected from three wells in different production periods. The 1# sample is brown coming from the well in the flowback period with a mass of 29,616 g, and this well was fractured into 63 stages using 4391.48 t proppant and 115,998.4 m3 fracturing fluid. The 2# sample is reddish brown coming from the well in the production test period with a mass of 316.88 g, and this well was fractured into 49 stages using 7787.2 t proppant and 77,381 m3 fracturing fluid. The 3# sample is yellow coming from the well in the gas production period with a mass of 378.00 g, and this well was fractured into 89 stages using 13,560 t proppant and 164,972 m3 fracturing fluid.

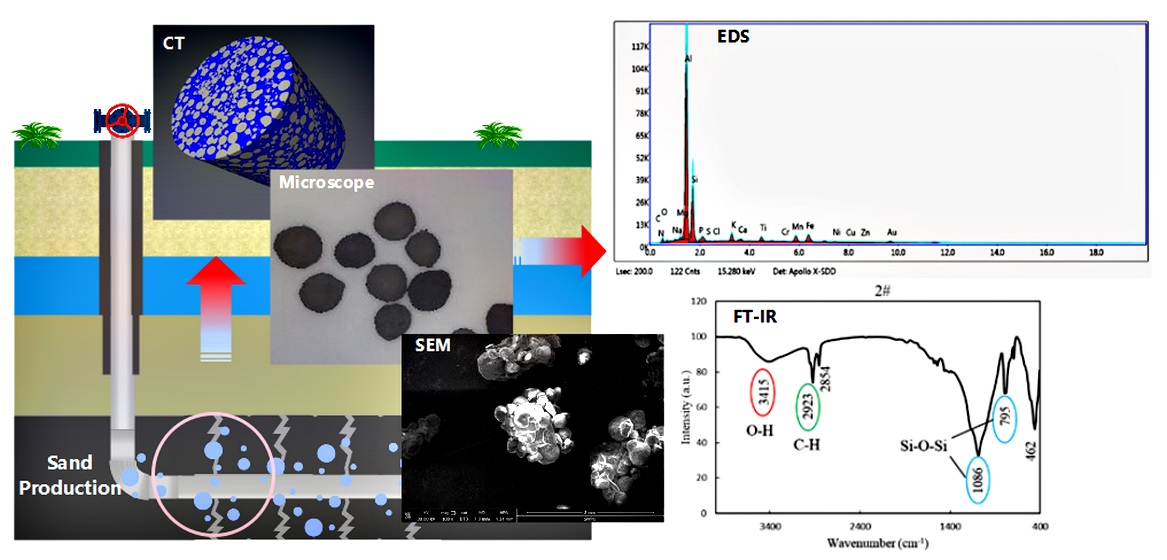
2.3. Experimental Methods

Several measurement methods have been used to obtain the structural characteristics and component analysis of the yielded sand in shale gas wells. Particle size of the samples was analyzed by using standard screen 10, 20, 40, 60, 100 and 200 mesh. The microstructure of the samples was observed under a Leica DM4500P polarizing microscope, which has a field of vision eyepiece: 10×/25 mm, the magnification of the objective lens: 5×, 10×, 20×, 40×, 50× and 100×, and a rotating 360 degrees payload platform with the accuracy of 0.1 degrees. Scanning electron microscope (FEI-QUANTA 650 FEG, FEI Company, OR, USA) including EDAX XM2 LX-ray energy spectrometer was used to observe the microscopic morphology. The computed tomography (CT) scanning was conducted by MicroXCT-400 (Xradia, CA, USA). The functional groups on sand surface were identified by infrared spectrometer (WQF520), which wavenumber region is 7000–400 cm−1, wavenumber accuracy is ±0.5 cm−1 and resolution is 0.5 cm−1 XRD measurement was carried out using the X’Pert Pro X-ray diffractometer (PANalytical, The Netherlands), which radiation source is Cu targets and minimum starting angle is 0.5 degree. Mineral element analysis was carried out by X-ray fluorescence spectrometer (PANalytical, The Netherlands).

3. Structure and Composition of the Yielded Sand

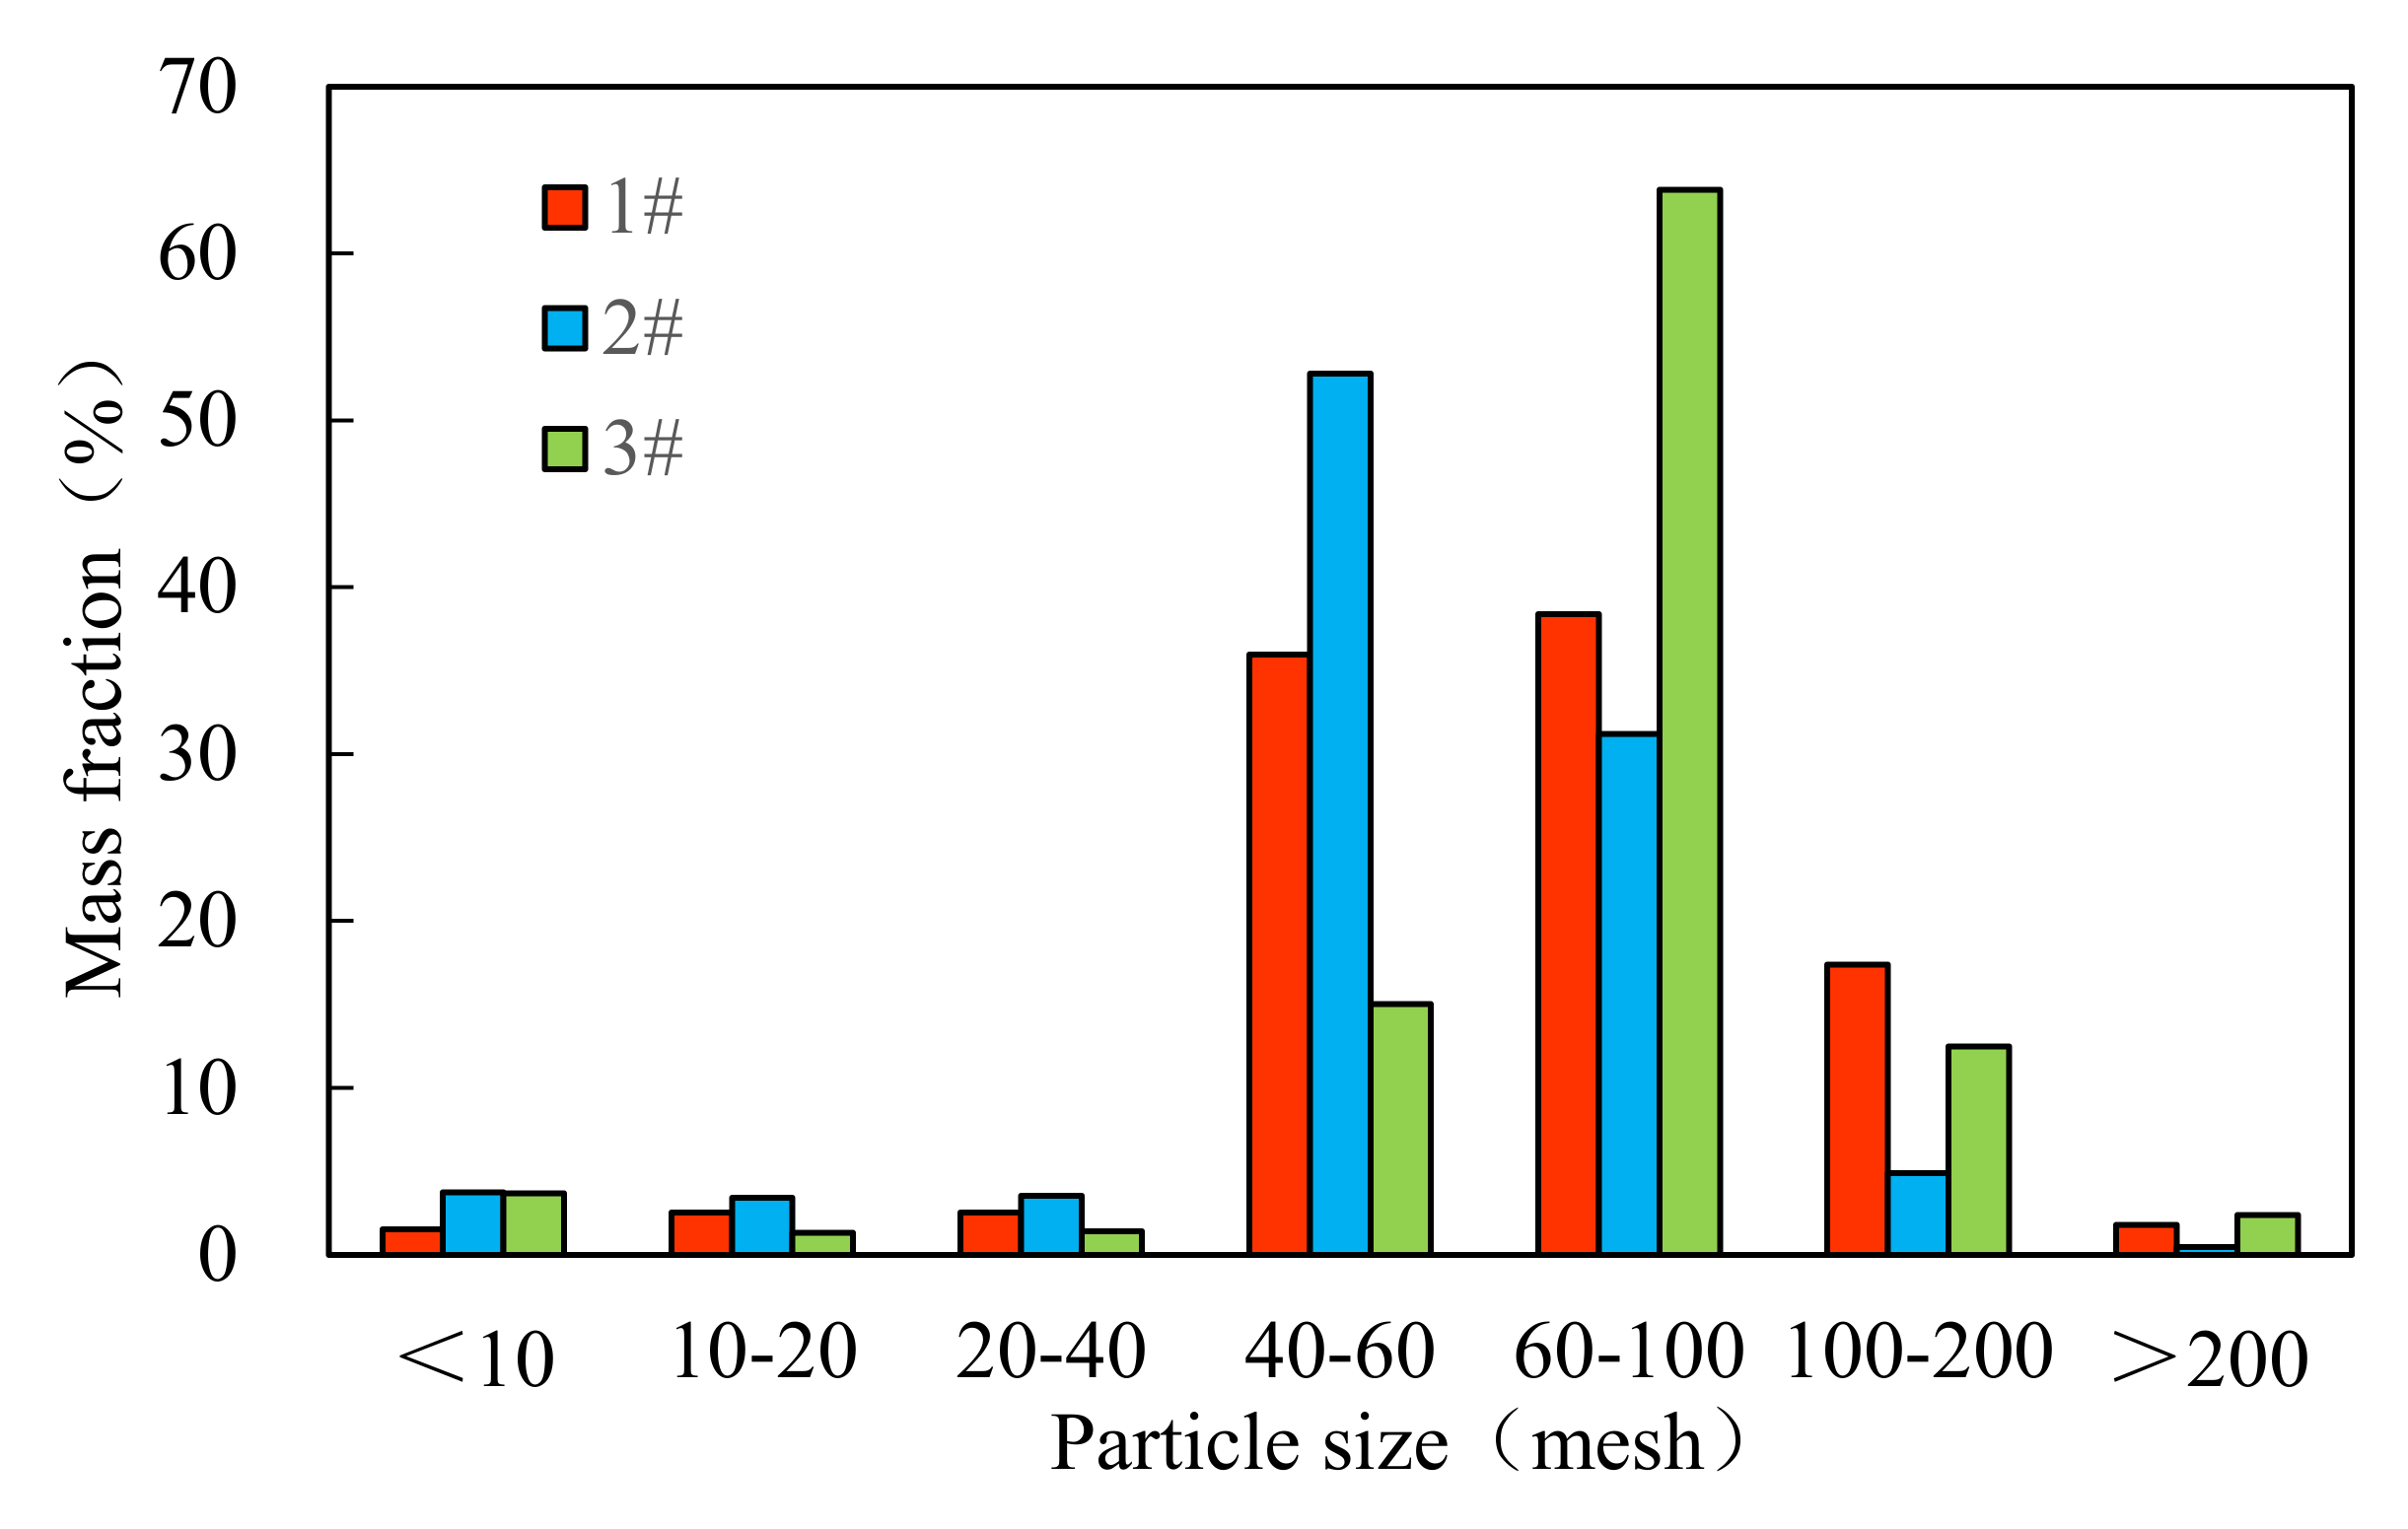
3.1. Particle Size Distribution

The particle size distribution of three yielded sands was obtained by screening method (Figure 1). In 1# sand sample, about 6.52% of sand are larger than 40 mesh, 35.97% are 40–60 mesh, 38.38% are 60–100 mesh and 19.13% are lower than 100 mesh. In 2# sand sample, about 10.64% of sand are larger than 40 mesh, 52.80% are 40–60 mesh, 31.21% are 60–100 mesh and 5.35% are lower than 100 mesh. In 3# sand sample, about 6.35% of sand are larger than 40 mesh, 15.00% are 40–60 mesh, 63.82% are 60–100 mesh and 14.83% are lower than 100 mesh. The particle size distribution of three samples is significantly different. The proportion of sand larger than 40 mesh in 1# sample and 3# sample is similar, but lower than that in 2# sample. The proportion of sand with the size of 40–60 mesh in 2# sample is more than that in 1# sample and 3# sample. The proportion of sand with the size of 60–100 mesh in 1# sample and 2# sample is similar, but lower than that in 3# sample. And the proportion of sand less than 100 mesh in the 2# sample is much lower than that in the 1# and 3# samples. The cumulative size distribution shows that the average particle size of 2# sample is the largest and that of 3# sample is the smallest.

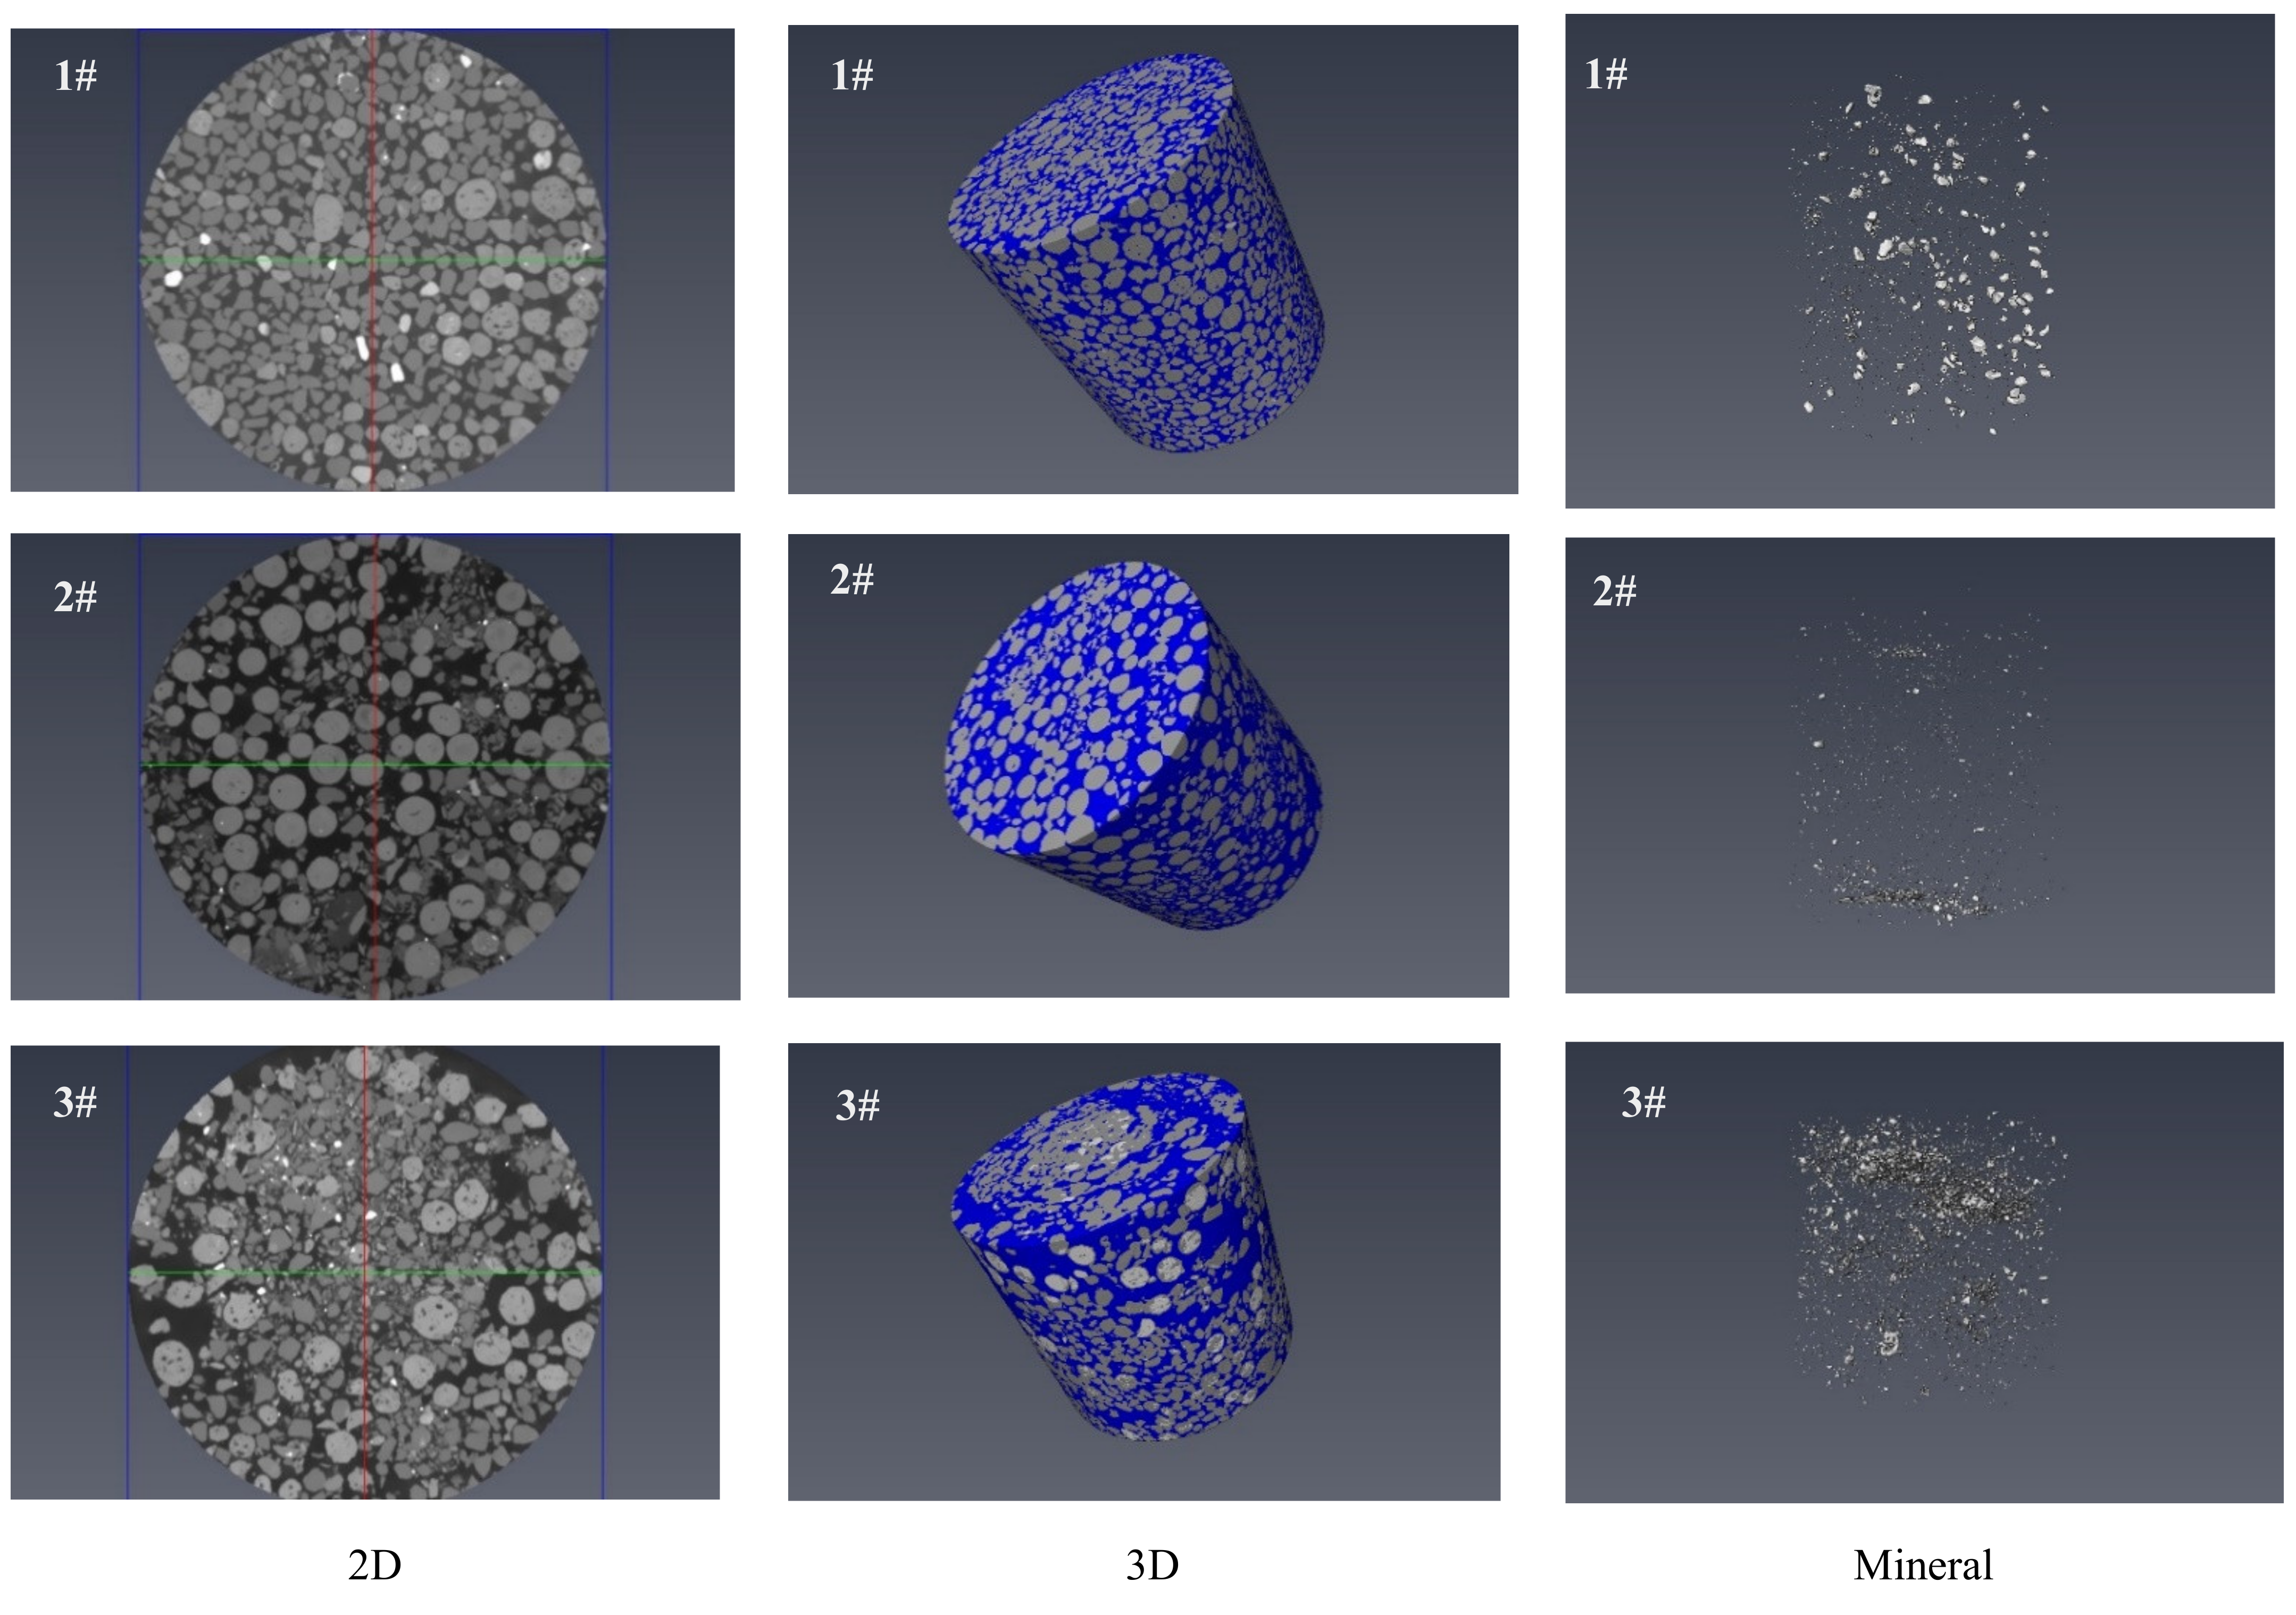
3.2. CT Scan Analysis

Artificial cores processed with three sand samples were used for CT scan analysis. The two–dimensional and three–dimensional image, size distribution and yielded mineral of three cores are obtained by CT scanning (Figure 2). The particle size of 1# sand sample is relatively uniform and good spatial compactness, among which there are a few large particles, and small–sized particles with irregular shapes occupy most of the space. The size and volume of yielded mineral with an irregular shape are large in 1# sand sample, which may be related to the reservoir fragments formed during hydraulic fracturing. Furthermore, the large particles account for about 50% of the section area from the two–dimensional section diagram, and their roundness is good. The small particles are loosely filled between the large particles, and the spatial compactness of the particles is lower than that of the 1# sample. The size and volume of yielded mineral are smaller in 2# sand sample, indicating that sand produced from reservoir may begin at this period. Small particles account for about 70% of the section area from the two–dimensional view of 3# sand sample. However, the roundness of large particles is better and the spatial compactness of particles is the worst. The yielded mineral of 3# sand sample is small but numerous, so the yielded sand at this period is mainly coming from the shale reservoir. These results indicate that the particle size of the yielded sand in the period of production test is dominated by large–size sand with good roundness, while the small–size sand is mainly in the period of gas production. The yielded mineral in the period of production test is small and less, while it is small and more in the period of gas production. Based on the result of CT scan analysis, the large sand is close to the ceramsite used in hydraulic fracturing, while the small sand may come from quartz sand and shale reservoir.

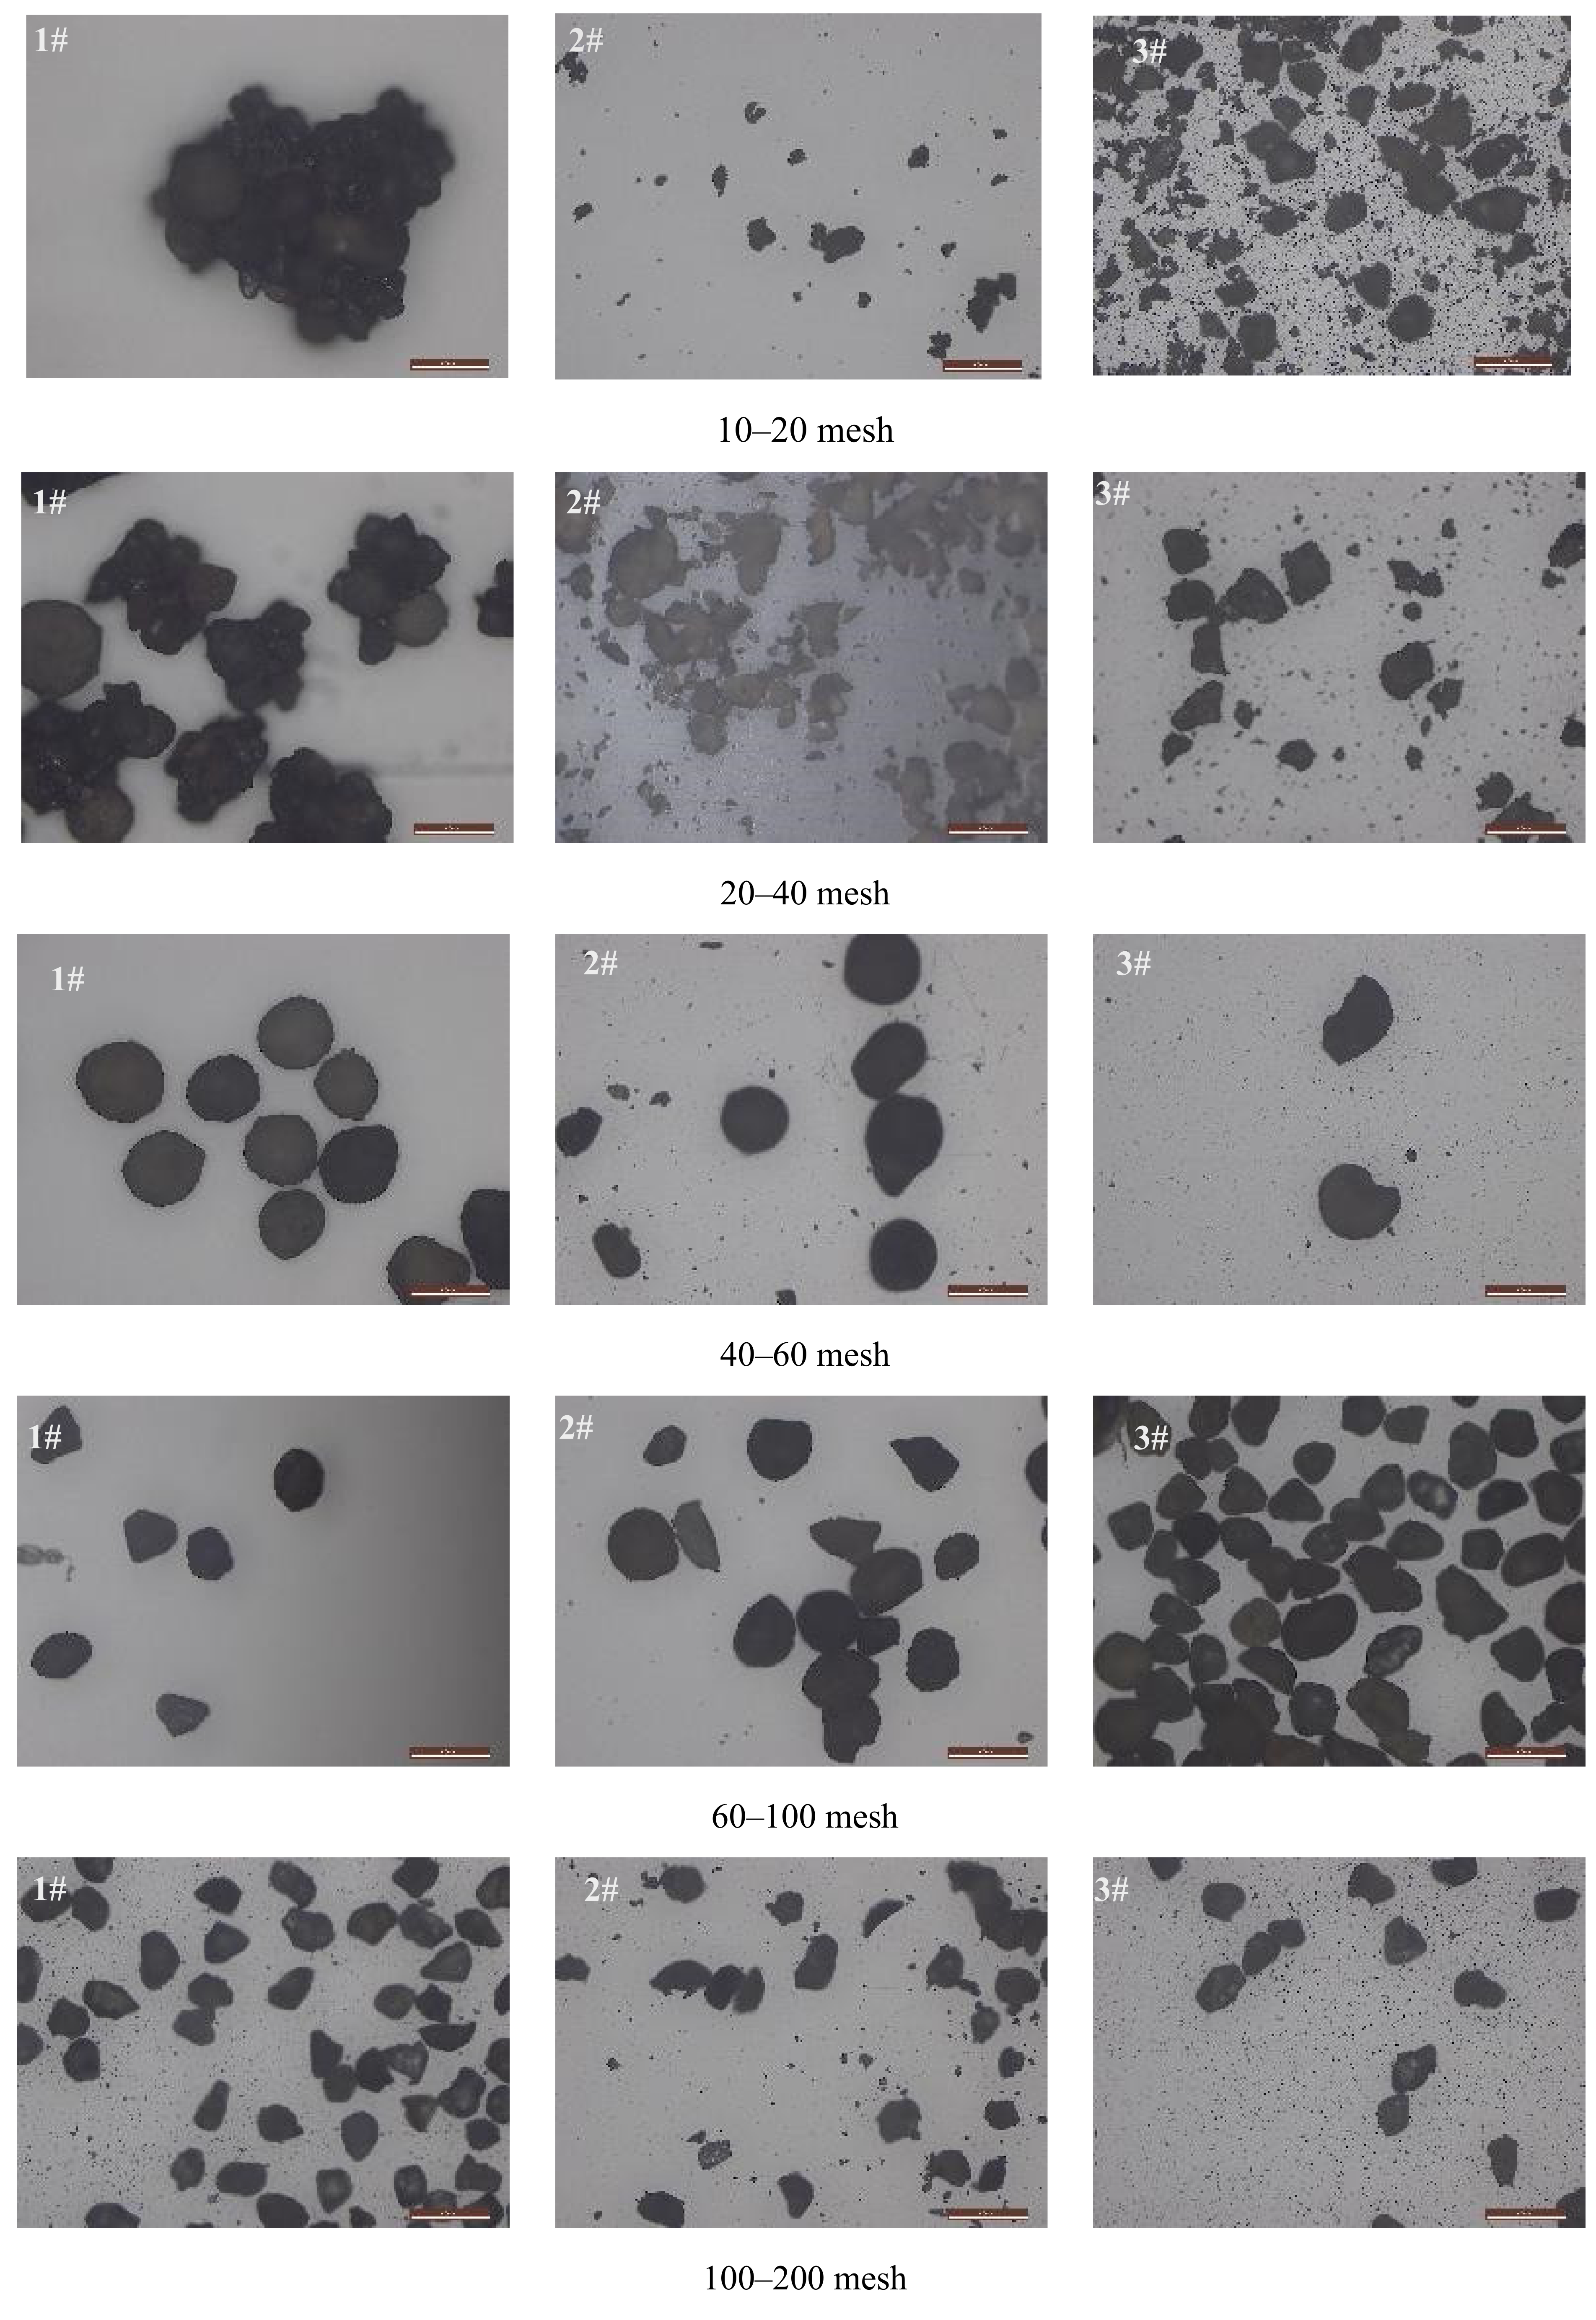
3.3. Microscopic Morphology Analysis

The morphology of the yielded sand with different size was observed by microscope (Figure 3). In the sand larger than 40 mesh, 1# sample shows that small particles aggregate or adhere to larger particles to form a block, while 2# and 3# samples present the flaky and clastic shape. Spallation is observed during the preparation of 2# and 3# samples, indicating that the bonding strength of 2# and 3# samples is lower than that of 1# sample. All of three samples show good roundness in the 40–60 mesh, among which 1# sample has the best roundness. Moreover, some small black spots are obviously observed in 2# and 3# samples. 1# sample has the poor roundness and some irregular-shaped sand in the 60–100 mesh. The roundness of 2# sample becomes worse than that of 1# sample, and irregular-shaped sand of 2# sample increase. The roundness of 3# sample is the worst, and the sand have sharp edges and corners. The irregular shape particle of 1# sample have increased, and some small black spots begin to appear in the 100–200 mesh. In addition to the appearance of some small black spots, there are also some clastic particles in 2# sample. A lot of small black spots appears in 3# sample. The particle less than 40 mesh of three samples will all become more irregular as the decreasing size. Therefore, the morphologic characteristic of the yielded sand in different production periods is different.

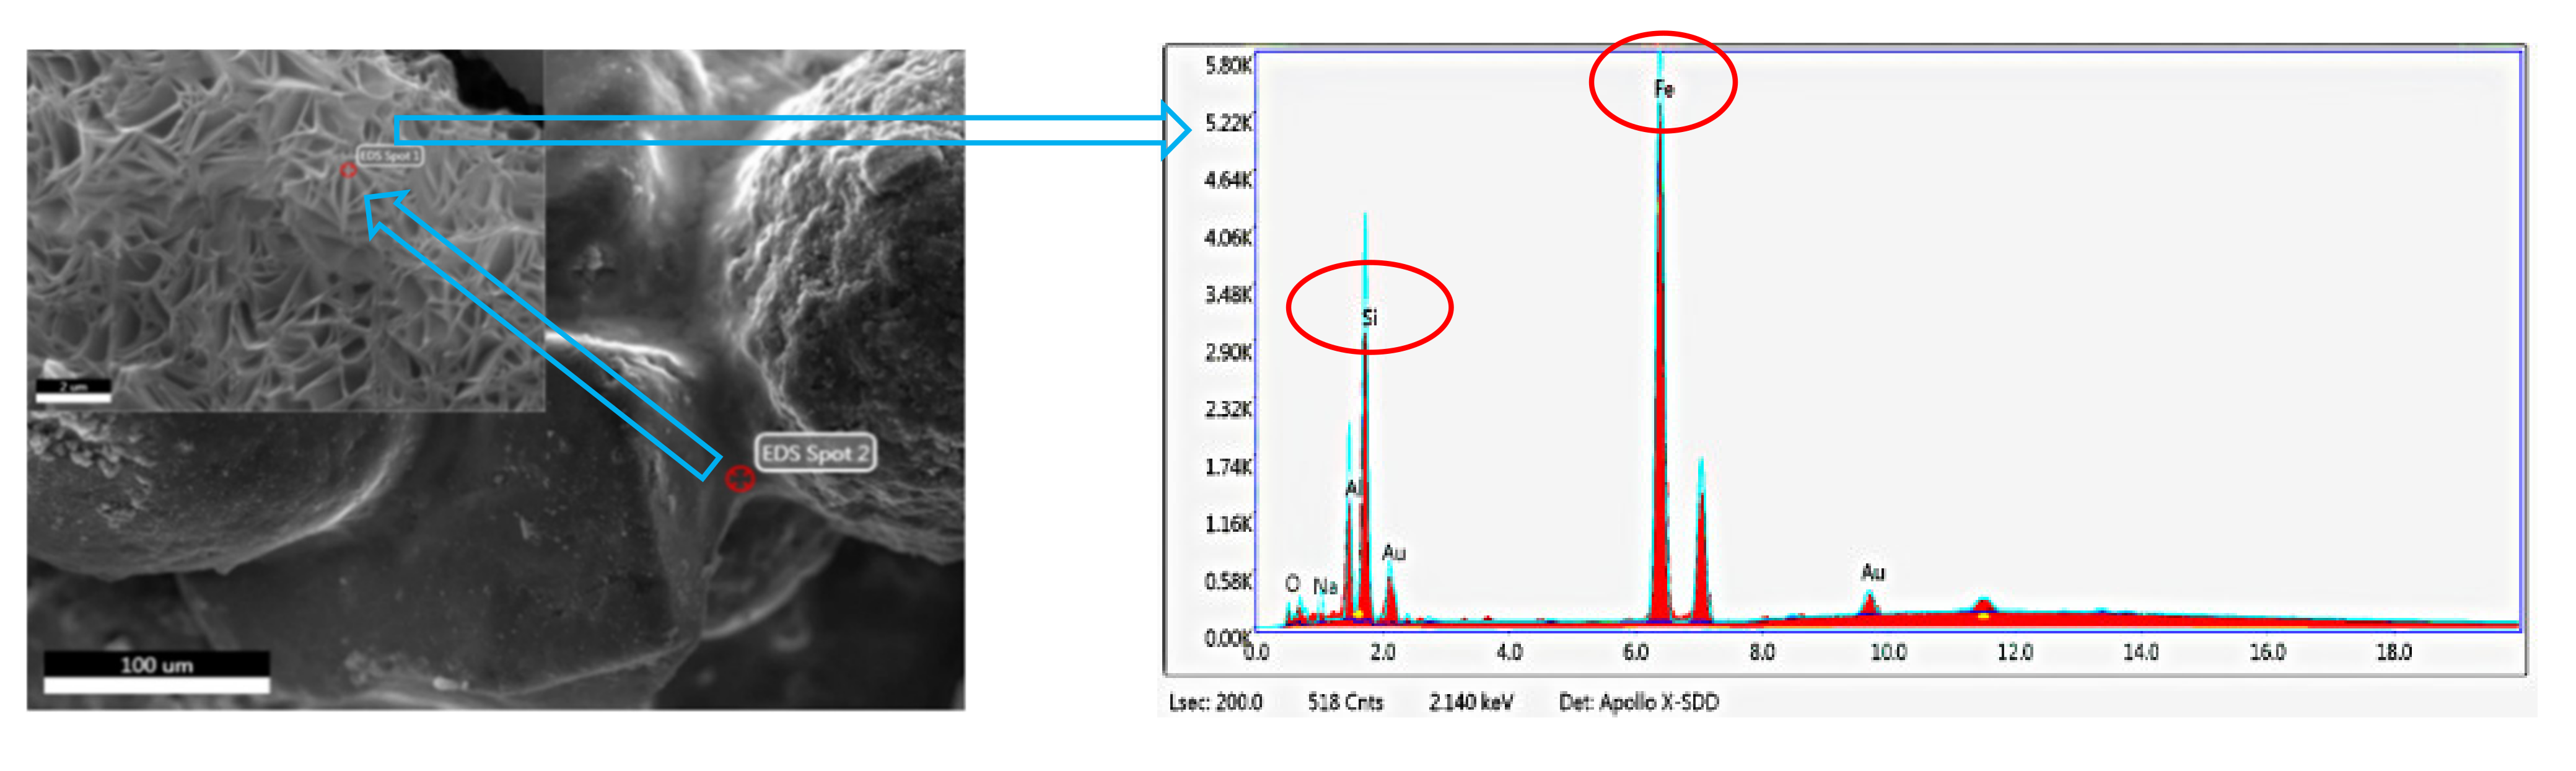
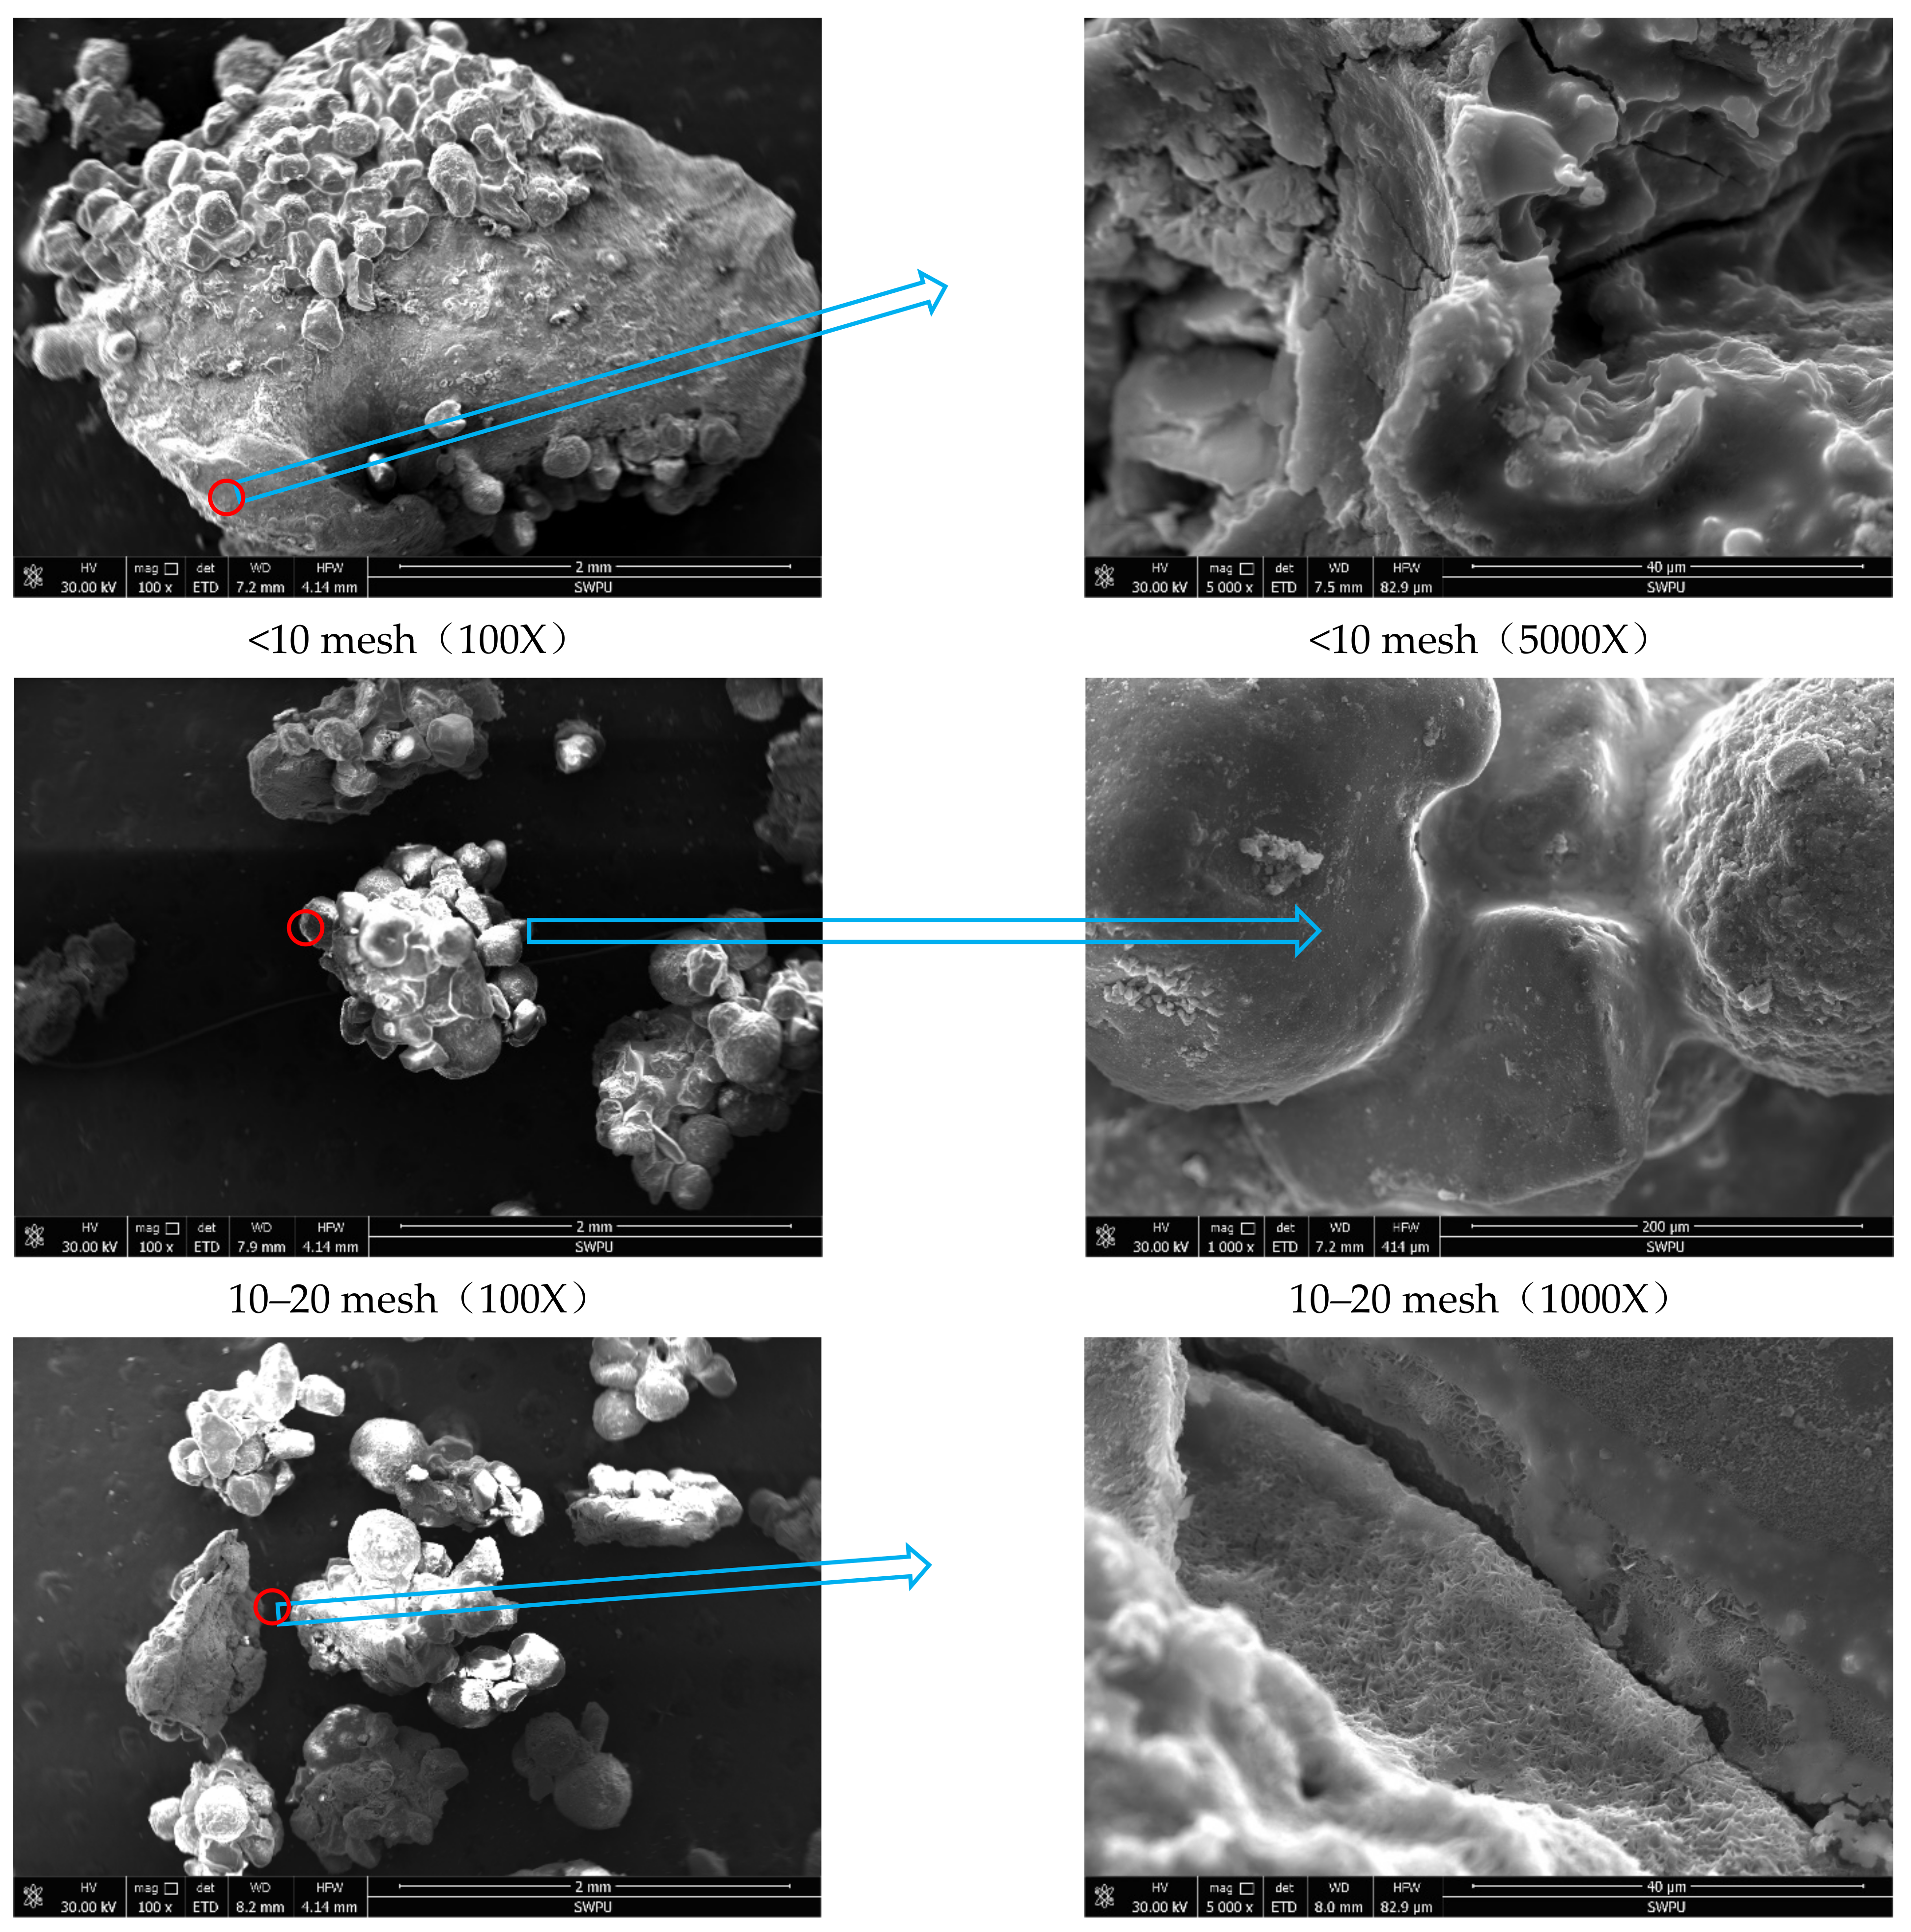
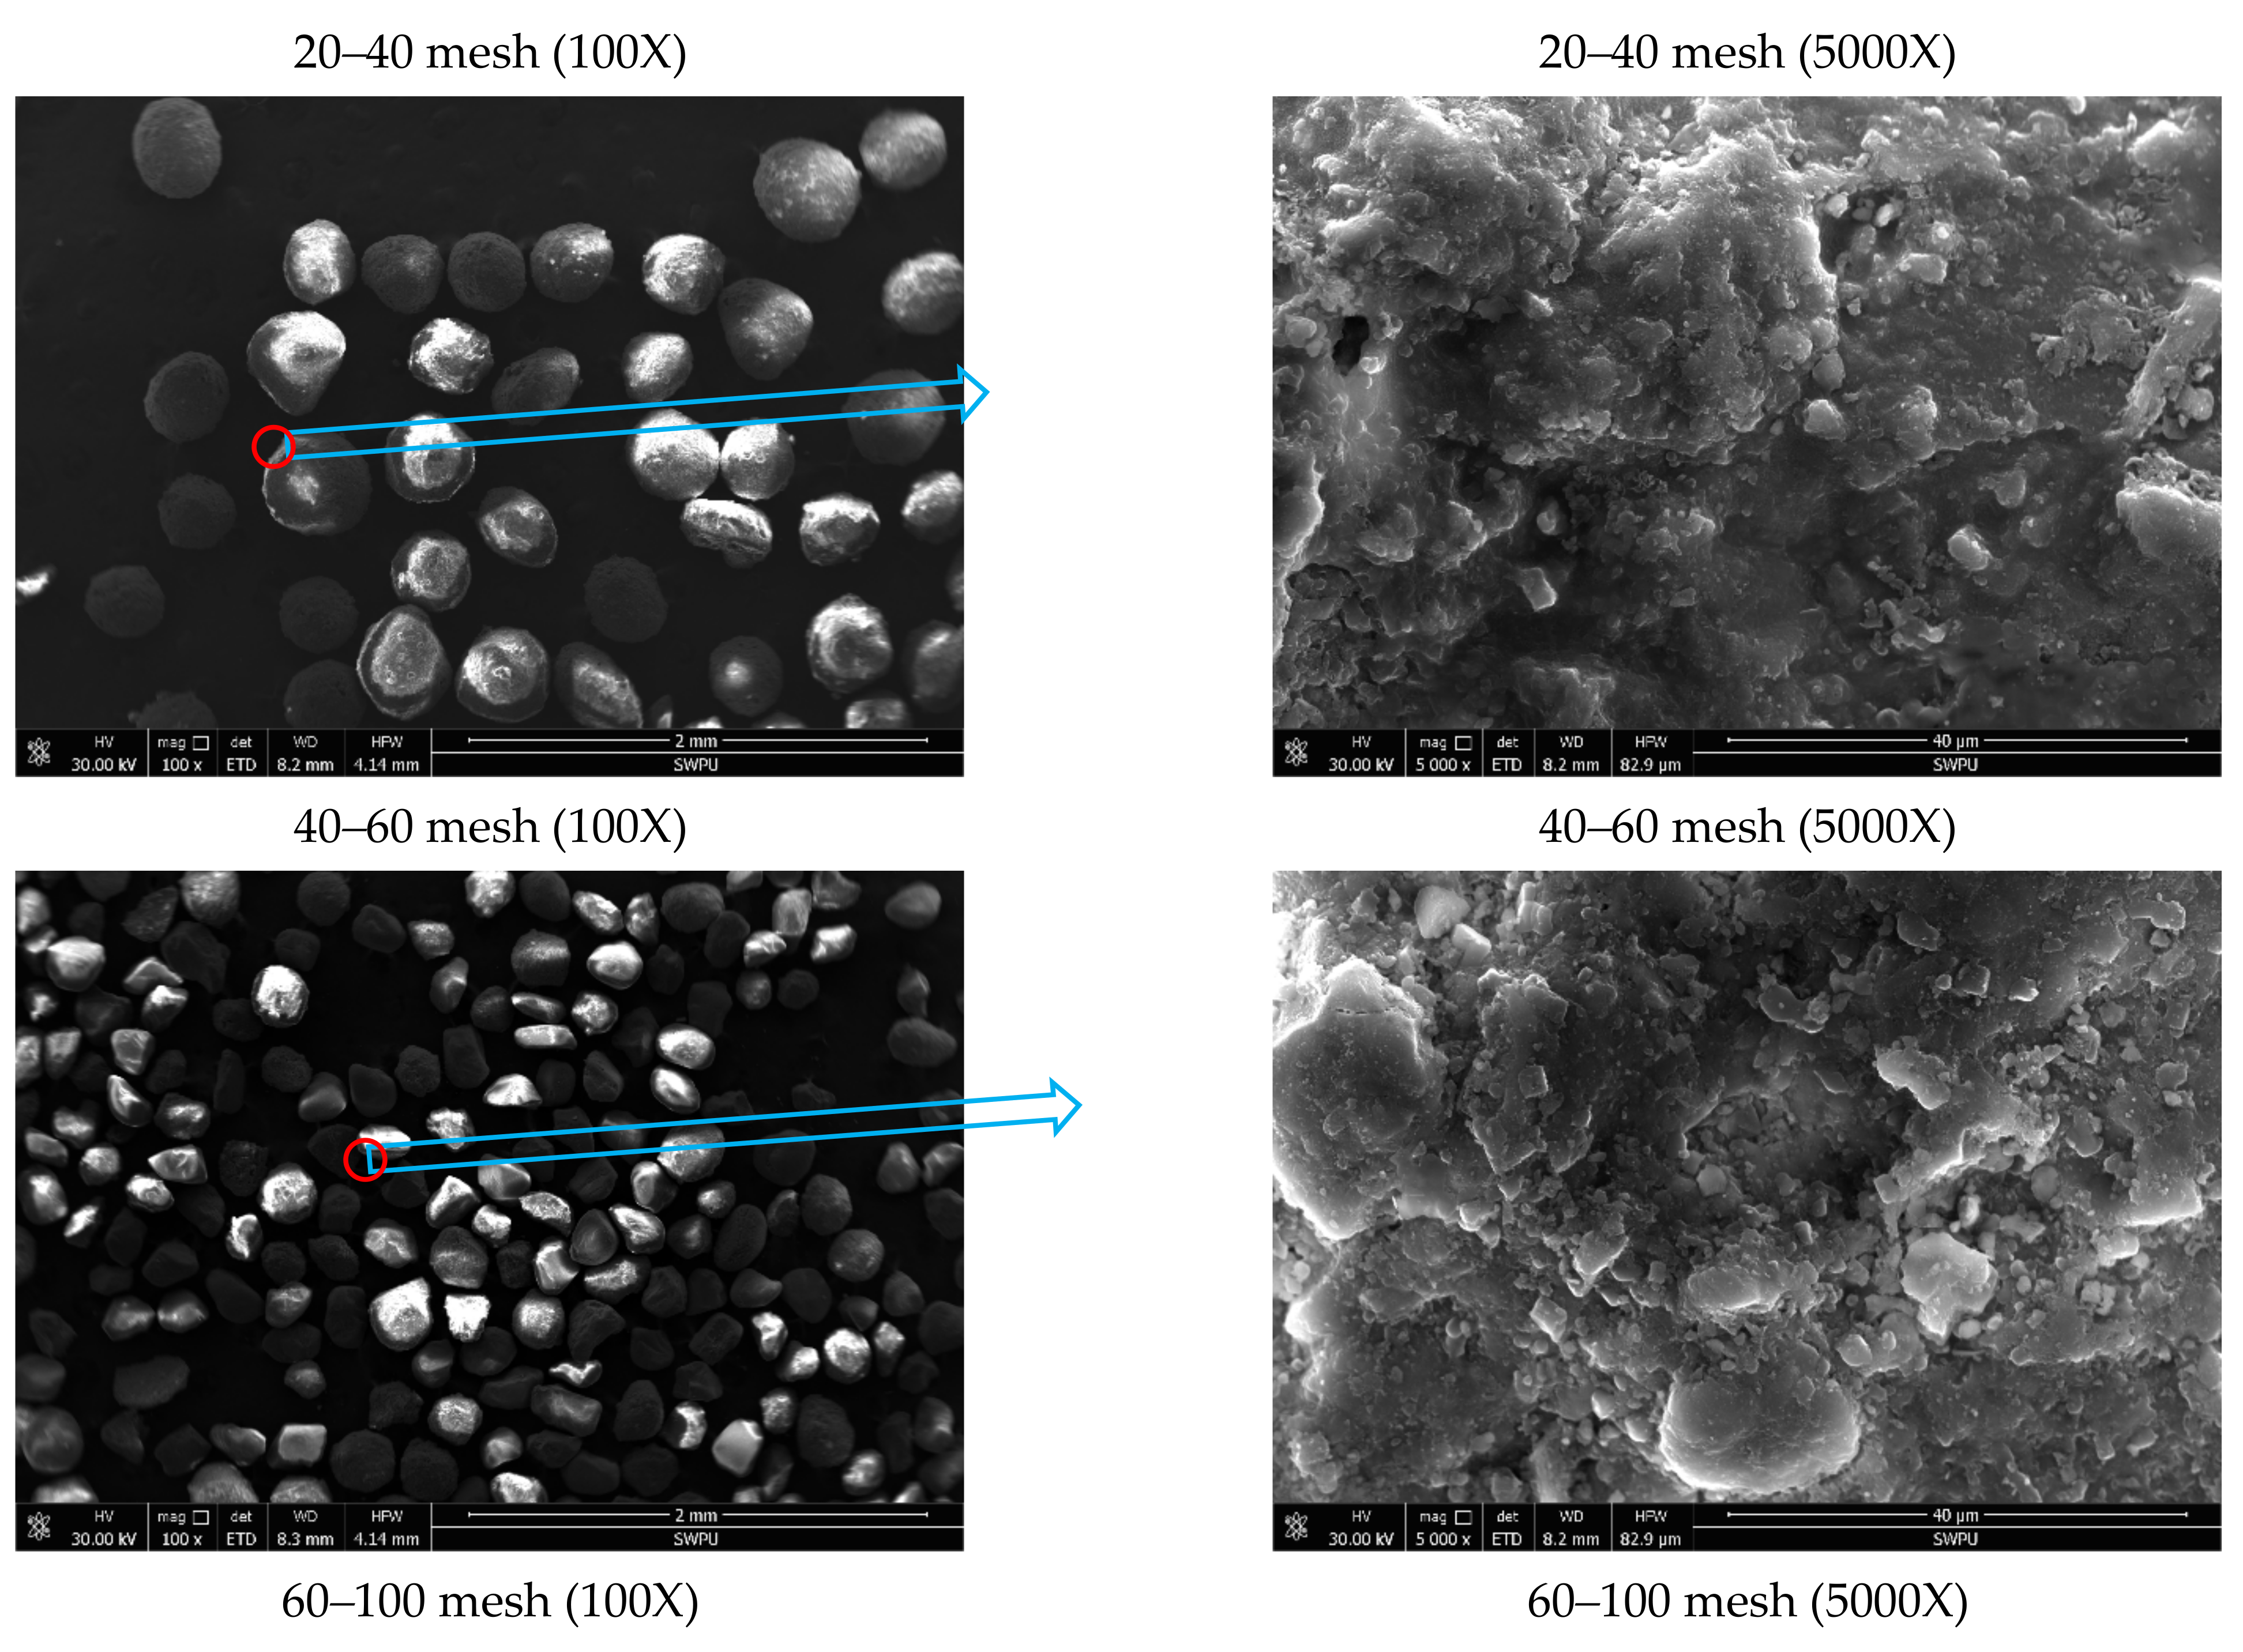
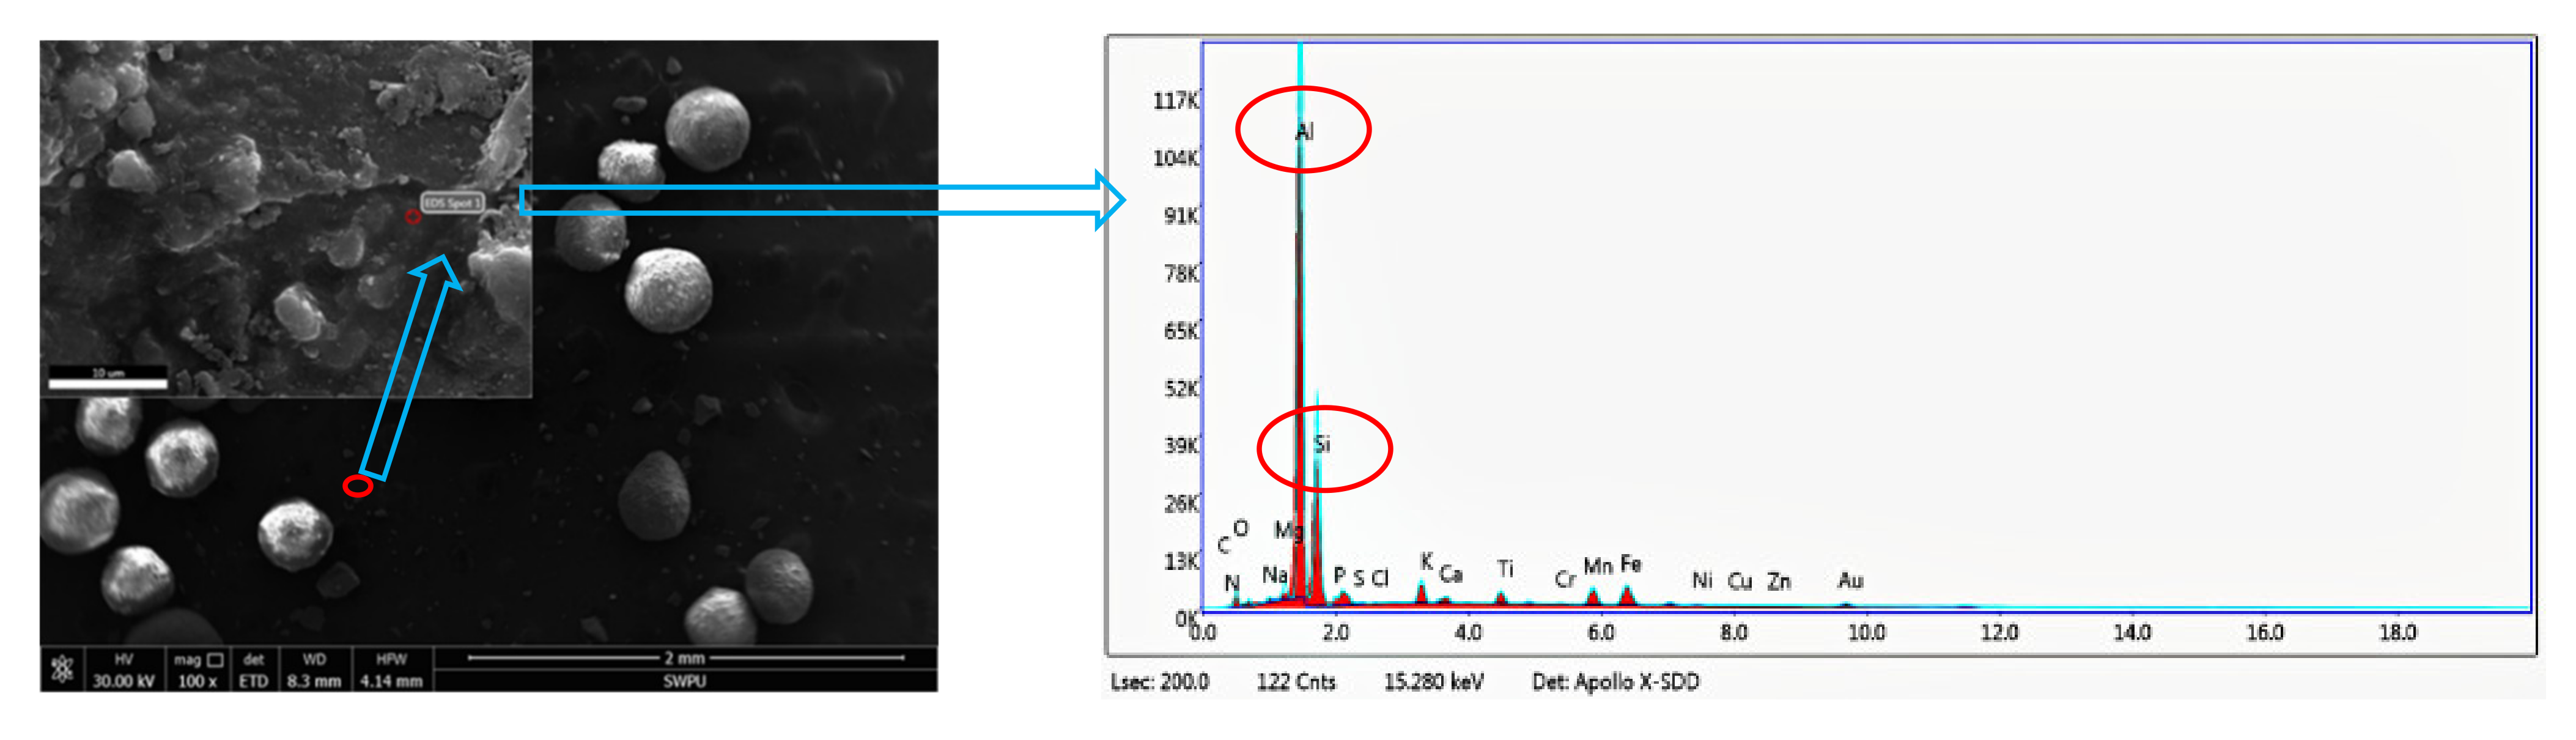
3.4. SEM Observation

The microstructure of the yielded sand with different particle size was observed by scanning electron microscope (Figure 4). 1# sample is taken as an example to analyze the microstructure of the yielded sand, because the three samples have similar structural characteristics at the microscopic scale. It is observed that some small particles adhere to the surface of the large particle in the less than 10 mesh sand. Some fractures exist in the cementing material between the particles, indicating that the cementing material may be the residue of fluid entering the well. In the 10–20 mesh sand, many small particles cement, aggregate and then form larger particles. Liquid film exists on the surface of particles, and the cementation between particles is tight. In the 20–40 mesh sand, particles with cementing and aggregating together can also be observed. Cementing material has a dense network structure obviously, which may be the residue of polymer such as gel and fracturing fluid. The 40–60 mesh sand with the good roundness is scattered, and their surface is tight and messy. In the 60–100 mesh sand, the particle has the worse roundness, the increasing irregularity and the uneven surface. And there is some clastic material attaching to the surface. By observing the microscopic shape of the particles, it is speculated that 40–60 mesh and 60–100 mesh sand may be the ceramsite from hydraulic fracturing.

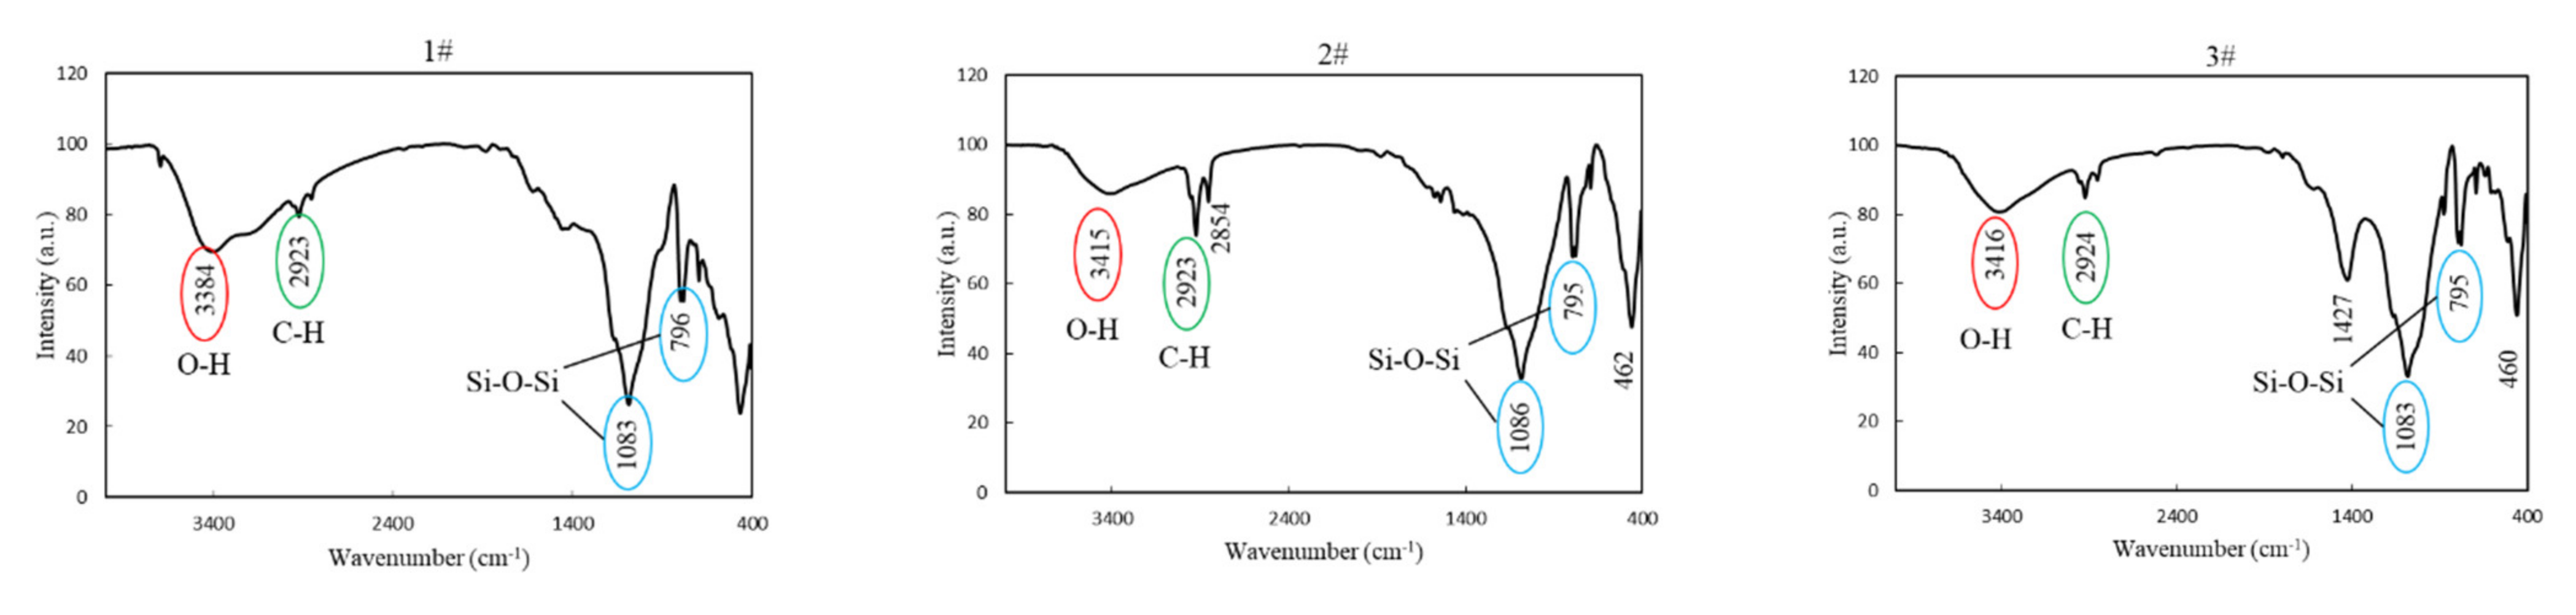
3.5. Mineral Component Analysis

XRD analysis of the yielded sand shows that the mineral component of all the three samples is mainly quartz and a small amount of feldspar, corundum and mullite (Table 1). The corundum found in the analysis result is attributable to the high content of Al2O3 in the yielded sand, while the mullite appeared in the analysis results is due to the presence of aluminosilicates in the yielded sand (SiO2-Al2O3). The quartz content of 3# sample reaches to 73.6%, which is the highest among three samples. And the total content of corundum and mullite is around 15.1% in 2# sample, which is much higher than that of 1# and 3# samples. Based on the result of the XRF measurement (Table 2), it can be seen that the main chemical element component of the three samples is Si and contains a small amount of element such as Al, C, Fe, K, etc. Moreover, the main component of quartz is SiO2, the main oxide of feldspar is Na2O, Al2O3, SiO2, K2O, the main component of corundum is Al2O3, and the main component of mullite is Al2O3 and SiO2. There is a good correlation between the results of XRD and XRF.

4. Discussions

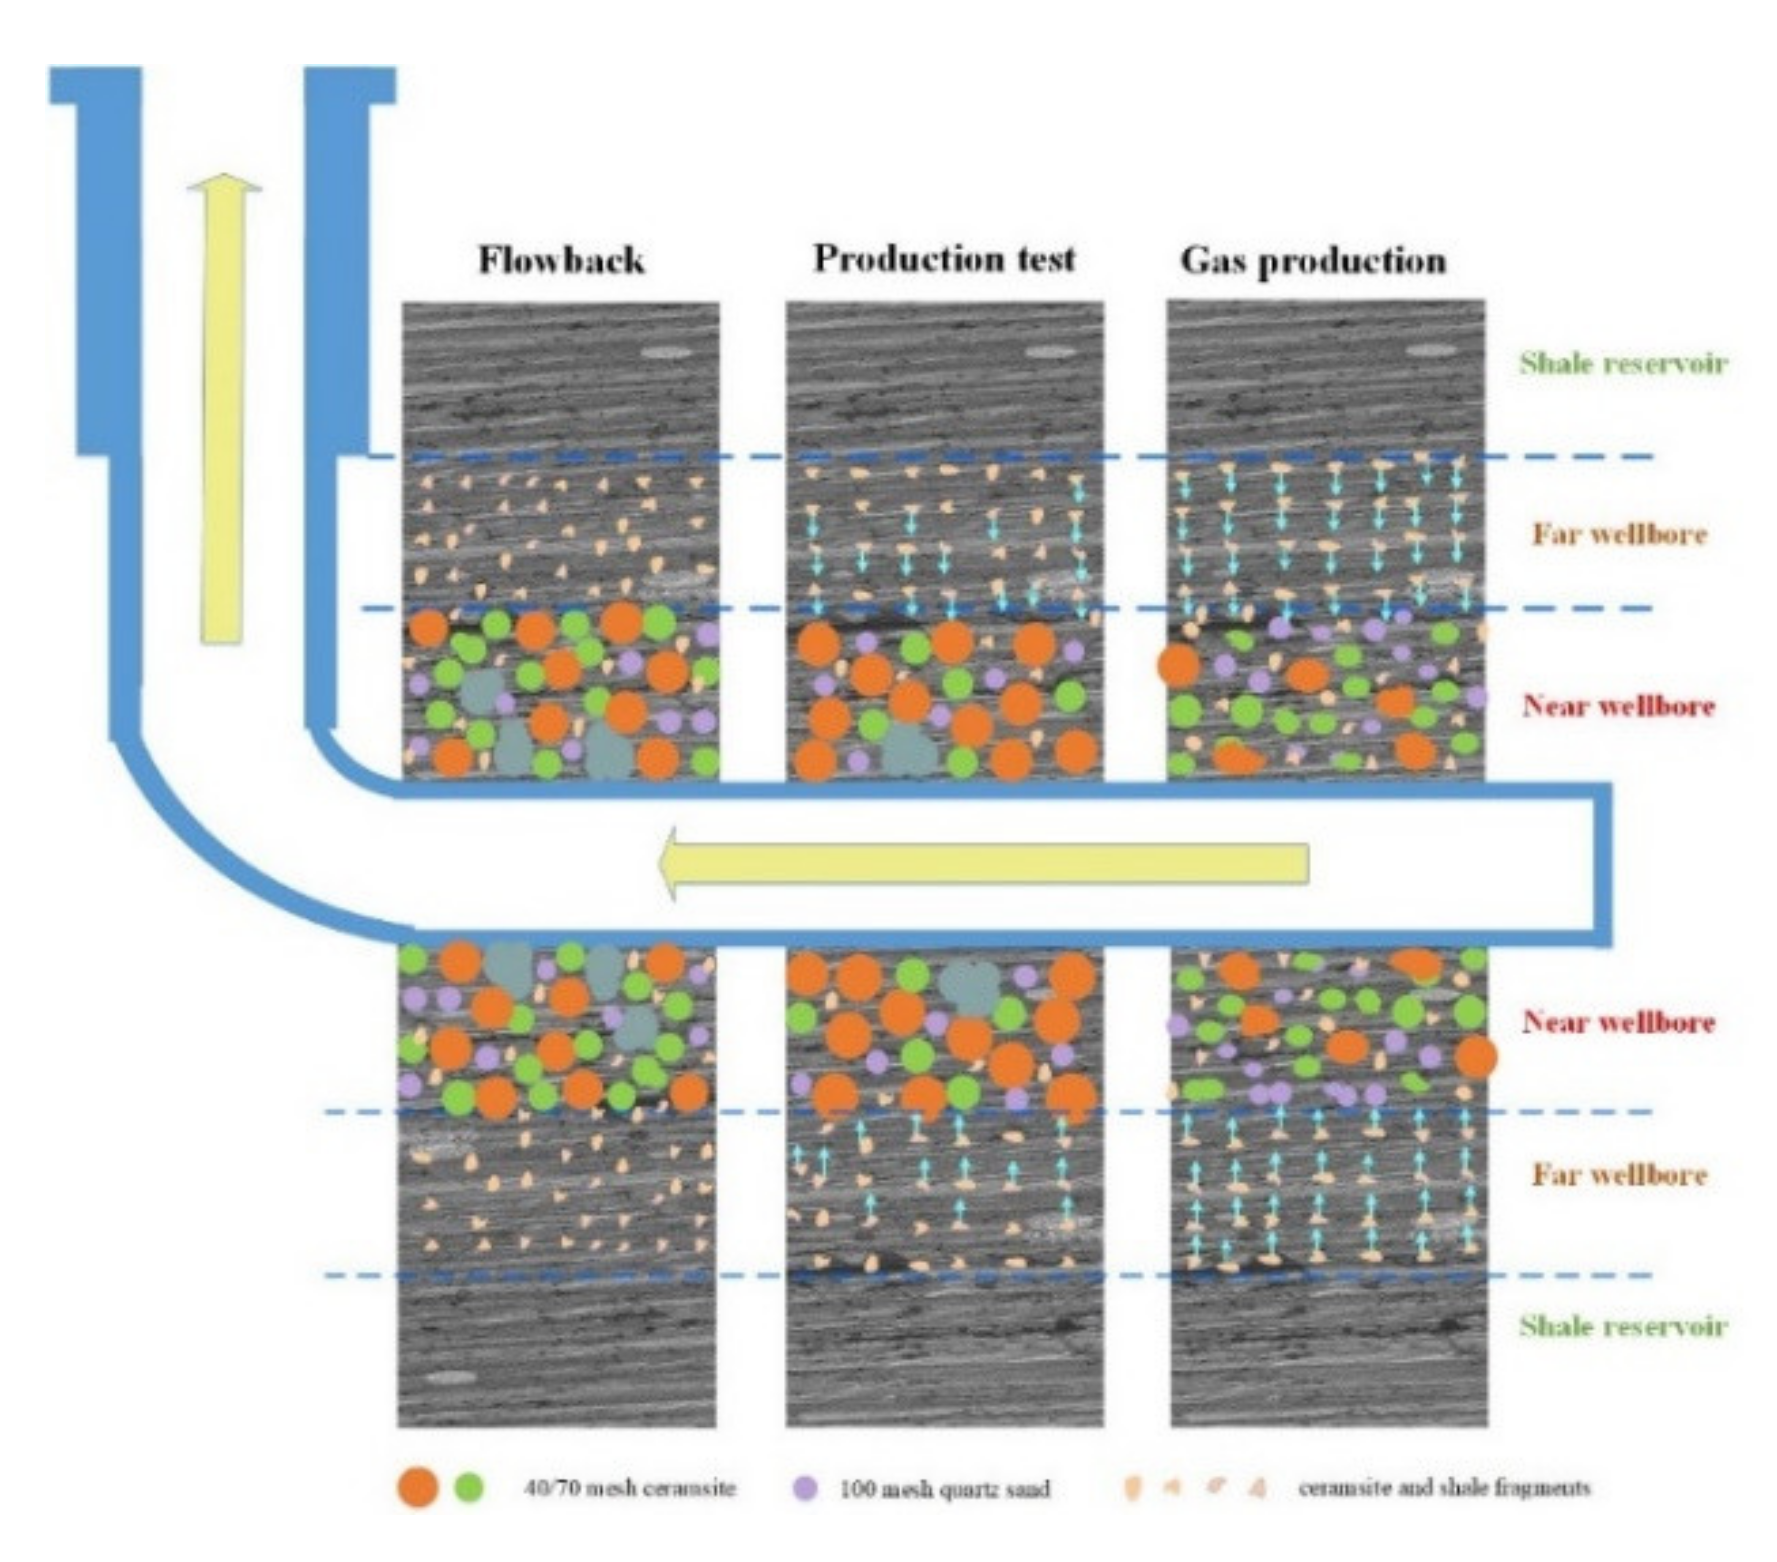
4.1. Source of the Yielded Sand

Dispersed spherical particles are selected for energy dispersive spectrum analysis (EDS) by scanning electron microscope. The result shows that the main component on the surface of the particles is Al and Si elements. Combined with the XRF result, these spherical particles may be ceramsite proppant (Figure 5). To further define the source of the yielded sand, the comparative analysis is conducted on the composition characteristics of proppant, shale and yielded sand (Table 3). The ceramsite proppant is mainly composed of Aluminum oxide, Silicate and Ti-Fe oxides, the quartz sand is mainly composed of quartz and the shale consists of minerals such as Quartz, Feldspar, Clay, Carbonatite, and pyrite. According to the composition analysis of the yielded sand by XRD and XRF, the yielded sand not only contains Quartz, Aluminum oxide, Ti-Fe oxides, but also contains calcium, sodium and potassium oxides from the shale feldspar and carbonate. It shows that the yielded sand of shale gas wells mainly comes from fracturing proppant and shale reservoir particles.

4.2. Effect of Incomplete Gel Breaking on the Yielded Sand

Different size particles agglomerate together to form larger yielded sand by the cementing material especially in the flowback period. In order to understand the mechanism of the particle coalescence, SEM and EDS are used to analyze the structure and composition of the cementing material. The cementing material within the larger sand has a network structure and the complicated component. And the content of Al and Fe elements in the cementing material is relatively high (Figure 6). According to the structure and composition of the cementing material, it is preliminarily judged that the cement comes from the fracturing fluid with incomplete gel breaking.
To further confirm whether the cement is from the fracturing fluid with incomplete gel breaking, infrared spectroscopy is used to analyze the material composition on the particle surface. The absorption curves of the three samples have a high degree of similarity and the absorption peaks of most functional groups appear at the same position (Figure 7). There are several absorption peaks of three samples at the locations of 3384 cm−1, 3415 cm−1 and 3416 cm−1 respectively, where are the stretching vibration absorption peak of O-H bond. Adsorption peak is found in all the three samples around 2923 cm−1, where there is C-H stretching vibration absorption peak of the long chain (CH2)n. There are absorption peaks of the three samples at 1095 cm−1 and 796 cm−1, which are respectively the antisymmetric stretching vibration absorption peak and the symmetric stretching vibration absorption peak of Si-O-Si. Based on the result of these infrared spectroscopy, all three samples contain similar organic chemical components. These organic chemicals are adhered to the surface of the yielded sand or are filled between particles as cements. Because the shale reservoir itself does not contain any organic material, these organic substances should come from the residue of fracturing fluid with incomplete gel breaking.

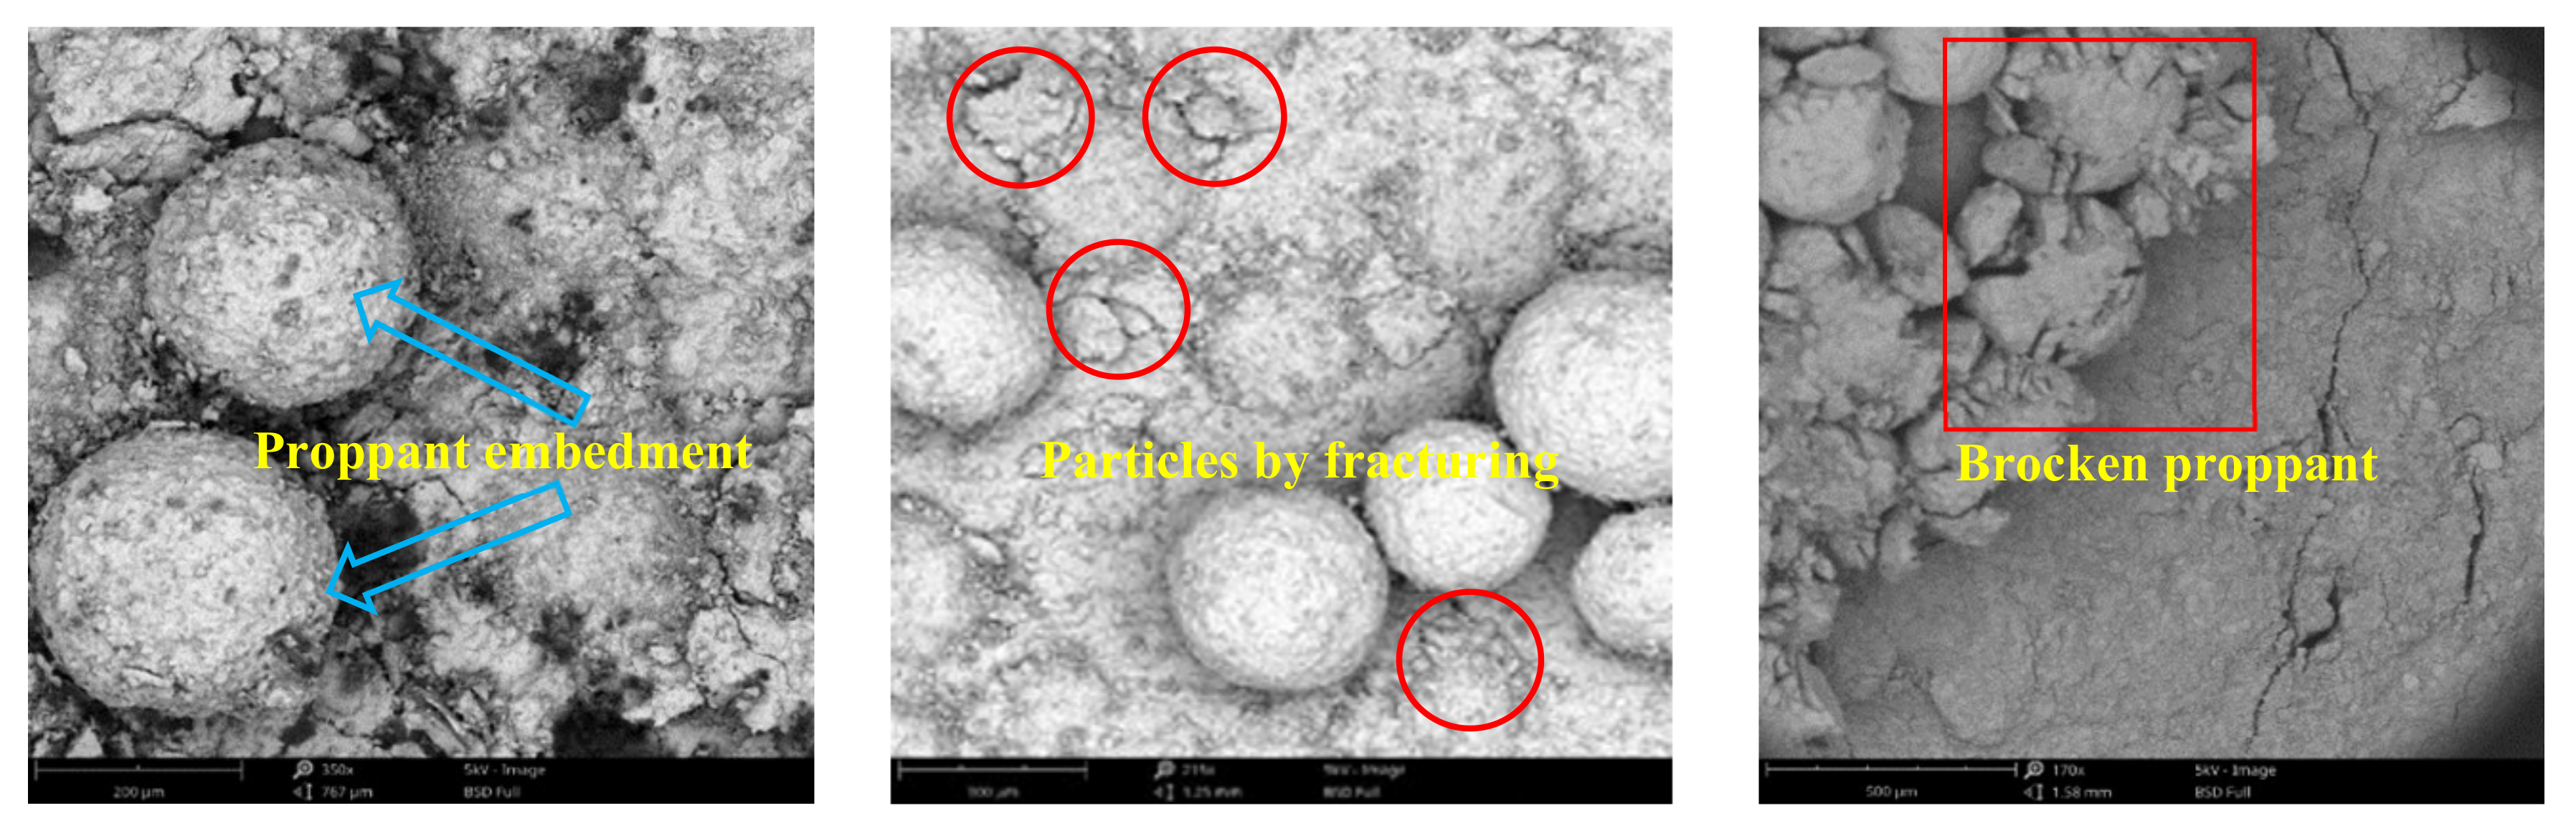
4.3. Effect of Proppant Embedment on the Yielded Sand

In order to further confirm whether the yielded sand contains shale particles, proppant embedding experiments are carried out by the microcomputer controlling pressure tester and scanning electron microscope. The core is artificially fractured, and 40/70 mesh ceramsite with a concentration of 2.5 kg/m2 is laid on the fracture surface. The pressure of 69 MPa is applied on the core sample for 15 min by the microcomputer controlling pressure tester. Scanning electron microscopy (SEM) is used to quantitatively analyze the diameter of pits and the embedding depth of the proppant and observe the rock fragmentation around the embedding particles (Figure 8). The experimental results show that the average depth of proppant embedment ranges from 27.3 µm to 76.3 µm. When the rock sample is subjected to compressive stress, new fractures and proppant embedment occur on the shale surface. These rock failures will generate shale particles, which will become the source of formation yielded sand. It is also observed that some of the proppant have broken under the high stress. Coincidentally, the presence of the broken proppant is also observed in the morphology of the yielded sand. Thus, the particle generated by the proppant failure is also one of the material sources of the yielded sand.

4.4. Difference of the Yielded Sand in Different Production Periods

In order to reduce well construction risks, 100 mesh quartz sand and 40/70 ceramsite are selected as proppant for hydraulic fracturing of the shale gas well in Changning district. 100 mesh quartz sand is used to support micro-fractures and reduce filtration loss, and 40/70 ceramsite is used to support main fractures and improve the fracture conductivity. According to the structure and composition characteristics of the yielded sand, there are some significant differences in the particle size distribution, proppant flowback and formation particles of the yielded sand at different production periods of the shale gas well (Figure 9). During flowback period, the yielded sand has the uniform particle size distribution. Large-size particles (<40 mesh) are firmly bonded and not easily broken. The flowback proppant with a uniform size distribution is mainly 40/70 mesh ceramsite and 100 mesh quartz sand. Formation particles are mainly derived from the broken shale near the wellbore after hydraulic fracturing. During production test period, the particle size distribution of the yielded sand is coarse more and fine less, and the large-size sand (<40 mesh) particles are loosely bonded and easy to disperse after being touched. The flowback proppant is mainly 40 mesh ceramsite. The formation particles are mainly from the broken shale reservoirs in the near-well zone also contain particles from the far-well zone that migrate to the wellbore. During gas production period, the particle size distribution of the yielded sand is coarse less and fine more, and the large-size sand particles (<40 mesh) are loosely bonded and easily dispersed after being touched. The flowback proppant is mainly 70 mesh ceramsite, broken ceramsite and 100 mesh quartz sand. The formation particles are mainly from the particles produced by the internal fragmentation of the shale reservoir.

5. Conclusions

Through the analysis of the structure and composition of the yielded sand in the three period of flowback, production test, and gas production on the same platform in the Changning area of the Sichuan Basin, the following conclusions have been obtained.
(1)
Source of the yielded sand mainly comes from fracturing proppant and shale particles.
(2)
Incomplete gel breaking makes the yielded sand to form large-size particles.
(3)
Shale particles are generated by hydraulic fracturing and proppant embedment.
(4)
Proppant failure during the gas production is also a material source of the yielded sand.
(5)
Structure and composition of the yielded sand show obvious differences in different production stages.

Author Contributions

Conceptualization, writing—review and editing, supervision, X.L.; writing—original draft preparation, data curation, investigation, L.Y.; methodology, investigation, Z.F. All authors have read and agreed to the published version of the manuscript.

Funding

This research was funded by the Sichuan Province Youth Science and technology innovation team project, grant number 2021JDTD0017.

Institutional Review Board Statement

Not applicable.

Informed Consent Statement

Not applicable.

Data Availability Statement

Not applicable.

Conflicts of Interest

The authors declare no conflict of interest.

References

  1. Wang, H.T.; Gala, D.P.; Sharma, M.M. Effect of Fluid Type and Multi-Phase Flow on Sand Production in Oil and Gas Wells. In Proceedings of the the SPE Annual Technical Conference and Exhibition, San Antonio, TX, USA, 9–11 October 2017. [Google Scholar]
  2. Fan, Z.Q.; Yang, D.Y.; Li, X.L. Quantification of Sand Production Using a Pressure-Gradient-Based Sand-Failure Criterion. SPE J. 2019, 24, 988–1001. [Google Scholar] [CrossRef]
  3. Huang, F.; Kang, Y.; Liu, H.; You, L.; Li, X. Critical Conditions for Coal Wellbore Failure during Primary Coalbed Methane Recovery: A Case Study from the San Juan Basin. Rock Mech. Rock Eng. 2019, 52, 4083–4099. [Google Scholar] [CrossRef]
  4. Abass, H.H.; Habbtar, A.H.; Shebatalhamd, A. Sand Control During Drilling, Perforation, Completion and Production. In Proceedings of the Middle East Oil Show, Society of Petroleum Engineers, Manama, Bahrain, 9–12 June 2003. [Google Scholar]
  5. Walton, I.C.; Chang, F.F.; Lopez de Cardenas, J. Perforation Morphology and the Onset of Sand Production. In Proceedings of the SPE Annual Technical Conference and Exhibition, Society of Petroleum Engineers, Houston, TX, USA, 26–29 September 2004. [Google Scholar]
  6. Liu, J.; Guo, X.; Liu, Z.; Liu, X.; Liu, Q. Pressure Field Investigation into Oil&Gas Wellbore during Perforating Shaped Charge Explosion. J. Pet. Sci. Eng. 2019, 172, 1235–1247. [Google Scholar]
  7. Ketmalee, T.; Bandyopadhyay, P. Application of Neural Network in Formation Failure Model to Predict Sand Production. In Proceedings of the Offshore Technology Conference Asia, Kuala Lumpur, Malaysia, 20–23 March 2018. [Google Scholar]
  8. Zhang, Z.X.; Yang, J.; Zhang, Y.C.; Wang, E.; Meng, W.B.; Qu, X.M.; Zhao, X. Prediction of Sand Production and Optimization of Sand Control Methods in the Production Test Process of Deep Water Gas Wells. In Proceedings of the 54th U.S. Rock Mechanics/Geomechanics Symposium, Physical Event Cancelled, Golden, CO, USA, 28 June–1 July 2020. [Google Scholar]
  9. Coskuner, G.; Naderi, K.; Babadagli, T. An Enhanced Oil Recovery Technology as a Follow up to Cold Heavy Oil Production with Sand. J. Pet. Sci. Eng. 2015, 133, 475–482. [Google Scholar] [CrossRef]
  10. Xiong, Y.; Xu, H.; Wang, Y.; Zhou, W.; Liu, C.; Wang, L. Fluid Flow with Compaction and Sand Production in Unconsolidated Sandstone Reservoir. Petroleum 2018, 4, 358–363. [Google Scholar] [CrossRef]
  11. Wang, L.; Wen, H. Experimental Investigation on the Factors Affecting Proppant Flowback Performance. J. Energy Resour. Technol. 2020, 142, 1–17. [Google Scholar] [CrossRef]
  12. Hu, J.H.; Zhao, J.Z.; Li, Y.M. A proppant mechanical model in postfrac flowback treatment. J. Nat. Gas Sci. Eng. 2014, 20, 23–26. [Google Scholar] [CrossRef]
  13. Wan, R.G.; Wang, J. Modelling of Sand Production and Wormhole Propagation in an Oil Saturated Sand Pack Using Stabilized Finite Element Methods. In Proceedings of the Canadian International Petroleum Conference, Calgary, AB, Canada, 8–10 June 2004; p. 43. [Google Scholar] [CrossRef]
  14. Zhou, Z.Y.; Yu, A.B.; Choi, S.K. Numerical Simulation of the Liquid-Induced Erosion in a Weakly Bonded Sand Assembly. Powder Technol. 2011, 211, 237–249. [Google Scholar] [CrossRef]
  15. Song, Y.; Ranjith, P.G.; Wu, B. Development and experimental validation of a computational fluid dynamics-discrete element method sand production model. J. Nat. Gas Sci. Eng. 2019, 73, 103052. [Google Scholar] [CrossRef]
  16. Zheng, H.; Zhang, J.; Qi, Y. Geology and geomechanics of hydraulic fracturing in the Marcellus shale gas play and their potential applications to the Fuling shale gas development. Energy Geosci. 2020, 1, 36–46. [Google Scholar] [CrossRef]
Figure 1. Size distribution of three sand samples.
Energies 14 05588 g001
Figure 2. The structure of the samples by CT scanning.
Energies 14 05588 g002
Figure 3. Microscope observation of sample structure.
Energies 14 05588 g003
Figure 4. Scanning electron microscopy (SEM) of yielded sand.
Energies 14 05588 g004aEnergies 14 05588 g004b
Figure 5. Surface component of the yielded sand.
Energies 14 05588 g005
Figure 6. Component of interparticle cementing material.
Energies 14 05588 g006
Figure 7. Infrared spectra analysis of yielded sand.
Energies 14 05588 g007
Figure 8. Effect of proppant embedment on the yielded sand.
Energies 14 05588 g008
Figure 9. Characteristics of the yielded sand in different production periods.
Energies 14 05588 g009
Table 1. Mineral component of yielded sand by XRD.
SampleQuartzFeldsparCorundumMullite
1#69.1%24.6%2.8%3.5%
2#66.1%18.8%0.5%14.6%
3#73.6%18.5%6.0%1.9%
Table 2. Chemical element component of yielded sand by XRF.
ElementContent (%)
1#2#3#
O42.765731.585131.3945
Si34.490341.656845.8249
Al7.13229.17427.7717
C6.05555.53074.0952
K3.27273.33753.6574
Fe2.78854.4472.7841
Ca1.0041.19331.2632
Na0.88571.21161.1104
Ti0.63460.40970.749
Mg0.40860.18090.1769
Cl0.28510.58170.8197
Zr0.08860.07590.0699
Mn0.08550.28450.081
Sr0.04320.10220.0896
P0.03050.14110.0369
S0.02910.08770.0756
Table 3. Mineral composition of proppant and Longmaxi shale in Changning district of Sichuan Basin.
MaterialQuartz SandCeramsite ProppantShale
CompostionQuartzAluminum oxideSilicateTi-Fe
oxides
QuartzCarbonatiteFeldsparPyriteClay
Publisher’s Note: MDPI stays neutral with regard to jurisdictional claims in published maps and institutional affiliations.

