Article

Gasification of Coal by CO2: The Impact of the Heat Transfer Limitation on the Progress, Reaction Rate and Kinetics of the Process

by
Krzysztof M. Czajka
Department of Energy Conversion Engineering, Wroclaw University of Science and Technology, 50-370 Wroclaw, Poland
Energies 2021, 14(17), 5569; https://doi.org/10.3390/en14175569
Submission received: 9 August 2021 / Revised: 31 August 2021 / Accepted: 1 September 2021 / Published: 6 September 2021
(This article belongs to the Special Issue Modelling and Calculation of Raw Material Industry)

Abstract

:
This paper presents the impact of thermal lag on the progress of different coal types’ gasification by CO2. The analysis was performed using thermogravimetry and numerical modeling. Experiments were carried out at a heating rate of 1–50 Kmin−1 and a temperature ranging from 383 to 1173 K. The developed numerical model enabled the determination of a true sample temperature considering the gasification process to consist of two single-step consecutive reactions. Analysis revealed that the average thermal lag in CO2 is about 11% greater than that in N2, which is related to the properties of CO2 itself and the occurrence of the char–CO2 reaction. The onset temperature of the reverse Boudouard reaction depends on the type of fuel; however, no simple relationship with the coal rank was found. Thermal lag has an impact on the kinetic parameter Aα0.5 describing devolatilization, up to 19.8%, while in the case of the char–CO2 reaction, this influence is expected to be even greater. The performed analysis proved that disregarding thermal lag may significantly hinder the interpretation of the analyzed processes; thus, TG experiments should be carried out with a low heating rate, or at the post-processing stage, a thermal lag model needs to be employed.

1. Introduction

Nowadays, two thirds of coal is consumed by the electricity sector [1]. Although the consumption of coal for energy production in 2020 decreased by approximately 8% compared to 2019, coal-fired power plants are still the dominant source of energy production, yielding ca. 36% of the global electrical power [1]. Bearing in mind that the use of fossil fuels raises numerous concerns related to the environmental cost [2], international organizations and governments of different countries are undertaking numerous initiatives such as the “Green Deal”, “Clean Power Plan” or “Carbon Neutrality” that are supposed to reduce the use of coal for energy purposes. Nevertheless, the world’s forecasted growing electricity demand is going to require increases in all generation sectors, including renewables, coal and nuclear; thus, it may be expected that coal will continue to play a significant role in power generation [3].
One of the ways to meet the growing electricity needs while maintaining concern for the natural environment is the concept of the development of clean coal technology (CCT). CCT covers a wide range of topics, from coal mining, through its use for heat and power production, up to the utilization of coal-based wastes, and comprises a variety of pollutant abatement techniques. The most recent challenges in CCT are related to the need to tackle the rising CO2 emissions, extending CCT to include carbon capture and sequestration techniques (also called carbon capture and storage, both abbreviated as CCS) or carbon capture, utilization and storage methods (CCUS) [4,5].
Among the many clean coal technologies integrated with carbon capture, utilization and storage, the concept of gasification of fossil fuels in reactors in which CO2 is the gasifying agent deserves special attention. This technology enables the highly efficient production of electricity from coal fuels while reducing the negative impact on the environment. It is part of the circular carbon economy concept (CCE), thanks to which the carbon cycle could be effectively closed and the rising CO2 could be reused within different processes [6].
Unlike steam and air gasification, which are quite established and well documented, most CO2 gasification studies are limited to the lab scale and are quite far from industrial implementation. According to the author’s knowledge, no commercial CO2 gasifier is in operation at present. Patent research from the past 17 years indicated that until 2021, less than 190 patents concerning CO2 gasifiers were recognized worldwide [7]. As stated in the comprehensive review papers of [7,8,9], nowadays, the main challenge to be overcome is to scale up results obtained at laboratory reactors to the industrial scale.
Analysis of the gasification process in CO2 is usually carried out using conventional methods such as conduction and convection heating. Laboratory-scale experimental apparatuses such as thermogravimetric analyzers (TG) usually employ electrical resistances to heat up and precisely control the parameters of operation. The use of TG is common, although it has its limitations [10] and has been criticized for its inability to obtain high temperatures and high heating rates [11]. Nevertheless, as indicated in [12], kinetic parameters determined employing TG can be successfully used to predict fuel behavior on an industrial scale.
To successfully apply kinetic parameters to describe the course of the process in industrial conditions, laboratory measurements should be performed in the absence of mass transfer limitations [13]. According to the recommendations of the International Thermal Analysis and Calorimetry Society (ICTAC) Kinetic Committee, it is suggested to analyze a thin layer of the sample, use low heating rates or limit the temperature of the process [14]. Nevertheless, good practice during the experimental stage may decrease the mass transfer limitations but not eliminate them. It is impossible to avoid inaccuracies arising from, for example, the occurrence of endothermic/exothermic reactions or the finite heat transfer rate between the gaseous environment and the analyzed sample.
As indicated in [15,16,17], to increase the accuracy of determination of the true sample temperature (Ts), it is worth using a model that considers the nature of the heat transfer inside the TG reactor. The numerical analysis presented in [15], supported by experimental results, showed that in the case of the pyrolysis process in nitrogen, in the heating rate range from 1 to 80 Kmin−1, the discrepancy between the Ts and the temperature measured in the close surroundings of the sample (Tc), known as thermal lag, might be from 4.8 to 56.2 K. In the work of [18], it was shown that for the heating rate of 40 Kmin−1, the discrepancies reach approximately 35 K, while in [17], it was indicated that for the heating rate of 10 Kmin−1, the maximum thermal lag can be from 51 to over 200 K. Unfortunately, in the case of the CO2 gasification process, despite a detailed literature review, it was not possible to identify studies devoted to the determination of the impact of thermal lag on the accuracy of the TG measurement.
The shown inaccuracies in temperature determination affect the reliability of the measured reactivity of the analyzed samples and their kinetic parameters, which may lead to a misinterpretation of the nature of the investigated process. According to the information presented in [18], the discrepancies in the kinetic parameters determined before and after considering the limited heat transfer may be from 10% to 20%, and according to [15], they can even reach 40–50%. Please note that the above results are shunted to pyrolysis in the nitrogen atmosphere. In the case of the carbon dioxide atmosphere, the author is not aware of any works on this issue, but it seems that due to the different properties of CO2 compared to N2, including its higher density and heat capacity [19], the real differences may be even greater.
Therefore, this study aimed to analyze and assess to what extent the heat limitation affects the measurement of the coal gasification process with CO2 in TG conditions. For this study, a thermal lag model which considers both the nature of the gasifying agent and the physicochemical properties of the analyzed sample was developed. Experimental and model studies were aimed at explaining to what extent the measured temperature of the sample differs from the true temperature and what the consequences of these differences are in the context of analyzing the reaction rate, the amount of converted fuel and the kinetic parameters describing the gasification process. Particular attention was paid to the reaction of the remaining char with CO2, the so-called reverse Boudouard or Boudouard–Bell [20] reaction, which will play a key role in terms of the need to scale laboratory results to an industrial scale if the gasification process is planned to be carried out at temperatures above 1273 K [21].

2. Experimental Setup and Tests

2.1. Facility and Instrumentation

Thermogravimetric analysis was carried out with a SETARAM Setsys Evolution TGA. This device can continuously measure weight loss as a function of time and temperature. It consists of a microbalance connected to a tray, on which lay two crucibles. The investigated sample filled one of the crucibles, while the reference crucible remained empty and was used to determine the temperature drift of the device. Both crucibles were located inside a cylindrical furnace with a programmable control temperature. The device was equipped with three thermocouples (as shown in Figure 1), of which one was located below the sample crucible and provided the crucible temperature (Tc), the second one measured the temperature of the reference crucible and the third measured the temperature of the surrounding gaseous atmosphere.
The mass of the sample was limited to ca. 10−6 kg, in order to mitigate the impact of self-heating/self-cooling [14]. At the first stage of the experiments, the sample was dried at 383 K until its weight became constant. Afterwards, to simulate the gasification process, samples were heated at a rate of 1, 5, 15, 30 and 50 Kmin−1 (to simplify the notation further, these rates are referred to as HR1, HR5, etc.), with a flow of 32 mL min–1, in an atmosphere containing 100% CO2, at a temperature ranging from 383 to 1173 K. The reference measurements were conducted according to a similar heating program, except that the atmosphere contained 100% N2.

2.2. Sample Properties

The samples analyzed in the experiments were as follows:
-
Lignites, LB supplied by Bełchatów Coal Mine (Poland) and LT supplied by Turów Coal Mine (Poland);
-
Hard coals, HJ supplied by Janina Coal Mine located in Libiąż (Poland), HS supplied by Sobieski Coal Mine located in Jaworzno (Poland) and HZ supplied by Ziemowit Coal Mine located in Lędziny (Poland);
-
Anthracite, AI mined in Ibbenbüren Coal Mine (Germany).
The samples were air dried, pulverized to a size below 10 μm and homogenized. The high fineness of the coal resulted from the requirement to ensure a kinetic gasification regime and was directly related to the need to obtain the appropriate Biot and external pyrolysis numbers (for more details, please see 3.2). The necessity to grind the fuel to a similarly fine fraction is confirmed, among others, in [22]. The remaining determinations were conducted under the relevant standards, i.e., moisture content was determined according to [23], volatile matter according to [24] and ash according to [25]. The ultimate analysis was conducted through LECO TruSpec Micro CHNS following [26,27], while the higher heating value was analyzed with IKA WERKE C2000, according to [28]. The obtained results are summarized in Table 1.

3. Modeling Study

3.1. Thermal Lag Model

This model is a development of works devoted to the pyrolysis of solid fuels in nitrogen [15,16,17] and allows determining the thermal lag accompanying the gasification reaction. Although the gasification process is very complex, and its mechanism is sometimes described using up to several hundred chemical reactions [29,30,31], experimental studies carried out with the use of TG (described in detail in Section 4.1) have shown that, in some simplifications, the process can be viewed as two consecutive stages. In the first stage, the volatile matter evolves, while in the second stage, the remaining carbonized residue reacts with CO2 to produce CO, namely:
Energies 14 05569 i001
The rate of the process can be written as
d α d t = x v o l d α a d t + x c h d α b d t
where x v o l and x c h satisfy the relationship
x v o l + x c h + x a s h = 1
and the rate of devolatilization and the carbon residue reaction with CO2 can be reflected by first-order reactions:
d α a d t = 1 α a k 0 , a e E a R T m
d α b d t = α a α b k 0 , b e E b R T m
The energy balance equation was derived taking into consideration the conditions of the heat transfer inside the TG furnace, in which the sample was spread thinly and uniformly in the crucible. The stream of the carrier gas flowed from the top of the crucible to the bottom, sweeping away evolved gases. The heat flux absorbed by the sample (raw fuel), char, ash and the crucible was assumed to be equal to the difference between the heat flux supplied to the system, the heat flux accompanying the devolatilization reaction and the heat flux accompanying the reaction of the carbon residue with CO2:
1 x a s h 1 x c h 1 α m 0 C P s + x c h m 0 C P c h + x a s h m 0 C P a s h + m c C P c d T m d t = h A c T r T m m 0 Δ H d e v x v o l d α a d t m 0 Δ H g a s x c h d α b d t
The change in the sample temperature during the gasification process was obtained taking into account Equations (4)–(6) and is described as
d T m d t = h A c T r T m m 0 Δ H d e v x v o l 1 α a k 0 , a e E a R T m m 0 Δ H g a s x c h α a α b k 0 , b e E b R T m 1 x a s h 1 x c h 1 α m 0 C P s + x c h m 0 C P c h + x a s h m 0 C P a s h + m c C P c
After considering the following boundary conditions, Equation (7) was computed numerically using Mathcad to determine the sample temperature:
T m = T 0   and   α = 0   at   t = 0
The overall heat transfer coefficient h, included in Equation (7), describes the amount of heat transferred to the sample and is affected by, e.g., the sample temperature (Tm) and temperature-dependent parameters of the gas, such as λg, vg or CPg. To determine its value, the energy balance equation for the reference crucible was proposed:
d T m d t = A c h T r T m m c C P c
where the surface area Ac was assumed to be time-invariant.
Equation (9) was solved numerically with the Mathcad software, taking into account the same boundary conditions as previously used (Equation (8)).
The heat supplied to the sample was assumed to be transferred by convection and radiation:
h = h c + h r
Equation (11) presents the formula applied to determine the heat transferred by convection (hc), which was derived for the flow around the cylinder with the ratio of the diameter to height of 1:2 [32]:
h c = N u   λ g d c = λ g 1.2564 + 0.6592 R e 2 / 5 P r 1 / 3 d c
The heat transferred by radiation (hr) was calculated according to
h r = ε σ T r + T m T r 2 + T m 2
The values of the specific heat of the sample, char, ash and crucible, used in Equations (6)–(9), were dependent on the temperature, according to formulas [33,34,35,36]:
C P c = 1.30684 · 10 6 T m 3 0.00363 T m 2 + 3.52606 T m + 20.29987
C P c h = 218 + 3.807 T m 0.001758 T m 2
C P a s h = 912 + 2.235 T m 0.001464 T m 2
C P s = x c h C P c h + ( x v o l 0.1 ) 728 + 3.391 T m + 0.1 2273 + 2.554 T m
The properties of CO2 constituting the furnace atmosphere, such as the thermal conductivity (λg), the density (ρg), the specific heat (CPg) or the kinematic viscosity (νg), required to calculate the number of Nusselt (Nu), Prandtl (Pr) or Reynolds (Re), were calculated based on the mini-REFPROP [37] and CoolProp [38] databases. The remaining parameters used for the model are summarized in Table 2.

3.2. Kinetic Regime

To enable a direct scale-up of kinetic parameters determined at the laboratory to the industrial scale, the measurements should be carried out in conditions where the rate of reaction is controlled by chemical reactions, in the so-called regime I. To meet these requirements, the Biot (Bi) and external pyrolysis (Py′) numbers need to be analyzed.
The Bi provides the ratio between heat convection at the surface of the layer and heat conduction within the layer. For a thin layer filling a cylindrical crucible, it takes the form [41]
B i = h d c l b 2 λ s 2 d c + l b
where λ s (Wm−1K−1) is the thermal conductivity of the sample, assumed to be equal to [42]
λ s = 1.071 0.00884 T m + 3.2939 · 10 5 T m 2 5.8083 · 10 8 T m 3 + 4.7875 · 10 11 T m 4 1.4143 · 10 14 T m 5
The Py′ is the ratio between heat convection and the reaction rate of a particle, and for a layer, it is given by [41]
P y = 2 h c 2 d c + l b λ s ρ s C p s d c l b
A thermally thin regime is ensured when the Bi number is much smaller than one. In such conditions, the heat conduction within the layer is a lot faster than the heat convection away from its surface; thus, the sample temperature can be assumed to be essentially uniform. Low Py′ numbers correspond to control by external heat transfer, whilst a number larger than unity represents conditions where heat convection to the particle is a lot faster than the chemical reactions taking place. To ensure that the process is controlled purely by kinetics, both requirements need to be met: Bi << 1 and Py′ >> 1 [43]. Kinetic parameters determined in such conditions are often called intrinsic or true, in order to distinguish them from apparent kinetics determined under other regimes.

3.3. Reaction Kinetics

The kinetic analysis was carried out in two variants, model-based and experimental-based. The model-based variant assumed that the true temperature is equal to the temperature calculated using the model (Ts = Tm), while the experimental variant assumed that the true temperature follows the temperature measured under the crucible (Ts = Tc). Kinetic results obtained for both variants were compared to illustrate to what extent the measurement uncertainty related to the determination of the true temperature affects the kinetic parameters of gasification.
As stated in Section 3.1, the gasification process was divided into two stages, i.e., devolatilization, and the char–CO2 reaction. Each of these steps can be reflected by a first-order reaction according to Equations (4) and (5). To determine the kinetic parameters describing each of the stages, such as the activation energy (Ea/b) and the pre-exponential factor (k0,a/b), a model fitting approach based on a single non-isothermal TG measurement was used. The arguments for the choice of the model fitting approach were, inter alia, the shape of the curves suggesting two single-step consecutive reactions, the non-variability of the kinetic parameters depending on the range of analyzed temperatures [44] and the experiences of other authors in applying this type of approach for analyzing thermal processes [45,46,47].
For the model fitting purpose, a single first-order reaction model (SFOR) [48] using the simplifying temperature integral function with the Doyle integral approximate [49] was employed.
l n l n 1 α = l n k 0 , a / b E a / b β R 1.0518 E a / b R T s 5.33
Plotting ln[−ln(1 − α)] vs. 1/Ts returns the activation energy and the pre-exponential factor from the slope and the intercept, respectively. The results derived at low temperatures concern devolatilization and were denoted with index a, while the high-temperature kinetics of the char–CO2 reaction were denoted with index b.

4. Results and Discussion

4.1. Progress and Reaction Rate

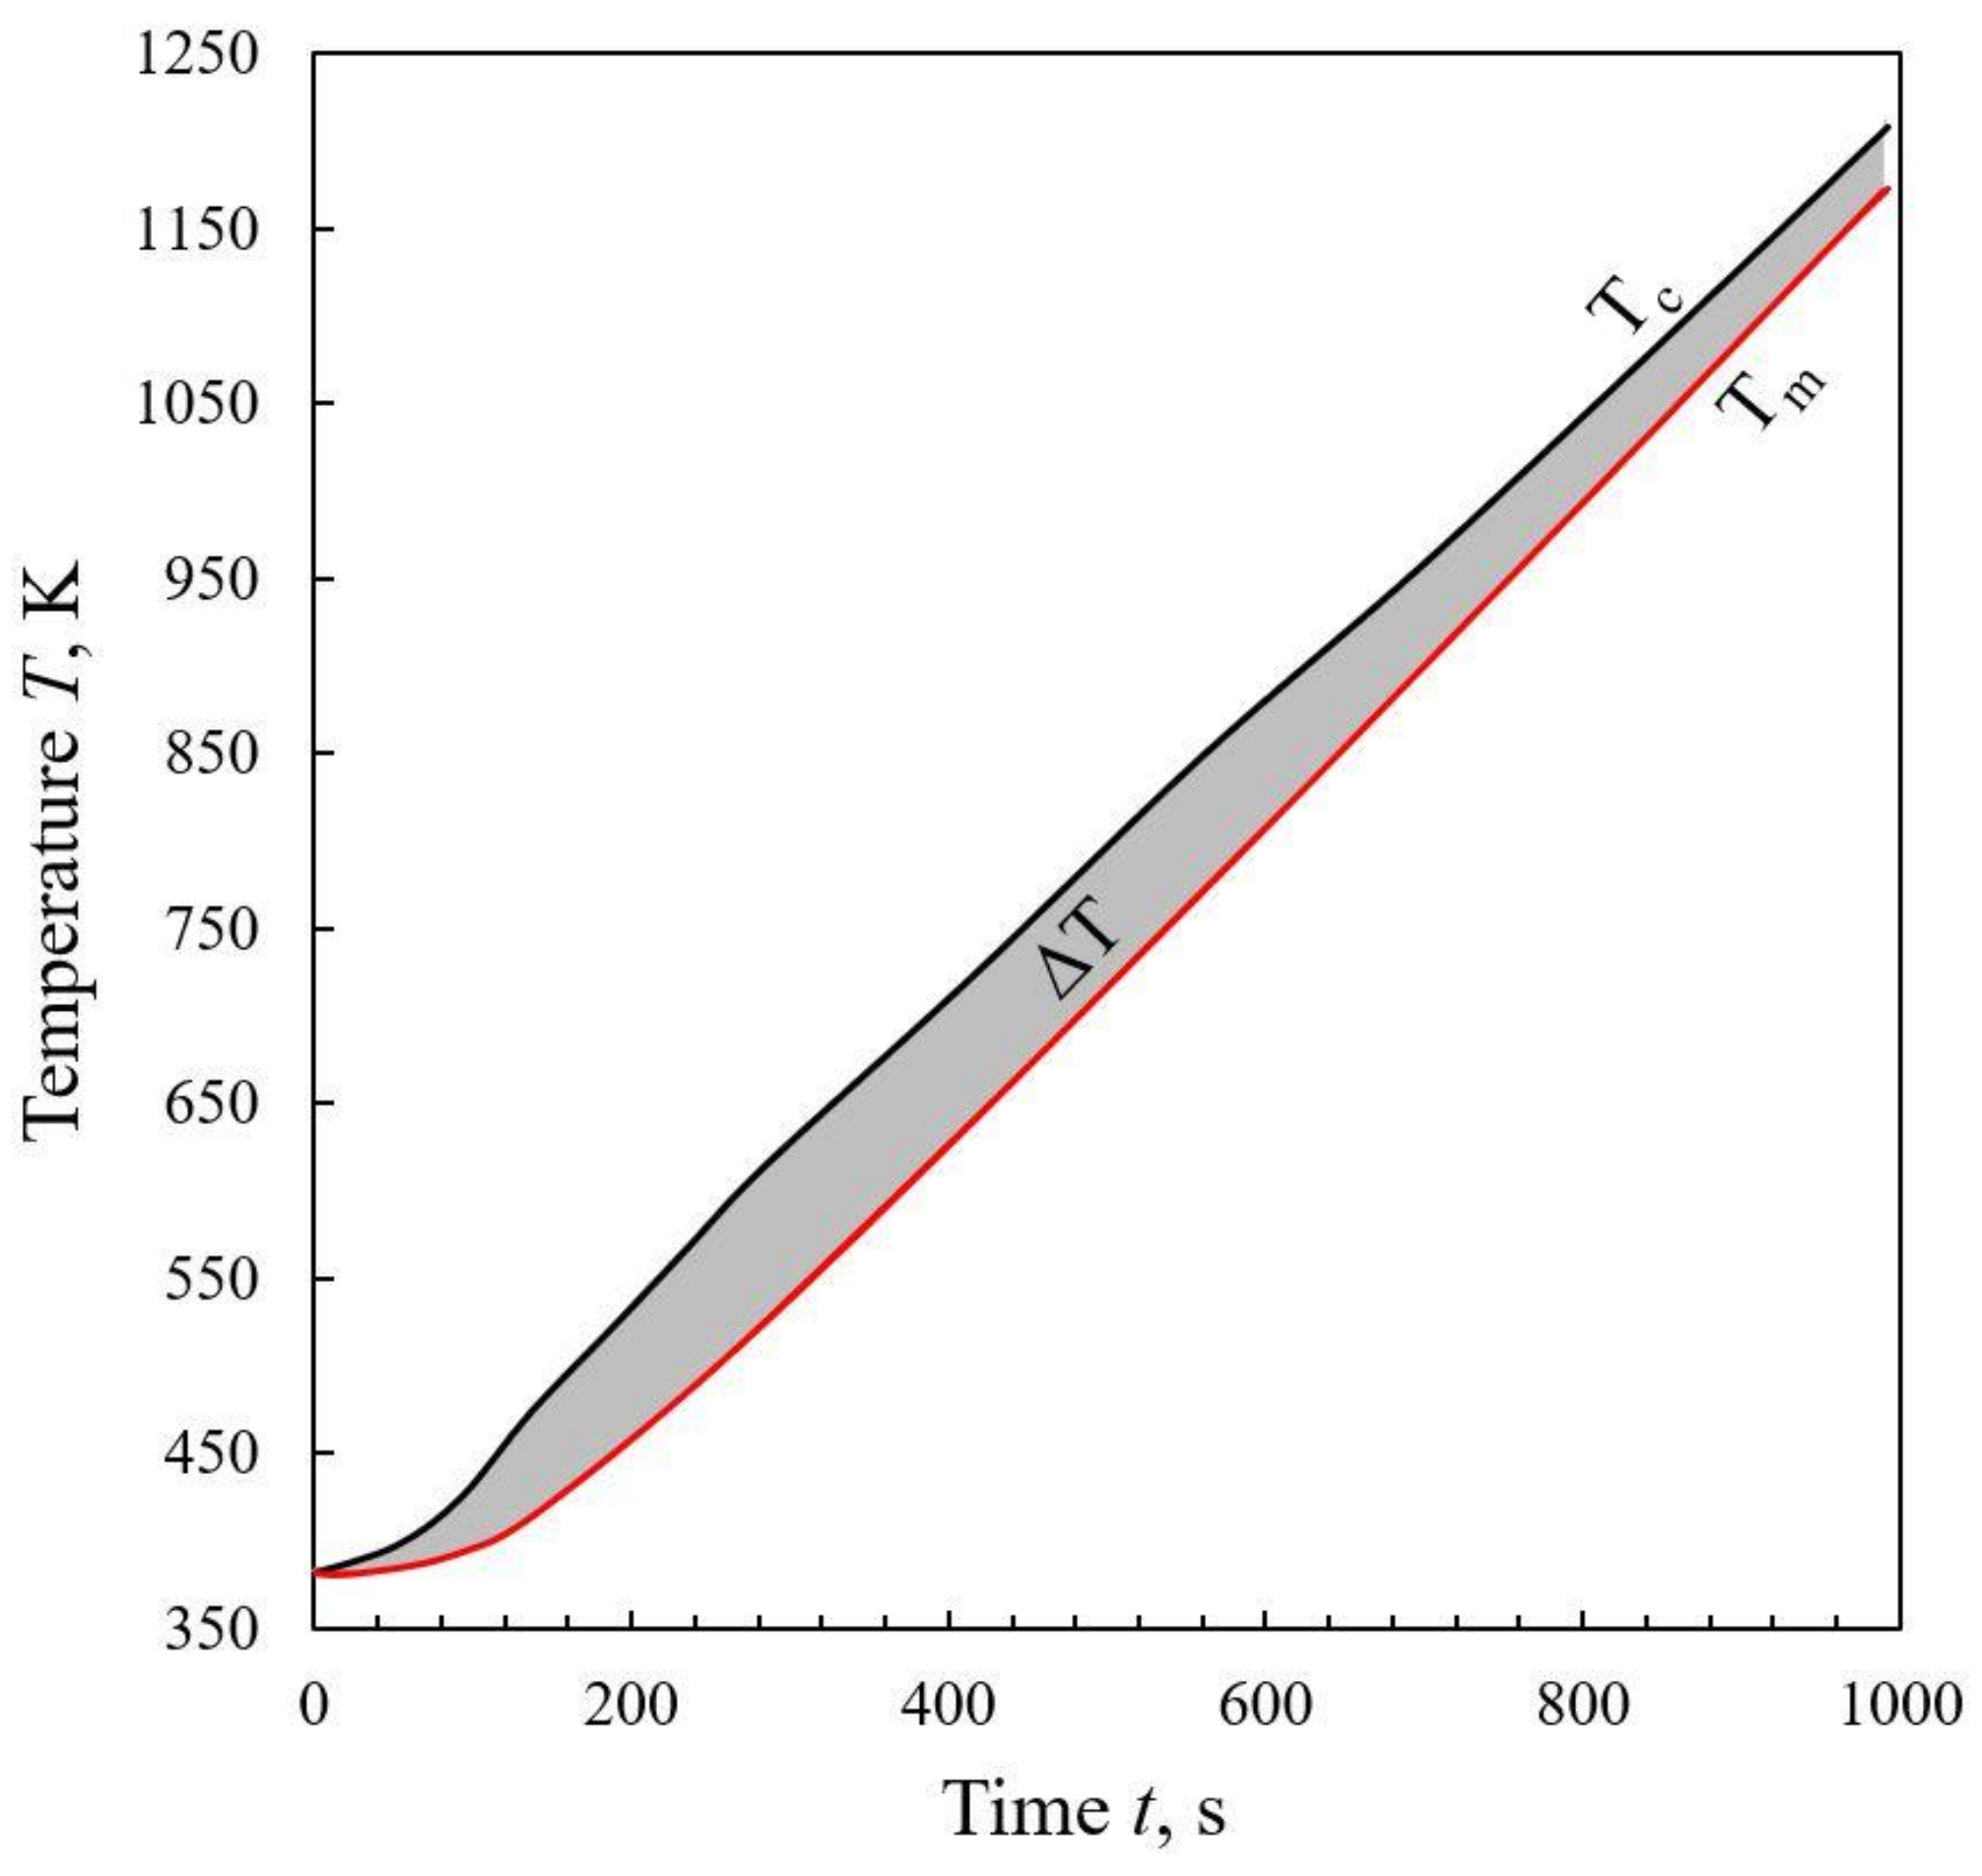
As mentioned in the introduction, measurement with TG is inextricably subject to measurement uncertainty related to the heat transfer limitation, which results from the inability to directly measure the temperature of the sample inside the TG reactor using a thermocouple. Installing a thermocouple in direct contact with the sample would result in errors due to, among others, conduction of heat along the thermocouple wire, convection in the boundary layer around the thermocouple and radiation between the wires and the external medium [50,51]. Hence, commercially available TG analyzers typically measure the temperature in the vicinity of the fuel-containing crucible (Tc), and this temperature is generally taken as the true sample temperature. Figure 2 shows a comparison of the measured temperature Tc with the calculated actual temperature Tm. The difference between both temperatures, marked as a gray area, is the so-called thermal lag, denoted as ΔT = Tc – Tm.
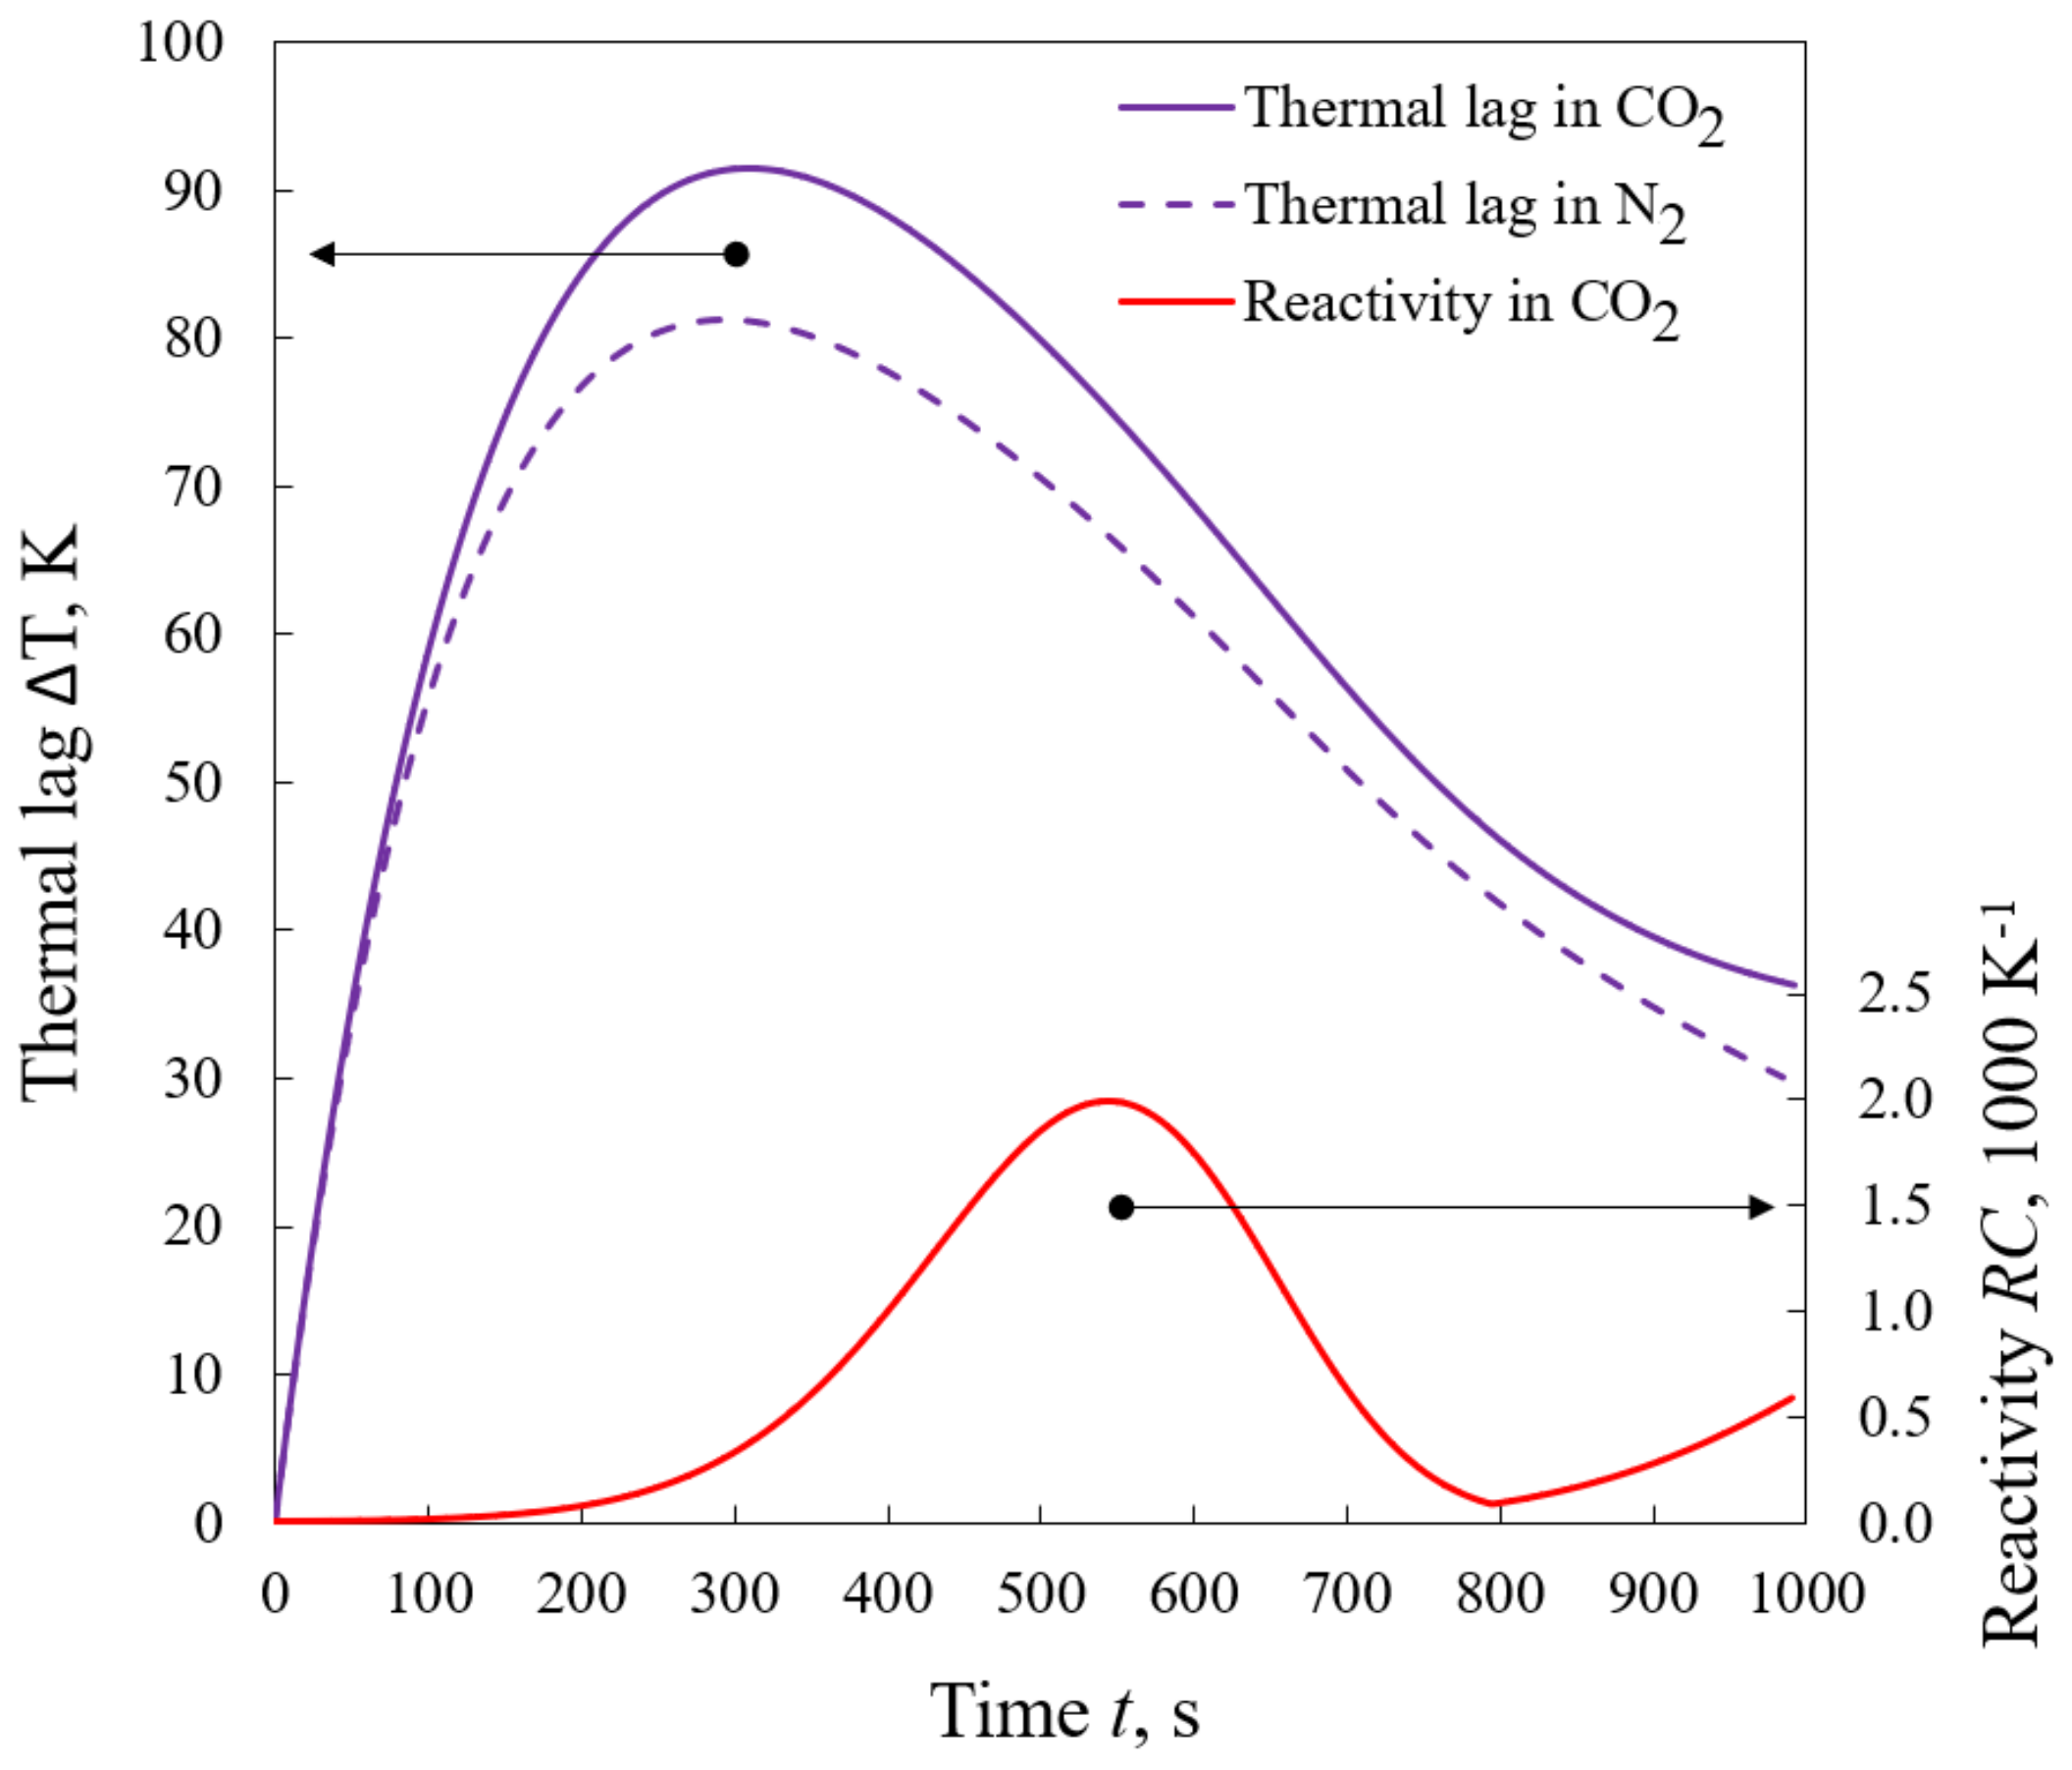
As it can be seen, the thermal lag phenomenon accompanies the gasification process practically in the entire range (ΔT is equal to zero only for the 0 s of the experiment). The analysis carried out for LT at HR50 indicates that in the considered measurement range, the average thermal lag was 64.0 K, while the maximum thermal lag even reached 91.4 K (309 s of the process). The nature of the changes in ΔT was complex, which is well illustrated by the continuous violet line (thermal lag in CO2) shown in Figure 3.
In the first stage (up to approximately 300 s), the thermal lag determined during the experiments in CO2 increased with time. After reaching the maximum, the ΔT values decreased until reaching 800 s of the experiment. Interestingly, the influence of the endothermic devolatilization on the increase in ΔT was almost invisible. This observation differs from the observations for the pyrolysis of cellulose in nitrogen presented in [15]. In the author’s opinion, the revealed differences are the result of both a lower proportion of volatile parts in lignite than in cellulose (46.7% vs. ca. 87–89% [15]) and a different heat capacity of the surrounding gas atmosphere, raw fuel, char and ash. After reaching 800 s, a third stage should be distinguished in which ΔT decreased slower than previously. This phenomenon was directly related to the beginning of the char–CO2 reaction. This observation is confirmed by the correlation between the thermal lag curve in CO2 and the fuel reactivity curve in CO2 (red line). As it can be seen from the figure, the reactivity of the fuel increases during the 800 s as a result of the reverse Boudouard reaction, in which an increase directly corresponds to the increase in the thermal lag of the temperature measurement. Moreover, the influence of this reaction on an increase in thermal lag is indirectly proved by the shape of the thermal lag curve determined in the nitrogen atmosphere (dashed violet line). In this atmosphere, the reverse Boudouard reaction does not take place, and in the range of times and temperatures in which it would occur, a systematic decrease in the thermal lag value (unlike for the CO2 atmosphere) is observed. Such a significant, compared to devolatilization, influence of the char–CO2 reaction on thermal lag is a direct consequence of the highly endothermic nature of this process, which absorbs about 15 times more heat than devolatilization (ΔHdev = 400 × 103 J·kg−1 vs. ΔHgas = 604 × 104 J·kg−1).
Interesting information is also provided by the comparison of the thermal lag curve in N2 and CO2. In addition to the already mentioned differences related to the char–CO2 reaction, the thermal lag values determined in both atmospheres for similar times also differ. As mentioned earlier, in the case of CO2, the average thermal lag was 64.0 K, and the maximum thermal lag was even 91.4 K, while for the N2 atmosphere, these values were, respectively, 57.6 K and 81.2 K. These differences are directly related to the occurrence of the char–CO2 reaction and the properties of both gases, such as the thermal conductivity (λg), the density (ρg), the specific heat (CPg) or the kinematic viscosity (νg). This observation explains why, in some papers [52,53], certain differences in the TG profiles recorded during heating of the same fuels in atmospheres of N2 and CO2 were recognized. Consideration of the differences in thermal lag indicates that at low temperatures, CO2 is an inert gas and does not significantly affect the mechanism of coal pyrolysis, which confirms the reports presented in [54,55]. However, it should be noted that the results obtained do not exclude that for some materials characterized by properties other than coals [56,57], CO2 may influence the reaction progress even at the early stages of devolatilization. In the light of the obtained data, it seems valuable to take into account the influence of thermal lag on the precision of the obtained results when assessing the influence of CO2 on the progress of the gasification reaction.
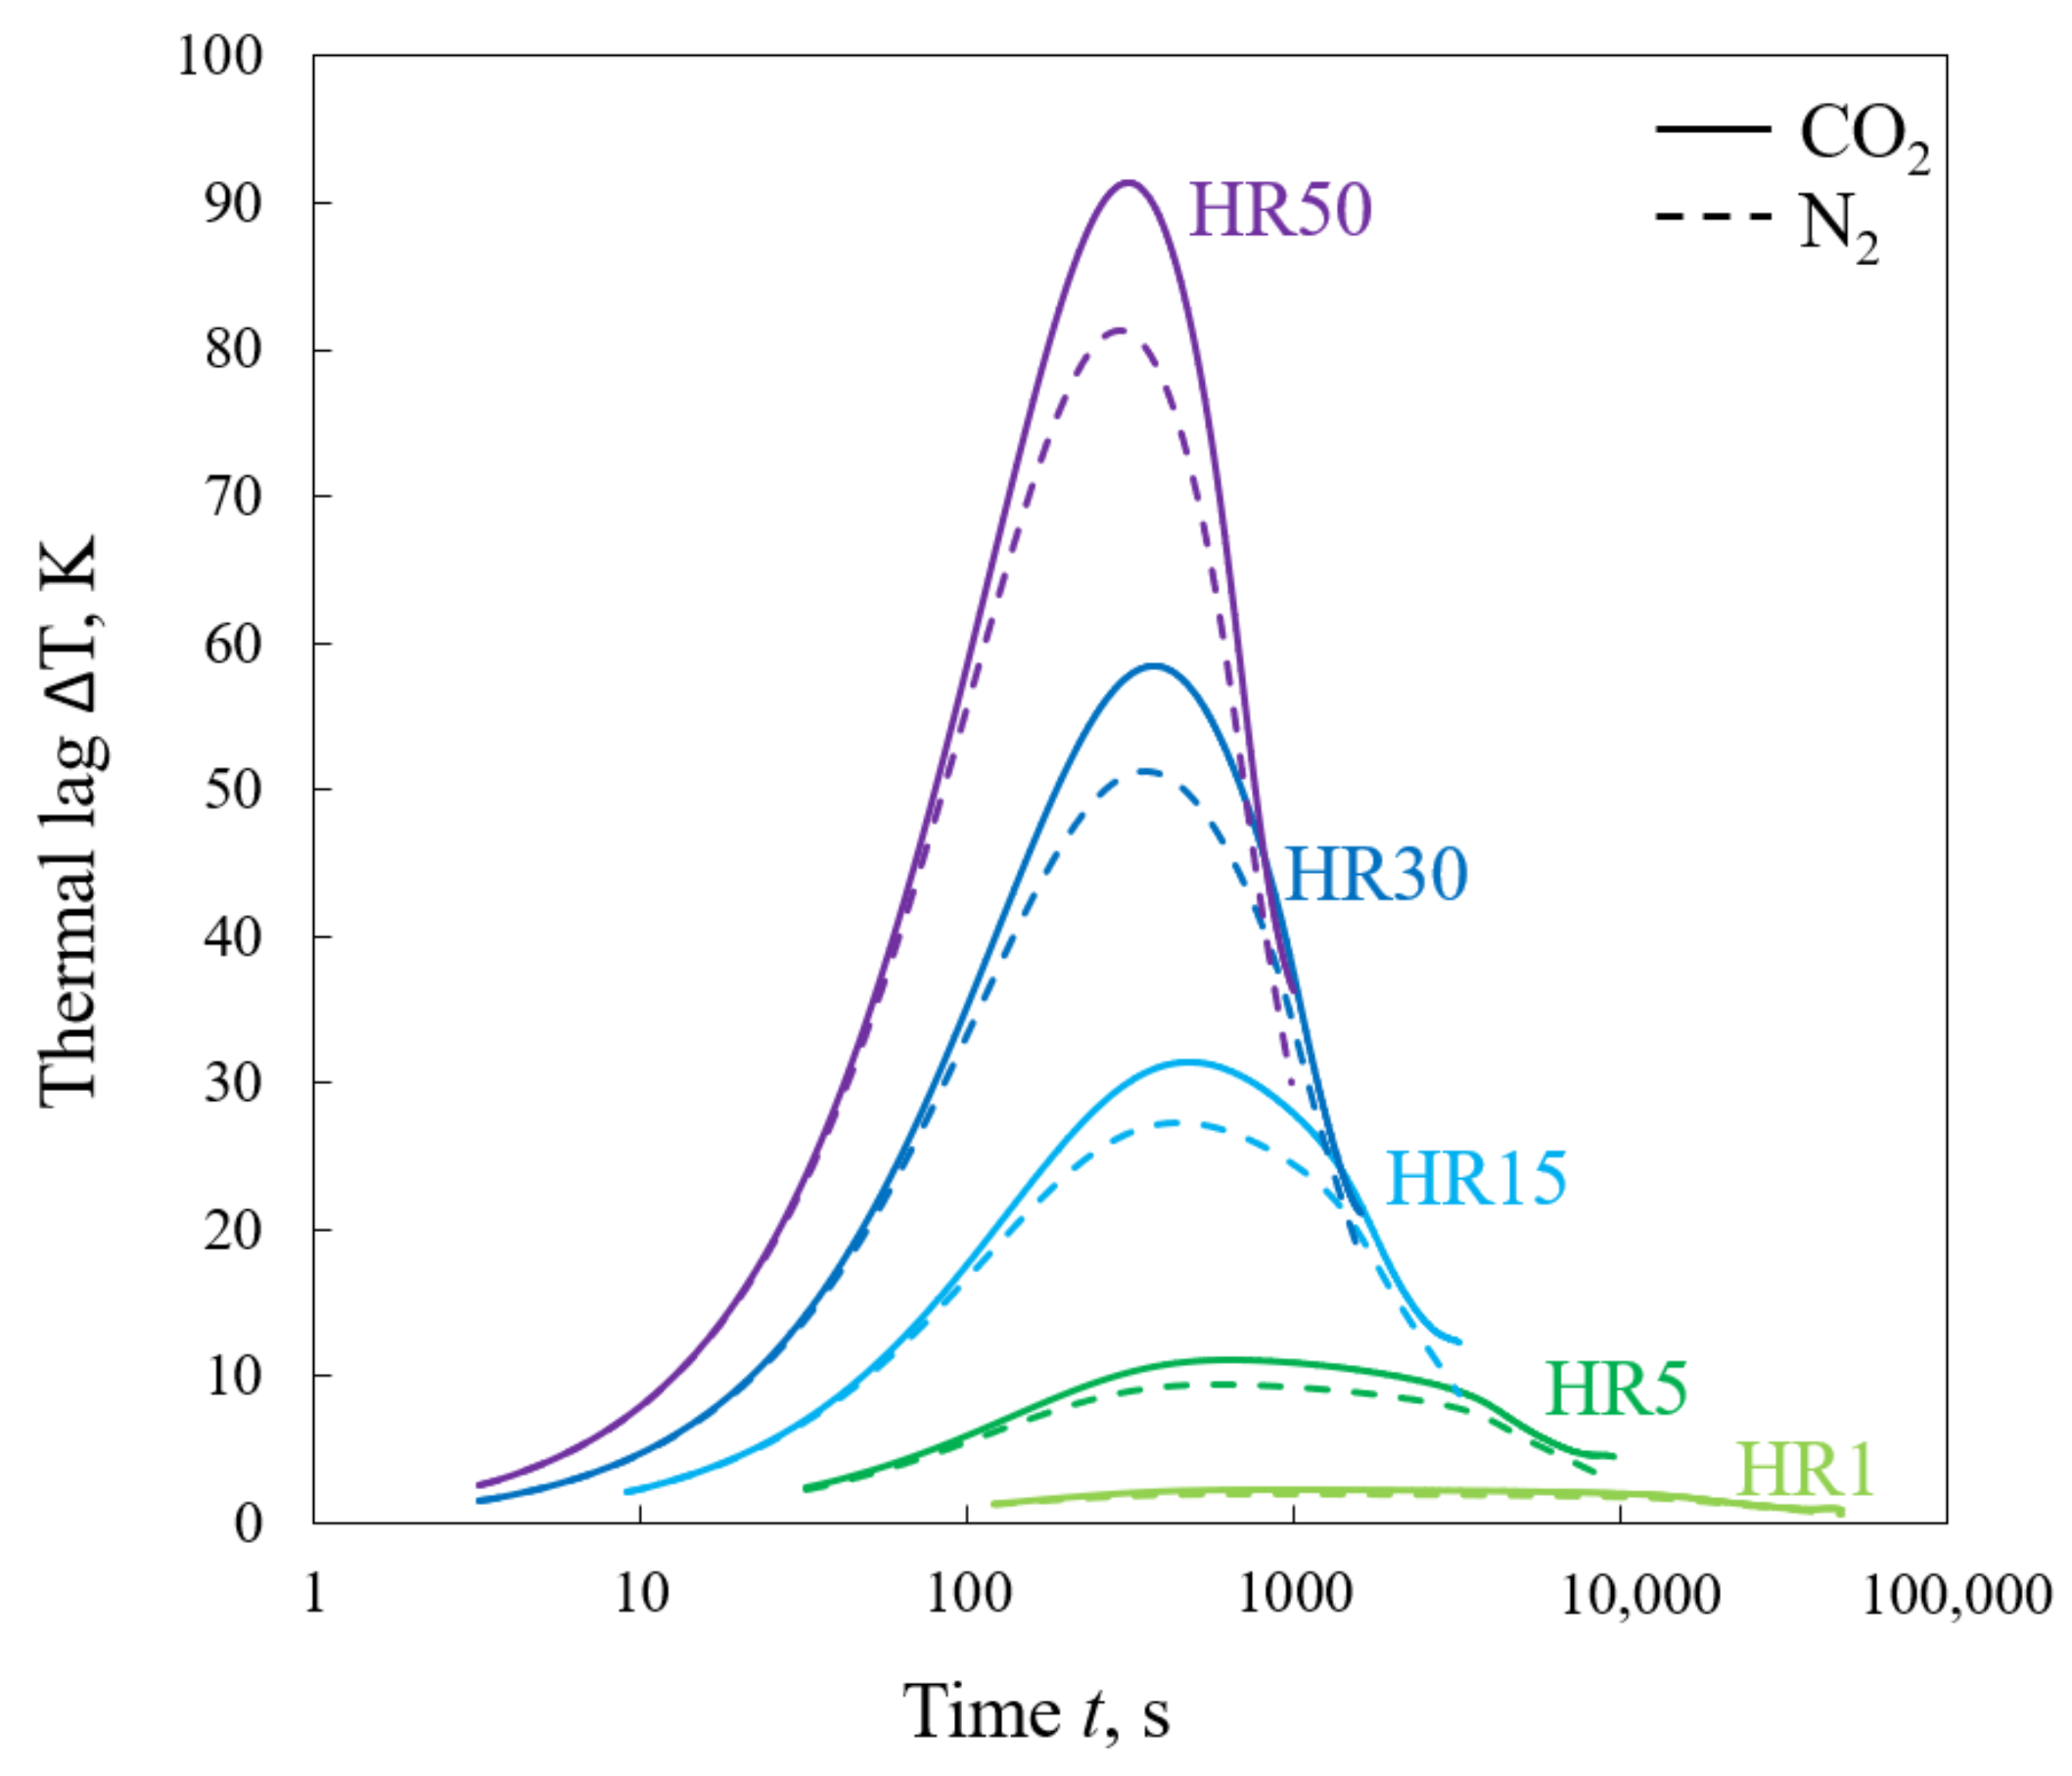
Figure 4 shows the influence of the heating rate on thermal lag. To better visualize the behavior of a set of curves, on the x-axis, a logarithmic scale is proposed (which explains the differences in shape between the HR50 curves presented in Figure 3 and Figure 4).
The conducted analyses indicate that the uncertainty of the temperature measurement in TG increased with the heating rate. In the case of gasification of LT with HR1, the average value of ΔT was 1.46 K; for HR5, it was 7.17 K; for HR15, it was 20.8 K; for HR40, it was 44.0 K; and for HR50, it was 64.0 K. Regardless of the heating rate, ΔT determined in the nitrogen atmosphere was always lower by approximately 11–13 percentage points than that determined for the CO2 atmosphere.
The results presented thus far were obtained for one type of fuel, i.e., LT. Figure 5 shows the influence of the fuel type on the thermal lag. The results are presented for the selected heating rate, namely, HR5.
The value of the thermal lag in the temperature range up to ca. 800 K is quite similar for all analyzed fuels and ranges, on average, from 8.81 to 9.30 K. As expected, a slightly higher value of ΔT was obtained in this range for fuels with a high content of volatiles (LB: 9.36 K, and LT: 9.07 K) than for those with a low content (AI: 8.81 K), which is a consequence of the endothermic nature of the devolatilization. The influence of the fuel type on the value of the thermal lag becomes more visible at high temperatures (above 800 K), i.e., in the range where the char–CO2 reaction is observed. In this respect, fuels with a higher content of fixed carbon were characterized by higher thermal lag values, e.g., for the AI sample, containing 90.3% fixed carbon, the thermal lag was 5.72 K, i.e., 14–20 percentage points more than the thermal lag determined for the other fuels (containing from 33.8% to 55.6% of fixed carbon).
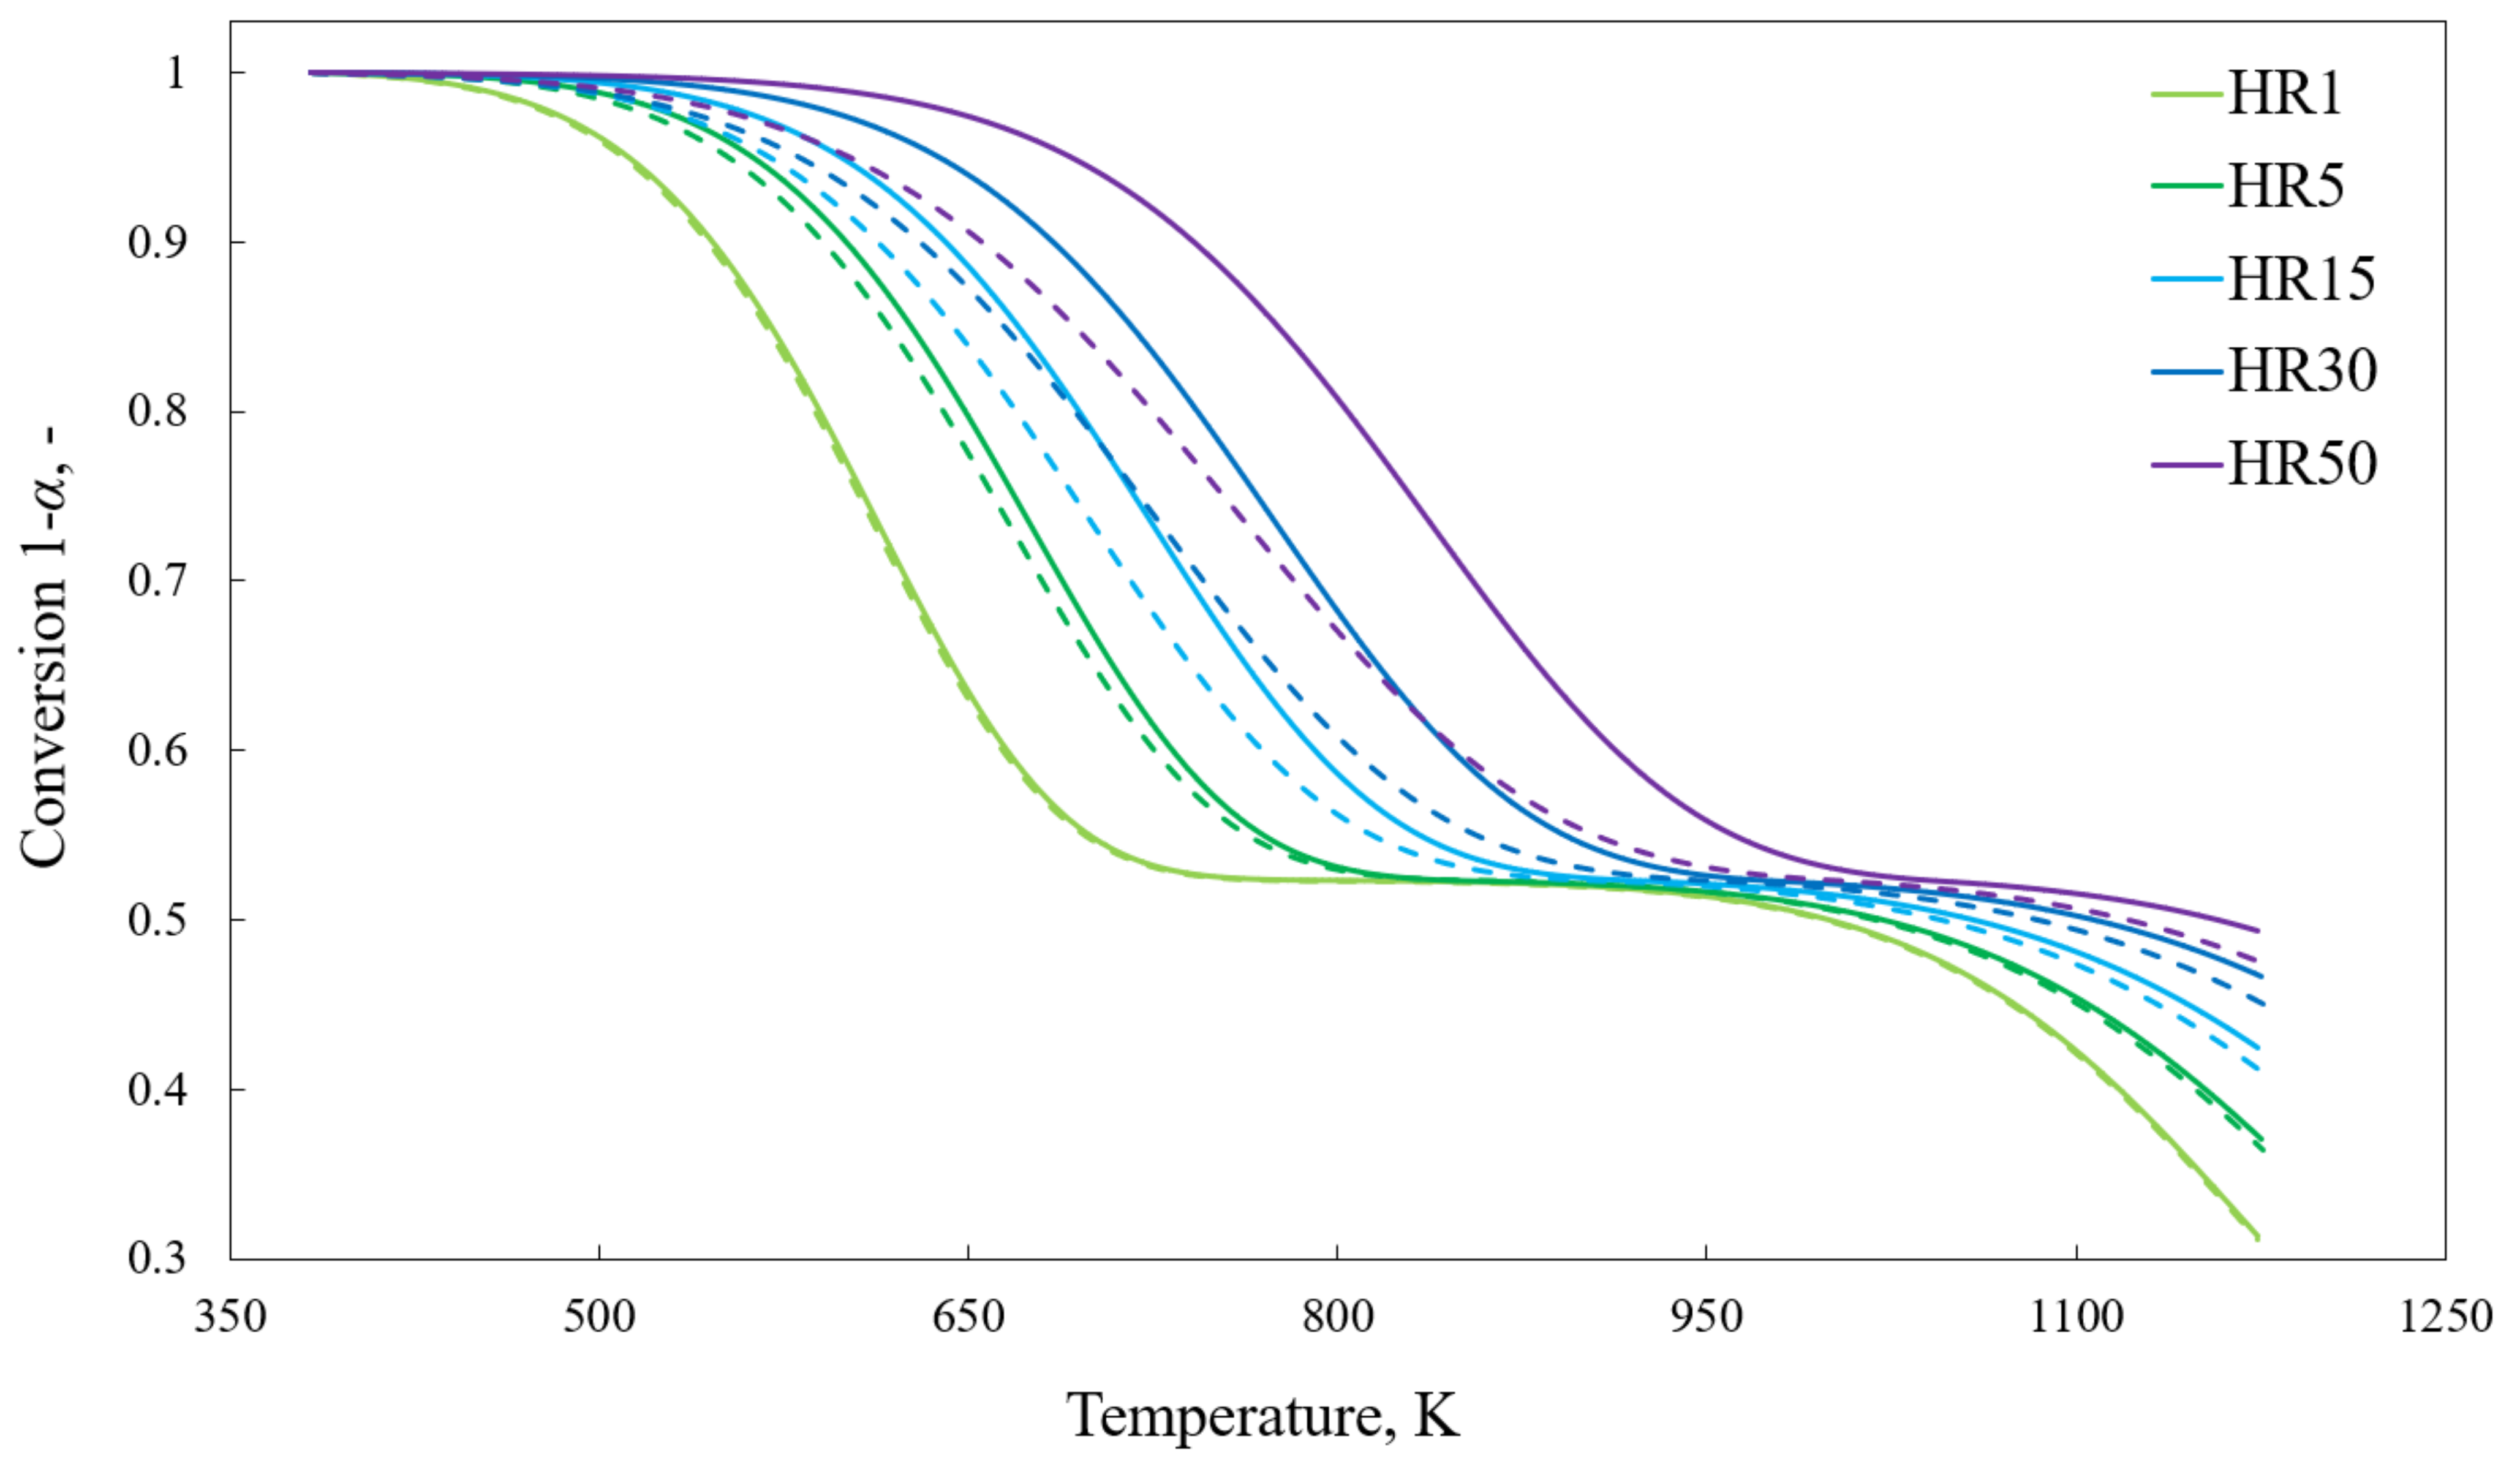
According to Equation (7), thermal lag influences the shape of the conversion curve. Figure 6 compares the conversion curves obtained for the LT sample, gasified with HR1–50. Following the adopted nomenclature, in this and the following figures, the curves determined with the assumption that the temperature Tc corresponds to the true fuel temperature are marked with a solid line, and the curves established for the assumption that Tm corresponds to the true test temperature are marked with a dashed line.
As it can be seen, for HR1, i.e., in conditions where thermal lag played an almost insignificant role (average ΔT equal to 1.46 K), both fuel conversion curves (light green lines) have an almost identical shape. Nevertheless, as the heating rate increased, the differences in the shape of the conversion curves increased. In the case of HR5, the curve based on the assumption that the actual test temperature was equal to Tc indicated that, e.g., 30% of the fuel conversion occurred at 680.0 K, and 60% of the fuel conversion occurred at 1149.1 K. Assuming that the true sample temperature was equal to Tm, the same conversion rates were achieved for the temperatures of 688.3 K and 1153.7 K, respectively. For HR15, 30% of fuel conversion was recorded at 717.0 K and 740.8 K, and for HR30, this was at 745.7 K and 782.3 K, while for HR50, this was at 792.5 K and 855.0 K.
As a consequence of the different shapes of the curves, there were also differences in the total amount of converted fuel. The experimental results indicate that with the increase in the heating rate, the amount of reacted fuel was 68.5%, 62.7%, 57.6%, 53.2% and 50.6%, respectively. The model results obtained for the assumption of measurements carried out in the conditions of no heat transfer limitations indicate that the amount of converted fuel should be 68.7%, 63.3%, 58.8%, 54.8% and 52.5%. As it can be seen, the discrepancies increase with the increase in the heating rate, and for HR50, they reach up to 1.8%.
The obtained results indicate that when analyzing the LT gasification in CO2, the use of heating rates higher than about a few degrees per minute results in significant discrepancies in the shape of the fuel conversion curves. Hence, it is recommended to use the lowest possible heating rates or to recalculate the results obtained at a high HR with a model that allows the determination of the true sample temperature.
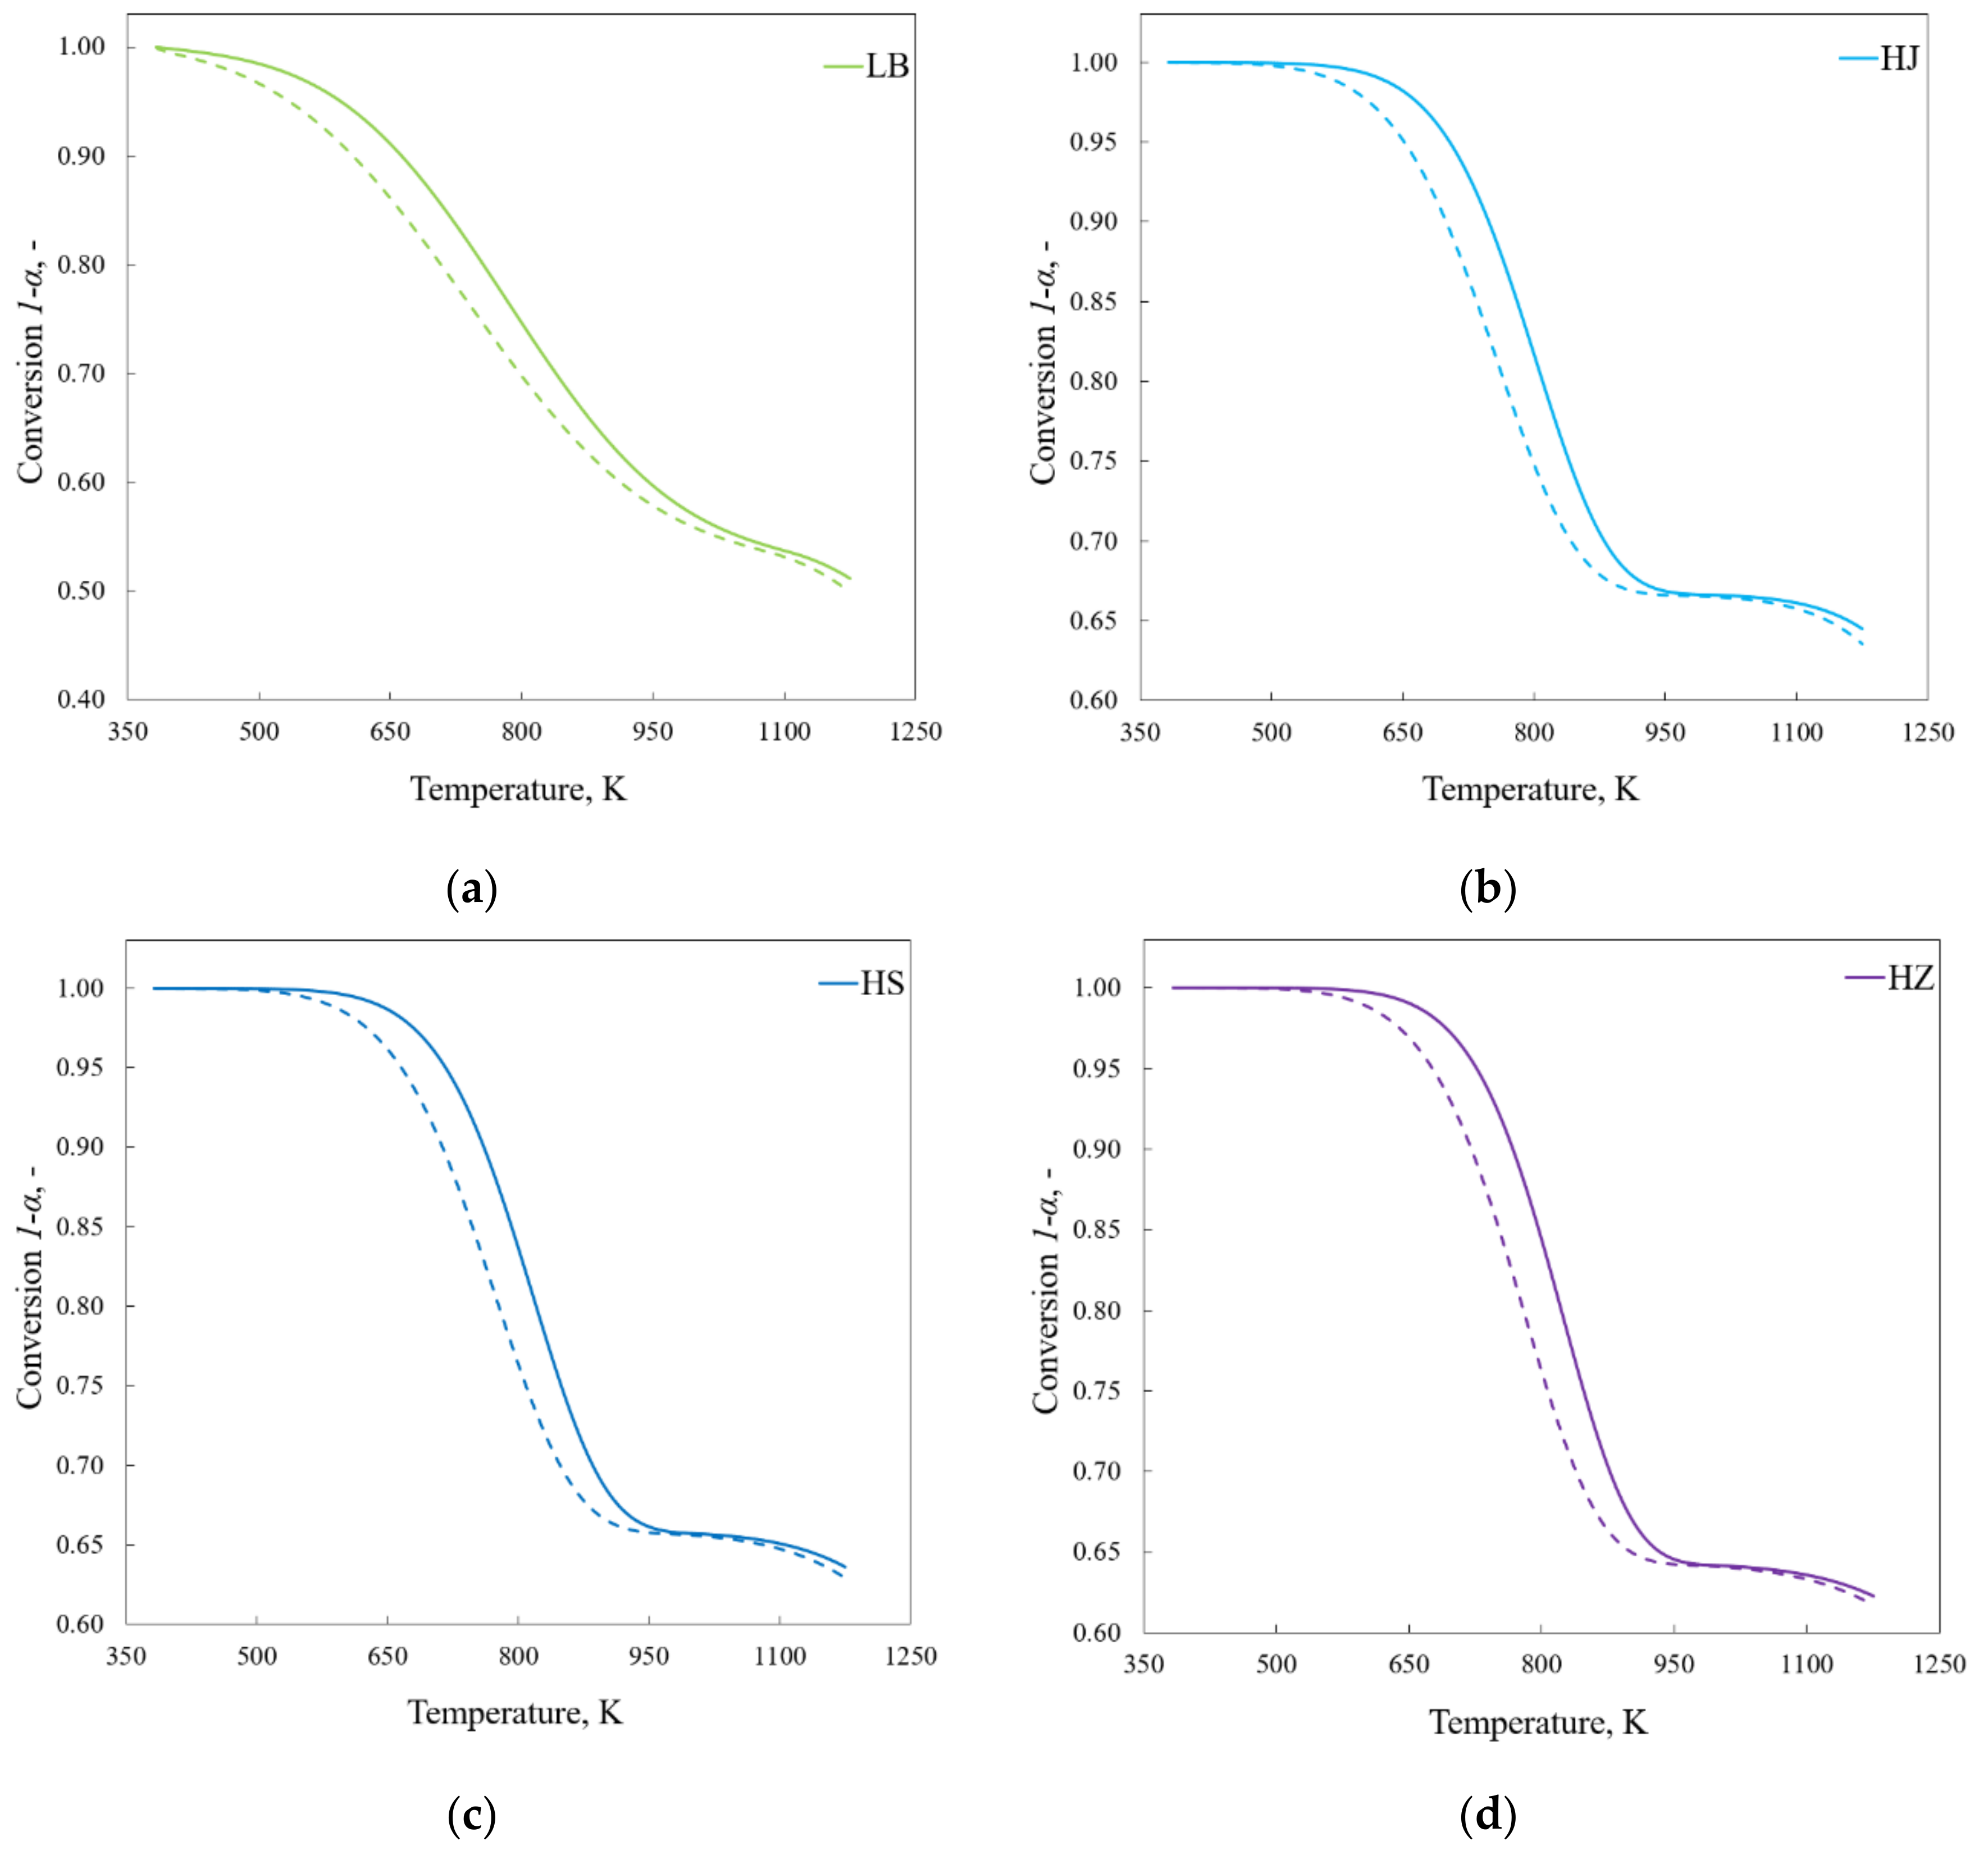
To illustrate how the fuel properties affect the shape of the conversion curve, the results obtained for LT were compared with those obtained for other fuels. Figure 7a–e show the profiles obtained during the research with HR30. The profiles are presented on separate graphs to increase the readability of the presented data. The profile for LT is not shown as it was previously presented in Figure 6.
As evidenced by the obtained results, for each of the analyzed fuels, a significant effect of thermal lag on the shape of the conversion curve was found. Comparing the discrepancies between the temperature characterizing the 30% degree of fuel conversion determined experimentally (solid line) and with the model (dashed line), it should be noted that they ranged from 30.5 (AI) to 45.8 K (LT). The discrepancies in the total amount of fuel reacted significantly differed, depending on the type of fuel analyzed, and ranged from ca. 1% to even 5.3% (in the case of AI).
The results obtained for LB, HJ, HS, HZ and AI confirm the observation based on LT that carrying out the gasification process with an HR equal to several degrees per minute results in a thermal lag of several dozen degrees, which may significantly hinder the interpretation of the analyzed phenomena. As in the case of LT, running the process with a heating rate equal to a few degrees per minute guaranteed low thermal lag values, equal to 5.39–8.37 K (at the 30% degree of fuel conversion).
The conversion curves determined employing TG (presented in Figure 6 and Figure 7) are commonly used to determine the reactivity of the fuel. According to the definition, reactivity is considered as the rate of mass loss over time or temperature [58,59,60]. Figure 8 shows the reactivity curves obtained for LT at HR1–50. As in the case of the previous figures, the experimental results are marked with a solid line, and the model results are marked with a dashed line.
The obtained curves show two characteristic peaks: the first occurring at lower temperatures, illustrating the susceptibility of a sample to undergo devolatilization, and the second occurring at higher temperatures, showing the susceptibility of the remaining char to react with CO2. As it can be seen, the second peak is not shown in full because the measurement was stopped as the temperature increased over 1173 K and the process approached the transitional regime, in which the rate of reaction was affected by diffusion phenomena. Work in this area was undesirable from the point of view of the possibility of further extrapolation of the obtained results (more information is presented in Section 3.2).
It should be noted that the discrepancy between the experimental and model reactivity curves can be significant, especially for high heating rates. The comparison of the temperature at which the maximum reactivity was recorded during devolatilization shows that, for example, for HR50, the discrepancies may be as high as 75.2 K (TRmax (model) = 761.1 K vs. TRmax (experiment) = 836.3 K). The difference between the TRmax parameters determined experimentally for HR1 and HR50, denoted as ΔTRmax, was 227.3 K, and the same value determined by the model was 147.1 K. On this basis, it should be concluded that the discrepancies between TRmax determined at different heating rates are, to some extent, affected by the finite heat transfer rate. However, even after taking into account thermal lag, the TRmax parameter recorded for different heating rates differs significantly, meaning it cannot be treated as universal, and when using it, it should be specified under what measurement conditions it was determined.
The analysis of the peak responsible for the fuel susceptibility to the reaction of char with CO2 leads to an interesting conclusion. Depending on the heating rate, this reaction starts at the following temperatures: 800.5 K (HR1), 859.4 K (HR5), 910.7 K (HR15), 949.8 K (HR30) and 997.0 K (HR50). It is generally assumed in the literature that the temperature range of the reverse Boudouard reaction starts at 953 [61]–973 K [62]. In the case of HR1–15, the obtained values are lower than those allowed by the literature sources [61,62], which does not mean that they are incorrect. The possibility of the reaction between char and CO2 at lower temperatures was confirmed by [63], in which the presented equilibrium calculations indicate that, theoretically, the Boudouard reaction can start at temperatures as high as approximately 673 K. Moreover, it was experimentally proved in [64] that under isothermal conditions, the Boudouard reaction can be observed at temperatures as high as 773 K.
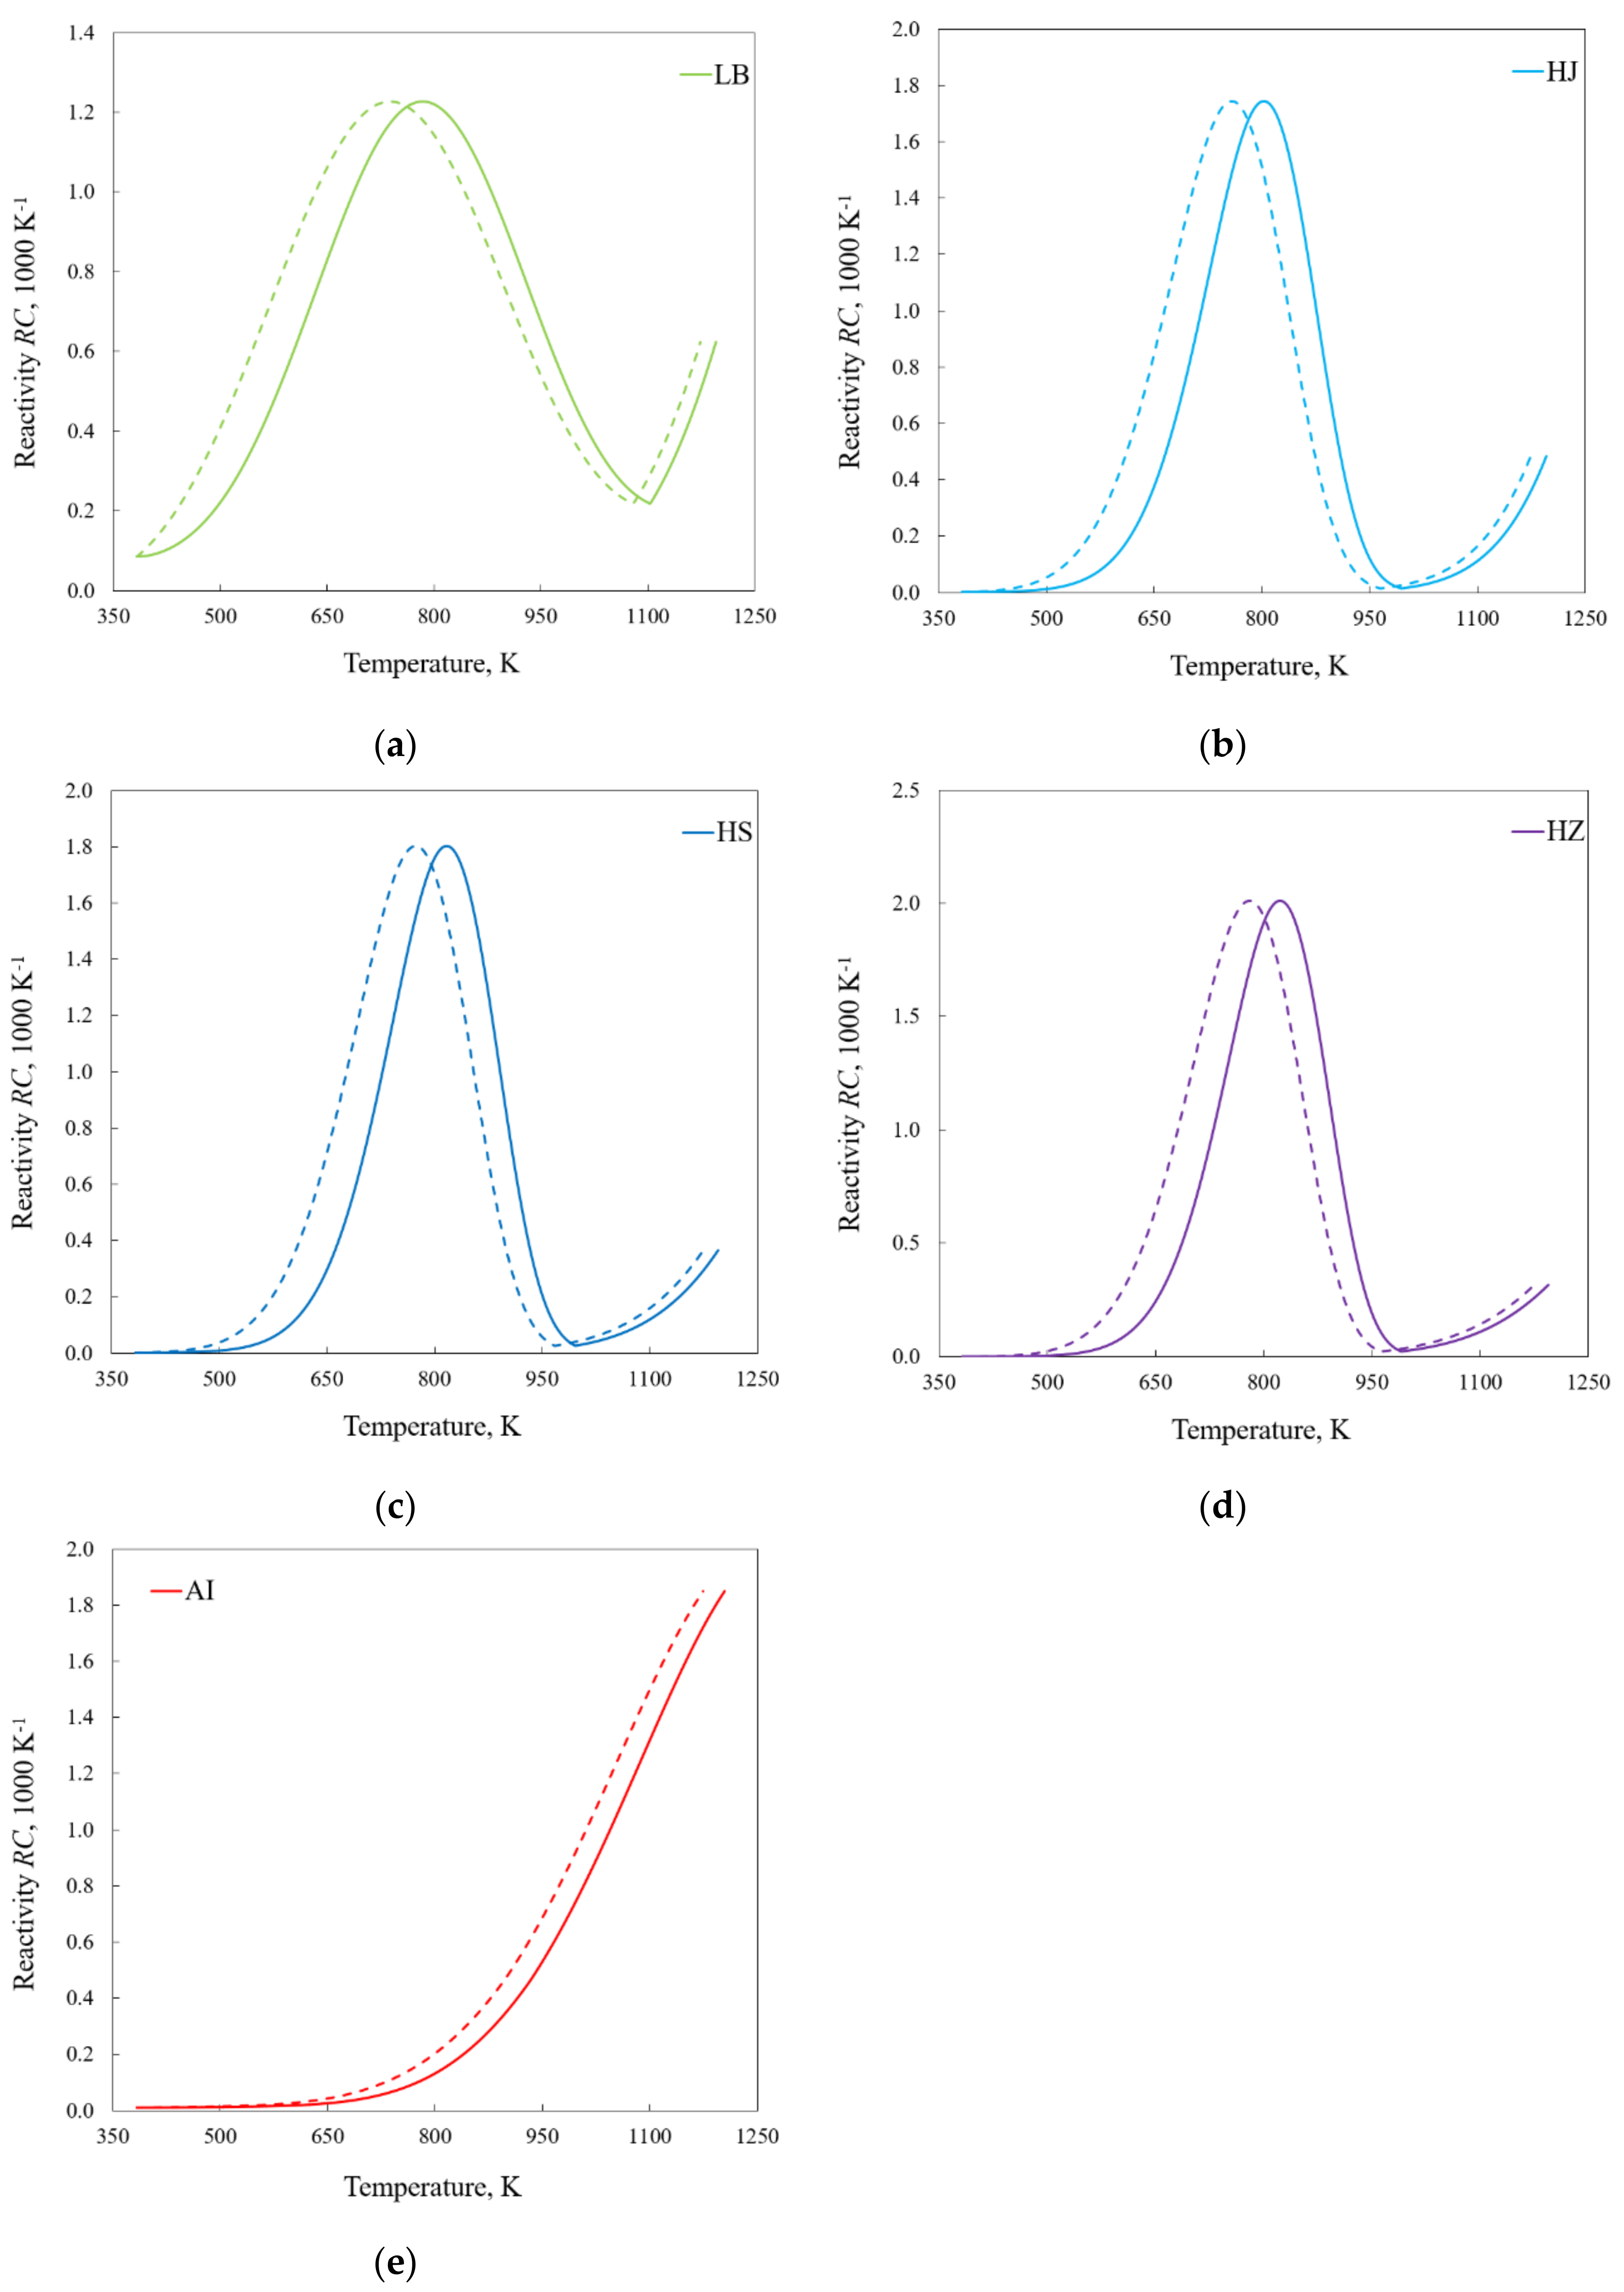
Figure 9 shows the experimental and model curves of reactivity of the different fuels, determined at HR30.
The obtained results indicate that the initial temperature of the char–CO2 reaction for LB was 1080.0 K; for HJ, it was 960.9 K; for HS, it was 964.4 K; for HZ, it was 966.2 K; and for AI, it was below 923 K. The discrepancies in the results obtained for the different fuels indicate that the properties and origins of the fuels influence the progress of the reverse Boudouard reaction. However, no simple relationship between the basic parameters characterizing the fuels, such as the fixed carbon content or elemental carbon content, with the parameters characterizing the reverse Boudouard reaction has been demonstrated. In the author’s opinion, the progress of this reaction may be influenced by other physicochemical parameters of the fuel, such as the distribution and shape of pores, the presence of mineral matter or the presence of surface functional groups [65].

4.2. Kinetics

To further investigate the influence of thermal lag on the coal gasification process, a kinetic analysis was performed. As mentioned in Section 3.2, to scale up the kinetic results to industrial conditions, laboratory experiments should be carried out under the conditions of the kinetic regime. The Bi number and the Py′ number, determined according to Equations (17) and (19), ranged from 3.19∙10−4 to 1.02∙10−3 and from 1.23 to 9.19. As the Bi number was much lower than unity, and the Py′ number was higher than 1, it was found that the selected measurement parameters ensured that the gasification process was controlled by chemical reactions [22].
A kinetic study was carried out following the procedure presented in Section 3.3, separately analyzing the processes of devolatilization and the reaction between char and CO2. The obtained results are presented in Table 3 and Table 4. The results called “experimental” were calculated assuming that the true sample temperature was equal to Tc, and the so-called “model” results were calculated assuming that it was equal to Tm.
The performed kinetic analysis shows that the activation energy determined based on the experimental curves for the devolatilization of LT ranged from 41.86 to 53.30 kJ mol−1. The obtained values are similar to those presented in the literature for other lignites, e.g., for the Menzen sample (33.9–40.4 kJ mol−1 [66]). Moreover, it was noted that the activation energy value increased with the heating rate. There is no unanimity in the literature on the influence of the heating rate on the value of the activation energy. A similar tendency to that described above was noted, among others, in [67] and [68] (for coal Afsin Elbistan). The reverse observation was shown in [66,69,70], and an observation indicating a lack of a clear correlation between the activation energy and the heating rate was shown, e.g., in [71,72,73]. The author of this paper does not attempt to explain the essence of the relationship between the activation energy and the heating rate but would like to emphasize that after taking into account the thermal lag, the values of E for different heating rates came closer to each other and amounted to 36.46–41.42 kJ mol−1. Moreover, contrary to the trend observed for the experimental curves, the activation energies calculated based on the model curves decreased with the heating rate. The fairly slight discrepancies between the activation energy obtained for the different heating rates may indicate, unlike in the case of the analysis of experimental data, that after considering thermal lag, the mechanism of the observed reaction seems not to change over the studied range of heating rates. Moreover, the results prove that taking into account the limited heat transfer may be of key importance for the interpretation and understanding of the mechanism of the reactions under study.
The activation energy determined for the remaining fuels (at HR5) is similar to the data presented in the literature. In the case of lignite LB, this value is similar to, e.g., the Soma sample (36.4 kJ mol−1) [68], while E for hard coals was comparable to that determined for the bituminous coals of Azdavay and Karadon (65.0 and 74.2 kJ mol−1 [74]). As anthracite contained only 4.9% of volatile matter and its evolution process was difficult to identify unequivocally, it was not decided to determine the kinetic parameters characterizing it. A comparison of the model and experimental results for various pyrolyzed fuels with HR5 shows that at such a low heating rate, considering the measurement uncertainty related to the determination of the actual temperature of the sample results in a reduction in the activation energy by 1.40–2.62 kJ mol−1, i.e., 4–5 percentage points relative to the experimental value.
As indicated in [15], the comparison of only one kinetic parameter may lead to erroneous conclusions due to the existence of the so-called compensation effect [48], i.e., the interrelation between E and k0. To avoid misunderstandings, and to unequivocally define the impact of thermal lag on kinetic parameters, the Aα parameter was introduced. The parameter relates E and k0 according to the relation
A α = k 0 , a / b e E a / b R T α
This parameter was determined for the temperature corresponding to the stage at which conversion of an exact amount of fuel took place; thus, for example, the parameter determined at the conversion of 50% was denoted as Aα0.5. A comparison of the Aα values obtained for the devolatilization of LT with the different heating rates shows (Table 3) that not considering thermal lag when studying the kinetics of HR1 leads to an error of 0.4%. In the case of HR5, the error is 2.1%, and for HR15, it is 6.3%, while for HR30 and HR50, it is 14.4% and 19.8%, respectively. The comparison of Aα for various fuels, determined for HR5, shows that it is, to some extent, dependent on the type of fuel; however, the obtained discrepancies between Aα remain quite similar, i.e., from 1.7% for HZ to 2.4% for LB. In light of the above, it seems reasonable to recommend, when analyzing the coal devolatilization process, limiting the heating rate to a few degrees per minute.
The analysis of the kinetic data obtained for the LT char–CO2 reaction (at different HRs) indicates that the results obtained based on the experimental data ranged from 116.9 to 130.7 kJ⋅mol−1. The inclusion of the thermal lag model narrowed the scope of the obtained results to 112.2–126.4 kJ⋅mol−1, while no correlation between E and the heating rate was recognized. The differences between the Aα parameter determined for the char–CO2 reaction, based on the model and experimental curves, were smaller than in the case of the devolatilization process and amounted to a maximum of 2.7%. However, it should be remembered that in the case of devolatilization, the Aα parameter was determined for the conversion degree of 50%, and in the case of the char–CO2 reaction, it was determined for the conversion degree of 10%. If the parameter Aα0.5 was used in the case of the reverse Boudouard reaction, the obtained results indicate that the uncertainty in determining the kinetic parameters would be greater than in the case of devolatilization. In the case of the reaction between char and CO2, the differences in activation energies for the different fuels turned out to be significant. In the case of HR5, the activation energy of the reverse Boudouard reaction determined based on the model was about 61.58 kJ⋅mol−1 for AI, 117.4–117.8 kJ⋅mol−1 for HZ and LT, 124.9 kJ⋅mol−1 for HS, 135.6 kJ⋅mol−1 for LB and 184.2 kJ⋅mol−1 for HJ. The obtained values are similar to those presented in the literature, that is, 109.5 [75]–220 kJ⋅mol−1 [76]. They indicate that the influence of the properties of the coal structure on the progress of the reverse Boudouard reaction is significant; however, they do not confirm the statement contained in [77] that the activation energy for the char–CO2 reaction generally decreases proportionally to the coal rank. The attempt to correlate the basic physicochemical parameters of the fuel with an activation energy of the reverse Boudouard reaction did not bring satisfactory results, which indicates that the progress of this reaction will depend on other parameters, e.g., the pore distribution, the content of mineral matter or the presence of individual functional groups on the surface.
The comparison of the obtained kinetic parameters with the content of selected elements in the mineral matter leads to an interesting conclusion. The composition of the mineral matter of the investigated materials is cited from [78] and presented in Table 5.
There is a certain unanimity in the literature [79,80] that potassium (K) is an element having a positive effect on the gasification rate. The results obtained for lignites show that in the case of LT, containing about four times more K2O than LB, a higher rate of the char–CO2 reaction was observed (i.e., lower kinetic parameters). No such dependence could be observed in the case of hard coals. Nevertheless, concerning the low degree of fuel conversion, it can be assumed that potassium was not concentrated enough to enhance the catalytic effect [80,81].
Noteworthy is the effect of calcium (Ca) on the rate of the char–CO2 reaction. The share of CaO in the investigated hard coals was equal to 6.97% (HZ), 5.31% (HS) and 4.81% (HJ). The CaO content seems to fit the trend in the activation energy required to initiate the reaction between surfaces of chars derived from hard coals and CO2 (HJ > HS > HZ). The observation confirms the remark made in [77] that the catalytic effect of CaO in low-rank coal causes an increase in the number of active sites and hence the reactivity. Nevertheless, it should be noted that the influence of CaO on the gasification process is debatable, and, for example, in the works on gasification of biomass, some authors [81,82,83] observed an inverse, i.e., inhibiting, effect of CaO on the gasification rate.
Other elements commonly considered to have a significant impact on the rate of gasification are, among others, aluminum (Al), silicon (Si) and phosphorus (P). It is believed that by inhibition of the catalysis from other elements, they decrease the rate of the process. The obtained results do not show any visible correlation between their content and the rate of the char–CO2 reaction. The author would like to emphasize that, despite the above-mentioned relationship between the content of ash components and the reactivity of the investigated samples, the impact of the mineral matter needs to be deeply analyzed and further clarified.

5. Conclusions

The impact of the heat transfer limitation on the gasification progress of different types of coals was investigated using both experimental and modeling approaches. The major findings and conclusions are as follows:
-
The nature of the changes in thermal lag was complex. Unlike in the case of a nitrogen atmosphere, the endothermic devolatilization process does not significantly affect it, while the impact of the char–CO2 reaction was visible.
-
As it was expected, the average thermal lag in carbon dioxide was greater than that in nitrogen (64.0 K vs. 57.6 K), which is related to both the properties of CO2 itself and the occurrence of the reverse Boudouard reaction.
-
At low temperatures, CO2 is an inert gas and does not significantly affect the mechanism of coal pyrolysis.
-
The slightly higher reactivity of the fuel during devolatilization in CO2 than in N2 may be attributed to the properties of gases but not to the change in the process mechanism.
-
Fuels having a higher volatiles content were characterized by a slightly higher thermal lag at the stage of devolatilization, while fuels rich in fixed carbon were characterized by this at the stage of the char–CO2 reaction.
-
Thermal lag influences the shape of the conversion curve, e.g., curves determined using the model show higher reactivity than those obtained experimentally.
-
Discrepancies between TRmax determined at different heating rates are, to some extent, affected by the finite heat transfer rate; however, the TRmax parameter cannot be treated as independent of the heating rate.
-
The onset temperature of the reverse Boudouard reaction depends on the type of fuel; however, no simple relationship with the basic physicochemical parameters characterizing fuels was found.
-
Disregarding thermal lag may significantly hinder the interpretation of the analyzed phenomena, e.g., after considering the limitations of heat transfer, the values of the activation energy describing devolatilization became more similar for different heating rates, which suggests that the mechanism of the observed reaction seems not to change as much as previously supposed.
-
Thermal lag has an impact on the kinetic parameter Aα0.5 describing devolatilization, up to 19.8%. In the case of the char–CO2 reaction, this influence is expected to be even greater.
-
There is an influence of the properties of the coal structure on the progress of the reverse Boudouard reaction; however, it does not decrease proportionally to the coal rank.
-
A relationship between the content of CaO and reactivity [77] was observed for hard coals but not for lignites.
Summarizing, the performed analysis indicates that to obtain trustworthy results, it is desirable to carry out TG experiments with a low heating rate or to recalculate results obtained at high heating rates with a model that allows the determination of the true sample temperature.

Funding

The thermal lag model development was co-funded by the National Centre for Research and Development of Poland, National Research Foundation of South Africa and Eskom Specialisation Centre under joint research and development project Environomical impact of enhanced coal power plant operating flexibility (EPPOF), grant no. PL-RPA2/09/EPPOF/2019, and by the Wrocław Academic Hub, grant no. BWU-16/2019/M8.

Institutional Review Board Statement

Not applicable.

Informed Consent Statement

Not applicable.

Data Availability Statement

Not applicable.

Conflicts of Interest

The author declares no conflict of interest.

Nomenclature

Aα0.1Reaction rate coefficient at the conversion of 10%, s−1
Aα0.5Reaction rate coefficient at the conversion of 50%, s−1
AcThe outer surface area of the crucible, m2
BiBiot number
CpashSpecific heat of ash, J·kg−1·K−1
CpcSpecific heat of crucible material, J·kg−1·K−1
CpchSpecific heat of char, J·kg−1·K−1
CpgSpecific heat of gas atmosphere surrounding the crucible, J·kg−1·K−1
CpsSpecific heat of specimen, J·kg−1·K−1
dcCrucible diameter, m
dfFurnace diameter, m
dsSample grain diameter, m
EaThe activation energy of devolatilization, J⋅mol−1
EbThe activation energy of char–CO2 reaction, J⋅mol−1
hOverall heat transfer coefficient, W∙m−2∙K−1
hcConvection heat transfer coefficient, W∙m−2∙K−1
hrRadiation heat transfer coefficient, W∙m−2∙K−1
k0,aThe pre-exponential factor for devolatilization, s−1
k0,bThe pre-exponential factor for char–CO2 reaction, s−1
lbHeight of a layer of sample in a crucible, m
lcCrucible height, m
m0The initial mass of the specimen, kg
mcMass of the crucible, kg
NuNusselt number
PrPrandtl number
Py′External pyrolysis number
RUniversal gas constant, J⋅K−1⋅mol−1
RCSample reactivity, K−1
ReReynolds number
tTime, s
TαThe temperature corresponding to the conversion of an exact amount of fuel, K
TcCrucible temperature measured by the temperature sensor, K
TmSample temperature computed using model, K
TrThe reference temperature, K
TRCmaxMaximum reactivity temperature, K
TsTrue sample temperature, K
xashShare of ash
xchShare of char
xvolShare of volatiles
Greek symbols
αDegree of sample conversion
αaDegree of sample conversion during devolatilization
αbDegree of sample conversion during the char–CO2 reaction
βHeating rate, K∙s−1
∆HdevThe heat of pyrolysis, J∙kg−1 (assumes positive values when the reaction is endothermic)
∆HgasThe heat of the char–CO2 reaction, J∙kg−1 (assumes positive values when the reaction is endothermic)
∆TThermal lag, K
∆TRmaxThe difference between TRmax determined at HR1 and HR50
μEmissivity
λgThermal conductivity of gas atmosphere surrounding the crucible, W∙m−1∙K−1
λsThermal conductivity of the sample
νgKinematic viscosity of gas atmosphere surrounding the crucible, m2∙s−1
ρgThe density of gas atmosphere surrounding the crucible, kg·m−3
ρsDensity of sample
σStefan–Boltzmann constant, equal to 5.670367∙10−8 W∙m−2∙K−4

References

  1. International Energy Agency. Global Energy Review 2020: The Impacts of the Covid-19 Crisis on Global Energy Demand and CO2 Emissions. 2020. Available online: https://iea.blob.core.windows.net/assets/7e802f6a-0b30-4714-abb1-46f21a7a9530/Global_Energy_Review_2020.pdf (accessed on 8 August 2021).
  2. Jakob, M.; Steckel, J.C.; Jotzo, F.; Sovacool, B.K.; Cornelsen, L.; Chandra, R.; Edenhofer, O.; Holden, C.; Löschel, A.; Nace, T.; et al. The future of coal in a carbon-constrained climate. Nat. Clim. Chang. 2020, 10, 704–707. [Google Scholar] [CrossRef]
  3. Massachusetts Institute of Technology. The Future of Coal: Options in a Carbon-Constrained World. 2007. Available online: https://energy.mit.edu/wp-content/uploads/2007/03/MITEI-The-Future-of-Coal.pdf (accessed on 8 August 2021).
  4. Greig, C.; Uden, S. The value of CCUS in transitions to net-zero emissions. Electr. J. 2021, 34, 107004. [Google Scholar] [CrossRef]
  5. Miller, B.G. Clean Coal Engineering Technology; Elsevier: Amsterdam, The Netherlands, 2011. [Google Scholar]
  6. Mauerhofer, A.; Fuchs, J.; Müller, S.; Benedikt, F.; Schmid, J.; Hofbauer, H. CO2 gasification in a dual fluidized bed reactor system: Impact on the product gas composition. Fuel 2019, 253, 1605–1616. [Google Scholar] [CrossRef]
  7. Chan, Y.H.; Rahman, S.N.F.S.A.; Lahuri, H.M.; Khalid, A. Recent progress on CO-rich syngas production via CO2 gasification of various wastes: A critical review on efficiency, challenges and outlook. Environ. Pollut. 2021, 278, 116843. [Google Scholar] [CrossRef] [PubMed]
  8. Roncancio, R.; Gore, J.P. CO2 char gasification: A systematic review from 2014 to 2020. Energy Convers. Manag. X 2021, 10, 100060. [Google Scholar] [CrossRef]
  9. Irfan, M.F.; Usman, M.R.; Kusakabe, K. Coal gasification in CO2 atmosphere and its kinetics since 1948: A brief review. Energy 2011, 36, 12–40. [Google Scholar] [CrossRef]
  10. Czajka, K.M. Proximate analysis of coal by micro-TG method. J. Anal. Appl. Pyrolysis 2018, 133, 82–90. [Google Scholar] [CrossRef]
  11. Gonzalo-Tirado, C.; Jiménez, S.; Ballester, J. Kinetics of CO2 gasification for coals of different ranks under oxy-combustion conditions. Combust. Flame 2013, 160, 411–416. [Google Scholar] [CrossRef]
  12. Czajka, K.; Modliński, N.; Kisiela-Czajka, A.M.; Naidoo, R.; Peta, S.; Nyangwa, B. Volatile matter release from coal at different heating rates –experimental study and kinetic modelling. J. Anal. Appl. Pyrolysis 2019, 139, 282–290. [Google Scholar] [CrossRef]
  13. Illanes, A. Immobilized Biocatalysts. Compr. Biotech. 2011, 2, 25–39. [Google Scholar]
  14. Vyazovkin, S.; Chrissafis, K.; Di Lorenzo, M.L.; Koga, N.; Pijolat, M.; Roduit, B.; Sbirrazzuoli, N.; Suñol, J.J. ICTAC Kinetics Committee recommendations for collecting experimental thermal analysis data for kinetic computations. Thermochim. Acta 2014, 590, 1–23. [Google Scholar] [CrossRef]
  15. Czajka, K.M. The impact of the thermal lag on the interpretation of cellulose pyrolysis. Energy 2021, 236, 121497. [Google Scholar] [CrossRef]
  16. Stenseng, M.; Jensen, A.; Dam-Johansen, K. Investigation of biomass pyrolysis by thermogravimetric analysis and differential scanning calorimetry. J. Anal. Appl. Pyrolysis 2001, 58–59, 765–780. [Google Scholar] [CrossRef]
  17. Narayan, N.; Antal, M.J. Thermal Lag, Fusion, and the Compensation Effect during Biomass Pyrolysis. Ind. Eng. Chem. Res. 1996, 35, 1711–1721. [Google Scholar] [CrossRef]
  18. Burnham, A.; Braun, R.L.; Gregg, H.R.; Samoun, A.M. Comparison of methods for measuring kerogen pyrolysis rates and fitting kinetic parameters. Energy Fuels 1987, 1, 452–458. [Google Scholar] [CrossRef]
  19. Wall, T.; Liu, Y.; Spero, C.; Elliott, L.; Khare, S.; Rathnam, R.; Zeenathal, F.; Moghtaderi, B.; Buhre, B.; Sheng, C.; et al. An overview on oxyfuel coal combustion—State of the art research and technology development. Chem. Eng. Res. Des. 2009, 87, 1003–1016. [Google Scholar] [CrossRef]
  20. Mianowski, A.; Robak, Z.; Tomaszewicz, M.; Stelmach, S. The Boudouard–Bell reaction analysis under high pressure conditions. J. Therm. Anal. Calorim. 2012, 110, 93–102. [Google Scholar] [CrossRef] [Green Version]
  21. Gomez Quevedo, R.A. Fundamental Kinetic Studies of CO2 and Steam Gasification (Doctoral Dissertation); University of Calgary: Calgary, AB, Canada, 2015. [Google Scholar]
  22. Dupont, C.; Boissonnet, G.; Seiler, J.-M.; Gauthier-Maradei, P.; Schweich, D. Study about the kinetic processes of biomass steam gasification. Fuel 2007, 86, 32–40. [Google Scholar] [CrossRef] [Green Version]
  23. International Organisation for Standardisation. Solid Mineral Fuels–Hard Coal: Determination of Moisture in the General Analysis Test Sample by Drying in Nitrogen; ISO 11722:2013; ISO: Geneva, Switzerland, 2013. [Google Scholar]
  24. International Organisation for Standardisation. Hard Coal and Coke: Determination of Volatile Matter; ISO 562:2010; ISO: Geneva, Switzerland, 2010. [Google Scholar]
  25. International Organisation for Standardisation. Solid Mineral Fuels: Determination of Ash; ISO 171:2010; ISO: Geneva, Switzerland, 2010. [Google Scholar]
  26. Polish Committee for Standardization. Paliwa Stałe: Oznaczanie Zawartości Siarki Całkowitej i Popiołowej Automatycznymi Analizatorami; PN-G-04571:1998; Polish Committee for Standardization: Warsaw, Poland, 1998. (In Polish) [Google Scholar]
  27. Polish Committee for Standardization. Paliwa Stałe: Oznaczanie Zawartości Siarki Popiołowej Metodą Spalania w Wysokiej Temperaturze; PN-G-04581:1999/Az1:2002; Polish Committee for Standardization: Warsaw, Poland, 1999. (In Polish) [Google Scholar]
  28. International Organisation for Standardisation. Solid Biofuels: Determination of Calorific Value; ISO 18125:2017; ISO: Geneva, Switzerland, 2017. [Google Scholar]
  29. Mularski, J.; Pawlak-Kruczek, H.; Modlinski, N. A review of recent studies of the CFD modelling of coal gasification in entrained flow gasifiers, covering devolatilization, gas-phase reactions, surface reactions, models and kinetics. Fuel 2020, 271, 117620. [Google Scholar] [CrossRef]
  30. Mularski, J.; Modliński, N. Entrained-Flow Coal Gasification Process Simulation with the Emphasis on Empirical Char Conversion Models Optimization Procedure. Energies 2021, 14, 1729. [Google Scholar] [CrossRef]
  31. Mularski, J.; Modliński, N. Impact of Chemistry–Turbulence Interaction Modeling Approach on the CFD Simulations of Entrained Flow Coal Gasification. Energies 2020, 13, 6467. [Google Scholar] [CrossRef]
  32. Hadad, Y.; Jafarpur, K. Laminar forced convection heat transfer from isothermal cylinders with active ends and different aspect ratios in axial air flows. Heat Mass Transf. 2011, 47, 59–68. [Google Scholar] [CrossRef]
  33. Ginnings, D.C.; Corruccini, R.J. Enthalpy, Specific Heat, and Entropy of Aluminum Oxide from 0° to 900° C. J. Res. Nat. Bur. Stand. 1947, 38, 593–600. [Google Scholar] [CrossRef]
  34. Leśniak, B.; Słupik, Ł.; Jakubina, G. The determination of the specific heat capacity of coal based on literature data. Chemik 2013, 67, 560–571. [Google Scholar]
  35. Eisermann, W.; Johnson, P.; Conger, W. Estimating thermodynamic properties of coal, char, tar and ash. Fuel Process. Technol. 1980, 3, 39–53. [Google Scholar] [CrossRef]
  36. Richardson, M. The specific heats of coals, cokes and their ashes. Fuel 1993, 72, 1047–1053. [Google Scholar] [CrossRef]
  37. Lemmon, E.W.; Huber, M.L.; McLinden, M.O. NIST Standard Reference Database 23: Reference Fluid Thermodynamic and Transport Properties-REFPROP; National Institute of Standards and Technology: Gaithersburg, MD, USA, 2013. [Google Scholar]
  38. Bell, I.H.; Wronski, J.; Quoilin, S.; Lemort, V. Pure and Pseudo-pure Fluid Thermophysical Property Evaluation and the Open-Source Thermophysical Property Library CoolProp. Ind. Eng. Chem. Res. 2014, 53, 2498–2508. [Google Scholar] [CrossRef] [PubMed] [Green Version]
  39. Farag, I.H.; Allam, T. Carbon dioxide standard emissivity by mixed gray-gases model. Chem. Eng. Commun. 1982, 14, 123–131. [Google Scholar] [CrossRef]
  40. Milosavljevic, I.; Oja, A.V.; Suuberg, E.M. Thermal Effects in Cellulose Pyrolysis: Relationship to Char Formation Processes. Ind. Eng. Chem. Res. 1996, 35, 653–662. [Google Scholar] [CrossRef]
  41. Uhrig, A. Determination of Pyrolysis Reaction Kinetics of Raw and Torrefied Biomass. Bachelor’s Thesis, University of Twente, Enschede, The Netherlands, 2014. [Google Scholar]
  42. Patisson, F.; LeBas, E.; Hanrot, F.; Ablitzer, D.; Houzelot, J.-L. Coal pyrolysis in a rotary kiln: Part I. Model of the pyrolysis of a single grain. Met. Mater. Trans. A 2000, 31, 381–390. [Google Scholar] [CrossRef] [Green Version]
  43. Prins, M.J.; Ptasinski, K.J.; Janssen, F.J. Torrefaction of wood: Part 1. Weight loss kinetics. J. Anal. Appl. Pyrolysis 2006, 77, 28–34. [Google Scholar] [CrossRef]
  44. Vyazovkin, S.; Burnham, A.K.; Favergeon, L.; Koga, N.; Moukhina, E.; Pérez-Maqueda, L.A.; Sbirrazzuoli, N. ICTAC Kinetics Committee recommendations for analysis of multi-step kinetics. Thermochim. Acta 2020, 689, 178597. [Google Scholar] [CrossRef]
  45. Weerachanchai, P.; Tangsathitkulchai, C.; Tangsathitkulchai, M. Comparison of pyrolysis kinetic models for thermogravimetric analysis of biomass. J. Sci. Technol. 2010, 17, 387–400. [Google Scholar]
  46. Chen, H.; Liu, N.; Fan, W. Two-step Consecutive Reaction Model of Biomass Thermal Decomposition by DSC. Acta Physico-Chim. Sin. 2006, 22, 786–790. [Google Scholar] [CrossRef]
  47. Guo, J.; Lua, A. Kinetic study on pyrolytic process of oil-palm solid waste using two-step consecutive reaction model. Biomass Bioenergy 2001, 20, 223–233. [Google Scholar] [CrossRef]
  48. Czajka, K.; Kisiela, A.; Moroń, W.; Ferens, W.; Rybak, W. Pyrolysis of solid fuels: Thermochemical behaviour, kinetics and compensation effect. Fuel Process. Technol. 2016, 142, 42–53. [Google Scholar] [CrossRef]
  49. Doyle, C.D. Estimating isothermal life from thermogravimetric data. J. Appl. Polym. Sci. 1962, 6, 639–642. [Google Scholar] [CrossRef]
  50. Garnier, B.; Lanzetta, F.; Lemasson, P.H.; Virgone, J. Lecture 5A: Measurements with contact in heat. Metti 5 Spring School, Roscoff, 13–18 June 2011. Available online: https://www.sft.asso.fr/Local/sft/dir/user-3775/documents/actes/Metti5_School/Lectures&Tutorials-Texts/Text-L5A-Garnier-Lanzetta.pdf (accessed on 8 August 2021).
  51. Falsetti, C.; Kapulla, R.; Paranjape, S.; Paladino, D. Thermal radiation, its effect on thermocouple measurements in the PANDA facility and how to compensate it. Nucl. Eng. Des. 2021, 375, 111077. [Google Scholar] [CrossRef]
  52. Jalalabadi, T.; Moghtaderi, B.; Allen, J. Thermochemical Conversion of Biomass in the Presence of Molten Alkali-Metal Carbonates under Reducing Environments of N2 and CO2. Energies 2020, 13, 5395. [Google Scholar] [CrossRef]
  53. Yang, M.; Luo, B.; Shao, J.; Zeng, K.; Zhang, X.; Yang, H.; Chen, H. The influence of CO2 on biomass fast pyrolysis at medium temperatures. J. Renew. Sustain. Energy 2018, 10, 013108. [Google Scholar] [CrossRef]
  54. Jamil, K.; Hayashi, J.-I.; Li, C.-Z. Pyrolysis of a Victorian brown coal and gasification of nascent char in CO2 atmosphere in a wire-mesh reactor. Fuel 2004, 83, 833–843. [Google Scholar] [CrossRef]
  55. Duan, L.; Zhao, C.; Zhou, W.; Qu, C.; Chen, X. Investigation on Coal Pyrolysis in CO2 Atmosphere. Energy Fuels 2009, 23, 3826–3830. [Google Scholar] [CrossRef]
  56. Jindarom, C.; Meeyoo, V.; Rirksomboon, T.; Rangsunvigit, P. Thermochemical decomposition of sewage sludge in CO2 and N2 atmosphere. Chemosphere 2007, 67, 1477–1484. [Google Scholar] [CrossRef]
  57. Kim, Y.J.; Kim, M.I.; Yun, C.H.; Chang, J.Y.; Park, C.R.; Inagaki, M. Comparative study of carbon dioxide and nitrogen atmospheric effects on the chemical structure changes during pyrolysis of phenol–formaldehyde spheres. J. Colloid Interface Sci. 2004, 274, 555–562. [Google Scholar] [CrossRef] [PubMed]
  58. Bilkic, B.; Haykiri-Acma, H.; Yaman, S. Combustion reactivity estimation parameters of biomass compared with lignite based on thermogravimetric analysis. Energy Sources Part A 2020, 1–14. [Google Scholar] [CrossRef]
  59. Pilatau, A.; Czajka, K.; Filho, G.P.; Medeiros, H.S.; Kisiela, A.M. Evaluation Criteria for the Assessment of the Influence of Additives (AlCl3 and ZnCl2) on Pyrolysis of Sunflower Oil Cake. Waste Biomass-Valoriz. 2017, 8, 2595–2607. [Google Scholar] [CrossRef]
  60. Rybak, W.; Moroń, W.; Czajka, K.M.; Kisiela, A.M.; Ferens, W.; Jodkowski, W.; Andryjowicz, C. Co-combustion of unburned carbon separated from lignite fly ash. Energy Procedia 2017, 120, 197–205. [Google Scholar] [CrossRef]
  61. Speight, J.G. Heavy Oil Recovery and Upgrading; Gulf Professional Publishing: Laramie, WY, USA, 2019; p. 576. [Google Scholar]
  62. Wang, T.; Stiegel, G. Integrated Gasification Combined Cycle (IGCC) Technologies; Woodhead Publishing: Amsterdam, The Netherlands, 2017; p. 10. [Google Scholar]
  63. Tangstad, M.; Baukes, J.P.; Steenkamp, J.D.; Ringdalen, E. Coal-based reducing agents in ferroalloys and silicon production. In New Trends in Coal Conversion; Suarez-Ruiz, I., Rubiera, F., Diez, M.A., Eds.; Woodhead Publishing: Amsterdam, The Netherlands, 2019; pp. 405–438. [Google Scholar]
  64. Riley, J.; Siriwardane, R.; Tian, H.; Benincosa, W.; Poston, J. Experimental and kinetic analysis for particle scale modeling of a CuO-Fe2O3-Al2O3 oxygen carrier during reduction with H2 in chemical looping combustion applications. Appl. Energy 2018, 228, 1515–1530. [Google Scholar] [CrossRef]
  65. Kisiela, A.M.; Czajka, K.M.; Moron, W.; Rybak, W.; Andryjowicz, C. Unburned carbon from lignite fly ash as an adsorbent for SO2 removal. Energy 2016, 116, 1454–1463. [Google Scholar] [CrossRef]
  66. Guldogan, Y.; Evren, V.; Durusoy, T.; Bozdemir, T. Effects of Heating Rate and Particle Size on Pyrolysis Kinetics of Mengen Lignite. Energy Sources 2001, 23, 337–344. [Google Scholar]
  67. Guo, Z.; Zhang, L.; Wang, P.; Liu, H.; Jia, J.; Fu, X.; Li, S.; Wang, X.; Li, Z.; Shu, X. Study on kinetics of coal pyrolysis at different heating rates to produce hydrogen. Fuel Process. Technol. 2013, 107, 23–26. [Google Scholar] [CrossRef]
  68. Ozbas, K.E.; Kok, M.V. Effect of Heating Rate on Thermal Properties and Kinetics of Raw and Cleaned Coal Samples. Energy Sources 2003, 25, 33–42. [Google Scholar] [CrossRef]
  69. Urych, B. Determination of Kinetic Parameters of Coal Pyrolysis to Simulate the Process of Underground Coal Gasification (UCG). J. Sustain. Min. 2014, 13, 3–9. [Google Scholar] [CrossRef] [Green Version]
  70. Dwivedi, K.K.; Chatterjee, P.K.; Karmakar, M.K.; Pramanick, A.K. Pyrolysis characteristics and kinetics of Indian low rank coal using thermogravimetric analysis. Int. J. Coal Sci. Technol. 2019, 6, 102–112. [Google Scholar] [CrossRef] [Green Version]
  71. Dingcheng, L.; Qiang, X.; Guangsheng, L.; Junya, C.; Jun, Z. Influence of heating rate on reactivity and surface chemistry of chars derived from pyrolysis of two Chinese low rank coals. Int. J. Min. Sci. Technol. 2018, 28, 613–619. [Google Scholar] [CrossRef]
  72. Song, Y.H.; She, J.M.; Lan, X.Z.; Zhou, J. Pyrolysis Characteristics and Kinetics of Low Rank Coal. Mater. Sci. Forum 2011, 695, 493–496. [Google Scholar] [CrossRef]
  73. Xu, Y.; Zhang, Y.; Wang, Y.; Zhang, G.; Chen, L. Thermogravimetric study of the kinetics and characteristics of the pyrolysis of lignite. React. Kinet. Mech. Catal. 2013, 110, 225–235. [Google Scholar] [CrossRef]
  74. Yakar Elbeyli, I.; Piskin, S.; Sutcu, H. Pyrolysis Kinetics of Turkish Bituminous Coals by Thermal Analysis. Turk. J. Eng. Environ. Sci. 2004, 28, 233–239. [Google Scholar]
  75. Barrio, M.; Hustad, J.E. CO2 Gasification of Birch Char and the Effect of CO Inhibition on the Calculation of Chemical Kinetics. In Progress in Thermochemical Biomass Conversion; Wiley: Hoboken, NJ, USA, 2008; pp. 47–60. [Google Scholar]
  76. Risnes, H.; Srensen, L.H.; Hustad, J.E.; Sørensen, L.H. CO2 Reactivity of Chars from Wheat, Spruce and Coal. In Progress in Thermochemical Biomass Conversion; Wiley: Hoboken, NJ, USA, 2008; pp. 61–72. [Google Scholar]
  77. Liu, G.-S.; Tate, A.; Bryant, G.; Wall, T. Mathematical modeling of coal char reactivity with CO2 at high pressures and temperatures. Fuel 2000, 79, 1145–1154. [Google Scholar] [CrossRef]
  78. Rybak, W.; Nowak-Woźny, D.; Moroń, W.; Urbanek, B.; Hrycaj, G. Transformacja substancji mineralnej w warunkach spalania tlenowego. In Spalanie Tlenowe Dla Kotłów Pyłowych i Fluidalnych Zintegrowanych z Wychwytem CO2: Kinetyka i Mechanizm Spalania Tlenowego Oraz Wychwytu CO2; Nowak, W., Rybak, W., Czakiert, T., Eds.; Wydawnictwo Politechniki Częstochowskiej: Częstochowa, Poland, 2013; pp. 176–194. (In Polish) [Google Scholar]
  79. Dahou, T.; Defoort, F.; Khiari, B.; Labaki, M.; Dupont, C.; Jeguirim, M. Role of inorganics on the biomass char gasification reactivity: A review involving reaction mechanisms and kinetics models. Renew. Sustain. Energy Rev. 2021, 135, 110136. [Google Scholar] [CrossRef]
  80. Bennici, S.; Jeguirim, M.; Limousy, L.; Haddad, K.; Vaulot, C.; Michelin, L.; Josien, L.; Zorpas, A.A. Influence of CO2 Concentration and Inorganic Species on the Gasification of Lignocellulosic Biomass Derived Chars. Waste Biomass-Valoriz. 2019, 10, 3745–3752. [Google Scholar] [CrossRef]
  81. Vázquez, M.D.P.G.; García, R.; Gil, M.; Pevida, C.; Rubiera, F. Unconventional biomass fuels for steam gasification: Kinetic analysis and effect of ash composition on reactivity. Energy 2018, 155, 426–437. [Google Scholar] [CrossRef]
  82. Delannay, F.; Tysoe, W.; Heinemann, H.; Somorjai, G. The role of KOH in the steam gasification of graphite: Identification of the reaction steps. Carbon 1984, 22, 401–407. [Google Scholar] [CrossRef]
  83. Bouraoui, Z.; Dupont, C.; Jeguirim, M.; Limousy, L.; Gadiou, R. CO2 gasification of woody biomass chars: The influence of K and Si on char reactivity. Comptes Rendus Chim. 2016, 19, 457–465. [Google Scholar] [CrossRef] [Green Version]
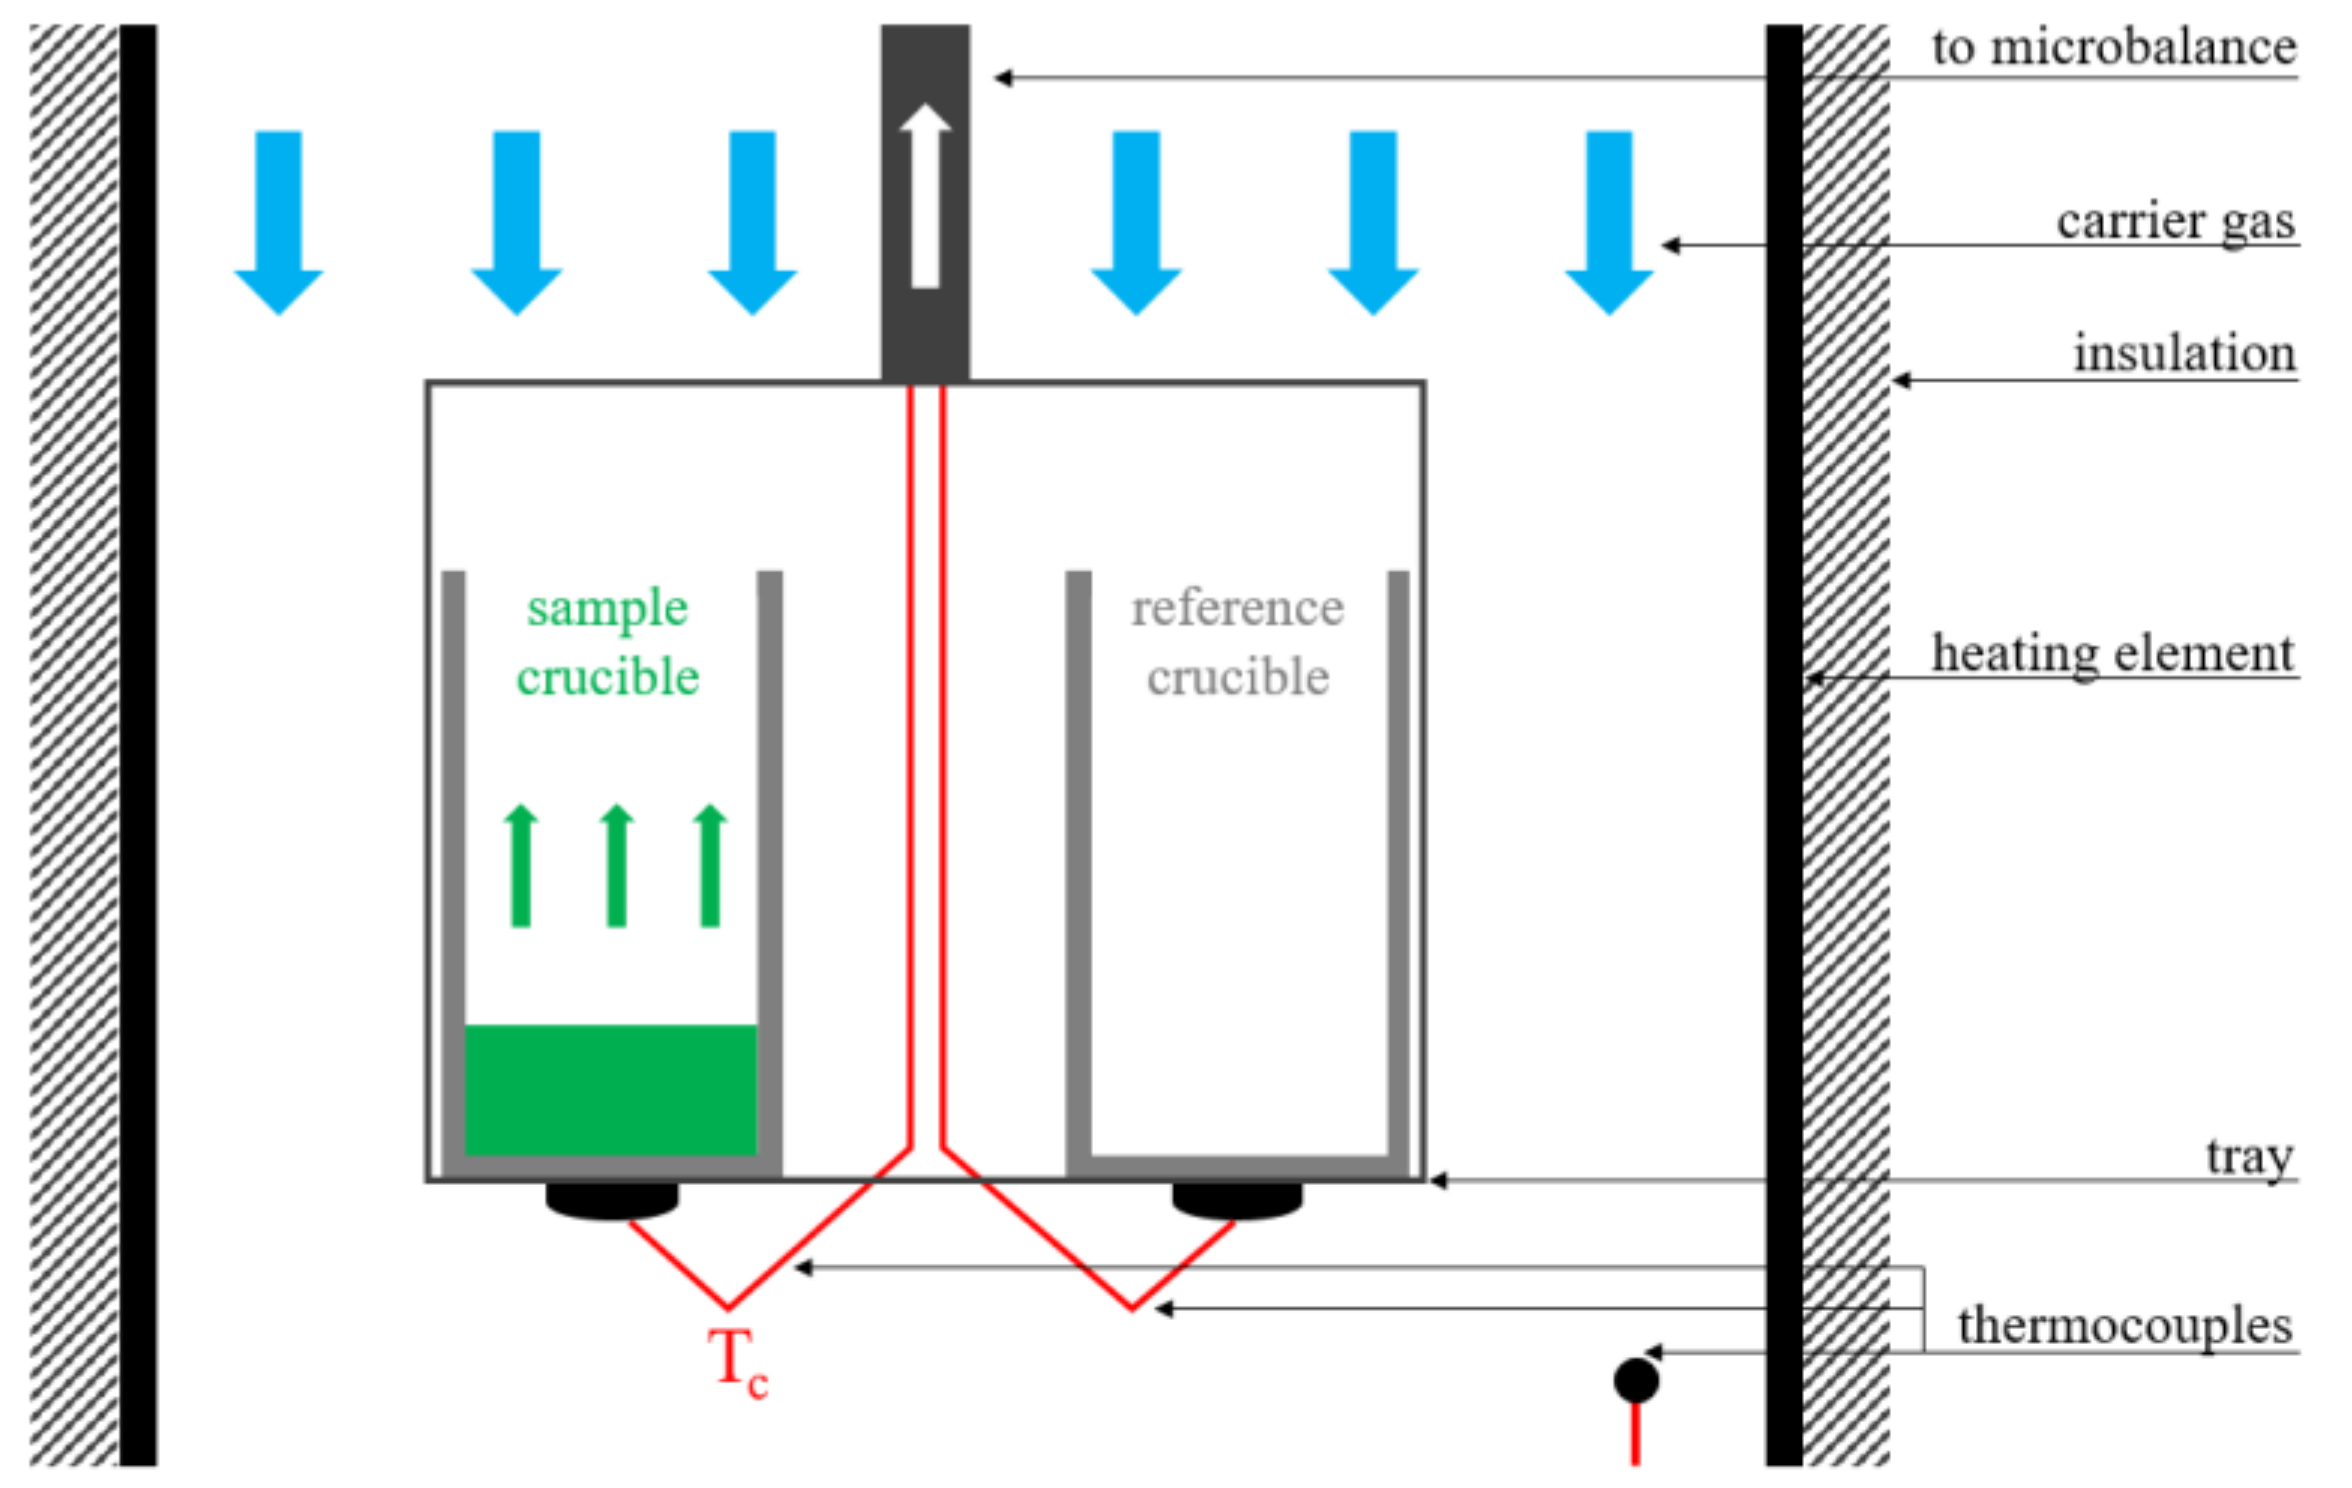
Figure 1. Scheme of the TG device.
Energies 14 05569 g001
Figure 2. Thermal lag determined for LT at HR50.
Energies 14 05569 g002
Figure 3. Comparison of thermal lag determined in CO2 and N2 (LT, HR50).
Energies 14 05569 g003
Figure 4. Thermal lag determined for LT at different heating rates.
Energies 14 05569 g004
Figure 5. Thermal lag determined for different fuels at HR5.
Energies 14 05569 g005
Figure 6. The impact of thermal lag on the conversion curves, determined for LT at different heating rates.
Energies 14 05569 g006
Figure 7. The impact of thermal lag on the conversion curve, determined for different fuels at HR30. (a) LB; (b) HJ; (c) HS; (d) HZ; (e) AI.
Energies 14 05569 g007aEnergies 14 05569 g007b
Figure 8. The impact of thermal lag on the reactivity curves, determined for LT at different heating rates.
Energies 14 05569 g008
Figure 9. The impact of thermal lag on the reactivity curve, determined for different fuels at HR30. (a) LB; (b) HJ; (c) HS; (d) HZ; (e) AI.
Energies 14 05569 g009
Table 1. Proximate and ultimate analysis of samples.
Smp.MVFCAFRCHNSO *HHV
wt% ar-wt% arMJ∙kg−1
LB4.444.435.016.20.7955.24.50.71.817.218.9
LT2.046.733.817.50.7259.04.80.51.314.921.7
HJ2.132.755.69.61.7075.74.31.21.25.924.7
HS3.733.052.910.41.6076.04.11.31.62.925.8
HZ2.434.955.07.71.5877.14.61.21.15.927.8
AI1.74.990.33.118.489.03.51.20.51.033.2
Where: M—moisture, V—volatiles, FC—fixed carbon (=100%—M/V/A), A—ash, FR—fuel ratio (=FC/V), C—carbon, H—hydrogen, N—nitrogen, S—sulfur, O—oxygen, ar—on an as-received basis, *—calculated by difference.
Table 2. Parameters applied for the thermal lag model.
lc,
m
dc,
m
df,
m
m0,
kg
mc,
kg
μσ,
Wm−2K−4
ΔHdev, Jkg−1ΔHgas, Jkg−1h d,
Wm−2K−1
10−25·10−35·10−210−61.8·10−40.15 a5.67·10−8400·103 b604·104 c17.2–79.0
Where: a—[39], b—the heat of reaction is not the same as the heat measured directly by DSC, but it is reduced by the heat of the char formation following [40], c—the average heat of Boudouard reaction in a temperature range of 298–1173 K [21], d—computed from Equation (9).
Table 3. Results of a kinetic study of LT.
SampleHRApproachDevolatilizationChar–CO2 Reaction
E a k o , a A α 0.5 E b k o , b A α 0.1
kJ mol−1s−1s−1kJ mol−1s−1s−1
LT1Mod.41.426.23 × 10−11.57 × 10−4126.473.62.56 × 10−5
Exp.41.866.67 × 10−11.57 × 10−4126.976.52.56 × 10−5
5Mod.43.432.037.02 × 10−4117.485.91.18 × 10−4
Exp.45.532.727.17 × 10−4119.299.81.19 × 10−4
15Mod.39.941.901.76 × 10−3112.292.63.23 × 10−4
Exp.45.664.161.87 × 10−3116.91.35 × 1023.25 × 10−4
30Mod.36.881.502.98 × 10−3112.31.12 × 1026.00 × 10−4
Exp.48.036.743.41 × 10−3122.42.35 × 1026.09 × 10−4
50Mod.36.461.614.51 × 10−3117.32.17 × 1029.77 × 10−4
Exp.53.3013.15.41 × 10−3130.75.91 × 1021.00 × 10−3
Table 4. Results of a kinetic study for HR5.
SampleHRApproachDevolatilizationChar–CO2 Reaction
E a k o , a A α 0.5 E b k o , b A α 0.1
kJ mol−1s−1s−1kJ mol−1s−1s−1
LBHR5Mod.26.185.93 × 10−24.37 × 10−4135.65.32 × 1021.23 × 10−4
Exp.27.587.35 × 10−24.47 × 10−4137.76.24 × 1021.24 × 10−4
HJMod.53.0812.48.36 × 10−4184.25.81 × 1041.59 × 10−4
Exp.55.4917.38.52 × 10−4186.76.88 × 1041.61 × 10−4
HSMod.58.5923.68.57 × 10−4124.996.81.13 × 10−4
Exp.61.1032.88.73 × 10−4126.71.11 × 1021.14 × 10−4
HZMod.66.2357.58.90 × 10−4117.842.91.08 × 10−4
Exp.68.8480.19.06 × 10−4119.548.91.08 × 10−4
AIMod.ndndnd61.581.26 × 10−16.95 × 10⁻⁵
Exp.ndndnd62.951.44 × 10−17.04 × 10⁻⁵
Table 5. The content of selected elements in the mineral matter [78].
SampleK2OCaOAl2O3SiO2P2O5
wt%
LB0.1123.017.229.10.13
LT0.4819.122.032.40.17
HJ1.924.8126.940.60.71
HS1.475.3123.044.60.93
HZ0.886.9727.236.30.55
Publisher’s Note: MDPI stays neutral with regard to jurisdictional claims in published maps and institutional affiliations.