Abstract
In this study, shale cores from 20 wells in the S1l11-1 sublayer of Longmaxi Formation buried in shallow shale (<3500 m) and deep shale (>3500 m) in the southern Sichuan Basin, China were collected to compare their pore structures and gas-bearing properties using multiple experiments. Results showed that the deep layer has relatively lower brittle mineral content, which is disadvantageous in terms of the higher requirements it imposes on hydraulic fracturing. Results also showed that the most important factor controlling the differential enrichment of S1l11-1 shale gas in southern Sichuan Basin is porosity. Moreover, the porosity composition of shallow shale and deep shale has significant differences: the porosity of shallow shale is dominated by organic pores, while for deep shale, both organic and inorganic pores are important. The inorganic pores provide significant storage space for free gas in deep shale; their contribution warrants more attention. We also found that the difference in organic porosity of the shallow and deep shale samples resulted from large differences in pore development ability, while the highest inorganic porosity was concentrated near the optimal mineral composition when the content of quartz plus feldspar plus pyrite was about 70%. This study revealed the primary factor controlling the difference in gas content between shallow and deep shale and detailed the characteristics of microscopic pore structure, providing a basis for the exploration and development of deep shale gas in the Wufeng-Longmaxi Formation in the southern Sichuan Basin.
1. Introduction
With the rapid growth in China’s energy demand and pollution caused by particulate matter, the government is promoting a clean energy plan to gradually replace coal with natural gas in the next few decades. Among the natural gas resources in China, shale gas is rich in resources and expected to become one of the most important replacement resources [1].
Shale gas production jumped from 2.50 × 10⁷ m3 in 2012 to 1.54 × 10¹⁰ m3 in 2019 in China [2]. Sichuan Basin and its surrounding areas possess huge shall gas development potential, which could play an important role in China’s shale gas production. Since 2010, great success has been achieved in the exploration and development of marine shale gas in the Wufeng-Longmaxi Formation shallower than 3500 m. With the reduction in drilling costs and the development of production technologies, gas exploration companies and academia have gradually shifted their focus to deep shale gas (>3500 m). Deep shale gas has been commercially developed in Eagle Ford, Haynesville and Woodford blocks in North America. Due to the complex geological conditions in China, Wufeng-Longmaxi Formation is generally buried deeper than 3500 m [3]. However, at present, China’s deep shale gas exploration is still burdened with many problems and challenges, including great difficulty in accurately obtaining reservoir parameters (such as gas content, porosity and permeability) [4,5], limited understanding of the mechanisms of high production [6], low-efficiency drilling technology [7], and ambiguous hydro-fracture expansion rules [8,9]. The implementation results have fully proved the Wufeng-Longmaxi Formations with deep buried depths are widely distributed and have huge resource potential. However, most of the wells are marked by low production and rapid decline [10,11]. Some researches focus on ways to improve shale production, such as re-fracturing [12], carbon dioxide injection [13] and alternative hot water alternating gas injection [14]. Before that, more fundamentally, we need to find the sweet spot for deep shale gas. A better understanding of the enrichment factors for deep shale gas in southern Sichuan Basin is the basis for its production.
Gas content is the key parameter for the evaluation of shale reservoirs. In shale, gas is stored as compressed free gas in pores, as adsorbed gas to the pore walls and as soluble gas in solid organic materials and clays [15,16], where free gas and adsorbed gas are dominant [17]. Transport and storage in gas shale is much more difficult than in the conventional reservoirs due to its richness in nanopores. In 2009, Javadpour [16] introduced an apparent permeability term that includes the complexity of flow in nanopores (viscous flow, slip flow and Knudsen diffusion), which covers the transportation mechanisms of free gas. For adsorbed gas, surface diffusion is an important transportation mechanism [18]. Davarpanah [19] propose a mathematical model of unipore diffusion and modified unipore diffusion, which is able to consider the kinetic adsorption of methane. The complex transport and storage characteristics of shale gas compound the difficulty in the measurement of its gas content. At present, there are two main methods for shale gas content evaluation: the direct method and indirect method [20,21]. The direct method draws on coalbed methane gas and uses the same equipment as coalbed methane gas; gas content is the sum of the lost gas, the degassing gas and the residual gas. The main difficulty of this method is the calculation of the lost gas, which is the most inaccurate part in the total gas content, especially for deep shale gas. In this work, we measured adsorbed gas and free gas content by the indirect method with strict controls for temperature, pressure and balance time, using an isotherm adsorption experiment to measure the adsorbed gas and the equation of state for free gas, for the purpose of obtaining more accurate measurement of shale gas content.
Research on gas content of deep shale gas in China is far from complete. A large number of studies, basically in shallow shale gas, have found that free gas and adsorbed gas are related to formation temperature and pressure, specific surface area, and porosity [20,22,23,24,25]. In recent years, research on deep shale gas has gradually increased. He et al. [26] pointed out that deep shale gas has the geological conditions of high temperature, high pressure and high in-situ stress, and the increase in overburden pressure will reduce the porosity and permeability of the reservoir. Nevertheless, Long et al. [10] pointed out that the porosity of the deep shale reservoir in southern Sichuan is slightly higher than that of the shallow shale reservoir in Fuling. The rationale behind the theory is that the deep shale underground has good sealing conditions and overpressure of hydrocarbon generation will be formed in the process of hydrocarbon generation from organic matter, thus resulting in increased shale porosity. The development of pores in deep and shallow shale reservoirs is still controversial; in order to deepen our understandings of deep shale, a careful comparison between the gas content and porosity of shallow and deep shale is desirable. In this study, a comprehensive comparison of shallow and deep shale gas was conducted. Generally, shale contains mineral inter-particle pores, intra-particle pores and micro-cracks, as well as organic pores; additionally, the pore compositions of deep and shallow shale reservoirs are also quite different [27]. Inorganic pores are generally supported by a framework composed of minerals or detrital particles and mainly store free gas, while organic pores are distributed inside kerogen and generally remain after the decomposition of organic matter. The surfaces of organic pores adsorb hydrocarbons, and the pore space can store free gas that has not escaped. Liu et al. [28] have illustrated that organic pores are the main pore type in shallow shale in the Longmaxi Formation in the Sichuan Basin, and the micropores in the organic pores account for a large proportion of pore volume and specific surface area. In shallow shale gas, the contribution of inorganic pores is relatively small. However, the contributions of inorganic pores to the gas content of shale buried in deep depths have not been studied in detail. On the one hand, there are still relatively few deep shale wells in China. On the other hand, the study on the contributions of organic pores and inorganic pores requires a large number of scanned images and precise pore separation technology. In our previous work, a method for identification of organic and inorganic pores from scanning electron microscope (SEM) images was developed [29,30]. In this study, a combination of petrophysical and scanning measurements is adopted to identify the mechanism of differential enrichment of deep and shallow shale gas in the Wufeng-Longmaxi Formation in southern Sichuan Basin.
The Upper Ordovician Wufeng Formation-Lower Silurian Longmaxi Formation marine shale was the target shale gas layer in southern Sichuan. In our study area, the sweet spot layer was the S1l11-1 sublayer of Longmaxi Formation. The understanding of shale gas enrichment in the S1l11-1 sublayer cannot meet the current needs of exploration and development. It is necessary to strengthen the evaluation of shale at different buried depths, under similar structural backgrounds and depositional environments. Additionally, it is vital to carry out detailed analysis of pores, physical properties and gas-bearing properties of shallow and deep shale gas to clarify the differences of their main enrichment factors.
2. Geological Setting and Samples
2.1. Geological Setting
The Sichuan Basin is located on the northwest side and is a secondary structural unit of the Yangtze quasi-platform. In the Longmaxi period of the Early Silurian, the basin was in a clastic shelf facies sedimentary environment. The southern and northeastern Sichuan basin were located in deep-water shelf subfacies with quiet water bodies and a high degree of reduction [31,32,33]. The Lower Silurian Longmaxi Formation experienced an early burial stage, reaching a maximum burial depth of about 6500 m in the late Yanshanian period (about 120 Ma), and was elevated to the current burial depth between the late Yanshanian period and the Himalayan period [34]. The lower part of the Lower Silurian Longmaxi Formation is in integrated contact with the Wufeng Formation, and the upper part is in integrated contact with the Shiniulan Formation, with thickness ranges from tens of meters to hundreds of meters. The bottom of the Longmaxi Formation shale is mainly black carbonaceous shale and black siliceous shale, and the upward shale content increases. The upper part of the formation is dominated by silty mudstone. Longmaxi shale has high total organic carbon (TOC), high thermal maturity (expressed as vitrinite reflectance Ro) and high brittle mineral content [31]; TOC is about 0.46–6.79%, Ro is about 2.0–3.7%, and the content of brittle minerals is greater than 50%, which is a favorable interval for shale gas development [34,35,36]. Among them, the S1l11-1 sublayer is the best target shale layer. In this study, the samples were collected from 20 wells in the S1l11-1 sublayer in southern Sichuan Basin; the well locations are shown in Figure 1.
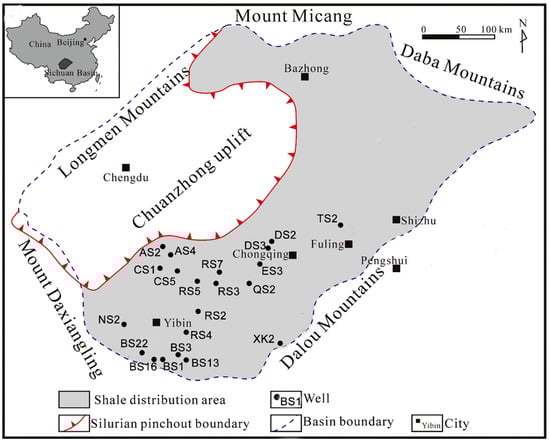
Figure 1.
Research area and well locations (modified after Chen et al. [37]).
2.2. Samples
The samples were collected from S1l11-1 sublayer in Weiyuan-Zigong, Changning, Luzhou, Western Chongqing and Baoluan blocks (including 9 shallow shale gas wells and 11 deep shale gas wells). The basic reservoir parameters and logging parameters are shown in Table 1. Experimental analyses related to the pore structure and gas-bearing properties were carried out, including scanning electron microscopy (SEM), energy dispersive spectrum analysis (EDS), low-temperature nitrogen adsorption, particle helium porosity, high-pressure isothermal adsorption, etc. On the basis of these experiments, the main enrichment factors in the S1l11-1 sublayer at shallow and deep buried depths were compared.

Table 1.
Basic reservoir parameters and logging parameters of the samples.
3. Methods
3.1. Pore Structure Testing and Analysis
Because the pore structure of shale is highly heterogeneous and its space scale spans six to seven orders of magnitude, it is difficult to realize complete characterization using conventional techniques and methods. At present, there are two types of methods for measuring the characteristics of pore structures [38]. One is direct measurement, and the other is image analysis. In our previous work [30], we formulated a representation element surface (RES) analysis method before the extraction of pores and found that the SEM imaging with large area of 40 × 400 μm2 can reach the RES size for Longmaxi shale. So, those measurements could be used in combination. In this work, we combine direct measurement and image analysis to identify the pore structure of shale. Helium particle porosity and low-temperature nitrogen adsorption tests were used to obtain the porosity and specific surface area. SEM and EDS were applied for pore imaging and mineral distributions. Based on SEM images, pore identification algorithms were used to obtain the surface porosity (for simplicity, shortened to porosity) of organic and inorganic matter. In addition, three-dimensional organic matter blocks were constructed based on the high-resolution SEM images, and the connectivity of the organic matter was analyzed by the multi-point connection function.
Porosity and Specific Surface Test As for porosity, the GRI method and its corresponding improvement method are commonly used in gas porosity measurement at present [4,5]. The particle porosity of shale samples was measured by the gas expansion method using helium (He), as shown in Figure 2. This method relies on the ideal gas theory, where the pressure multiplied by the system volume is constant. The small diameter of the He molecule means that it can enter the micropores (<2 nm). Using the particle sample to reduce the impact of macroscopic fractures in the porosity analyses, the matrix porosity was measured. The shale core was ground into 40 mesh size (400 micron), dried, and then sealed in a sample cavity with a known volume for expanding tests. While the helium was injected, the pressure in the cavity was monitored, and then the porosity of the shale sample was calculated. In addition, by low-pressure adsorption test, the specific surface area of the sample was obtained according to the supercritical properties of nitrogen at low temperature and low pressure (77 K and 127 kPa). Before the test, the powder sample with a particle size of 100–130 mesh size (110–150 micron) was dried and degassed at 383 K for 4 h to remove the moisture and volatile gases, respectively. Then, the adsorption isotherm was measured in a liquid nitrogen bath at 77 K. The multi-point Brunauer-Emmet-Teller analysis method (BET) was used to obtain the specific surface area. The BET method assumes that the solid surface is uniform and multi-layer adsorption occurs; the adsorption heat of each layer except the first layer is equal to the heat of liquefaction of the adsorbate. Using the BET equation based on classical statistical theory [39], the specific surface area was calculated from the gas adsorption capacity at the relative pressure p/p0 between 0.05 and 0.35.
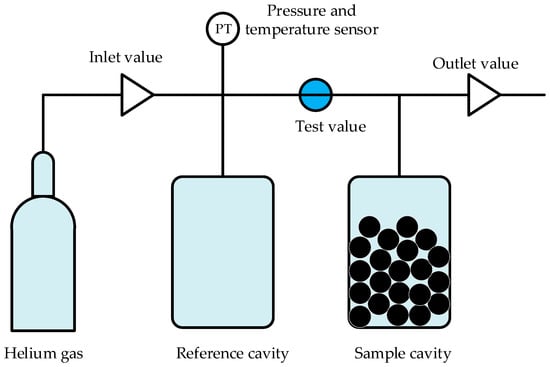
Figure 2.
Measurement of particle porosity.
SEM and EDS analysis The AmicSCAN mineral analysis electron microscope, which integrates high-resolution SEM and EDS (Figure 3), was used to obtain secondary electron images and mineral distribution images of shale samples. The samples were polished with argon ions before scanning. The gray-scale difference of pores, inorganic matter and organic matter could be captured by the high-resolution SEM images. The scanning size was 40 × 400 μm2, with the maximum resolution of 4 nm. EDS analysis could obtain the mineral composition and space distribution of the samples.
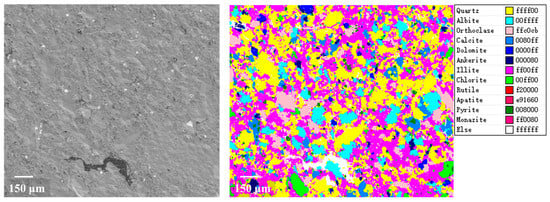
Figure 3.
SEM and EDS images.
Imaging technology was used to segment pores from SEM images, and pore recognition algorithms were used to accurately identify shale organic and inorganic pores and extract their characteristic parameters. The recognition method has been published in the previous literature [30]. The core steps of the method are: (1) performing median filtering to reduce the influence of noise, (2) smoothing the pixels using the intermediate grayscale of its surrounding pixels, (3) then separating organic matter and inorganic matter, and finally (4) extracting the organic pores and inorganic pores according to the properties of the neighborhood of the pores. Based on the extracted pore information, organic and inorganic porosities were calculated.
Three-dimensional reconstruction and connectivity probability calculation We reconstructed the three-dimensional digital core of organic matter based on a local part of the SEM image and calculated its connectivity. The reconstruction algorithm adopted the cross correlation based simulation-three step sampling method (CCSIM-TSS), which combines the CCSIM method with the three-step sampling method to increase the construction accuracy for the cores with strong heterogeneity and anisotropy [40]. Then, the connection probabilities of the organic matter were also calculated. The multiple-point connectivity probability function, a description function based on the global distribution of the pores, was used to describe spatial connectivity by calculating the connectivity probability between points in a three-dimensional space.
3.2. Gas Content Test and Analysis
The indirect method was employed in this study to analyze the relationship between gas content and pore structures and compare the gas content under different buried depths.
Adsorption gas Through high-pressure mercury intrusion and scanning electron microscopy, it was found that shale gas reservoirs are dominated by nanopores and that the nanopores provide a large number of adsorption sites. We applied strict accuracy and balance requirements in the isothermal methane adsorption measurement (Figure 4). Before analysis, the samples were dried and vacuumed at 383 K for 7 h to fully exhaust the impurity gas and water content in the inner void space. Even under the ultrahigh pressure of 60 MPa, the pressure fluctuation at equilibrium was set to 0.02 bar. Because methane adsorption has supercritical characteristics, the standard Langmuir model with two parameters was unsuitable, and the corresponding method for the conversion between different temperatures was also not applicable. The absolute adsorption capacity was calculated after fitting the adsorption isotherm at the formation temperature based on the three-parameter Langmuir model. By introducing the adsorption phase density, combined with the relationship between Gibbs excess adsorption capacity and absolute adsorption capacity, a three-parameter Langmuir model was established, as follows:
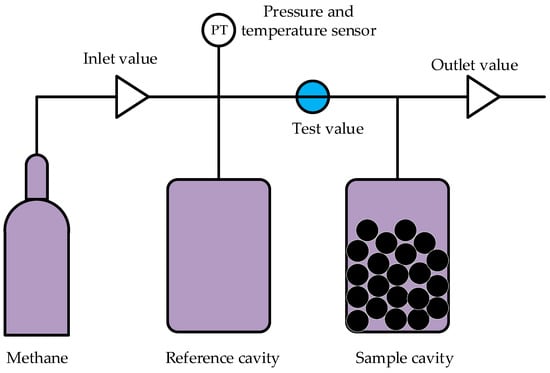
Figure 4.
Isothermal methane adsorption measurement.
Using this equation to fit the measured excess adsorption isotherms, the Langmuir volume VL, Langmuir pressure PL and adsorption phase density ρads in the equation can be obtained.
Free gas Free gas is described by the equation of state of gas. The gas-containing pore volume is the key parameter, which depends on the apparent density, porosity and gas saturation. With the formation pressure and temperature, the pore volume occupied by free gas can be converted to standard conditions. When calculating free gas, the pore volume occupied by adsorbed gas needs to be deducted. This volume can be obtained by dividing the mass of adsorbed gas by the density of the adsorbed phase. The calculation is based on the following formula:
where is the free gas density under the formation temperature and pressure, is the free gas density under the standard conditions, is the apparent density of the shale, is the adsorption gas density (densities are in g/cm3), and are the formation pressure and the standard pressure in MPa; and are the formation temperature and the standard temperature in K. is the molar mass of methane in g/mol. and are the compressibility of methane in formation and standard conditions. is the gas constant, with a value of 8.31 J/(mol·K). is the porosity of dry shale, is the ratio of the pore volume occupied by adsorption gas to the pore volume of dry shale, and is the water saturation of the shale. is the amount of absolute adsorption gas and is the free gas content in m3/t.
4. Results and Discussions
The samples collected from 20 wells were analyzed, and their basic parameters are as listed in Table 2. Table 2 shows that for shallow shale gas: (1) specific surface area was 13–30 m2/g, with an average of 23 m2/g; (2) porosity was 3–10%, with an average of 6%; (3) Langmuir volume was 2 m3/t–6 m3/t, with an average value of 4 m3/t; (4) TOC was 3–8%, with an average value of 5%; (5) water saturation was 8–36%, with an average value of 20%. For deep shale gas: (1) specific surface area was 19–30 m2/g, with an average value of 25 m2/g; (2) porosity was 2–8%, with an average value of 5%; (3) Langmuir volume was 2 m3/t–6 m3/t, with an average value of 4 m3/t; (4) TOC was 3–7%, with an average value of 5%; (5) water saturation was 8–4%, with an average value of 30%. Compared with the shallow shales, the deep shales hade larger specific surface area, lower porosity, similar Langmuir volumes, similar TOCs, and greater water saturation.
Table 2.
Measured parameters for the samples.
In order to analyze the influencing factors of the shallow and deep shale gas content, in this section, a series of parameter correlation analyses, image analyses and reconstruction calculations were performed. Through these qualitative and quantitative analyses, the differences in the main enrichment factors of the S1l11-1 sublayer were revealed.
4.1. Gas Content
First, the adsorbed gas and free gas at different buried depths were compared, as shown in Figure 5. The Y axis in Figure 5 is arranged according to depth (deeper in downward direction). Figure 5 shows that the gas content of the samples varied from 2.3 m3/t to 9.0 m3/t, with obvious differential enrichment characteristics. In addition, the proportion of adsorbed gas in the shallow samples was 36–64%, with an average of 46%, while in deep samples it was 28–63%, with an average of 44%. On the whole, the average values of the proportion of adsorbed gas in the shallow and deep samples were close, but the lower limit of the adsorbed gas in the deep samples was smaller than that of the shallow samples (28% for deep samples and 36% for shallow samples). The maximum proportion of adsorbed gas was in Well RS7 (64%), with a depth of 3454 m. The smallest proportion of adsorbed gas appeared in Well ES3 (28%), which is the deepest well investigated in this work (4337 m in depth). In fact, adsorbed gas increases with increasing pressure, but it will have an upper limit when the pressure is rising. However, the high temperature in the deep buried shale will reduce the adsorbed gas content. Hence, theoretically, the adsorbed gas content will have a maximum value at a given depth. Figure 5b shows the maximum adsorption gas content is at the depth of about 2600 m in this study.
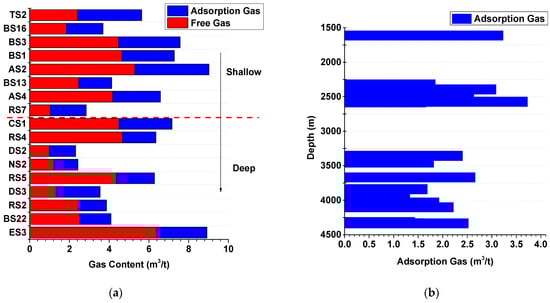
Figure 5.
Comparison of gas content. (a) Total gas content. (b) Adsorption gas content.
Existing studies have shown that gas content of shale is mainly controlled by hydrocarbon generation capacity, storage capacity and preservation conditions [41,42]. Among them, hydrocarbon generation capacity is mainly controlled by the content, type and thermal maturity of organic matter, and gas storage capacity is mainly affected by porosity (controlling free gas) and specific surface area (controlling adsorbed gas) [43]. Natural gas preserved in shale reservoirs will escape during tectonic movement, which will destroy the original overpressure system and release shale gas, and formation pressure can reflect the preservation conditions. The types and maturities of organic matter in the study area were similar (kerogen was type I and type II1, Ro was 2.0–3.7%). Therefore, the differences in gas content may be caused by differences in organic matter content, specific surface area, porosity and preservation conditions. In order to identify the main controlling factors for the gas content of such a thin sublayer, we analyzed the correlations between gas content with specific surface area, formation pressure, TOC, and porosity, as shown in Figure 6, Figure 7, Figure 8 and Figure 9.
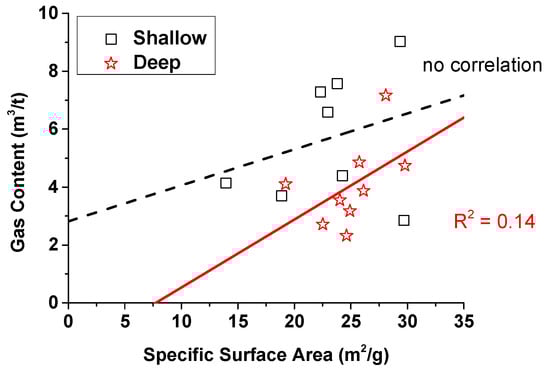
Figure 6.
Relationship between gas content and specific surface area.
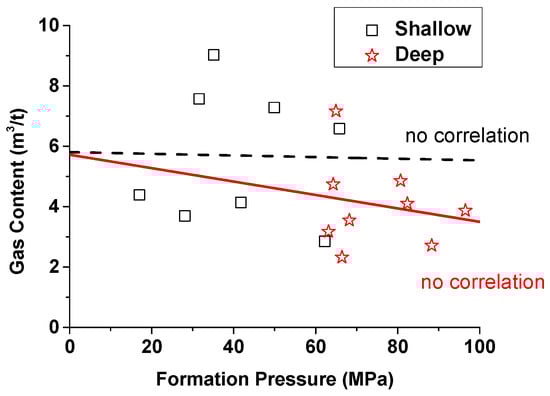
Figure 7.
Relationship between gas content and formation pressure.
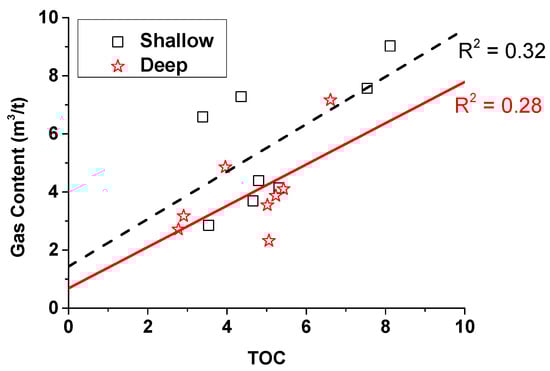
Figure 8.
Relationship between gas content and TOC.
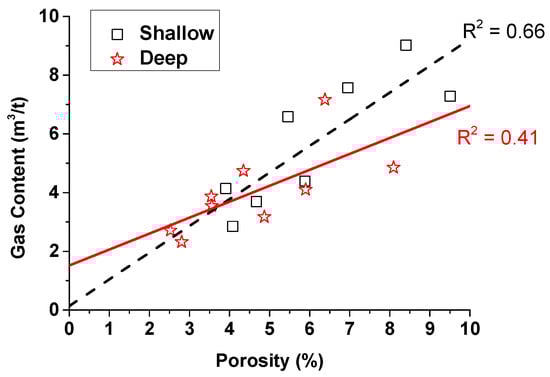
Figure 9.
Relationship between gas content and porosity.
Figure 6 shows that gas content in the samples had almost no correlation with the specific surface area, and the range of specific surface area of the shallow shale was close to that of the deep shale. The average value of the specific surface area of the shallow samples was 23 m2/g, and for the deep samples, 25 m2/g. The specific surface area affects the adsorption capacity, which in turn affects the content of adsorbed gas. It can also be seen from the previous analysis that the adsorbed gas in the shallow samples and the deep samples was close, which was consistent with the trend for the specific surface area [29]. However, free gas is also important in gas content. From the overall relationship between gas content and specific surface area, the specific surface area is not the main factor controlling gas content.
Figure 7 shows the relationship between gas content and formation pressure. It can be seen from Figure 7 that there was also no obvious correlation between gas content and formation pressure. The formation pressure of the deep shale was generally higher than that of the shallow shale, but the range of its gas content was smaller than that of the shallow shale. The pressure coefficient (calculated by dividing the formation fluid pressure by the hydrostatic pressure at that depth) of shallow shale was 1.0–2.0, with an average value of 1.5, and the pressure coefficient of the deep shale was 1.0–2.2, with an average of 1.8. Results showed that the S1l11-1 sublayer is generally in an overpressure environment, and the pressure coefficient of the deep shale is slightly higher than that of the shallow shale. A high pressure coefficient indicates better preservation conditions. Although there were differences in formation pressure between the shallow and deep shale formations, results showed that formation pressure was also not the main factor controlling the gas content in the S1l11-1 sublayer in the study area.
Then, we analyzed the correlation between gas content and TOC. Figure 8 shows that the gas content and TOC had a weak positive correlation, and the correlation between the shallow layers was similar to that of the deep layers (R2 = 0.32 for the shallow layers and R2 = 0.28 for the deep layers). For the S1l11-1 sublayers in the study area, the type and maturity of organic matter was similar. TOC controls the enrichment of organic matter and further controls the source of hydrocarbon generation. Long et al. [10] found that the vertical distribution of gas content has an obvious positive correlation with TOC for the Longmaxi Formation shale with deeply buried layers. Qiu et al. [2] compiled a statistical analysis of the gas content and TOC of nearly 400 samples of Wufeng-Longmaxi Formation shale from the Weiyuan, Changning, Fuling, and Wuxi blocks, and also found a good correlation between the gas content and TOC. Therefore, they pointed out that TOC content is the main controlling factor for shale gas enrichment, as (1) organic matter has a relatively high hydrocarbon-generating potential; (2) a large number of nano-scale pores formed and provided a huge storage space for shale gas due to the pyrolysis of organic matter during the hydrocarbon generation process. It is worth noting that in these studies, the samples were from multiple layers in the Wufeng-Longmaxi Formation. In this study, we only focused on the gas content inside a thin layer, S1l11-1; the results showed only a week correlation between gas content and TOC.
Figure 9 shows that gas content has a positive correlation with porosity, and the correlation between the shallow layers is better than that of the deep layers (R2 = 0.66 for the shallow layers and R2 = 0.41 for the deep layers). Porosity controls the storage capacity of the reservoir. Shu et al. [42] found the total gas content of Longmaxi shale samples from the North Jiaoshiba area to be positively correlated with porosity, while for the shale samples from the South Jiaoshiba area, there was no correlation. Jiang et al. [44] pointed out that shale pores have a significant influence on adsorbed gas and free gas; mesopores and micropores control the free gas, while micropores control the adsorbed gas. It has been observed that gas flows in shale disobey Darcy’s law due to the existence of slip and other nonlinear behavior such as adsorption. The gas transport in shale is dependent on the gas type, temperature, pressure, and other factors. The equation proposed by Javadpour [15,16] considering the slip and Knudsen diffusion effect is relatively complete and widely used. Tang et al. [45] found that for the Wufeng-Longmaxi Formation of the Upper Yangtze Paleozoic, the gas content is mainly controlled by TOC and porosity, and the porosity has the best correlation. In this study, through quantitative correlation research and analysis, the correlations between gas content and specific surface area, formation pressure, TOC, and porosity were compared, and the correlation coefficient between gas content and porosity was the highest. It can be seen that the gas content of the S1l11-1 sublayer is mainly by porosity.
4.2. Mineral Composition and Pore Composition
For shale, the pores are mainly composed of inorganic pores, organic pores and micro-fractures (or micro-cracks). Due to the diverse pore composition, first, the mineral compositions of the samples were obtained through EDS, as shown in Figure 10.
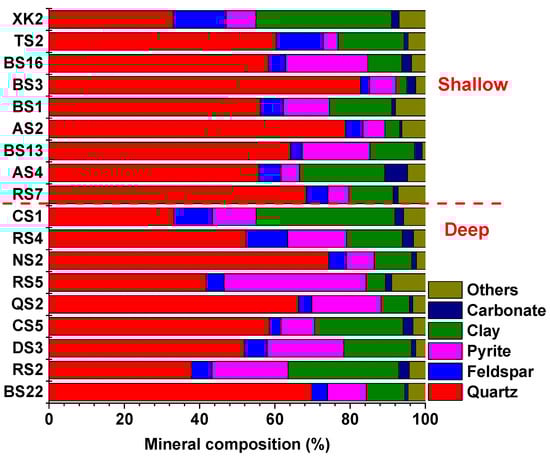
Figure 10.
Mineral composition.
For the shallow samples, (1) quartz accounted for 33–83%, with an average of 62%; (2) feldspar accounted for 2% to 14%, with an average of 7%; (3) carbonate accounted for 4–22%, with an average of 10%; (4) clay accounted for 3% to 36%, with an average of 15%; (5) pyrite accounted for 1% to 6%, with an average of 2%. For deep samples, (1) quartz accounted for 33% to 74%, with an average of 54%; (2) feldspar accounted for 3% to 11%, with an average of 6%; (3) carbonate accounted for 7–38%, with an average of 17%; (4) the proportion of clay was 5–37%, with an average of 17%; (5) the proportion of pyrite was 1–3%, with an average of 2%. Most of the samples were siliceous shale, with a small amount of clayey siliceous mixed shale (Figure 11). Furthermore, the brittle mineral index [46] of the sample was calculated. The brittle mineral index of the shallow samples was 43–89%, with an average value of 71%; while for the deep samples it was 41–81%, with an average value of 61%.
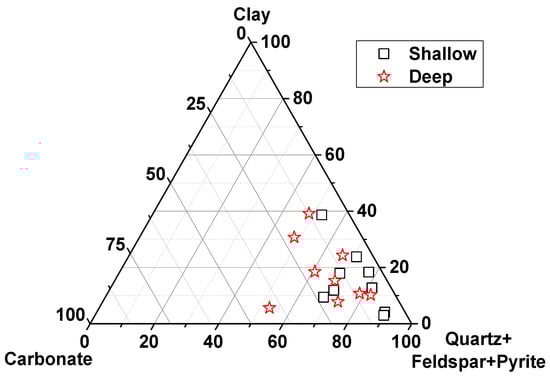
Figure 11.
Ternary diagram of mineral composition.
In summary, the deep layer samples had the same content of feldspar and pyrite as those from the shallow layer, but had higher carbonate and clay content and a smaller index of brittle minerals. In brittle shale, it is easy to form natural cracks and induced cracks, which is conducive to gas flow. Studies have shown that the Barnett shale in Fort Worth Basin has high production, in addition to its high gas content; the brittleness and its positive response to fracturing stimulation are also important. In general, the brittleness index of the S1l11-1 sublayer was generally higher than 40% in both the shallow layer and the deep layer. The deep layer samples had relatively lower brittle mineral content, which is disadvantageous due to the higher requirements it places on hydraulic fracturing.
We then performed pore extraction using SEM images. The compositions of organic pores, organic fractures, inorganic pores and inorganic fractures of the samples were calculated as shown in Figure 12. We derived the surface porosity from the 2D SEM scans. Though SEM provides images of pore surfaces in 2D, assuming the same pore size distribution of each layer of a 3D cubic core, it is theoretically feasible to calculate the pore volume per unit volume of shale from the representation in SEM. The porosity is measured by gas expansion and is the effective porosity connected with the boundary face. SEM obtained the total porosity in shale. We believe that the fraction of organic porosity and inorganic porosity from SEM can serve as a standard for the fraction in 3D shale samples. Comparing matrix pores (organic pores and inorganic pores) with fractures (organic fractures and inorganic fractures), the average fraction of fracture porosity to total porosity in the shallow shale samples was 3%, whereas the fraction in the deep shale samples was 8%. Results showed that the matrix pores accounted for the majority of the S1l11-1 sublayer. This is consistent with the findings of Wang et al. [22] on the deeply buried Wufeng-Longmaxi shale.
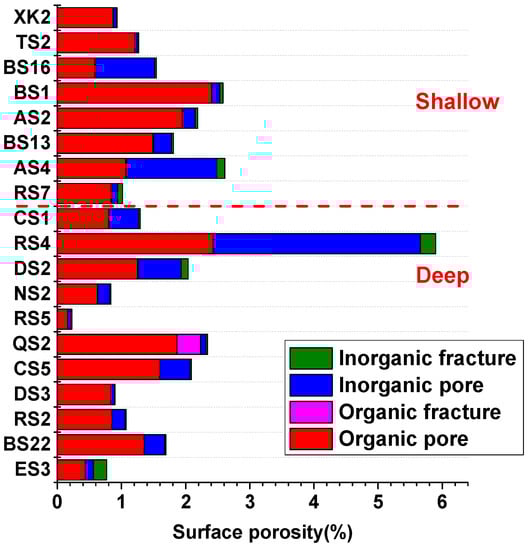
Figure 12.
Diagram of pore composition.
In the matrix pores, for the shallow layers: (1) the organic porosity was 0.59% to 2.41%, with an average of 1.30%; (2) the inorganic porosity was 0.04% to 1.41%, with an average of 0.39%. For the deep layer: (1) the organic porosity was 0.16–2.43%, with an average of 1.11%; (2) the inorganic porosity was 0.05–3.23%, with an average of 0.53%. The organic porosities of the deep and shallow shale samples were similar, but the inorganic porosity in the deep samples was generally larger than in the shallow samples. Previous study shows that the organic pore diameter of the Wufeng-Longmaxi Formation in southern China is mainly distributed in the range of 50–300 nm, and organic pores account for more than 50% of the total shale porosity; the abundance of organic matter is the dominating enrichment factor [47]. However, we found that in samples from the deep S1l11-1 sublayer in the study area, inorganic pores had a greater contribution. The proportion of inorganic pores in the matrix pores could reach 57%, which was different from the usual understanding of shale pores (as consisting of mainly organic pores).
Finally, quantitative correlations between (total) porosity and organic and inorganic porosity were analyzed, as shown in Figure 13 and Figure 14. Results show that the porosity of the shallow samples correlated well with the organic porosity (R2 = 0.67), while there was no correlation with inorganic porosity. However, for deep shale gas, there were certain correlations between total porosity and both organic and inorganic porosity (R2 = 0.46 and 0.37). The Result suggest that the porosity of the shallow samples was mainly controlled by organic pores, but that the porosity of the deep samples was controlled by both organic and inorganic pores. Sun et al. [48] studied the shallow shale in Xishui area, Guizhou Province, and found that the gas content is linearly related to organic porosity, but had almost no correlation with inorganic porosity. Results for the shallow samples in this work were consistent with Sun et al. The important finding in this work was that for the deep layer, the porosity of the sample correlated with both the organic and inorganic porosity. In this regard, there was a clear difference between the shallow layer and the deep layer. It can be assumed that for the deeply buried S1l11-1 sublayer, the contribution of inorganic pores to gas content cannot be ignored, but both inorganic and organic pores are important. The inorganic pores provide significant storage space for free gas in deep shale, and their contribution calls for more attention.
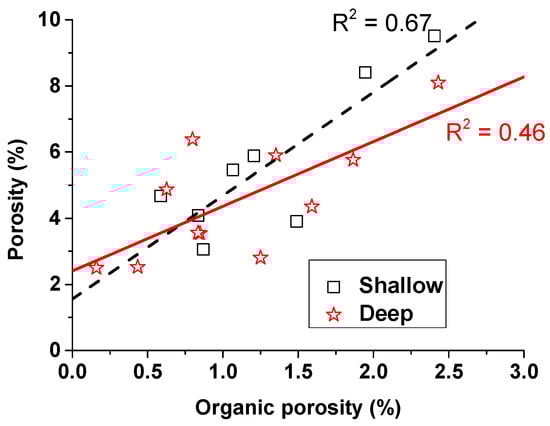
Figure 13.
The correlation between porosity and organic porosity.
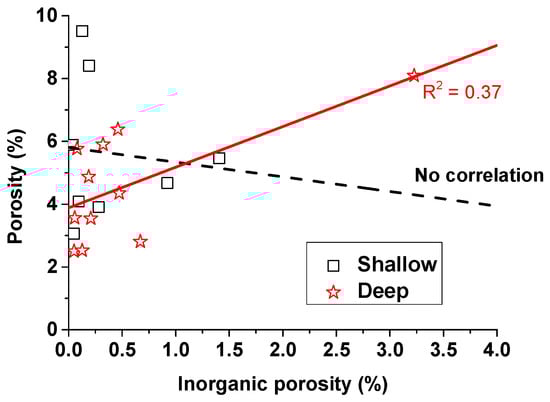
Figure 14.
The correlation between porosity and inorganic porosity.
4.3. Organic Pores
In Section 4.2, we found that the porosity of the S1l11-1 sublayer with shallow buried depth is mainly controlled by organic pores, while the porosity in the deep layer is controlled by both organic and inorganic pores. Furthermore, we hope to identify the factors controlling of organic porosity and inorganic porosity.
When analyzing organic porosity, it was directly inferred that organic porosity is linearly related with TOC. From this, we statistically analyzed the relationship between organic porosity and TOC, as shown in Figure 15. Figure 15 shows that there was almost no correlation between organic porosity and TOC. The TOC of the samples was mainly concentrated between 3% and 6%, while the organic porosity ranged between 0.1% and 3%. For samples with similar TOC, organic porosity may be several times different.
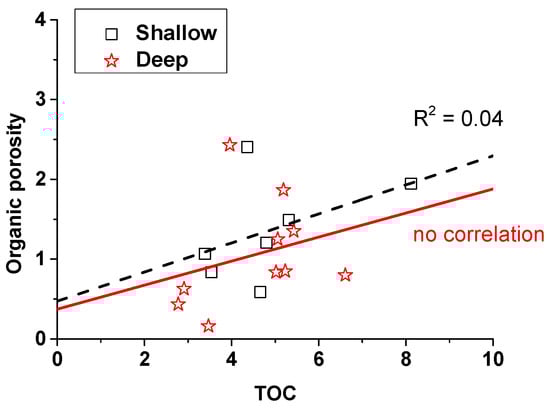
Figure 15.
The relationship between organic porosity and TOC.
Organic porosity and TOC were not well-correlated. Even when samples had similar levels of TOC, their organic porosity varied significantly, indicating that the pore development potential in different samples could be very different. The SEM image shows visual evidence for the difference. According to the SEM image, several common types of organic pore structures could be extracted, as shown in Figure 16.
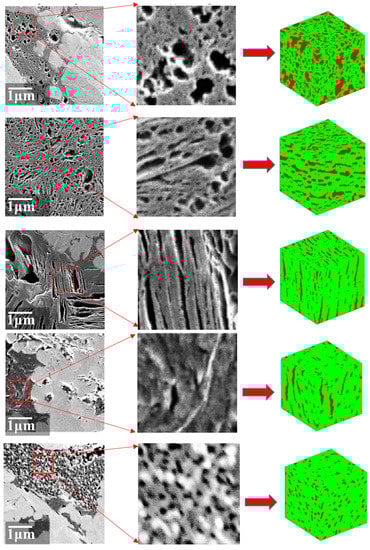
Figure 16.
Pore structure of organic matter.
Figure 16 shows that there were major differences in the types of organic pore structures. The pores were elliptical, rounded, amorphous, and slit-shaped, with strong heterogeneity. Organic pores were distributed in the asphaltene, kerogen and the composite system of organic matter and inorganic minerals. The pore development potential of organic matter was different, leading to strong heterogeneity in the organic porosity of the samples.
Based on SEM images of these samples, we extracted the main types of organic pore structures in the samples, used the CCSIM-TSS reconstruction algorithm to obtain the three-dimensional structure of the organic pores, and calculated the connectivity of the organic pores, as shown in Figure 17. For a pore pixel in space, at a certain connected distance, the ratio of the pore pixels connected to it to the pixels on the distance plane is the connection probability. The intersection of the curve and the ordinate is the porosity of the three-dimensional body, and the intersection of the curve and the abscissa is the distance between the farthest connected pixels in the three-dimensional body. The more fluctuation in the curve, the stronger the heterogeneity.
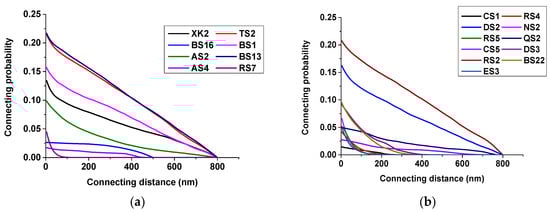
Figure 17.
(a) Pore connectivity of organic matter in shallow samples, (b) Pore connectivity of organic matter in deep samples.
Figure 17 shows large heterogeneity in the connectivity of organic pores in both shallow and deep samples. As for single pores developed in asphaltenes and kerogen, their connectivity was usually poor. However, organic pores developed in structural kerogen and inside organic and inorganic mineral composite systems hade relatively good connectivity. The quality of connectivity affects the storage capacity and transport capacity of organic matter. For organic matter, the internal 3D porosity is between 0–25%, and the maximum connecting distance is greater than 100 nm. Among the shallow samples, the organic matter of TS2 and BS13 wells had the best connectivity. For deep shale samples, the organic matter of RS2 well had the best connectivity.
4.4. Inorganic Pores
The contribution of inorganic pores to the gas content of deep shale cannot be ignored. Then, what factors affect the inorganic pores? This question is more worthy of attention.
The main types of inorganic pores are shown in Figure 18; there are inter-particle pores, inter-crystalline pores, intra-particle pores and inter-layer pores. In addition to pores, micro-cracks have also developed. (1) Inter-particle pores are mainly developed between mineral particles, mostly triangular, polygonal, and slit-shaped. For example, the pores developed between brittle mineral particles are angular, with a pore size of up to 10 micrometers. Such pores are usually caused by brittle minerals such as quartz and feldspar; the particles support each other. (2) Pyrite’s inter-crystalline pores are formed during the growth of pyrite crystals that are not tightly packed, and mostly appear as strawberry-like monomers or aggregates. Pyrite is closely related to the occurrence of organic matter. (3) The intra-particle pores are in the shape of pits, with a pore diameter of up to a few microns, and are elliptical or nearly circular. This type of pore is mainly formed by chemical reaction and dissolution between organic acids, carbon dioxides with quartzes, feldspars, and carbonates. (4) The inter-layer pores of clay minerals are mainly formed in the clay edges and surface connections. They are widely distributed and have good connectivity. They are important gas flow channels for shale. (5) The micro-cracks are long strips, which are mainly caused by stress effects of sedimentation, diagenesis and microstructures.
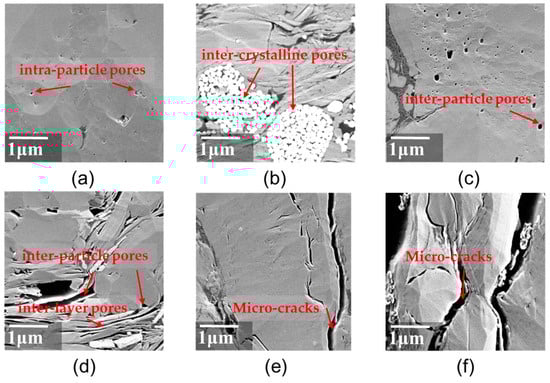
Figure 18.
Inorganic pores. (a) inter-particle pores, (b) pyrite’s inter-crystalline pores, (c) inter-particle dissolution pores, (d) inter-particle and inter-layer pores, (e) and (f) micro-cracks.
Furthermore, the relationship between inorganic porosity and mineral composition was analyzed, as shown in Figure 19. With the increase in carbonate, clay and quartz content, the inorganic porosity first increases and then decreases. In the ternary diagram, the influence of mineral composition on inorganic porosity has a peak, and larger inorganic porosity is concentrated near the optimal mineral composition. For the samples in the study area, when the content of quartz plus feldspar plus pyrite is about 70%, the inorganic porosity is the largest. Guo et al. [49] found that for carbonate mineral content < 10%, the carbonate mineral content correlated poorly with shale porosity, whereas for carbonate mineral content > 10%, shale porosity decreased with increasing carbonate content. Our results were consistent with their studies. Clay minerals have more micropores and a larger specific surface area, and have a strong adsorption capacity for gas. Especially in the shale with low organic carbon content, the adsorption of illite is very significant, but under water saturation the adsorption capacity of clay minerals is reduced; therefore, the influence of clay minerals on gas content has positive and negative sides [50]. Results in this work showed that inorganic porosity first increases then decreases with increases in carbonate, clay and quartz content. In this study, we found that the degree of inorganic pore development was not controlled by a single mineral, but by the composition percentage of multiple minerals. More importantly and practically, we found that the largest values for inorganic porosity were concentrated near an optimal mineral composition with the content of quartz plus feldspar plus pyrite of about 70%.
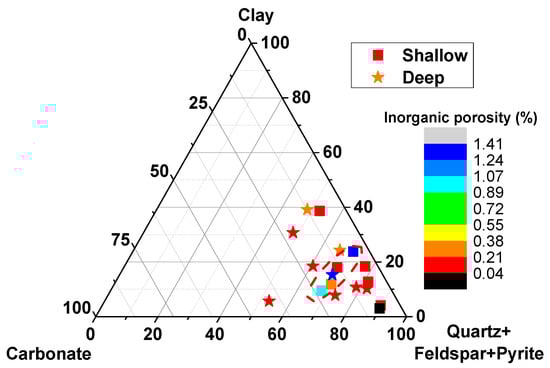
Figure 19.
Relationship between inorganic porosity and mineral composition. The red dash line delineates the optimal mineral composition for large inorganic porosity.
5. Conclusions
In this work, we combined a variety of experimental tests and calculation analyses to compare the pore structure and gas enrichment difference of S1l11-1 sublayer shale gas with both shallow and deep buried depths. Results showed that though the S1l11-1 sublayer is the sweet layer in our study area, the gas content of the S1l11-1 sublayer also possesses obvious differential enrichment characteristics. The deep layer has relatively lower brittle mineral content, which is disadvantageous in that it imposes higher requirements for hydraulic fracturing. By comparing the correlations between gas content and specific surface area, formation pressure, TOC and porosity, respectively, we found that porosity dominates the gas content. The interesting finding here was, among the matrix pores, that porosity of the shallow samples was mainly controlled by the organic porosity, while the porosity of the deep samples correlated well with both the organic and inorganic porosity (R2 = 0.46 and 0.37). Our understanding of the shallow layer is consistent with the conventional understanding, that is, the porosity of shale is controlled by organic pores; whereas for the deep layer, inorganic pores and organic pores are equally important. The inorganic pores provide significant storage space for free gas in deep shale; their contribution thus calls for more attention. Results also showed that for the S1l11-1 sublayer, the organic matter pore structure is controlled by its pore development potential, while the degree of inorganic pore development is not controlled by a single mineral but by the composition ratio of multiple minerals. The largest inorganic porosity was concentrated near the optimal mineral composition when the content of quartz plus feldspar plus pyrite accounted for about 70%.
It is recommended that a refined reservoir evaluation method focusing on high-resolution measurement of pore structure and organic/inorganic pore analysis technology be established to provide support for the exploration and development of deep shale gas in the Wufeng-Longmaxi Formation. Further work is needed to fully analyze the differences between organic and inorganic pores from the aspects of sedimentary environment, diagenesis, structural evolution, etc. This will further improve the link between enrichment factors and engineering applications.
Author Contributions
Conceptualization, X.S., C.L. and G.C.; methodology, G.C. and M.L.; software, W.J.; validation, Y.H., Y.L. and K.Z.; formal analysis, C.L. and G.C.; investigation, G.C.; resources, Y.H., Y.L. and K.Z.; writing—original draft preparation, X.S., C.L. and G.C.; writing—review and editing, G.C. All authors have read and agreed to the published version of the manuscript.
Funding
This work is funded by the National Natural Science Foundation of China (Grant No. 42030808), the National Natural Science Foundation of China (Grant No. 41690132), the Strategic Priority Research Program of the Chinese Academy of Sciences (Grant No. XDA14010304), the National Natural Science Foundation of China (Grant No. 41872163), and Major Engineering Technology Field Test Project of China National Petroleum Corporation (Grant No. 2019F-31-01).
Institutional Review Board Statement
Not applicable.
Informed Consent Statement
Not applicable.
Acknowledgments
This work is supported by the National Natural Science Foundation of China (Grant No. 42030808), the National Natural Science Foundation of China (Grant No. 41690132), the Strategic Priority Research Program of the Chinese Academy of Sciences (Grant No. XDA14010304), the National Natural Science Foundation of China (Grant No. 41872163), and Major Engineering Technology Field Test Project of China National Petroleum Corporation (Grant No. 2019F-31-01).
Conflicts of Interest
The authors declare no conflict of interest.
References
- Xu, H.; Zhou, W.; Zhang, R.; Liu, S.; Zhou, Q. Characterizations of pore, mineral and petrographic properties of marine shale using multiple techniques and their implications on gas storage capability for Sichuan Longmaxi gas shale field in China. Fuel 2019, 241, 360–371. [Google Scholar] [CrossRef]
- Qiu, Z.; Zou, C.; Wang, H.; Dong, D.; Wei, L. Discussion on the characteristics and controlling factors of differential enrichment of shale gas in the Wufeng-Longmaxi formations in south China. J. Nat. Gas Geosci. 2020, 5, 117–128. [Google Scholar] [CrossRef]
- Zhang, M.; Zou, C.; Guan, P.; Dong, D.; Sun, S.; Shi, Z.; Li, Z.; Feng, Z.; Lila, M. Pore-throat characteristics of deep shale gas reservoirs in south of Sichuan Basin: Case study of Longmaxi Formation in Well Z201 of Zigong area. Nat. Gas Geosci. 2019, 30, 1349–1361. [Google Scholar]
- Fu, Y.; Jiang, Y.; Wang, Z.; Hu, Q.; Xie, J.; Ni, G.; Lei, Z.; Zhou, K.; Liu, X. Non-connected pores of the Longmaxi shale in southern Sichuan Basin of China. Mar. Pet. Geol. 2019, 110, 420–433. [Google Scholar] [CrossRef]
- Sun, J.; Dong, X.; Wang, J.; Schmitt, D.R.; Xu, C.; Mohammed, T.; Chen, D. Measurement of total porosity for gas shales by gas injection porosimetry (GIP) method. Fuel 2016, 186, 694–707. [Google Scholar] [CrossRef]
- Guo, X. Major factors controlling the shale gas accumulations in Wufeng-Longmaxi Formation of the Pingqiao Shale Gas Field in Fuling Area, Sichuan Basin, China. J. Nat. Gas Geosci. 2019, 4, 129–138. [Google Scholar] [CrossRef]
- Ma, X.; Wang, H.; Zhou, S.; Shi, Z.; Zhang, L. Deep shale gas in China: Geological characteristics and development strategies. Energy Rep. 2021, 7, 1903–1914. [Google Scholar] [CrossRef]
- Cao, X.; Wang, M.; Kang, J.; Wang, S.; Liang, Y. Fracturing technologies of deep shale gas horizontal wells in the Weirong Block, southern Sichuan Basin. Nat. Gas Ind. B 2020, 7, 64–70. [Google Scholar] [CrossRef]
- Li, Y. Mechanics and fracturing techniques of deep shale from the Sichuan Basin, SW China. Energy Geosci. 2021, 2, 1–9. [Google Scholar] [CrossRef]
- Long, S.; Feng, D.; Li, F.; Du, W. Prospect analysis of the deep marine shale gas exploration and development in the Sichuan Basin, China. J. Nat. Gas Geosci. 2018, 3, 181–189. [Google Scholar] [CrossRef]
- Huang, C. China’s first million-square-meter shale gas well was born. Pet. Explor. Dev. 2019, 46, 151. [Google Scholar]
- Shah, M.; Shah, S.; Sircar, A. A comprehensive overview on recent developments in refracturing technique for shale gas reservoirs. J. Nat. Gas Sci. Eng. 2017, 46, 350–364. [Google Scholar] [CrossRef]
- Hu, X.; Xie, J.; Cai, W.; Wang, R.; Davarpanah, A. Thermodynamic effects of cycling carbon dioxide injectivity in shale reservoirs. J. Pet. Sci. Eng. 2020, 195, 107717. [Google Scholar] [CrossRef]
- Ebadati, A.; Akbari, E.; Davarpanah, A. An experimental study of alternative hot water alternating gas injection in a fractured model. Energy Explor. Exploit. 2018, 37, 945–959. [Google Scholar] [CrossRef]
- Javadpour, F.; Fisher, D.; Unsworth, M. Nanoscale Gas Flow in Shale Gas Sediments. J. Can. Pet. Technol. 2007, 46, 55–61. [Google Scholar] [CrossRef]
- Javadpour, F. Nanopores and Apparent Permeability of Gas Flow in Mudrocks (Shales and Siltstone). J. Can. Pet. Technol. 2009, 48, 16–21. [Google Scholar] [CrossRef]
- Li, J.; Wu, Q.; Jin, W.; Lu, J.; Nan, Z. Logging evaluation of free-gas saturation and volume content in Wufeng-Longmaxi organic-rich shales in the Upper Yangtze Platform, China. Mar. Pet. Geol. 2019, 100, 530–539. [Google Scholar] [CrossRef]
- Gao, Q.; Han, S.; Cheng, Y.; Li, Y.; Yan, C.; Han, Z. Apparent permeability model for gas transport through micropores and microfractures in shale reservoirs. Fuel 2021, 285, 119086. [Google Scholar] [CrossRef]
- Davarpanah, A.; Mirshekari, B. Experimental Investigation and Mathematical Modeling of Gas Diffusivity by Carbon Dioxide and Methane Kinetic Adsorption. Ind. Eng. Chem. Res. 2019, 58, 12392–12400. [Google Scholar] [CrossRef]
- Dang, W.; Zhang, J.C.; Tang, X.; Wei, X.L.; Liu, C. Investigation of gas content of organic-rich shale: A case study from Lower Permian shale in southern North China Basin, central China. Geosci. Front. 2018, 9, 559–575. [Google Scholar] [CrossRef]
- Yuan, W.; Pan, Z.; Li, X.; Yang, Y.; Zhao, C.; Connell, L.D.; Li, S.; He, J. Experimental study and modelling of methane adsorption and diffusion in shale. Fuel 2014, 117, 509–519. [Google Scholar] [CrossRef]
- Wang, Y.; Wang, H.; Zhang, C.; Li, X.; Dong, D. Fracture pore evaluation of the Upper Ordovician Wufeng to Lower Silurian Longmaxi Formations in southern Sichuan Basin, SW China. Pet. Explor. Dev. 2017, 44, 563–572. [Google Scholar] [CrossRef]
- Saghafi, A. Discussion on determination of gas content of coal and uncertainties of measurement. Int. J. Min. Sci. Technol. 2017, 27, 741–748. [Google Scholar] [CrossRef]
- Shen, W.; Song, F.; Hu, X.; Zhu, G.; Zhu, W. Experimental study on flow characteristics of gas transport in micro- and nanoscale pores. Sci. Rep. 2019, 9, 10196. [Google Scholar] [CrossRef] [PubMed] [Green Version]
- Ma, X.; Shen, W.; Li, X.; Hu, Y.; Lu, X. Experimental investigation on water adsorption and desorption isotherms of the Longmaxi shale in the Sichuan Basin, China. Sci. Rep. 2020, 10, 1–2. [Google Scholar]
- He, Z.; Nie, H.; Hu, D.; Jiang, T.; Lu, Z. Geological problems in the effective development of deep shale gas: A case study of Upper Ordovician Wufeng-Lower Silurian Longmaxi formations in Sichuan Basin and its periphery. Acta Pet. Sin. 2020, 41, 379–391. [Google Scholar]
- Wang, J.; Yuan, Q.; Dong, M.; Cai, J.; Yu, L. Experimental investigation of gas mass transport and diffusion coefficients in porous media with nanopores. Int. J. Heat Mass Transf. 2017, 115, 566–579. [Google Scholar] [CrossRef]
- Liu, W.; Zhang, C.; Gao, G.; Luo, C.; Hu, X. Controlling factors and evolution laws of shale porosity in Longmaxi Formation, Sichuan Basin. Acta Pet. Sin. 2017, 38, 175–184. [Google Scholar]
- Jiang, W.; Cao, G.; Luo, C.; Lin, M.; Zhou, J. A composition-based model for methane adsorption of overmature shales in Wufeng and Longmaxi Formation, Sichuan Basin. Chem. Eng. J. 2021, 130766. (In press) [Google Scholar] [CrossRef]
- Cao, G.; Lin, M.; Ji, L.; Jiang, W.; Yang, M. Characterization of pore structures and gas transport characteristics of Longmaxi shale. Fuel 2019, 258, 116146. [Google Scholar] [CrossRef]
- Guo, T.; Zhang, H. Formation and enrichment mode of Jiaoshiba shale gas field, Sichuan Basin. Pet. Explor. Dev. 2014, 41, 31–40. [Google Scholar] [CrossRef]
- Yang, R.; He, S.; Wang, X.; Hu, Q.; Hu, D. Paleo-ocean redox environments of the Upper Ordovician Wufeng and the first member in lower Silurian Longmaxi formations in the Jiaoshiba area, Sichuan Basin. Can. J. Earth Sci. 2016, 53, 426–440. [Google Scholar] [CrossRef]
- Zhao, J.; Jin, Z.; Jin, Z.; Wen, X.; Geng, Y. Origin of authigenic quartz in organic-rich shales of the Wufeng and Longmaxi Formations in the Sichuan Basin, South China: Implications for pore evolution. J. Nat. Gas Sci. Eng. 2016, 38, 21–38. [Google Scholar] [CrossRef]
- Yang, R.; He, S.; Hu, Q.; Sun, M.; Hu, D.; Yi, J. Applying SANS technique to characterize nano-scale pore structure of Longmaxi shale, Sichuan Basin (China). Fuel 2017, 197, 91–99. [Google Scholar] [CrossRef]
- Li, Y. Sedimentary Facies of Marine Shale Gas Formations in Southern China:The Lower Silurian Longmaxi Formation in the Southern Sichuan Basin. J. Earth Sci. 2016, 27, 807–822. [Google Scholar] [CrossRef]
- Tang, X. Characterization of Shale Reservoir Multiscale Heterogeneity and Its Relationship with Hydrocarbon; China University of Petroleum: Beijing, China, 2017. [Google Scholar]
- Chen, J.; Lan, H.; Macciotta, R.; Wu, Y.; Li, Q.; Zhao, X. Anisotropy rather than transverse isotropy in Longmaxi shale and the potential role of tectonic stress. Eng. Geol. 2018, 247, 38–47. [Google Scholar] [CrossRef]
- Zhou, S.; Yan, G.; Xue, H.; Guo, W.; Li, X. 2D and 3D nanopore characterization of gas shale in Longmaxi formation based on FIB-SEM. Mar. Pet. Geol. 2016, 73, 174–180. [Google Scholar] [CrossRef]
- Brunauer, B.; Deming, L.S.; Deming, W.E.; Teller, E. Adsorption of gases in multimolecular layers. J. Am. Chem. Soc. 1938, 60, 309–319. [Google Scholar] [CrossRef]
- Ji, L.; Lin, M.; Jiang, W.; Cao, G. A hybrid method for reconstruction of three-Dimensional heterogeneous porous media from two-dimensional images. J. Asian Earth Sci. 2018, 178, 193–203. [Google Scholar] [CrossRef] [Green Version]
- Hu, H.; Hao, F.; Guo, X.; Dai, F.; Lu, Y.; Ma, Y. Investigation of methane sorption of overmature Wufeng-Longmaxi shale in the Jiaoshiba area, Eastern Sichuan Basin, China. Mar. Pet. Geol. 2018, 91, 251–261. [Google Scholar] [CrossRef]
- Shu, Y.; Lu, Y.; Chen, L.; Wang, C.; Zhang, B. Factors influencing shale gas accumulation in the lower Silurian Longmaxi formation between the north and South Jiaoshiba area, Southeast Sichuan Basin, China. Mar. Pet. Geol. 2019, 111, 905–917. [Google Scholar] [CrossRef]
- Zhang, Z.; Shi, Y.; Li, H.; Jin, W. Experimental study on the pore structure characteristics of tight sandstone reservoirs in Upper Triassic Ordos Basin China. Energy Explor. Exploit. 2016, 34, 418–439. [Google Scholar] [CrossRef] [Green Version]
- Jiang, Z.; Tang, X.; Zhuo, L.; Huang, H.; Yang, P.; Yang, X.; Yang, X.; Li, W.; Hao, J. The whole-aperture pore structure characteristics and its effect on gas content of the Longmaxi Formation shale in the southeastern Sichuan basin. Earth Sci. Front. 2016, 23, 126–134. [Google Scholar]
- Tang, X.; Jiang, S.; Jiang, Z.; Li, Z.; He, Z.; Long, S.; Zhu, D. Heterogeneity of Paleozoic Wufeng-Longmaxi formation shale and its effects on the shale gas accumulation in the Upper Yangtze Region, China. Fuel 2019, 239, 387–402. [Google Scholar] [CrossRef]
- Jarvie, D.M.; Hill, R.J.; Ruble, T.E.; Pollastro, R.M. Unconventional shale-gas systems: The Mississippian Barnett Shale of north-central Texas as one model for thermogenic shale-gas assessment. AAPG Bull. 2007, 91, 475–499. [Google Scholar] [CrossRef]
- Ma, Y.; Cai, X.; Zhao, P. China’s shale gas exploration and development: Understanding and practice. Pet. Explor. Dev. 2018, 4, 589–603. [Google Scholar] [CrossRef]
- Sun, J.; Xiao, X.; Wei, Q.; Cheng, P.; Tian, H.; Wu, Y. Gas in place and its controlling factors of the shallow Longmaxi shale in the Xishui area, Guizhou, China. J. Nat. Gas Sci. Eng. 2020, 77, 103272. [Google Scholar] [CrossRef]
- Guo, Q.; Jin, Z.; Geng, Y. The characteristics of carbonate minerals in the Longmaxi Formation gas shale and its impact on the reservoir performance in the Sichuan Basin. Nat. Gas Geosci. 2019, 30, 616–625. [Google Scholar]
- Chen, S.B.; Zhu, Y.M.; Wang, H.Y.; Liu, H.L.; Fang, J.H. Characteristics and significance of mineral compositions of Lower Silurian Longmaxi Formation shale gas reservoir in the southern margin of Sichuan Basin. Acta Pet. Sin. 2011, 32, 775–782. [Google Scholar]
Publisher’s Note: MDPI stays neutral with regard to jurisdictional claims in published maps and institutional affiliations. |
© 2021 by the authors. Licensee MDPI, Basel, Switzerland. This article is an open access article distributed under the terms and conditions of the Creative Commons Attribution (CC BY) license (https://creativecommons.org/licenses/by/4.0/).