Article

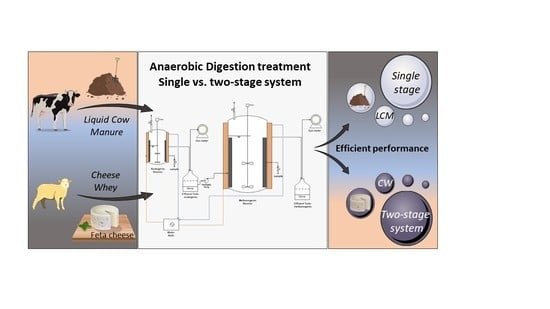
Assessment of Single- vs. Two-Stage Process for the Anaerobic Digestion of Liquid Cow Manure and Cheese Whey

by
Margarita Andreas Dareioti
1,
Aikaterini Ioannis Vavouraki
2,3,
Konstantina Tsigkou
1 and
Michael Kornaros
1,*
1
Department of Chemical Engineering, University of Patras, 1 Karatheodori str., University Campus, 26500 Patras, Greece
2
School of Mineral Resources Engineering, Technical University of Crete, 73100 Chania, Greece
3
Department of Agriculture, School of Agricultural Science, Hellenic Mediterranean University, 71004 Heraklion-Crete, Greece
*
Author to whom correspondence should be addressed.
Energies 2021, 14(17), 5423; https://doi.org/10.3390/en14175423
Submission received: 3 August 2021 / Revised: 25 August 2021 / Accepted: 26 August 2021 / Published: 31 August 2021
(This article belongs to the Special Issue Bioresource Technology for Bioenergy: Development and Trends)

Abstract

:
The growing interest in processes that involve biomass conversion to renewable energy, such as anaerobic digestion, has stimulated research in this field in order to assess the optimum conditions for biogas production from abundant feedstocks, like agro-industrial wastes. Anaerobic digestion is an attractive process for the decomposition of organic wastes via a complex microbial consortium and subsequent conversion of metabolic intermediates to hydrogen and methane. The present study focused on the exploitation of liquid cow manure (LCM) and cheese whey (CW) as noneasily and easily biodegradable sources, respectively, using continuous stirred-tank reactors for biogas production, and a comparison was presented between single- and two-stage anaerobic digestion systems. No significant differences were found concerning LCM treatment, in a two-stage system compared to a single one, concluding that LCM can be treated by implementing a single-stage process, as a recalcitrant substrate, with the greatest methane production rate of 0.67 L CH4/(LR·d) at an HRT of 16 d. On the other hand, using the easily biodegradable CW as a monosubstrate, the two-stage process was considered a better treatment system compared to a single one. During the single-stage process, operational problems were observed due to the limited buffering capacity of CW. However, the two-stage anaerobic digestion of CW produced a stable methane production rate of 0.68 L CH4/(LR·d) or 13.7 L CH4/Lfeed, while the total COD was removed by 76%.

Graphical Abstract

1. Introduction

Agro-industries, such as dairy industries and farms, display a considerable share of the Mediterranean countries’ economy. However, agro-industries processing raw feedstocks of meat, milk, cheese, and other agricultural products generate large volumes of excess of wastewaters and large amounts of by-products. Inappropriate disposal of the untreated wastewaters brings considerable environmental and health problems.
In particular, the dairy industry is widely known as one of the main industrial effluent producers in Europe [1] that processes and manufactures raw milk into various products (milk powder, cheese, yogurt, heavy cream, ice cream, butter, etc.). The traditional Greek name-protected “feta” cheese product is usually made from sheep or goats’ milk. Cheese whey (CW) effluents reach 30 m3/day (according to regional feta cheese production data [2]). A considerable number of cheese industries are scattered across the Greek mainland and, thus, large amounts of untreated CW disposal have a strong impact on the ecosystem. Worldwide, an average of about 400 billion liters of CW are produced annually [3]. CW is mostly characterized as high-strength wastewater, with increased biological oxygen demand (BOD5) and chemical oxygen demand (COD) in the ranges of 27–60 g/L and 50–102 g/L, respectively [4]. As the BOD5/COD ratio is commonly higher than 0.5, CW constitutes an easily biodegradable substrate for anaerobic or aerobic processes [5]. Significant amounts of carbohydrates (4–5%), lactose (45–50 g/L), proteins (6–8 g/L), lipids (4–5 g/L), and mineral salts (8–10%) are contained in cheese whey [6]. CW also comprises considerable lactate (0.5 g/L) and citrate amounts, vitamins, and nonprotein nitrogen compounds [7].
On the other hand, manure from dairy farms is usually comprised of 2–8% of total solid (TS), while it is described as a typical and abundant animal agriculture wastewater. Worldwide, animal waste production is constantly increasing, while an average up to 3.7 × 10⁹ tonnes of animal waste is expected to be produced annually until 2030 [8]. Dairy manure naturally includes microorganisms able to facilitate manure degradation. However, the release of many compounds, such as volatile organic compounds (VOC), can negatively affect the environment [9]. Accordingly, liquid cow manure (LCM) is fairly marked as one of the most harmful agro-industrial wastewaters. Severe environmental problems can be originated by intensive dairy farming and its large amounts of LCM, which comprise a high content of organic matter, nitrogen, and phosphorous. The inappropriate management of LCM may result to eutrophication of water bodies [10], groundwater contamination [11], air pollution by the volatilization of ammonia, or other compounds and soil degradation [12] when manure is applied in excess [13].
Biological processes offer sustainable methods to address the problems that may be caused by the uncontrolled disposal of wastes and wastewaters. Toward a circular economy, anaerobic digestion (AD) is widely applied for the treatment of the organic feedstocks and wastes, mitigating GHG emissions, recycling nutrients in the form of organic fertilizers, preventing nitrogen leakage into groundwater, and avoiding the spread of harmful diseases through landfilling. The production of biogas from AD as a low-carbon activity recognizes its valuable contribution to climate-neutrality [14].
AD in multiple stages, where the control of operating variables in each stage is facilitated, is a viable process leading thus to optimized environmental/experimental conditions for the overall process. Consequently, increased yields not only of solids removal but also of methane productivity can thus be achieved, while a higher total energy yield arises also through hydrogen generation [15]. The success of AD operation depends primarily on the type of digestion system (single- or two-stage), but also on several factors (such as pH, temperature, and nutrients), and operating parameters (like hydraulic retention time (HRT) and organic loading rate (OLR)) [16].
The two-stage AD exhibits various advantages in comparison to the conventional single-stage process. The former allows the selection and enrichment of different bacteria and archaea in each separate process stage, while the stability of the whole process can be securely maintained. In the first stage, the acidification phase is controlled, hence preventing the overloading and/or the inhibition of the methanogenic population in the main digester [17]. The separation of acidogenesis and acetogenesis (in the first stage) from methanogenesis (second stage) in a two-stage system can recover both hydrogen and methane in various ratios [17,18,19].
The widespread large-scale application and predominance of the conventional single-stage digestion system arises from their decreased operational costs and complexity [20,21]. However, pilot-scale case studies have revealed that the two-stage system operation results in a higher overall degradation efficiency and, thus, higher biogas production in comparison to the single stage [22,23,24]. The two-stage treatment process is more advantageous in comparison to the single-stage system for the treatment of the wastewaters containing a considerable fraction of recalcitrant organics such as LCM and CW. Despite the advantages of two-stage digestion systems reported in the literature [15], limited research is accessible in terms of the single- and two-stage digestion process performance comparison [25].
Notwithstanding, it remains unclear the contribution, if any, of the two-stage system compared to the conventional one concerning the anaerobic digestion of liquid cow manure and cheese whey. Chemical and microbiological aspects of such organic wastes need to be clarified by comparing the single- and the two-stage anaerobic process. The novelty of this study lies in the comparison of the two-stage AD process of two representative regional agro-industrial wastes, such as LCM and CW, over the one-stage AD. In particular, this study examined the optimum valorization of LCM and CW, as a slowly and easily biodegradable substrate respectively, for the maximization of biogas production and, overall, the evaluation of the performance efficiency of both single- and two-stage anaerobic digester operations.

2. Materials and Methods

2.1. Substrates

The tested substrates in this study were CW and LCM. More specifically, CW was produced from a regional “feta” cheese production factory with 30 m3 of wastewater production per day, located in the area of Patras (Achaia, Western Greece), whereas LCM was collected from a dairy farm, where 230 cows were bred, also located in the same region. Both wastewater samples were homogenized and stocked at −18 °C until their further use throughout the experimentation period.

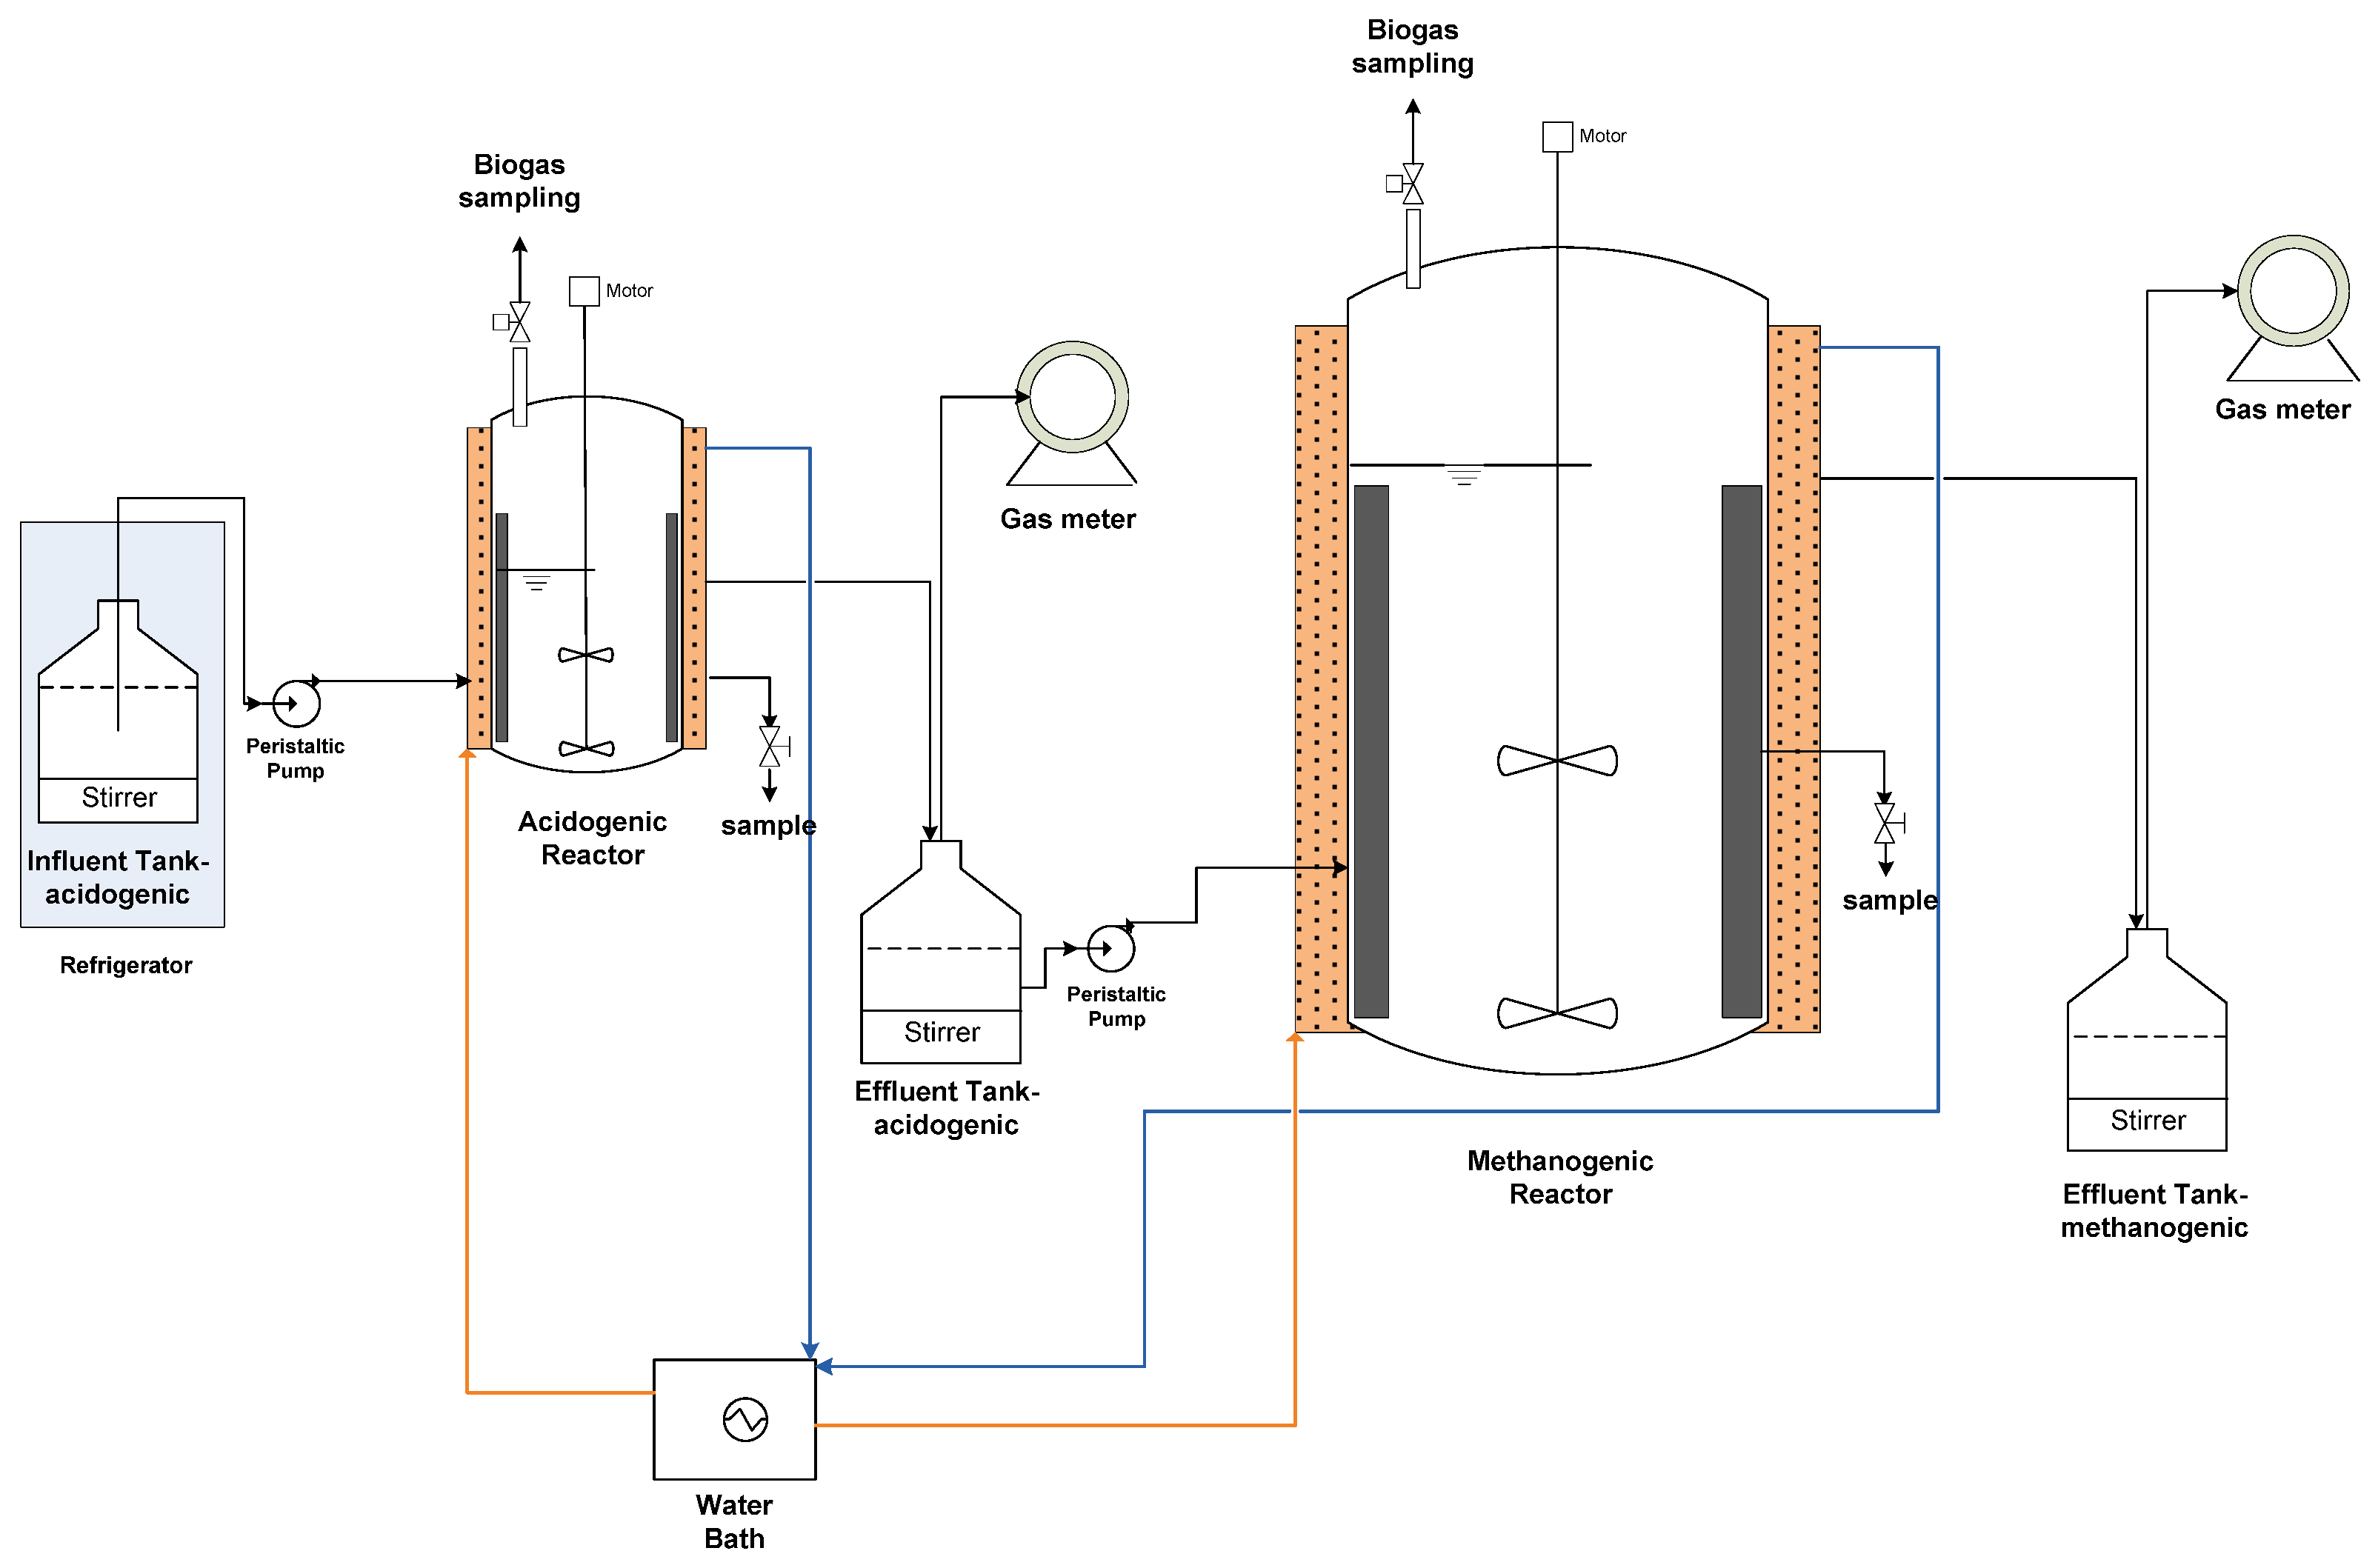
2.2. Experimental Setup

Experiments were conducted in two CSTR reactors. More specifically, the first one was used for acidogenesis, while the second one was used for methanogenesis. Regarding their construction, both anaerobic reactors were cylindrical in shape, double walled jacketed made of stainless steel (INOX 316), providing operating volumes of 750 mL and 4 L, respectively. The reactors were thermo-stated at constant mesophilic conditions (37 ± 0.2 °C) via a thermocouple controller. Agitation was applied continuously by a geared motor drive unit, which was placed on the top of each CSTR reactor, securing the continuous contact between the microorganisms and the new feedstock and facilitating the upflow of gas bubbles, while obtaining constant mesophilic temperature conditions in the working volume of each reactor. A tank full of feedstock was stored in a refrigerator for maintaining its temperature constantly at 4 °C. The anaerobic digesters were fed daily via an accurate peristaltic pump (Watson-Marlow). Furthermore, biogas production measurements were performed separately for the acidogenic and the methanogenic reactor, by two automated tailor-made devices comprising a combination of an engine oil-filled U-tube, an electron-valve, and a counter. The biogas measurement was based on counting the number of displacements of constant oil volume, as biogas was continuously produced, in each reactor’s biogas line. The experimental configuration for hydrogen and methane production is shown in Figure 1.

2.3. Reactors Operation

The experiments were performed consecutively, as described in Table 1. The first phase involved the digestion of LCM in the two-stage system configuration (E1), followed by a single-stage system operation (E2). Subsequently, the methanogenic reactor was fed with CW and tested as a single-stage (E3) and finally as a two-stage system (E4).
For the two-stage process, prior to feeding with LCM (E1), the reactors were being operated with a mixture of 80% liquid cow manure and 20% olive mill wastewater, following previous experimental work [26]; therefore, already-active inocula for hydrogen and methane production were used. Subsequently, the reactors were fed daily with 250 mL of LCM/day. Following that, the operation of the systems changed from the two-stage (E1) to single-stage (E2). After the operation of the system for LCM treatment, the methanogenic reactor was fed with CW in order to evaluate the performance of the single-stage process (E3), and finally, the system changed to two-stage operation after the connection of the acidogenic reactor to the system (E4). Prior to the two-stage operation, the acidogenic reactor was filled with CW and remained in batch mode for 72 h, activating the anaerobic inoculum, and was afterward switched to continuous mode, a method that has been widely used [27].
Using CW as substrate, alkalinity was maintained at acceptable levels by adding 14 g NaHCO3/L, while 0.50 g NH2CONH2/L was added to the feedstock, ensuring nitrogen surplus in the feed of the methanogenic reactor. Prior to acidogenesis and methanogenesis startup all CSTR reactors were flushed with argon gas for an average duration of 10 min, establishing anaerobic conditions.

2.4. Analytical Determinations

The pH measurements were implemented off-line, employing a pH-electrode (Orion 3-Star), while alkalinity, TS, volatile solids (VS), BOD5, total and soluble COD (tCOD and sCOD, respectively), total Kjeldahl nitrogen (TKN), ammonium nitrogen, total and ortho-phosphates, and fats and oils determination were carried out according to Standard Methods [28]. Proteins were estimated by multiplying TKN*6.25. For carbohydrates quantification, a colored sugar derivative was generated after L-tryptophan, sulfuric, and boric acid addition, as described in detail by Jossefson [29], and a colorimetric measurement followed at 520 nm. For the determination of soluble components’ concentration (sCOD, VFAs, soluble carbohydrates etc.), the supernatant of each sample (feedstock or effluent) was used following sample filtration through Whatman® glass microfiber filters, Grade GF/F.
Composition analysis of the produced biogas and VFAs was carried out in a gas chromatograph (Agilent Technologies 7890A), as described in detail by previous studies [19,30].

3. Results and Discussion

3.1. Chemical Composition of the Tested Wastewaters

The physicochemical characterization of both agro-industrial feedstocks is shown in Table 2. Both substrates presented high organic content, namely 76.46 ± 1.99 g COD/L for CW and 60.09 ± 1.06 g COD/L for LCM. However, significant differences in the wastewaters’ constituent amounts were identified, such as low nitrogen content in CW (0.73 ± 0.02 g TKN/L) compared to LCM (3.36 ± 0.00 g TKN/L). Additionally, LCM had a high buffering capacity as a consequence of its neutral pH (7.70 ± 0.06) and increased levels of alkalinity (12.38 ± 0.32 g CaCO3/L). The fact that alkalinity levels should remain high enough in order to avoid any destabilization and/or acidification by VFAs accumulation should be taken into consideration. Both substrates’ characteristics are in accordance with the values that have been published in previous studies [30,31,32].

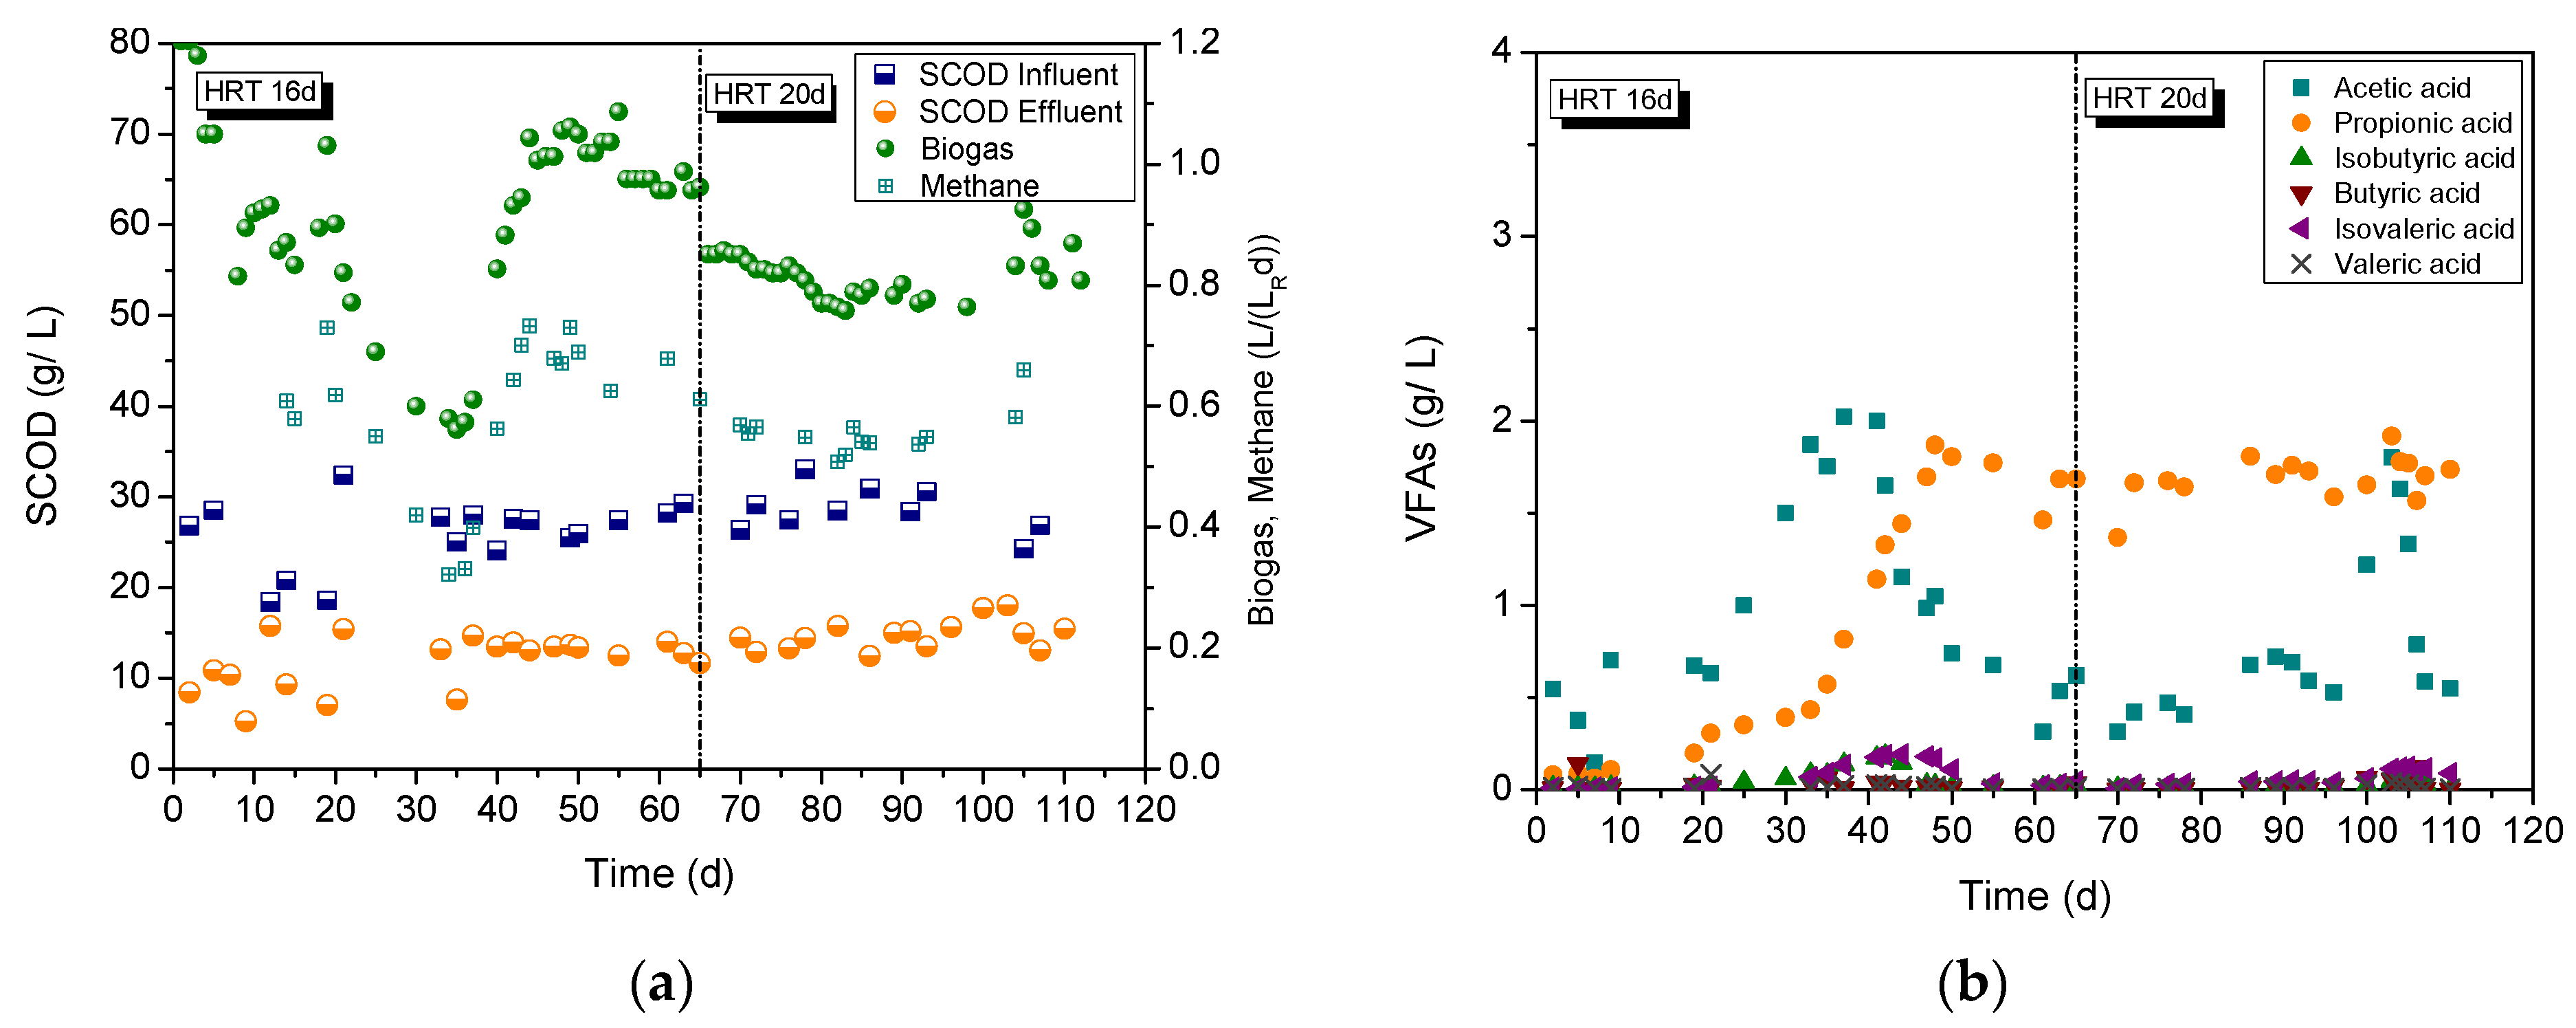
3.2. Liquid Cow Manure Treatment

To begin with, continuous operation in a two-stage system was performed (E1) with a total HRT of 19 d (3 d for the acidogenic and 16 d for the methanogenic reactor), using raw LCM as substrate. The acidogenic reactor was operated only for a period of 16 days owing to LCM being characterized by a negligible concentration of carbohydrates, so no variation in characteristics was observed. For example, the biogas production rate was very low and equal to 0.20 ± 0.06 L/(LR·d), containing 25% of methane, while hydrogen was absent. The pH value remained constant at 7.54 ± 0.20, as a result of the low VFA productivity. For this reason, the operation of a two-stage process for LCM treatment was considered insignificant.
On the contrary, the better performance of a two-stage system compared with a single-stage one was previously reported in the literature [33]. For example, Nielsen et al. [34] tested a lab-scale system in order to compare the operation of a two-stage and a conventional single-stage system for the treatment of cow manure. In this case, the two-stage system was constructed using the first and the second reactor with the following operating conditions: 68 °C and HRT of 3 d for the first one, and 55 °C and HRT of 12 d for the second one. According to their findings, the two-stage system exhibited a 6–8% higher methane yield than the conventional one. Such a result could probably be explained by the degradation of biofibers because of the thermophilic conditions established in the first reactor (68 °C).
Subsequently, the system changed from a two-stage (E1) to a single-stage configuration (E2) and the methanogenic reactor began to be fed with raw LCM at an HRT of 16 d. After 65 days of operation at the HRT of 16 d and reaching steady-state conditions in the reactor, an HRT increase to 20 d was obtained in order to investigate the possible hydrolysis of lignocellulose. The evolutions of biogas and methane produced are displayed in Figure 2a. The biogas production rate exhibited a decrease until the 35th day of operation and, after that, increased and stabilized to 1.01 ± 0.04 L/(LR·d), whereas the methane production rate followed a similar trend and, finally, under the steady-state conditions, was estimated at 0.67 ± 0.04 L CH4/(LR·d). The average composition of methane in the biogas under steady-state conditions was 66.6%, while H2S, NH3, and H2 concentrations were detected (average of 698, 79, and 142 ppm, respectively). Switching to the higher HRT of 20 d, the biogas and methane production rates declined and stabilized to 0.81 ± 0.04 L/(LR·d) and 0.56 ± 0.04 L CH4/(LR·d), respectively. The composition of methane in the biogas in this HRT value was 69%, whereas the detected H2S, NH3, and H2 concentrations remained approximately at the same levels (690, 97, and 22 ppm, respectively). The methane yields from the experimental data expressed both as mL CH4/g VSadded and mL CH4/kg CODadded are presented in Table 3. The highest methane yield of 242.16 mL CH4/g VSadded, proportional to the amount of substrate added, was obtained at an HRT 20 d. According to the published literature [33,35,36], a similar methane yield of manure (222–255 mL CH4/g VSadded) was obtained, using the biochemical methane potential (BMP) assay or continuous systems. On the other hand, Ahring et al. [37] studied the influence of temperature (55 and 65 °C) on the cattle manure treatment using CSTR reactors with methane yields of 202 and 165 mL CH4/g VSadded, respectively.
The methane production is a result of VFAs and, especially, acetic acid conversion to methane. The LCM was characterized by a high VFA concentration (10.41 ± 1.63 g/L) with approximately 7.45 ± 1.19 g acetic acid/L and 1.77 ± 0.21 g propionic acid/L. As shown in Figure 2b, the operation of the methanogenic reactor from the previous scenarios [26] started with 0.67 g tVFAs/L, mainly due to the acetic acid concentration (81.7% of tVFAs). After the period of 20 days, the reactor’s performance was partially hindered due to acetic acid accumulation (up to 2.02 g/L), followed by biogas and methane reduction. However, the acclimatized methanogenic population proved capable of coping with such increased acetic acid concentration, which was subsequently converted to methane reaching thus lower concentration values (0.54 ± 0.14 g acetic acid/L) at the steady-state conditions, indicating the importance of a robust and acclimatized anaerobic inoculum. Simultaneously, the propionic acid concentration gradually increased up to 1.68 ± 0.12 g/L (the influent concentration of propionic acid, approximately) and, afterward, stabilized. This could be explained by the washout of the previous feedstock (80% liquid cow manure and 20% olive mill wastewater), in which the microbial population could convert the existing propionic acid to methane [26]. An increase in pH value was observed from 7.64 ± 0.20 (influent) to 7.85 ± 0.10 (effluent) for both HRTs. Moreover, the alkalinity in the reactor was further increased to 22.77 ± 1.08 g CaCO3/L and 25.12 ± 0.19 g CaCO3/L for the HRTs of 16 d and 20 d, respectively. Due to the high alkalinity levels, the pH was not decreased during the whole experimentation period, even though tVFAs reached up to 4 g/L for an HRT of 20 d. The evolution of sCOD in the methanogenic reactor is plotted in Figure 2a. The sCOD removal during the HRT of 16 d was calculated at 49.9% (mean value), whereas at an HRT of 20 d, it was slightly lower (48.2%, mean value). The tCOD removal for both HRTs under the steady-state conditions was 20%, confirming the recalcitrance of such a substrate. On the other hand, the removal efficiencies, in terms of TS and VS, were higher for the case of an HRT of 16 d and equal to 19.9% and 30.3%, respectively, compared to the HRT of 20 d (11.3% and 19.6%, respectively). The mean value of TKN concentration in the effluent was 5.2 g/L, whereas the ammonia nitrogen mean concentration was 3.0 g NH3-N/L for both HRT values. Both lower TS and VS removals at an HRT of 20 d where higher yields are typically expected could be attributed to the accumulation of propionic acid and/or ammonia nitrogen, above the tolerance limits [38,39], leading to mild (and probably reversible) inhibition of the process.

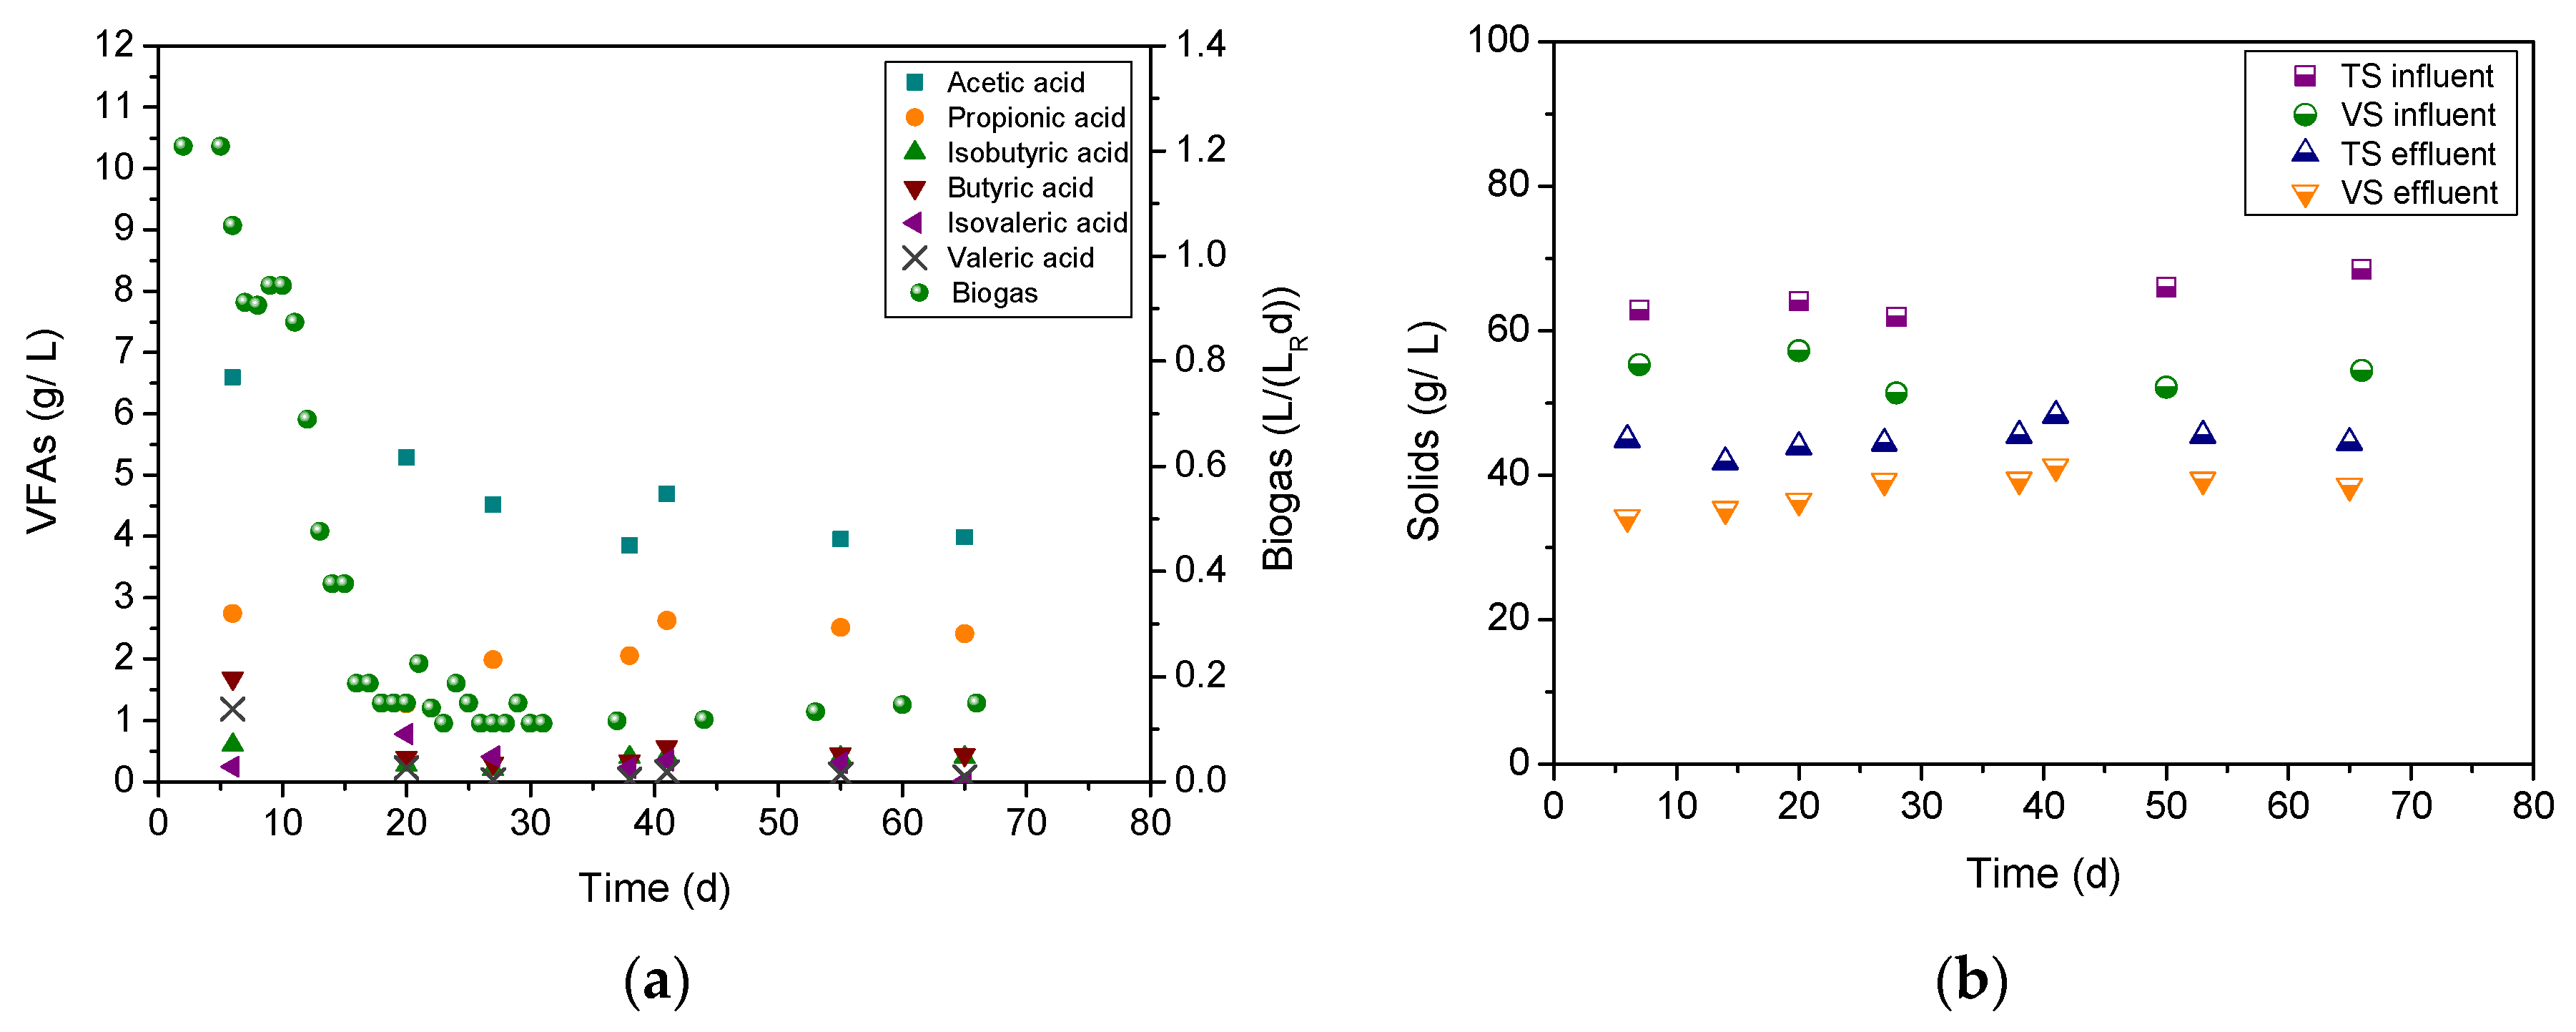
3.3. Cheese Whey Treatment

The anaerobic treatment of CW is reported as a complicated process (especially during increased OLRs) due to its high content in organic compounds, low alkalinity levels, tendency for rapid acidification, and granulation difficulties. Nevertheless, the evolution and development of AD systems for the CW treatment have proved its worth as an important and valuable energy source [40].
The single-stage AD of CW was examined at the beginning with an HRT of 20 d (E3) as a sequence of the previous single-stage operation of LCM (E2). The biogas production rate gradually increased for 35 days of operation, reaching 3.29 L/(LR·d), whereas a decrease in biogas rate to an average of 0.40 L/(LR·d) was observed for the next few days (Figure 3a). The change in HRT from 20 d to 30 d and 40 d resulted in the production of 0.62 and 0.53 L/(LR·d), respectively. The highest methane production rate of 1.72 L CH4/(LR·d) was observed on the 35th day and stabilized to 0.24 L of CH4/(LR·d). The methane content in biogas on the 35th day was 52.3%. The methane production rate after the 34th day declined due to the methanogenic biomass inhibition by VFAs accumulation (Figure 3b), suggesting the instability of the process. The high concentration of tVFAs was mostly due to the increase in acetate concentration (up to 9.68 g/L), which is typically turned into methane. At the same time, propionic acid also increased (up to 5.4 g/L), leading to a strong inhibition of the system with a consequent reduction in the methane production, as the tolerance concentration levels of acetic and propionic acid do not exceed 6 and 4 g/L, respectively [41]. Weiland [42] reported that acetate is usually produced in a higher concentration compared to other VFAs; however, propionate and butyrate exhibited increased inhibitory effects to the methanogens. The pH decreased to 6.46 after 68 days as a result of VFAs accumulation. The alkalinity in the system was initially 24.05 g CaCO3/L due to LCM treatment (E2), and then decreased to 19.5 g CaCO3/L on the 35th day and finally declined to 10.18 g CaCO3/L. However, the buffering capacity was incapable of recovering the process to the initial pH. VFAs accumulation in the reactor decreased the pH value and, thus, caused process inhibition as noticed by the depression of both the biogas production rate and the methane yield.
The highest sCOD removal was achieved until the 40th day of operation and was 94.01%. An effective microbial activity from methanogenic bacteria was achieved as COD was removed and gas production was observed. However, the sCOD increased from 3.20 to 24.17 g/L after the 40th operation day (Figure 3a). The removal efficiency of TS remained constant at 40.12%, whereas the VS removal efficiency for the examined scenario was 48.09%. Finally, the influent concentration of total carbohydrates (31.6 g equivalent glucose/L) decreased significantly; thus, 94% of carbohydrates were consumed.
Taking into account the aforementioned results, it is obvious that the contribution of LCM from the previous experiment (E2) was very crucial for biogas and methane productivity. Feeding the system with CW as a monosubstrate resulted in the washout of LCM, which maintained the alkalinity at high levels in the first days of operation. The proportion of CW and LCM at the 34th day of operation gave the highest productivity, leading to the conclusion that such substrates could achieve high performance yields and system stability in the case of co-digestion. In an already published work of our research team, the co-digestion of CW and LCM at a ratio of 90:10 (v/v) in a two-stage system with an HRT of 19 d was reported [2], in which a high removal of sCOD (85.2%) was obtained. Bertin et al. [43] investigated the optimal mix ratio of the two substrates in batch experiments and found that the methane yield improved (2.5 fold the value obtained by CM and 27 fold the value obtained by CW when used alone) using the mixture with a ratio of 50:50. In the latter case, acidification to low pH values was observed when the CW fraction was higher than 60%. Additionally, Kavacik and Topaloglu [21] mentioned the higher biogas production (1.51 L/(LR·d)) from the co-digestion of CW with dairy manure, reaching a methane content of 60%, and proposed the co-digestion of the aforementioned wastes due to their beneficial performance compared to their separate treatment. According to Labatut et al. [35], dairy manure co-digestion with substrates characterized as easily degradable (such as CW) increased the specific methane yields when compared to the digestion of manure as a monosubstrate. Additionally, even if insignificant synergistic effects were observed during the anaerobic co-digestion of CW and manure according to Vivekanand et al. [44], the high alkalinity capacity of the LCM is of great importance in the case of pH drop by the VFAs formation due to the easily biodegradable CW degradation.
Because of the instability of the single-stage process using CW as a substrate, the investigation of the two-stage system (E4) was considered appropriate. The acidogenic reactor was tested at an HRT of 3 d with an influent flow rate of 250 mL/d, corresponding to an OLR of 19.12 g COD/d. The biogas production rate was 0.13 ± 0.01 L/(LR·d) with a composition of ~90% in CO2 and 2–4% of H2 (Figure 4a). Fermentable carbohydrates in CW wastewater were easily and rapidly hydrolyzed and converted to simple sugars. As a consequence of carbohydrates fermentation, an increase in tVFAs concentration from 2.60 ± 0.37 to 7.74 ± 0.69 g/L (mean values of influent and effluent, respectively) was obtained (Figure 4a). The main VFAs produced were acetic (4.20 ± 0.38 g/L) and propionic (2.52 ± 0.11 g/L) acids, whereas the other VFAs were estimated at significantly lower concentrations (lower than 0.5 g/L). Previous research studies, where CW was tested as a monosubstrate or co-substrate, have mentioned that not only acetic and propionic acids but also butyric acid were the prevalent VFAs formed during the acid-phase of anaerobic digestion [4,30,45]. A simultaneous decrease in the pH value of the effluent from 6.14 to 3.51 was observed, which is considered a key factor concerning the pH influence on fermentative hydrogen production. It is acknowledged that anaerobic fermentative hydrogen production is suppressed by both low and high pH values because the pH is a crucial parameter for bioprocesses [46], while the greatest hydrogen yields are usually presented when pH values close to 5–6 prevail [30,46,47,48]. According to Dareioti et al. [49], low pH values result in inhibition of the hydrogenase activity, whereas controlled pH conditions also affect the soluble end-products distribution. Not only the metabolic products but also the hydrogen production is both controlled by the dominant microbial species contained in the CW, while the final pathway they followed was under the prevailing conditions. CW characterization analysis showed low levels of protein concentration; thus, negligible amounts of fermentation acid products (i.e., valeric and isovaleric acid) were expected. Such acids are largely associated with the fermentation of proteins [50]. The sCOD was constant, comparing mean values in the influent and effluent streams. However, the removal efficiencies of TS and VS were 30.6% and 29.84%, respectively (Figure 4b).
A methanogenic reactor followed for the treatment of the acidified effluent, obtained from the first stage of the system, in order to estimate the rate and extent of CW biodegradation. The digester was operated for 69 days at an HRT of 20 d, with an influent flow rate of 200 mL/d. In general, HRT values between the range of 5 and 25 days are required for effective digestion of CW, in order to overcome the potential stability fluctuation difficulties and the process failure due to its low alkalinity levels and high organic content, which both lead to rapid acidification tendency [4]. The evolution of biogas and methane produced is shown in Figure 5a. The biogas production rate presented a high increase and stabilized at 1.47 ± 0.05 L/(LR·d), whereas the methane production rate at the steady state reached 0.68 ± 0.07 L CH4/(LR·d). The composition of methane in the biogas under steady-state conditions was 49.53%, whilst H2S and H2 concentrations were detected at average values of 545 and 159 ppm, respectively. Methane yields were estimated (Table 3) with regard to the methane productivity. A methane yield of 290.36 mL of CH4/g VSadded was obtained in the current study, which is in accordance with the results reported by Vivekanand et al. [44] (264 ± 9 mL CH4/g VSadded) in the BMP study. According to the values of Table 3, a yield of 13.7 L of CH4/L of influent CW was obtained, which is higher than the yield reported by Venetsaneas et al. [7] (6.7 L of CH4/L of influent) for CW treatment in a two-stage system.
The influent of the methanogenic digester was rich in VFAs, as anticipated due to the preceding acidogenic stage of the process. Throughout the first 20 days of operation, acetic and propionic acid accumulation was noted for the second stage of the system (Figure 5b), which, however, remained stable at 7.38 ± 0.08 g/L for acetic acid and 3.96 ± 0.13 g/L for propionic acid. Despite the high VFAs concentration, no decrease in the methane production was detected. A gradual increase in the pH value from 6.34 ± 0.23 (influent value) to 7.31 ± 0.03 (effluent value) was observed during the methanogenic process by adding 14 g NaHCO3/L in the influent. The total bicarbonate alkalinity after the addition of NaHCO3 was 4.6 g CaCO3/L in the influent, whereas it was maintained at acceptable levels of 13.6 g CaCO3/L in the effluent. Venetsaneas et al. [7] demonstrated that the alkalinity adjustment with NaHCO3 compared to NaOH in the feeding CW wastewater showed a higher hydrogen production rate. Although the addition of NaHCO3 results also to increased levels of CO2 percentage because of the bicarbonate conversion to gaseous CO2, its non-phosphate-containing buffering capacity is recommended for manual pH correction [51].
The total carbohydrate concentration in the effluent was consistently lower than 1.02 ± 0.14 g/L, corresponding to a removal yield of 95.3%. The tCOD removal was 76% (from 76.46 to 18.35 g/L), whereas the sCOD removal was 70.68% (from 61.05 to 17.90 g/L) (Figure 5a). The removal of COD in conjunction with the biogas production in the methanogenic reactor provided evidence of effective microbial activity from methanogenic bacteria, even though the accumulated VFAs in the second stage of the system certainly mildly inhibited the process [38]. Moreover, Figure 5c presents the evolution of TS and VS throughout the experiment, where the TS and VS removal efficiencies were 32.64% and 59.55%, respectively.
Saddoud et al. [52] examined a two-stage system comprising a stirred acidogenic and a methanogenic reactor, coupled with a membrane filtration system for soluble effluents removal and solids restraining. The average removal of COD was 98.5%, whereas the biogas production was higher than 10 times the reactor volume. Tsigkou et al. [19] examined the one- and two-stage (CSTRs) system performance of the carbohydrate-rich substrates (fruits/vegetables mixture and disposable nappies hydrolysate) anaerobic co-digestion, concluding that the two-stage configuration resulted in a 18.4% higher yield in terms of energy production. Additionally, according to Sakarika et al. [53], the end-of-life dairy products and agro-waste co-digestion resulted in a 30% higher energy efficiency in a two-stage system, compared to the one-stage digester.
In conclusion, the results of this study indicated that the two-stage process, in the case of carbohydrates-rich (easily biodegradable) wastes (such as CW), exhibited a better performance, in terms of biogas production, over the single-stage system, at mesophilic conditions. The acidogenic stage addition prior to methanogenesis, except enhancing feedstock hydrolysis and fermentation of the substrate for VFAs production, contributed both to an increased methane content in the biogas, and methane production in the methanogenic reactor. This is in close agreement with Bertin et al. [43], who also demonstrated the much higher efficiency of the two-stage systems than the single-stage one treating CW and manure in co-digestion. Additionally, Yang et al. [54], who compared one- and two-stage thermophilic AD systems for CW treatment, reached to the conclusion that the two-stage process was considered as more appropriate for CW wastewaters management, whilst the COD removal in the two-stage process was 116% higher than that of the single-phase system.

4. Conclusions

The anaerobic digestion of LCM and CW may seem a complex task due to their high organic content. The examination of both wastewaters digestion as monosubstrates was performed by single- and two-stage systems, indicating the most appropriate system, depending on the substrate’s constituent composition. More efficient performance was exhibited for the case of CW in the two-stage than in the single-stage system operation, due to its high concentration of carbohydrates. Easily biodegradable substrates, such as CW, in single-stage digesters may often lead to VFAs accumulation and, thus, methanogenesis inhibition. On the other hand, a negligible difference between the single- and two-stage process performance was observed in the case of LCM digestion due to its recalcitrant organic content and high buffering capacity, which both hindered hydrogen production in the fermentation stage. Concerning the feasibility perspectives, scale-up tests, techno-economic analysis, and/or microbial community analysis can be conducted, as future work, in order to evaluate the implementation of the proposed solutions in higher scale.

Author Contributions

Conceptualization, M.A.D. and M.K.; methodology, M.A.D., A.I.V. and M.K.; software, M.A.D. and K.T.; validation, M.A.D. and K.T.; formal analysis, A.I.V. and K.T.; investigation, M.K.; resources, M.K.; data curation, M.A.D.; writing—original draft preparation, M.A.D. and M.K.; writing—review and editing, A.I.V. and K.T.; visualization, M.K.; supervision, M.K.; project administration, M.K.; funding acquisition, M.K. All authors have read and agreed to the published version of the manuscript.

Funding

This research has been co-financed by the European Union (European Social Fund—ESF) and Greek national funds through the Operational Program “Education and Lifelong Learning” of the National Strategic Reference Framework (NSRF)—Research Funding Program: Heracleitus II. Investing in knowledge society through the European Social Fund.

Institutional Review Board Statement

Not applicable.

Informed Consent Statement

Not applicable.

Data Availability Statement

Data are contained within the article, in Section 3.

Conflicts of Interest

The authors declare no conflict of interest.

References

  1. Kolev Slavov, A. General characteristics and treatment possibilities of dairy wastewater–a review. Food Technol. Biotechnol. 2017, 55, 14–28. [Google Scholar] [CrossRef]
  2. Dareioti, M.A.; Dokianakis, S.N.; Stamatelatou, K.; Zafiri, C.; Kornaros, M. Biogas production from anaerobic co-digestion of agroindustrial wastewaters under mesophilic conditions in a two-stage process. Desalination 2009, 248, 891–906. [Google Scholar] [CrossRef]
  3. Coyette, C.; Schenk, H. Agriculture, Forestry and Fishery Statistics; Publications Office of the European Union: Luxembourg, 2013; ISBN 9279330055. [Google Scholar]
  4. Asunis, F.; De Gioannis, G.; Dessì, P.; Isipato, M.; Lens, P.N.L.; Muntoni, A.; Polettini, A.; Pomi, R.; Rossi, A.; Spiga, D. The dairy biorefinery: Integrating treatment processes for cheese whey valorisation. J. Environ. Manag. 2020, 276, 111240. [Google Scholar] [CrossRef]
  5. Andrio, D.; Asmura, J.; Yenie, E.; Putri, K. Enhancing BOD5/COD ratio co-substrate tofu wastewater and cow dung during ozone pretreatment. In Proceedings of the MATEC Web of Conferences, Online, 15 March 2019; EDP Sciences: Paris, France, 2019; Volume 276, p. 6027. [Google Scholar]
  6. Chatzipaschali, A.A.; Stamatis, A.G. Biotechnological utilization with a focus on anaerobic treatment of cheese whey: Current status and prospects. Energies 2012, 5, 3492–3525. [Google Scholar] [CrossRef] [Green Version]
  7. Venetsaneas, N.; Antonopoulou, G.; Stamatelatou, K.; Kornaros, M.; Lyberatos, G. Using cheese whey for hydrogen and methane generation in a two-stage continuous process with alternative pH controlling approaches. Bioresour. Technol. 2009, 100, 3713–3717. [Google Scholar] [CrossRef]
  8. Berendes, D.M.; Yang, P.J.; Lai, A.; Hu, D.; Brown, J. Estimation of global recoverable human and animal faecal biomass. Nat. Sustain. 2018, 1, 679–685. [Google Scholar] [CrossRef]
  9. Page, L.H.; Ni, J.-Q.; Heber, A.J.; Mosier, N.S.; Liu, X.; Joo, H.-S.; Ndegwa, P.M.; Harrison, J.H. Characteristics of volatile fatty acids in stored dairy manure before and after anaerobic digestion. Biosyst. Eng. 2014, 118, 16–28. [Google Scholar] [CrossRef]
  10. Martínez-Dalmau, J.; Berbel, J.; Ordóñez-Fernández, R. Nitrogen fertilization. A review of the risks associated with the inefficiency of its use and policy responses. Sustainability 2021, 13, 5625. [Google Scholar] [CrossRef]
  11. Sahoo, P.K.; Kim, K.; Powell, M.A. Managing groundwater nitrate contamination from livestock farms: Implication for nitrate management guidelines. Curr. Pollut. Rep. 2016, 2, 178–187. [Google Scholar] [CrossRef] [Green Version]
  12. Aneja, V.P.; Schlesinger, W.H.; Erisman, J.W. Effects of agriculture upon the air quality and climate: Research, policy, and regulations. Environ. Sci. Technol. 2009, 43, 4234–4240. [Google Scholar] [CrossRef] [PubMed] [Green Version]
  13. Rayne, N.; Aula, L. Livestock manure and the impacts on soil health: A review. Soil Syst. 2020, 4, 64. [Google Scholar] [CrossRef]
  14. EBA EBA, European Biogas Association. Available online: https://www.europeanbiogas.eu/european-commission-gives-green-light-for-biogas-on-access-to-sustainable-finance (accessed on 1 August 2021).
  15. Cremonez, P.A.; Teleken, J.G.; Meier, T.R.W.; Alves, H.J. Two-Stage anaerobic digestion in agroindustrial waste treatment: A review. J. Environ. Manag. 2021, 281, 111854. [Google Scholar] [CrossRef]
  16. Van, D.P.; Fujiwara, T.; Tho, B.L.; Toan, P.P.S.; Minh, G.H. A review of anaerobic digestion systems for biodegradable waste: Configurations, operating parameters, and current trends. Environ. Eng. Res. 2020, 25, 1–17. [Google Scholar] [CrossRef] [Green Version]
  17. Srisowmeya, G.; Chakravarthy, M.; Devi, G.N. Critical considerations in two-stage anaerobic digestion of food waste–A review. Renew. Sustain. Energy Rev. 2019, 109587. [Google Scholar] [CrossRef]
  18. Dareioti, M.A.; Kornaros, M. Anaerobic mesophilic co-digestion of ensiled sorghum, cheese whey and liquid cow manure in a two-stage CSTR system: Effect of hydraulic retention time. Bioresour. Technol. 2015, 175, 553–562. [Google Scholar] [CrossRef]
  19. Tsigkou, K.; Tsafrakidou, P.; Kopsahelis, A.; Zagklis, D.; Zafiri, C.; Kornaros, M. Used disposable nappies and expired food products valorisation through one- & two-stage anaerobic co-digestion. Renew. Energy 2020, 147. [Google Scholar] [CrossRef]
  20. Negri, C.; Ricci, M.; Zilio, M.; D’Imporzano, G.; Qiao, W.; Dong, R.; Adani, F. Anaerobic digestion of food waste for bio-energy production in China and Southeast Asia: A review. Renew. Sustain. Energy Rev. 2020, 133, 110138. [Google Scholar] [CrossRef]
  21. Kavacik, B.; Topaloglu, B. Biogas production from co-digestion of a mixture of cheese whey and dairy manure. Biomass Bioenergy 2010, 34, 1321–1329. [Google Scholar] [CrossRef]
  22. Kopsahelis, A.; Stavropoulos, K.; Zafiri, C.; Kornaros, M. Anaerobic co-digestion of End-of-Life dairy products with agroindustrial wastes in a mesophilic pilot-scale two-stage system: Assessment of system’s performance. Energy Convers. Manag. 2018, 165, 851–860. [Google Scholar] [CrossRef]
  23. Tsigkou, K.; Tsafrakidou, P.; Zagklis, D.; Panagiotouros, A.; Sionakidis, D.; Zontos, D.M.; Zafiri, C.; Kornaros, M. Used disposable nappies and expired food products co-digestion: A pilot-scale system assessment. Renew. Energy 2021, 165, 109–117. [Google Scholar] [CrossRef]
  24. Micolucci, F.; Gottardo, M.; Pavan, P.; Cavinato, C.; Bolzonella, D. Pilot scale comparison of single and double-stage thermophilic anaerobic digestion of food waste. J. Clean. Prod. 2018, 171, 1376–1385. [Google Scholar] [CrossRef]
  25. Rabii, A.; Aldin, S.; Dahman, Y.; Elbeshbishy, E. A review on anaerobic co-digestion with a focus on the microbial populations and the effect of multi-stage digester configuration. Energies 2019, 12, 1106. [Google Scholar] [CrossRef] [Green Version]
  26. Dareioti, M.A.; Dokianakis, S.N.; Stamatelatou, K.; Zafiri, C.; Kornaros, M. Exploitation of olive mill wastewater and liquid cow manure for biogas production. Waste Manag. 2010, 30, 1841–1848. [Google Scholar] [CrossRef]
  27. Mariakakis, I.; Bischoff, P.; Krampe, J.; Meyer, C.; Steinmetz, H. Effect of organic loading rate and solids retention time on microbial population during bio-hydrogen production by dark fermentation in large lab-scale. Int. J. Hydrog. Energy 2011, 36, 10690–10700. [Google Scholar] [CrossRef]
  28. Eaton, A.D.; Clesceri, L.S.; Greenberg, A.E.; Franson, M.A.H. Standard Methods for the Examination of Water and Wastewater, 22nd ed.; American Water Works Association, Water Environment Federation: Washington, DC, USA, 2012. [Google Scholar]
  29. Joseffson, B. Rapid spectrophotometric determination of total carbohydrates. In Methods of Seawater Analysis; Grasshoff, K., Ehrhardt, M., Kremling, K., Eds.; WILEY-VCH: Weinheim, Germany, 1983; pp. 340–342. [Google Scholar]
  30. Dareioti, M.A.; Vavouraki, A.I.; Tsigkou, K.; Zafiri, C.; Kornaros, M. Dark Fermentation of sweet sorghum stalks, cheese whey and cow manure mixture: Effect of pH, pretreatment and organic load. Processes 2021, 9, 1017. [Google Scholar] [CrossRef]
  31. Wang, K.; Yun, S.; Xing, T.; Li, B.; Abbas, Y.; Liu, X. Binary and ternary trace elements to enhance anaerobic digestion of cattle manure: Focusing on kinetic models for biogas production and digestate utilization. Bioresour. Technol. 2021, 323, 124571. [Google Scholar] [CrossRef]
  32. Flores-Mendoza, A.P.; Hernández-García, H.; Cocotle-Ronzón, Y.; Hernandez-Martinez, E. Methanogenesis of raw cheese whey: pH and substrate–inoculum ratio evaluation at mesophyll temperature range. J. Chem. Technol. Biotechnol. 2020, 95, 1946–1952. [Google Scholar] [CrossRef]
  33. Nasir, I.M.; Mohd. Ghazi, T.I.; Omar, R.; Idris, A. Bioreactor performance in the anaerobic digestion of cattle manure: A review. Energy Sources Part A Recover. Util. Environ. Eff. 2014, 36, 1476–1483. [Google Scholar] [CrossRef]
  34. Nielsen, H.B.; Mladenovska, Z.; Westermann, P.; Ahring, B.K. Comparison of two-stage thermophilic (68 C/55 C) anaerobic digestion with one-stage thermophilic (55 C) digestion of cattle manure. Biotechnol. Bioeng. 2004, 86, 291–300. [Google Scholar] [CrossRef]
  35. Labatut, R.A.; Angenent, L.T.; Scott, N.R. Biochemical methane potential and biodegradability of complex organic substrates. Bioresour. Technol. 2011, 102, 2255–2264. [Google Scholar] [CrossRef] [PubMed]
  36. Aravani, V.P.; Tsigkou, K.; Kornaros, M.; Papadakis, V.G. Laboratory analyses for assessing the potential for biogas production of various agricultural residues in Greece. Agron. Res. 2021, 19. [Google Scholar] [CrossRef]
  37. Ahring, B.K.; Ibrahim, A.A.; Mladenovska, Z. Effect of temperature increase from 55 to 65 C on performance and microbial population dynamics of an anaerobic reactor treating cattle manure. Water Res. 2001, 35, 2446–2452. [Google Scholar] [CrossRef]
  38. Han, Y.; Green, H.; Tao, W. Reversibility of propionic acid inhibition to anaerobic digestion: Inhibition kinetics and microbial mechanism. Chemosphere 2020, 255, 126840. [Google Scholar] [CrossRef]
  39. Chen, Y.; Cheng, J.J.; Creamer, K.S. Inhibition of anaerobic digestion process: A review. Bioresour. Technol. 2008, 99, 4044–4064. [Google Scholar] [CrossRef]
  40. Dereli, R.K.; van der Zee, F.P.; Ozturk, I.; van Lier, J.B. Treatment of cheese whey by a cross-flow anaerobic membrane bioreactor: Biological and filtration performance. Environ. Res. 2019, 168, 109–117. [Google Scholar] [CrossRef] [Green Version]
  41. Yuan, H.; Zhu, N. Progress in inhibition mechanisms and process control of intermediates and by-products in sewage sludge anaerobic digestion. Renew. Sustain. Energy Rev. 2016, 58, 429–438. [Google Scholar] [CrossRef]
  42. Weiland, P. Biogas production: Current state and perspectives. Appl. Microbiol. Biotechnol. 2010, 85, 849–860. [Google Scholar] [CrossRef]
  43. Bertin, L.; Grilli, S.; Spagni, A.; Fava, F. Innovative two-stage anaerobic process for effective codigestion of cheese whey and cattle manure. Bioresour. Technol. 2013, 128, 779–783. [Google Scholar] [CrossRef]
  44. Vivekanand, V.; Mulat, D.G.; Eijsink, V.G.H.; Horn, S.J. Synergistic effects of anaerobic co-digestion of whey, manure and fish ensilage. Bioresour. Technol. 2018, 249, 35–41. [Google Scholar] [CrossRef]
  45. Lagoa-Costa, B.; Kennes, C.; Veiga, M.C. Cheese whey fermentation into volatile fatty acids in an anaerobic sequencing batch reactor. Bioresour. Technol. 2020, 308, 123226. [Google Scholar] [CrossRef]
  46. Elbeshbishy, E.; Dhar, B.R.; Nakhla, G.; Lee, H.S. A critical review on inhibition of dark biohydrogen fermentation. Renew. Sustain. Energy Rev. 2017, 79, 656–668. [Google Scholar] [CrossRef]
  47. Tsigkou, K.; Tsafrakidou, P.; Athanasopoulou, S.; Zafiri, C.; Kornaros, M. Effect of pH on the anaerobic fermentation of fruit/vegetables and disposable nappies hydrolysate for bio-hydrogen production. Waste Biomass Valorization 2020, 11, 539–551. [Google Scholar] [CrossRef]
  48. Zagklis, D.; Papadionysiou, M.; Tsigkou, K.; Tsafrakidou, P.; Zafiri, C.; Kornaros, M. Effect of pH on the economic potential of dark fermentation products from used disposable nappies and expired food products. Appl. Sci. 2021, 11, 4099. [Google Scholar] [CrossRef]
  49. Dareioti, M.A.; Vavouraki, A.I.; Kornaros, M. Effect of pH on the anaerobic acidogenesis of agroindustrial wastewaters for maximization of bio-hydrogen production: A lab-scale evaluation using batch tests. Bioresour. Technol. 2014, 162, 218–227. [Google Scholar] [CrossRef]
  50. Wang, K.; Yin, J.; Shen, D.; Li, N. Anaerobic digestion of food waste for volatile fatty acids (VFAs) production with different types of inoculum: Effect of pH. Bioresour. Technol. 2014, 161, 395–401. [Google Scholar] [CrossRef]
  51. Ghaly, A.E.; Ramkumar, D.R. Controlling the pH of acid cheese whey in a two-stage anaerobic digester with sodium hydroxide. Energy Sources 1999, 21, 475–502. [Google Scholar]
  52. Saddoud, A.; Hassaïri, I.; Sayadi, S. Anaerobic membrane reactor with phase separation for the treatment of cheese whey. Bioresour. Technol. 2007, 98, 2102–2108. [Google Scholar] [CrossRef]
  53. Sakarika, M.; Stavropoulos, K.; Kopsahelis, A.; Koutra, E.; Zafiri, C.; Kornaros, M. Two-stage anaerobic digestion harnesses more energy from the co-digestion of end-of-life dairy products with agro-industrial waste compared to the single-stage process. Biochem. Eng. J. 2020, 153, 107404. [Google Scholar] [CrossRef]
  54. Yang, K.; Yu, Y.; Hwang, S. Selective optimization in thermophilic acidogenesis of cheese-whey wastewater to acetic and butyric acids: Partial acidification and methanation. Water Res. 2003, 37, 2467–2477. [Google Scholar] [CrossRef]
Figure 1. Schematic description of the two-stage AD system (CSTR bioreactors) for hydrogen and methane production.
Energies 14 05423 g001
Figure 2. Evolution of (a) biogas and methane production rates and soluble COD concentration, as well as (b) main volatile fatty acids concentration during LCM treatment in a single-stage process.
Energies 14 05423 g002
Figure 3. Evolution of (a) biogas and methane production rates, as well as soluble COD concentration and (b) main volatile fatty acids concentration during CW treatment in a single-stage process.
Energies 14 05423 g003
Figure 4. Evolution of (a) biogas production rate and main volatile fatty acids concentration, as well as (b) total and volatile solids (TS and VS, respectively) concentration during acidogenesis of CW treatment in a two-stage process.
Energies 14 05423 g004
Figure 5. Evolution of (a) biogas and methane production rates, as well as soluble COD concentration, (b) main volatile fatty acids concentration, and (c) total and volatile solids (TS and VS, respectively) concentration during methanogenesis of CW treatment in a two-stage process.
Energies 14 05423 g005
Table 1. Operation conditions for CSTRs during the AD of CW and LCM.
Operating ConditionsExperiments
E1E2E3E4
System typeTwo-stageSingle-stageSingle-stageTwo-stage
PhaseAc.Met.Met.Met.Ac.Met.
SubstrateLCMCW
HRT (d)3161620203040320
Flow rate (mL/d)250250250200200150100250200
OLR (kg VS/(m3·d))16.273.053.052.312.361.571.1815.732.36
OLR (kg COD/(m3·d))20.333.813.813.053.832.551.9119.123.83
Where Ac: acidogenic; Met: methanogenic.
Table 2. Chemical composition of feedstocks. The presented values correspond to mean ± standard deviation of the measurement performed in duplicate.
ParametersUnitsCWLCM
pH-6.10 ± 0.037.70 ± 0.06
TSg/L64.67 ± 2.6269.29 ± 1.31
VSg/L54.09 ± 2.3747.05 ± 0.69
tCODg O2/L76.46 ± 1.9960.09 ± 1.06
sCODg O2/L58.46 ± 2.5226.65 ± 0.19
BOD5g O2/L36.00 ± 0.5319.72 ± 0.24
Total carbohydratesg equiv.glucose/L54.80 ± 1.8413.72 ± 0.95
Soluble carbohydratesg equiv.glucose/L29.20 ± 0.920.96 ± 0.03
Total Kjeldahl Nitrogen, TKNg/L0.73 ± 0.023.36 ± 0.00
Ammonium Nitrogeng/L0.10 ± 0.011.54 ± 0.02
Proteinsg/L4.56 ± 0.1321.00 ± 0.00
Oil and fatsg/L0.09 ± 0.003.24 ± 0.04
Total phosphorusg/L0.32 ± 0.000.66 ± 0.01
Soluble phosphorusg/L0.20 ± 0.000.02 ± 0.00
Alkalinityg CaCO3/L0.80 ± 0.0012.38 ± 0.32
tVFAsg/L0.00 ± 0.0010.41 ± 1.63
Where tVFAs: total volatile fatty acids.
Table 3. Steady-state operational parameters for LCM treatment in a single-stage system and CW in a two-stage system.
SubstrateLCMCW
HRT (d)162020
pH7.85 ± 0.107.85 ± 0.107.31 ± 0.03
Biogas (L/(LR·d))1.01 ± 0.040.81 ± 0.041.47 ± 0.05
CH4 (L/(LR·d))0.67 ± 0.040.56 ± 0.040.68 ± 0.07
CH4 (%)66.60 ± 2.6768.96 ± 3.0149.53 ± 1.24
Yield CH4 (mL CH4/g VSadded)219.63242.16290.36
Yield CH4 (mL CH4/g CODadded)175.74183.61180.35
Alkalinity (g CaCO3/L)22.77 ± 1.0825.12 ± 0.19235.72
tCOD removal (%)20.10 ± 1.4520.44 ± 2.6876 ± 4.11
sCOD removal (%)49.89 ± 0.7948.16 ± 1.1270.68 ± 2.23
TS removal (%)19.92 ± 0.5811.32 ± 0.3632.64 ± 0.92
VS removal (%)30.30 ± 1.0119.57 ± 0.6659.55 ± 1.13
Publisher’s Note: MDPI stays neutral with regard to jurisdictional claims in published maps and institutional affiliations.

