Article

A Review of Small–Medium Combined Heat and Power (CHP) Technologies and Their Role within the 100% Renewable Energy Systems Scenario

1
Department of Engineering and Architecture, University of Trieste, 34127 Trieste, Italy
2
Polytechnic Department of Engineering and Architecture, University of Udine, 33100 Udine, Italy
*
Author to whom correspondence should be addressed.
Energies 2021, 14(17), 5338; https://doi.org/10.3390/en14175338
Submission received: 1 June 2021 / Revised: 21 August 2021 / Accepted: 23 August 2021 / Published: 27 August 2021

Abstract

:
The energy transition towards a scenario with 100% renewable energy sources (RES) for the energy system is starting to unfold its effects and is increasingly accepted. In such a scenario, a predominant role will be played by large photovoltaic and wind power plants. At the same time, the electrification of energy consumption is expected to develop further, with the ever-increasing diffusion of electric transport, heat pumps, and power-to-gas technologies. The not completely predictable nature of the RES is their well-known drawback, and it will require the use of energy storage technologies, in particular large-scale power-to-chemical conversion and chemical-to-power re-conversion, in view of the energy transition. Nonetheless, there is a lack in the literature regarding an analysis of the potential role of small–medium CCHP technologies in such a scenario. Therefore, the aim of this paper is to address what could be the role of the Combined Heat and Power (CHP) and/or Combined Cooling Heat and Power (CCHP) technologies fed by waste heat within the mentioned scenario. First, in this paper, a review of small–medium scale CHP technologies is performed, which may be fed by low temperature waste heat sources. Then, a review of the 100% RE scenario studied by researchers from the Lappeenranta University of Technology (through the so-called “LUT model”) is conducted to identify potential low temperature waste heat sources that could feed small–medium CHP technologies. Second, some possible interactions between those mentioned waste heat sources and the reviewed CHP technologies are presented through the crossing data collected from both sides. The results demonstrate that the most suitable waste heat sources for the selected CHP technologies are those related to gas turbines (heat recovery steam generator), steam turbines, and internal combustion engines. A preliminary economic analysis was also performed, which showed that the potential annual savings per unit of installed kW of the considered CHP technologies could reach EUR 255.00 and EUR 207.00 when related to power and heat production, respectively. Finally, the perspectives about the carbon footprint of the CHP/CCHP integration within the 100% renewable energy scenario were discussed.

1. Introduction

As was frequently reported by the literature, the growing demand of the global population for higher amounts of primary energy is indicative of the growing level of social and economic development in the world. However, this increasing energy demand has resulted in a rising threat to the environment, as can be observed in the escalating year-to-date average global temperature, which achieved a new record in 2020 [1]. Moreover, consumption of fossil fuels has achieved high rates in recent years in all energy sectors [2], and the resulting impacts related to greenhouse gas (GHG) emissions are known for their strong influence on the global warming caused by humankind [3]. The potential damage that such an issue can cause to the entire world has raised the attention of society and global leaders, recognizing that trends towards a clean-energy economy must keep going and with no way back [4].
In this sense, the Paris Agreement [5], a historical milestone, was raised as an international treaty on climate change, signed by 196 countries, which has the aim to limit global warming below 2 °C with comparison to pre-industrial levels. However, some countries have faced difficulties in achieving their GHG reduction rates, a fact that might contribute to not achieving the 2 °C goal [6]. According to the National Centers for Environmental Information (NCEI) from the USA [7], in January 2021, the average global land and ocean temperatures were one of the highest for January since records began in 1880. Consequently, NCEI has registered significant climate anomalies, such as the highest temperatures ever reported in several regions across the world, the smallest Arctic and Antarctic sea ice extent, the heaviest snowfall in some regions of Europe since 1971, and torrential rain with deadly floods in southeast Asia. There is plenty of evidence regarding climate change effects all around the world as for temperature deviations [8], impacts on sea and land ecosystems [9,10], and unusual rainy seasons [11]. Therefore, the acknowledgment of the problem by world society, especially by the scientific community, has turned the world attention to renewable energy (RE) sources as a long-term solution, which can also be observed in the special Global Warming 1.5 report from Intergovernmental Panel on Climate Change (IPCC) [12].
In the past two decades, an increasing number of works have dealt with the scenario of 100% RE systems [13]. Jacobson et al. [14], for instance, described roadmaps for 139 countries to feed their energy sectors by 100% wind–water–solar energy sources. Their work was based on avoiding 1.5 °C global warming (a more daring goal comparing to Paris Agreement), and the simulation has foreseen societal benefits such as the creation of 24.3 million net new full-time jobs, reduction in energy costs and air pollution, and increase in the world population with access to energy. In other studies, such as those developed by Pursiheimo et al. [15] and Breyer et al. [16], the authors also report benefits with the 100% RE scenario, claiming that solar photovoltaic (PV) energy source is going to play a key role in the generation of electricity by 2050 due to costs reductions and, consequently, a rapid increase in installations.
Although the feasibility of a 100% renewable electricity system was put in doubt [17], the literature also claims that such a scenario is not only feasible but it is also viable [18]. This is because it promotes the matching between energy generation and demand; it is cost-competitive when compared to fossil-fuel-based systems and takes into consideration a range of constraints regarding environmental and financial issues. Actually, over the past two years, further steps were taken in relation to the analysis of the 100% RE scenario performed by the scientific community. The feasibility and viability of a 100% RE scenario are considered true by default. Now, the literature has dealt with more in-depth analysis, including detailed energy transition pathways that can take the current world fossil-fuel-based energy system to a completely renewable global energy system [19]. Obviously, the intrinsic intermittent characteristic of RES requires a considerable amount of energy storage capacity. However, if properly managed, storage facilities can enhance the dependability of energy systems and decrease electricity costs [20].
Moreover, despite the mentioned increasing number of studies dealing with the scenario of 100% RE in the past few years, some studies talked about worries concerning underestimation with respect to PV deployment [21] and PV supply of a considerable share of global electricity generation [22]. Nevertheless, as the European Renewable Energy Council [23] once stated, a 100% RE scenario by 2050 is not a matter of available technology but a matter of the establishment of the proper set of policies today in order to reach the desirable results tomorrow.
With all that said, a scenario with energy systems powered exclusively by RES is possible and just a matter of time. To make this happen, studies point out also the types of technologies needed to generate/store electricity and heat as well as the bridging technologies responsible for converting energy from a given sector into products for another sector [24,25]. Among those technologies, there exist the CHP systems, which, as the name suggests, can provide heat and power to the energy system taking advantage of the same energy source. With their flexibility as for the energy source, CHP technologies can be fed by fossil-based or renewable-based sources [25].
As reported by Bogdanov et al. [25], CHP systems are expected to play an important role in the 100% RE scenario. Their flexibility will support the energy system to keep running already-existing fossil-fuel-based power plants till the end of their technical lifetime and, as soon as these power plants fade out, CHP systems will still be able to continue helping the energy system, now being powered exclusively by RES. Therefore, the matter of CHP systems being fed by RE sources is not a new topic. Actually, CHP systems have gained scientific interest since the 1970s during the energy crisis; however, investigation of CHP systems powered by RE has earned considerable scientific attention only since the 2000s [26].
Solar, biomass, and organic waste are among the main RE sources that can be used to feed CHP systems. For instance, Ding et al. [27] conducted a study in which they proposed a new solar aided CHP plant to generate power and/or supply heat flexibly, depending on the demands, which resulted in substantial improvements when compared with a base case. Furubayashi and Nakata [28] analyzed a CHP system fed by woody biomass, based on local heat load features, and performing a trade-off between CO2 emissions and total costs. There are also works mixing RE sources in a hybrid energy system. This is the case of the system analyzed by Ji et al. [29], which combined solar and biomass intending to provide heat and power for isolated communities. Moreover, in some cases, a decentralized facility has the potential to play a vital role in the cost reduction in energy generation, as is the case of the research performed by Zhang et al. [30] in which an experimental/theoretical study analyzed a food-waste-to-energy system to feed a CHP system, which resulted in considerable gains of power and heat outputs.
Another important energy source for feeding CHP systems is waste heat. Its use is one of the main ways of increasing efficiency and decreasing costs of energy systems, with a cheap, clean, and fuel-free energy source that can be considered renewable [31]. Generally, waste heat is a by-product from fuel combustion processes or chemical reactions, which are otherwise released into the environment [32]. The US Department of Energy indicated that the heat energy wasted by the US industry had the potential to produce about 20% of total US electrical output energy [33] and hence to reduce substantially GHG emissions. Therefore, going back to the 100% RE scenario, a question arises: what could be the role of CHP technologies in such a scenario when it comes to WHR? The main objective of this paper is to address this question by reviewing the literature on the specific 100% RE scenario pictured by researchers from the Lappeenranta University of Technology through the so-called “LUT model”, evaluating possible small–medium CHP technologies suitable to recover low–medium temperature waste heat sources, and developing an economic analysis to evaluate the potential annual savings each CHP technology is able to provide. The search is not exclusively limited to CHP systems: if adequate to a given situation, CCHP and Combined Cooling and Power (CCP) systems might also be considered.
Therefore, the idea is to tackle the previously mentioned question split into four main parts:
  • Searching for any piece of equipment or process that might release to the surroundings a potential waste heat, such as batteries charge/discharge process, power plants (Concentrated Solar Power (CSP), bio/waste, steam turbines, gas turbines, geothermal, Internal Combustion Engine (ICE), and coal-fired power plants, with the last two expected to fade out by 2050), Photovoltaic–Thermal (PVT) systems, and Solar Water Heaters (SWH);
  • Specifying, according to the temperature level, which of the potential waste heat sources would be suitable to feed the selected CHP heat recovery technologies;
  • Evaluating the potential annual savings each CHP technology can provide when working under a specific number of daily hours;
  • Discuss the carbon footprint perspectives within the presented integration scenario.
The work is structured as follows: Section 2 is dedicated to a review on CHP technologies suitable to recovery low–medium temperature heat sources. Section 3 deals with the 100% RE scenario pictured within the LUT model, providing a brief perspective about its definition and presenting the technologies considered in such a scenario. In Section 4, the above-mentioned question is addressed, picturing possible ways of integration of CHP technologies into the 100% RE scenario in terms of waste heat harnessing and evaluating economic and environmental perspectives.

2. Small and Medium Scale CHP Technologies

Polygeneration systems are important solutions not only to increase overall efficiency but also to support the pathway to a 100% RE scenario. Rong and Lahdelma [34], for instance, have stated that the flexibility regarding the feeding energy source (fossil or renewable) of polygeneration systems is an important feature on the path towards a future with sustainable energy security and an important link in the development of new energy policies. In other words, the same fossil-fuel-based technologies are those that can be fed by RES. That is the case, for example, of Rankine cycles which may be coal-based but may also be fed by renewable sources such as biomass, solar, and organic waste. Furthermore, small and medium-scale CHP technologies can improve even further the overall efficiency of a given system and therefore contribute to GHG emissions reduction.
The literature has reported that CHP technologies, which are essentially thermodynamic cycles, can improve the energy efficiency and cost-effectiveness of a given process. Nemati et al. [35], for example, indicated that thermodynamic cycles based on organic working fluids are quite effective for recovering energy from low temperature waste heat sources. Jouhara et al. [36] conducted a work about waste heat recovery technologies where they reviewed, among other things, thermodynamic cycles for waste heat recovery. The cycles reviewed by them were organic Rankine cycle, Kalina Cycle, heat pumps, and Direct Electrical Conversion Devices. From this perspective, the present work considers four types of thermodynamic cycles, namely organic Rankine cycle (ORC), Absorption Power and Cooling (APC), Absorption Refrigeration System (ARS), and Absorption Heat Pump (AHP). Therefore, in this section, some cases encountered in the literature are reviewed, and key parameters are extracted and highlighted for this study.

2.1. Organic Rankine Cycle

When it comes to generating electricity from low–medium temperature heat sources, ORC is a unique technological solution [37]. Organic and Conventional Rankine Cycles work under the same standard thermodynamic cycle, but the key difference lies in the working fluid being used by each one. Conventional Rankine cycles utilize water as working fluid, which has a quite high boiling point, and, for that reason, need high temperature heat sources to feed them. On the other hand, organic Rankine cycles work with organic fluids, which have a low boiling point as its key characteristic. Such an attribute allows organic Rankine cycles to be one of the main technologies for recovering low–medium temperature waste heat [38].
ORCs can be employed in a wide variety of applications. For instance, Souza et al. [39] proposed a combined system comprising an ORC and an Absorption Chiller to meet the electrical and thermal demands of a university building in Brazil. Nami and Anvari-Moghaddam [40] conducted a study to compare the performance between a conventional and an ORC system, both combined with an Absorption Chiller, to recover waste heat in a cement plant in Turkey. In an investigation conducted by Haghghi et al. [41], a solar-based CCHP system consisting of storage tanks, one ORC, and two Absorption Chillers, was analyzed to cover the demands of a school center in Iran. Therefore, as observed in the literature, ORCs play an important role in the scenario of polygeneration systems fed by environmentally friendly sources, such as waste heat and solar.
The purpose of this section is to conduct a data survey in the literature to find ORC output values and their respective heat source temperature levels. A summary of the collected data is shown in Table 1. The first selected study was conducted by Li et al. [42]. In this study, the authors investigated how the heat source temperature and the working fluid influence the heat–power conversion performance. They performed parametric analyses of the optimal cycle under heat source temperature levels varying from 100 to 200 °C, producing net power output from 15 to 95 kW. In work performed by Fu et al. [43], a 250-kW ORC system with a hot water inlet temperature of 119.8 °C and a corresponding 225 kW of net power output was designed and constructed. Rad et al. [44] carried out a design of an ORC, with an emphasis on the analysis of the turbine inlet pressure, which was optimized for different heat source temperature levels and different working fluids. Their lowest analyzed heat source temperature level was 200 °C resulting in a net power output of 214 kW.

2.2. Absorption-Based Technologies

This section is intended to gather a review of the three types of absorption-based technologies considered in this work, namely ARS, AHP, and APC. Essentially, those technologies work under the same absorption cycle principle, which comprises, as observed in Figure 1, the following components (for the single-effect cycle): absorber, evaporator, desorber, condenser, solution heat exchanger, solution pump, and solution and refrigerant expansion valves. Besides, there are two water streams that enter and exit the absorption cycle control volume, namely cooling water, chilled water, and steam or hot water streams. The first is the water stream that comes from the cooling tower and removes heat from the absorber and condenser, the second is the chilled water from the evaporator that removes heat from the target place (for the case of ARS), and the last is the fluid stream coming from the heat source [45]. The main difference of the APC cycle is that it takes advantage of the pressure difference between desorber and evaporator, i.e., a turbine is placed between those components so that the cycle can provide power and refrigeration simultaneously, as outlined in Figure 2 [46]. This section aims at performing a data survey in the literature to obtain ARS, AHP, and APC output values and their respective heat source temperature levels.
ARS and AHP cycles are found in the literature (Table 1), being fed by different types of heat sources, combined with different systems, and employed in several applications. For instance, Patel et al. [47] conducted a system optimization of a compression–absorption refrigeration system combined with an ORC system using nonlinear programming. Among their parametric results, the ARS delivered a cooling capacity of 30.7 kW under 80 °C of desorber temperature. Khan et al. [48] studied an ARS powered by solar energy and storage components. During peak hours and with an optimized operation mode, they achieved 29 kW of cooling capacity with a desorber temperature of 120 °C. Using microscale heat exchanger technology, Kini et al. [49] carried out an ARS study for residential applications. The desorber temperature was 162 °C, which provided a cooling capacity of 10.5 kW.
In the same way, AHP was studied by several researchers. Boman and Garimella [50] analyzed an AHP modified to provide simultaneous heating and water purification. With the desorber temperature at 100 °C, the AHP heating load was 15 kW. In an investigation about the influence of organic working pairs in an AHP, Chatzitakis et al. [51] achieved 5 kW heating power with an average desorber output temperature of 110 °C. In the same research line, Boman et al. [52] carried out a thermodynamic analysis of an AHP, running under cooling and heating modes, operating with different working pairs. The average analyzed desorber temperature was 170 °C delivering a heating load of 7 kW.
Table 1. Heat source temperature and its respective output values for the reviewed CHP technologies: ORC, ARS, AHP, and APC.
ReferenceHeat Source Temperature (°C)Output (kW)Type
ORC
Li et al., 2019 [42]100–20015–95Power
Fu et al., 2015 [43]119.8225
Rad et al., 2020 [44]200214
ARS
Patel et al., 2017 [47]8030.7Cooling
Khan et al., 2016 [48]12029
Kini et al., 2020 [49]16210.5
AHP
Boman and Garimella 2020 [50]10015Heating
Chatzitakis et al., 2019 [51]1105
Boman et al., 2017 [52]1707
APC
Jawahar et al., 2013 [53]150 *225Cooling
-80Power
Rashidi et al., 2016 [54]93 *393Cooling
280 **1722Power
Wang et al., 2008 [55]300 *224.6Cooling
285 **612.1Power
* Desorber temperature; ** Turbine inlet temperature.
Regarding the APC literature survey, larger ranges of heat source temperatures and output capacities were found (Table 1). However, the works reviewed were at the theoretical/simulation level. The first one was developed by Jawahar et al. [53]. In this work, the authors simulated a Kalina cycle under a base case, and a GAX-based case combined power and cooling cycle. After a parametric analysis, they found outputs of 225 kW (cooling capacity) and 80 kW (power), under 150 °C of desorber temperature. Rashidi et al. [54] studied an APC based on a Kalina cycle and an ARS under thermodynamic and economic points of view. With the turbine inlet and desorber temperatures at 280 °C and 93 °C, respectively, the combined system produced 1722 kW of power and 393 kW of cooling. Wang et al. [55] also conducted a parametric analysis on an APC system with an optimization based on exergy efficiency as the objective function. In an optimized mode, the turbine inlet temperature was 285 °C while the desorber temperature was 300 °C. Consequently, the power produced and the generated cooling were, respectively, 612.1 kW and 224.6 kW.

3. 100% Renewable Energy Scenario and the LUT Model

As discussed in Section 1, the progressive aggravation of the global environmental scenario, which has culminated in worldwide climate anomalies throughout the post-industrial era, especially in recent decades, has called the attention of authorities and scientists urging them to a long-term solution, as can be observed in the Paris Agreement [5]. In this sense, the 100% RE scenario arises as a conceivable solution to achieve net-zero emissions by 2050 with an even cheaper electricity cost [24]. Moreover, an energy structure largely based on electricity is broadly considered by the literature due to its cost-effectiveness and efficiency through the usage of power-to-X technologies [13,14,16].
There are plenty of investigations dealing with the scenario of 100% RE systems. However, as stated in Section 1, this paper is focusing on the scenario pictured by researchers from the Lappeenranta University of Technology, Finland. They have developed the so-called “LUT model” which is a computational tool capable of performing simulations of the energy system transitions, provide feasibility and technical analysis, to name a few capabilities [24]. In the scenario pictured within the LUT model, the primary energy matrix is mainly comprised of solar photovoltaic (PV), wind energy, hydropower, biomass/waste, and geothermal. The model considers that the energy transition starts in 2015 and is expected to be completed by 2050. During this time, no new fossil fuel- or nuclear-based power plants are allowed to be installed. The already-existing plants are kept running until the end of their technical lifetime [25].
The protagonist, so to speak, of such scenario, is the electricity generation from solar PV systems together with wind energy, though the rapid and continuous cost decline of solar PV allied with low-cost batteries makes solar PV contribute with higher shares (69%) within the electricity matrix, in comparison with wind energy (18%) [16]. According to the same reference, other factors that contribute to solar PV domination are excellently distributed solar resources and high modularity. However, without proper policymaking, such technological development, cost reductions, and consequent improvement of social welfare would be hampered.
Essentially, as observed in Figure 3, the LUT model considers four energy sectors, namely power, heat, transportation, and industry sectors. They were analyzed separately [24]; however, in a recent study [25], the impact of combining sectors was investigated to see its influence in key parameters such as electricity cost and use of storage components. The linking of sectors demonstrated lower electricity cost levels and higher levels of efficiency. This combining of sectors (or integration, as stated by the authors [25]) is possible thanks to bridging technologies that allow the electrification of heat, transport, and industrial processes. That is the case of Power-to-X technologies that, in an integrated energy system largely dominated by electricity from RE sources, play a vital role in obtaining extremely important products from electric power, such as heat, mobility (electric vehicles), fuels, chemicals, CO2, and water. Another enormous advantage of the integration of sectors is that some of those key products permit the inverse way, i.e., it is possible to obtain electric power from heat, fuels, or mobility (vehicle-to-grid). Therefore, the evidence shows that it is possible to achieve a highly efficient energy system with an even lower electricity cost.
For this paper, the energy sectors are briefly explained since one of the main objectives is to identify potential waste heat sources from systems within those sectors. Afterward, Section 3.5 presents the energy system elements considered in the LUT model, specifying which among them is considered in the analysis of integration conducted by this work.

3.1. LUT Model’s Power Sector

The power sector considered in the LUT model is divided into two main parts: a centralized power system, which has the local grid as a concentrating system that gathers power coming from every energy source, including the power from storage capacities; and the power prosumers portion representing the consumers that are also generating their share of power through individual solar PV power plants, which can be residential, commercial, and industrial [24].
There are several works dealing with transition routes for a 100% RE power sector, including works from Lappeenranta University researchers and/or in cooperation with them. For instance, the research conducted by Child et al. [56] analyzed pathways through which Europe could achieve a power sector 100% powered by RE. Their results showed that the cost of electricity could achieve a 26% reduction, besides being a feasible scenario that meets the Paris Agreement goals. Moreover, the literature reported a trend of increasing sustainability [57] in the power sector, including more detailed studies focused on specific countries [58,59,60] and a 67% increase in jobs in this sector worldwide in 2050 [61].

3.2. LUT Model’s Heat Sector

This sector, which is also separated into centralized and individual heating systems, comprises six main subsegments, according to the heat demand temperature and its final usage: industrial high (>1150 °C), medium (100 °C to 1150 °C), and low (<100 °C), domestic water heating, space heating, and cooking biomass demand. Taking a closer look, industrial high and medium, which are more demanding segments, can only be fulfilled with fuel-based heat plants (though medium temperatures can also be met by electrical heating). Low temperature demands are more flexible since they can be met by electrical heating, solar thermal, and waste heat. Both low and medium temperatures can also be stored [24].
The literature has claimed advantages regarding decreasing costs related to the heat sector. In studies such as [25] and [62], researchers concluded that interconnections between sectors powered by RE, including the heat sector, have the potential to decrease overall costs of energy systems and providing high amounts of heat [63]. Furthermore, as stated in Section 1, taking advantage of waste heat sources is one of the key ways to increasing efficiency while decreasing costs of energy systems and the possibility of using such source to power CO2 Direct Air Capture (DAC) [64] contributes even more to the 100% RE scenario.

3.3. LUT Model’s Transportation Sector

The segments of road, rail, marine, and aviation comprise this sector, which is mainly subdivided according to the type of fuels available for a given segment [24]. LUT model considers that fossil fuels will be replaced by hydrogen, sustainable biofuels, Fisher–Tropsch synthetic fuels, and electricity [25].
This essential sector to society accounts for about 24% of global CO2 emissions, but with the implementation of electric and hydrogen technologies, a large portion of this sector can be decarbonized in a few decades [65]. However, there are segments within the transportation sector that are harder to decarbonize. For instance, heavy trucks, large passenger aircraft, and shipping are hard to decarbonize since they would require large amounts of hydrogen or a big set of batteries adding extra weight in comparison to the combustion engines used nowadays [66].

3.4. LUT Model’s Industry Sector

In the more updated version of the LUT model, the subsegments included in this sector are cement, steel, chemicals, aluminum, pulp and paper, industrial fuel production, desalination sector, and CO2 removal sector. This sector is modeled considering improvements of the involved technologies as well as different options of feedstock. The high demand for high-temperature heat within the industry sector is one of the main reasons for the increasing fossil fuels demand, even during the transition period. As stressed out in Section 3.2, carbon-neutral biofuels and synthetic fuels cannot be as competitive as fossil fuels in respect of high heat temperature levels. However, the integration of all sectors considered in the LUT model is expected to lead to higher shares of RES and hence, a faster decrease in the overall electricity cost [25].
At the beginning of the last decade, the high competitiveness of solar PV in the industry sector was already expected with a consequential fast reduction in electricity costs [67]. At the end of the same decade, the high and fast development rate of the PV industry has surpassed expectances of the scientific community. Now it is expected a huge development in the PV industry with huge capacity power plants at the terawatt scale being the center of all sectors of the global energy system, including the industry sector, which is a scenario that will lead to ever lower electricity costs [68,69].

3.5. Energy System Technologies Considered by the LUT Model

As discussed till this point, every energy sector has its generation technologies that can be grouped into ten categories: renewable-, biomass-, and fossil-based power generation, renewable-, biomass-, and fossil-based heat generation, fuel production technologies, storage options, power transmission technologies, and water desalination and supply technologies [24]. Table 2, Table 3 and Table 4 summarize all ten categories specifying their respective technologies. Then, it is identified which of them are considered for the analysis proposed by this work, according to their characteristics.
The technologies associated with power generation are shown in Table 2. For this work, the selected technologies from these groups are geothermal power plants, gas turbines (CCGT, OCGT, and Biogas), and steam turbine-based cycles (CSP plants, biomass, municipal waste, coal, liquid hydrocarbons, and nuclear). The mentioned technologies, those which are not renewable-based, make part of the plants that will not be decommissioned, but their technical lifetime is expected to end before 2050. Solar PV, wind turbines, and hydro are not considered since these technologies do not release heat (or a considerable amount of heat) to the surroundings.
Table 3 presents the technologies associated with heat generation. In this case, only solar thermal was considered in the analysis conducted in this paper. It can be both PVT or solar water heaters. Since CHP technologies have the aim of producing heat and power, electrical heating and heat pumps were not taken into account. As district heat and individual heat already have their final consumers and work at a relatively low temperature [70], it was also not considered.
Table 4 shows the technologies related to fuel production, energy storage, power transmission, and water desalination and supply. The technologies associated with the categories fuel production, power transmission, and water desalination and supply were not considered since they do not release useful heat (or a considerable amount of heat) to the surroundings. The same reason goes for pumped hydro, hydrogen, district heat, biogas, adiabatic compressed air, gas, and liquid hydrocarbons. Hot heat, which can be interpreted here as thermal energy storage, was also not considered since it has to be regarded as the product of the heat recovery action; therefore, it cannot be further recovered. In conclusion, from Table 4, only PVB are evaluated.

4. Integration of Small–Medium CHP Technologies in the 100% RE Scenario

4.1. Description and Parameters of Possible Waste Heat Sources

Despite the integration of sectors through bridging technologies, as introduced in Section 3, each energy sector within the LUT model has its characteristics, infrastructure, and processes. For that reason, it is possible to find different potential waste heat sources not only when making comparisons between sectors but also within each sector. By way of examples, in the power sector, it is possible to find photovoltaic thermal panels, the charging/discharging processes within PV batteries (PVB), and waste heat from CSP plants. The heat sector has large CHP plants and thermal storage technologies [71]. Within the transportation sector, the exhaust gases from heavy-duty ICE-driven vehicles might be considered a good example. In the case of the industry sector, it depends mainly on the subsegment, but cement, steel, and aluminum are great energy consumers and, therefore, have a higher potential to release larger amounts of waste. However, in the context of feeding small–medium CHP technologies, not every waste heat source has the potential to drive them, at least from the point of its temperature level.
In order to evaluate the potential of a given heat source feed a small–medium CHP plant, this paper adopts the following methodology, divided into two steps. First, it is necessary to define a parameter that is used to evaluate a specific waste heat. For this work, it is temperature level. Second, gather the data of the feeding temperature level of the CHP technologies, presented in Section 2, with their respective output values. Therefore, Table 5 presents the waste heat sources selected in Section 3.5 with their respective parameters for evaluation. These parameters are not provided by the LUT model. It is defined, selected, and reviewed by this work.
As can be observed in Table 5, for PVB, the selected parameter was the battery temperature, i.e., the temperature level resulted from charging/discharging processes. PVT panels provide an output temperature, which is from the heated water coming from a set of pipes underneath the solar PV panel. Geothermal (GTH) power plants have the condensate or brine reinjection temperature, that is, the temperature of the geothermal fluid right before being reinjected into the well. For SWH, which have an intuitive name, the water output temperature from the water tank was selected. For steam turbine (ST) based power plants, the selected parameter was the turbine output temperature. The designated parameters for gas turbines (GT) were the turbine output temperature and the HRSG (Heat Recovery Steam Generator) output temperature. Generally, GT output temperature is relatively high (around 500 to 600 °C) and, for that reason, GT is commonly part of a large CHP plant that uses this high temperature to feed other systems, as for example, ST-based cycles. ICE-based CHP plants are considered here since they can also be powered by renewable fuels, such as bio and synthetic gas. Its parameter is the temperature of the exhaust gases and, in some cases, the coolant water temperature. The values reviewed for each parameter of Table 5 are presented from Table 6, Table 7, Table 8, Table 9, Table 10 and Table 11.
Table 6 presents battery temperature values from various references. The maximum temperature was 55 °C [72] and the lowest 25 °C [79], which are quite low temperature levels when considering power small CHP heat recovery technologies. Besides, almost all papers reported battery issues when raising its temperature. For that reason, the heat released by PVB would not be an option for the proposed analysis of this work. A similar situation happened to PVT (Table 7) and solar water heater (Table 8). For PVT, the highest water output temperature was 80 °C; however, the authors state that the higher this temperature, the lower the electrical efficiency. Thus, from PVT references, it can reach an average water output temperature of 46 °C, which is also quite low for small CHP heat recovery technologies.
Solar water heaters achieved a slightly higher average water output temperature of 58 °C, but its exergy content is still very poor, even if the time variation in the environmental temperature were taken into account in the exergy calculations [82,83]. Therefore, the exploitation of this waste heat for power production or for feeding some small CHP technologies is not feasible in practice. In some cases, depending on the demand constraints, it could feed a space heating system [84].
Table 7. Literature review of the values for PVT selected parameter.
ReferenceWater Output Temperature (°C)Notes
Fudholi et al., 2014 [85]53.6Maximum achieved among three analyzed types
Kumar et al., 2015 [86]From 30 to 80However, electrical efficiency drops for higher temperatures
Liang et al., 2015 [87]38Maximum achieved in a typical day
Yazdanpanahi et al., 2015 [88]27Ambient temperature around 17 °C
Fudholi et al., 2014 [89]45The highest achieved for a PVT air collector
Kazemian et al., 2019 [90]55Maximum achieved through a CFD analysis
Al-Musawi et al., 2019 [91]35In combination with Phase Change Materials
Islam et al., 2021 [92]46At the lower flow rate and with Phase Change Materials
Kazemian et al., 2021 [93]42For an improved PVT configuration
Alsalame et al., 2021 [94]43.4Maximum achieved among three studied cases
As mentioned before, the selected parameter for the geothermal heat source was the brine reinjection temperature (BRT). The temperature of the brine, right before its reinjection back into the well, represents an exergy level that could be used for something else, depending on that level. Of course, it should be noted here that it was considered that a major percentage of the brine exergy content was already used throughout the geothermal power plant and that the technical feasibility of recovering the brine reinjection temperature was neglected in this study.
Table 8. Literature review of the values for Solar Water Heater selected parameter.
ReferenceWater Output Temperature (°C)Notes
Liu et al., 2012 [95]65Configuration with eight tanks connected in series
Fazilati and Alemrajabi 2013 [96]50On average and using Phase Change Materials
Sathyamurthy et al., 2015 [97]60 and 65Maximum during winter and summer, respectively
Xue 2016 [98]40Maximum and using Phase Change Materials
Assari et al., 2018 [99]49Maximum achieved among seven studied cases
Mandal et al., 2020 [100]61.8Maximum and using Phase Change Materials
Mandal et al., 2020 [101]74.7Performance investigation of an improved configuration
Table 9. Literature review of the values for geothermal selected parameter.
ReferenceBrine Reinjection Temperature (°C)Notes
Britvin et al., 2000 [102]50-
Kanoglu et al., 2008 [103]90Binary geothermal power plant
Keçebaş et al., 2011 [104]50Geothermal district heating for building application
Gabbrielli 2012 [105]70Binary geothermal power plant with an ORC
Srinivas et al., 2014 [106]45Integration of geothermal and biomass power plant
Clarke and McLeskey 2015 [107]90Optimization of a binary geothermal power plant
Sinaga and Manik 2018 [108]39Optimization through simulating wet bulb temperature fluctuation
Prananto et al., 2018 [109]113Configuration using Kalina as a bottoming cycle
Song et al., 2019 [110]25Geothermal integration to district heating substations
Garapati et al., 2020 [111]50 and 100Lowest and highest values achieved for a hybrid geothermal power plant
Table 9 shows the values of brine reinjection temperature found in the literature. As one can see, the average brine reinjection temperature was 67 °C, which means that in some cases, it is possible to feed just a space heating system, but in other ones, it is possible to power a small size heat recovery CHP technology. That would be the case of Prananto et al. [109] with the brine reinjection temperature at 113 °C. However, when it comes to geothermal brine, some problems might arise if its temperature is lowered beyond a certain threshold. For instance, scaling problems [105] would hamper the heat exchange rate, and the decline of geothermal well temperature [107] would affect the long-term plant effectiveness. Hence, recovering the brine reinjection temperature would be possible in some cases, despite being complicated from a practical point of view, even though it is considered in the analysis of Section 4.2.
Table 10 indicates the selected parameters for GT and ST and gathers generation and cogeneration power plants powered by different sources, such as natural gas, biomass, heat recovery, solar, and hydrogen. In the case of GT, the selected parameter is the output temperature of the exhaust gases. As indicated, GT output temperature values demonstrate that this waste heat source has a substantially high temperature level (average of 567.7 °C). For that reason, this is commonly used to feed another thermal system in order to increase the overall efficiency; however, it is a too-high temperature level for small–medium CCHP technologies. Therefore, GT output temperature is not considered in the analysis of Section 4.2. On the other hand, a plausible source of waste heat is the exhaust gas of an HRSG system, which is usually integrated into a GT system and operates with the same exhaust gases from the GT output. The average temperature of the HRSG output reviewed by this work was 131 °C, which is also a promising temperature level for small CCHP heat recovery technologies. When it comes to ST, the selected parameter was the output temperature of the working fluid stream. It was identified an average value of about 102 °C, which is a favorable temperature level capable of driving small CCHP heat recovery technologies. Therefore, from Table 10, only HRSG output temperature and ST output temperature are considered in the analysis of Section 4.2.
There are two important aspects to keep in mind in this analysis: first, it is worth noting that the literature [92,100,103] has reported problems with corrosion if the exhaust temperature becomes lower than a certain threshold, a fact that would limit the amount of exergy allowed to be recovered. Second, even in cases in which the waste heat recovery is common, in practice, the waste heat was regarded as a potential input for CCHP systems as well, consistently with the idea of highlighting the potential role of those systems in the future 100% RE scenario.
ICE technologies can still be considered within the 100% RE scenario since they can be powered by renewable fuels, such as Biodiesel, hydrogen, alcohol, and synthetic fuels (such as Fischer–Tropsch petrol or diesel) [112].
Table 10. Literature review of the values for gas and steam turbine selected parameters.
ReferenceCycle DescriptionFuelGT Output Temperature (°C)ST Output Temperature (°C)HRSG Output Temperature (°C)
Anozie and Odejobi 2011 [113]STNG or Oil-51-
Kaviri et al., 2013 [114] *GT/STNG550-151
Choi et al., 2014 [115]GT/STNG645126-
Aguilar et al., 2014 [116] *GT/ST-555187-
Gebreeg et al., 2014 [117]STBM-125-
Athari et al., 2015 [118] *GTBM577--
Ganjehkaviri et al., 2015 [119]STHR-70-
Ibrahim et al., 2017 [120] *GTNG602--
Ziółkowski et al., 2019 [121]GT/STNG520143100
Omar et al., 2020 [122]STCSP-70-
Parvez and Khan 2020 [123] *GT/STBM61241127
Koç et al., 2020 [124]GT-450--
Niu et al., 2021 [125] *STBM598-147
NG: Natural Gas; BM: Biomass; HR: Heat Recovery; CSP: Concentrated Solar Power; *: HRSG system integrated into a GT system.
Table 11. Literature review of the values for Internal Combustion Engine selected parameters.
ReferenceFuelICE-ET (°C)ICE-FET (°C)JW-OT (°C)Notes
Zhao et al., 2010 [126]NG530140 *98Combined with an AHP
Rabovitser et al., 2013 [127]**487--The mix of gases was one of the varied parameters
Zhao et al., 2014 [128]NG510170*110Combined with an AHP
Wang et al., 2014 [129]-500--Waste heat used by a CO2 thermodynamic cycle
Maheswari et al., 2015 [130]DSL410120-Waste heat for desalination purposes
Scaccabarozzi et al., 2017 [131]DSL350--For optimization of heat recovery ORCs
Frigo and Spazzafumo 2018 [132]NG
H2
880--Temperature achieved when using H2. (620 °C for NG)
Mohammadkhani and Yari 2019 [133]DSL52512087Feeding a transcritical dual loop ORC
Kim et al., 2020 [134]CH458766-ICE in combination with a SOFC
Choi and Song 2020 [135]NG600-110 ***ICE in combination with a SOFC
AHP: Absorption Heat Pump; NG: Natural gas; DSL: Diesel; SOFC: Solid Oxide Fuel Cell; *: During the summer; **: Mix of gases; ***: Oil coolant.
Table 11 brings the selected parameters for ICE technologies. Three types of potential parameters were identified in the literature: ICE exhaust temperature (ICE-ET, right after the ICE exhaust exit), ICE final exhaust temperature (ICE-FET, after it had been used in any upstream process), and jacket water output temperature (JW-OT, the ICE coolant water output). ICE-ET has a substantially high exergy level content, and, especially in the case of stationary ICEs, it is used to feed another thermal system. With an average ICE-ET of 537.9 °C, it is able to feed, for instance, high temperature absorption heat pumps [126], desalination systems [130], and organic Rankine cycles [133]. For that reason, ICE-ET is not considered in the evaluation of Section 4.2 since its temperature level is too high for small–medium CHP technologies. An average temperature of 123.2 °C was encountered for the ICE-FET, which is also a good potential waste heat to drive small CHP heat recovery technologies. Some papers also analyze the use of the JW-OT together with the ICE-ET to make better use of the primary energy. The average JW-OT found in the literature was 101.2 °C and, together with ICE-FET, is also considered for the Section 4.2 analysis.
For high temperature waste heat (about 400 °C, or higher) and sizes above 5 MW, a bottom steam Rankine cycle is the first option to be evaluated [37]. For significantly smaller sizes and lower temperatures, ORC groups are preferred. Note that both steam units and ORC units can easily operate as cogeneration systems with heat production (in the form of saturated steam or hot water) at temperatures between 40 °C and 110 °C and, in some cases, even higher. These thermal levels may be suitable for many technological uses [136], but certainly for space heating. The quantities of heat available in this way are potentially important, given that power plants hardly have an electrical efficiency greater than 50%, which means that about 50% of the energy stored in chemical form is not converted back into electricity, but it is still available in the form of heat.
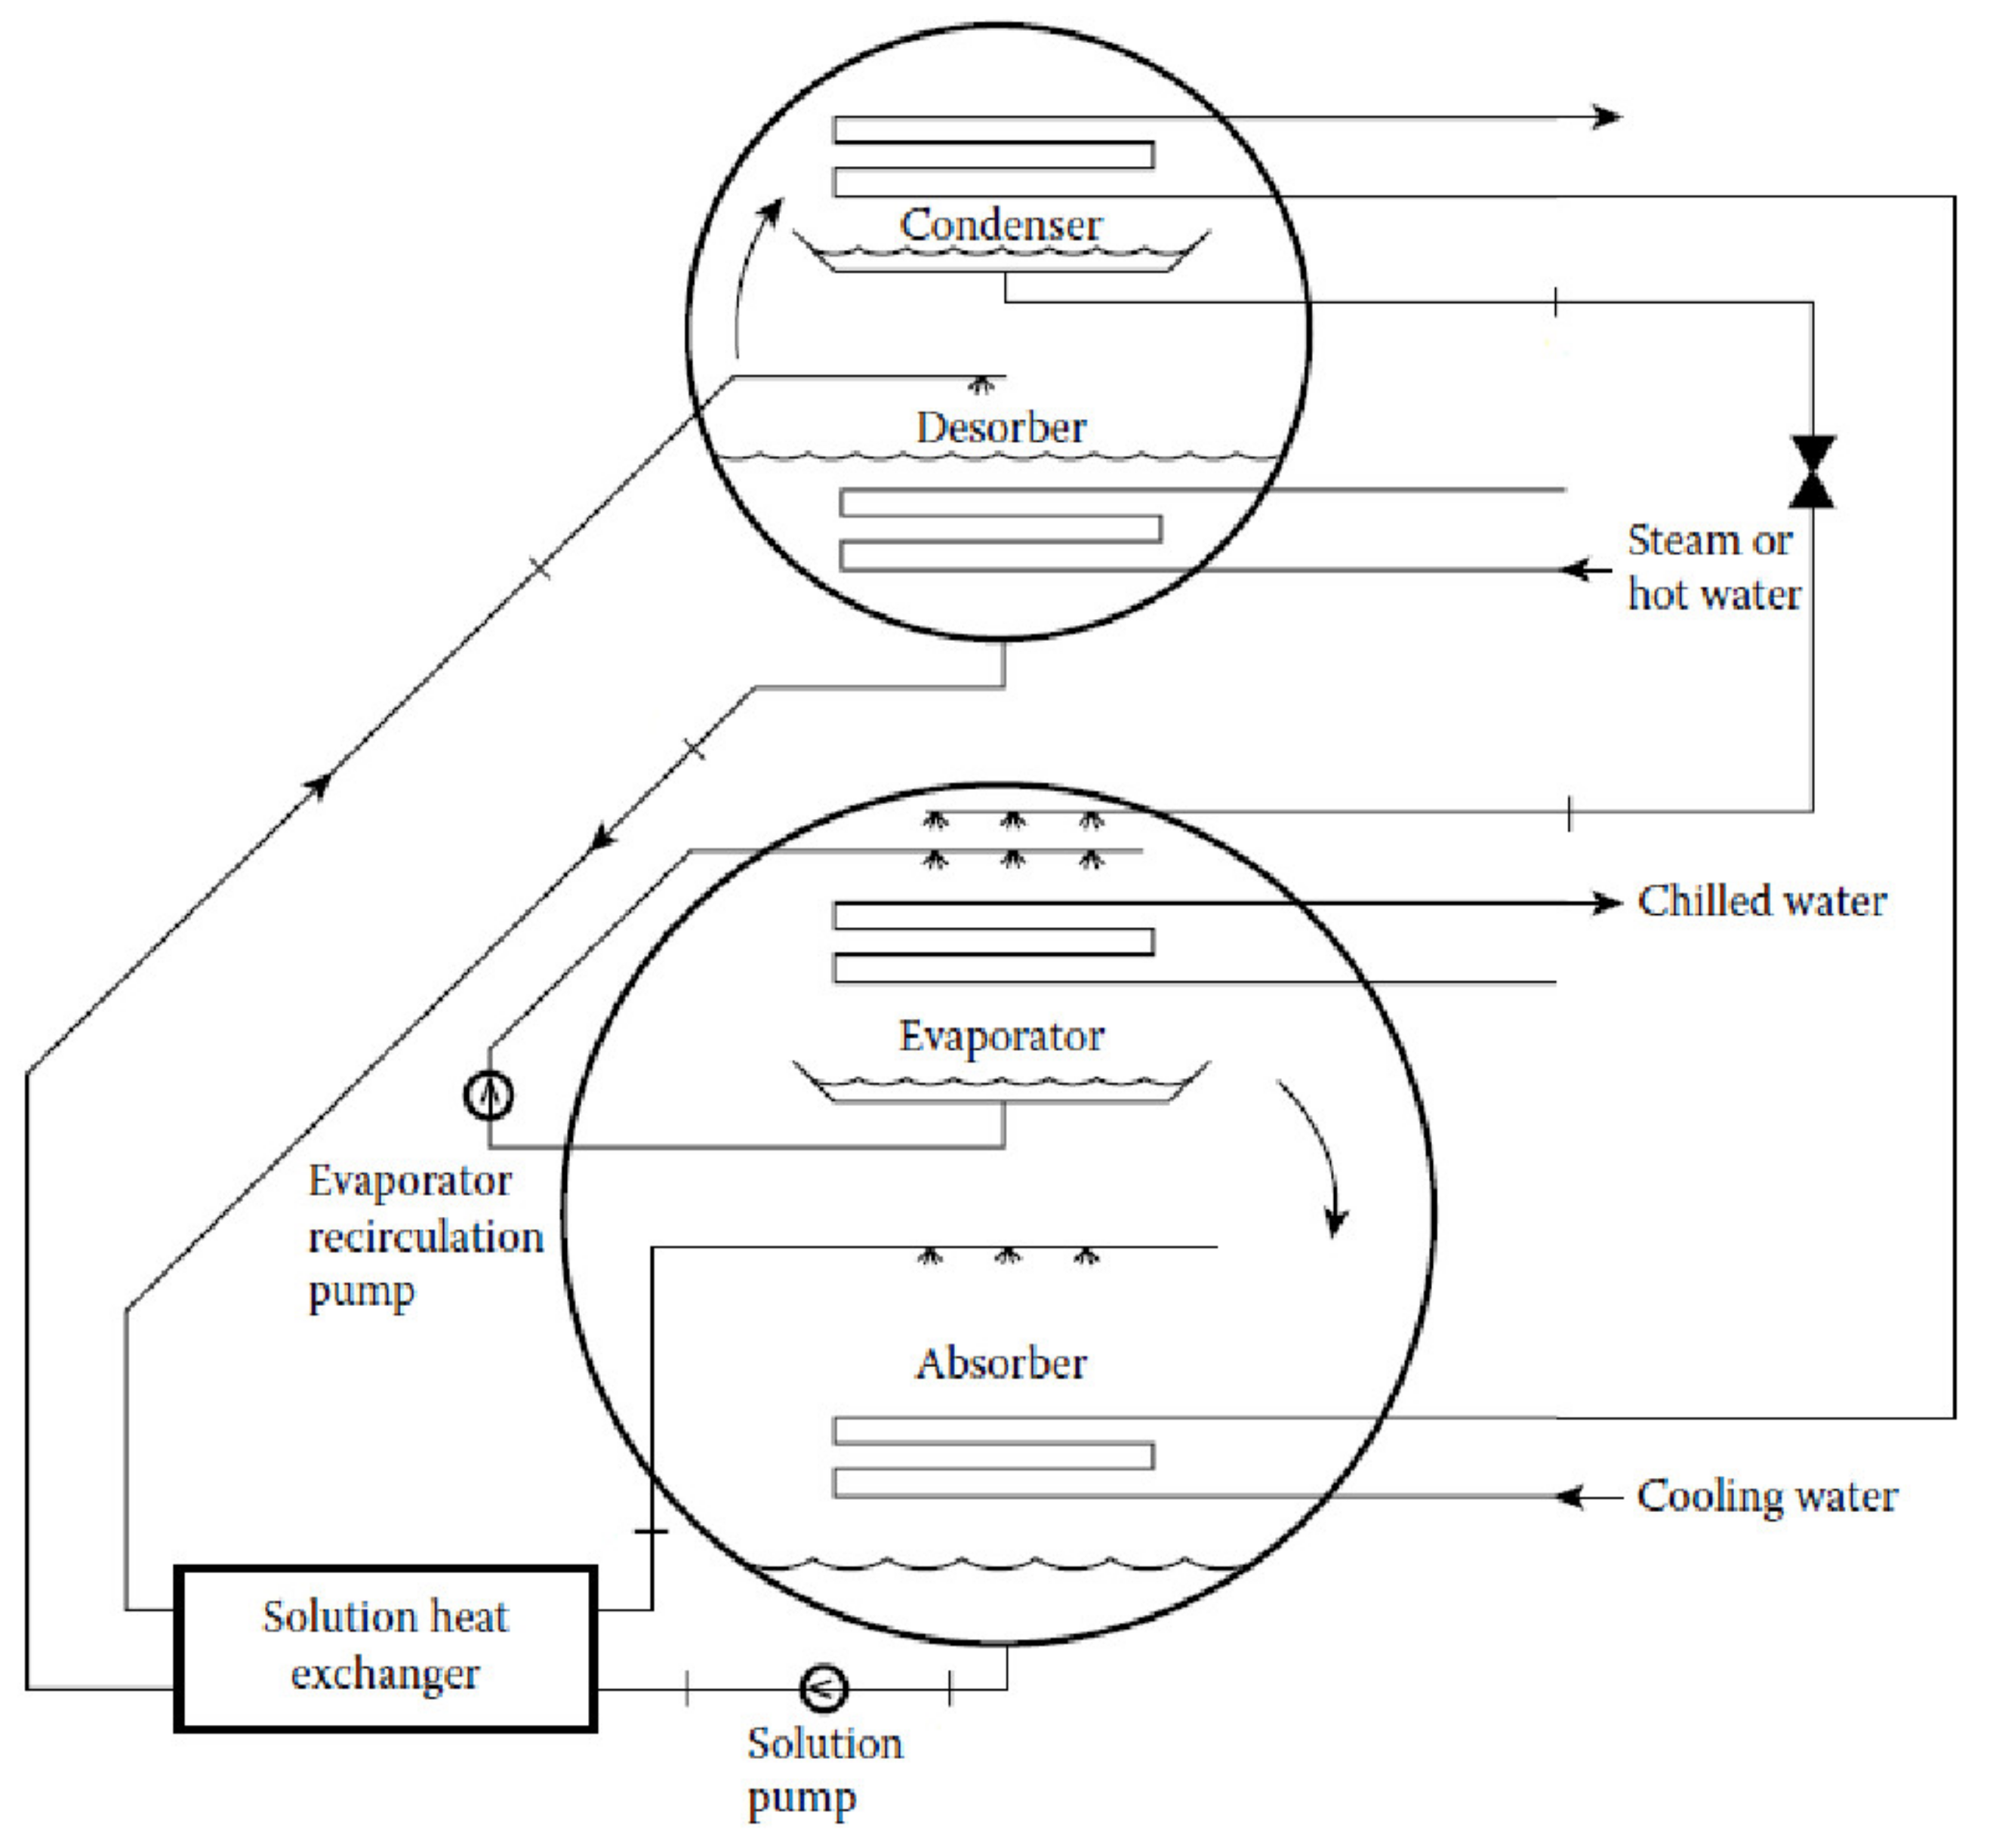
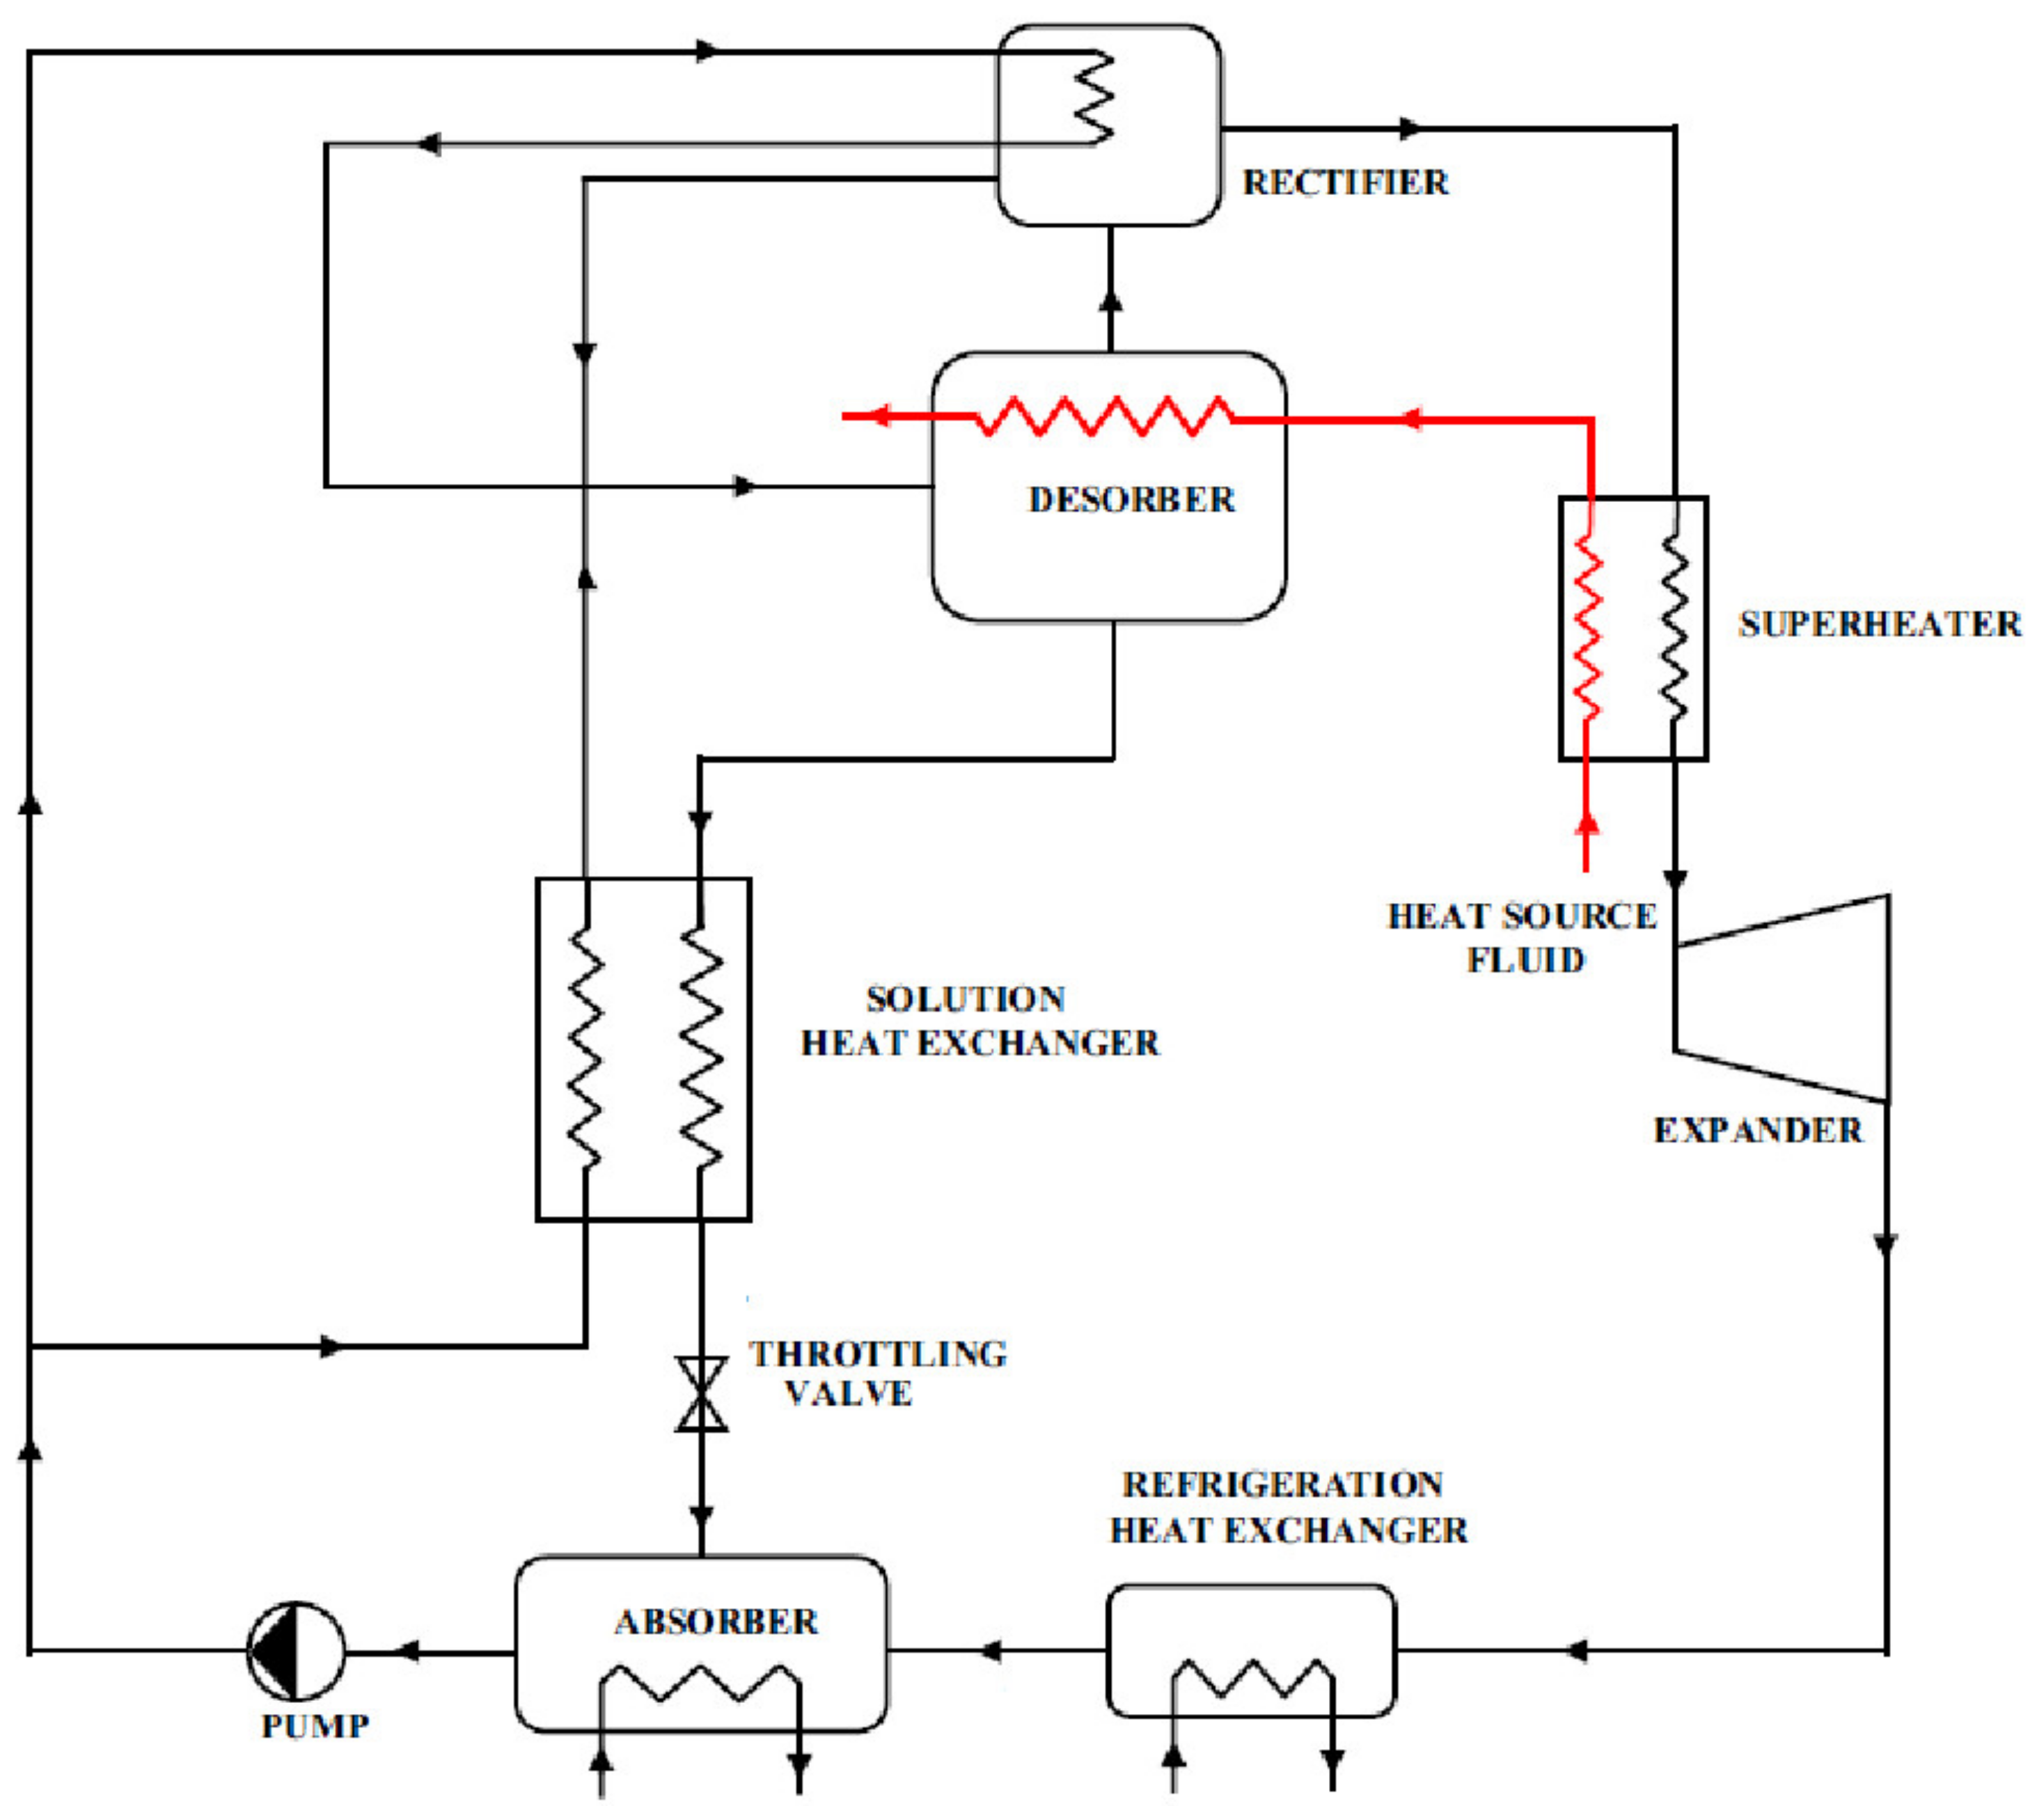
If other forms of accumulation of excess electrical power were preferred, reducing the expected contribution from power-to-chemical-to-power systems, the integration of low temperature heat in local distribution networks is expected to be even more interesting and would offer the option of connecting such systems with solar thermal systems, according to the SDH concept. Even in a highly electrified context, this solution is expected to improve the energy performance of the entire system. For the exploitation of heat at even lower temperatures, from 80 °C to 140 °C, the use of ORC is still possible but with modest yields. In the lower part of the range, technologies based on the absorption process become competitive, in particular the Absorption Power Cycles, which, in such conditions, have slightly better yields than the ORC cycles [137]. The integration of low temperature heat (as low as about 40 °C) in local distribution networks can still be useful, according to the concept of low temperature DH [138].

4.2. Integration between Waste Heat Sources and CHP Technologies

As explained in the last section, this section gathers, presents, and confronts all the data collected until this point. Following the adopted methodology, the first step here is to bring together and present a summary of the data related to the reviewed parameters of all potential waste heat sources (selected in Section 4.1) and of all CHP technologies reviewed in Section 2. The second step is to cross both sets of data to see which heat source is a potential source for each CHP technology. Table 12 presents the data related to the reviewed parameters of all potential waste heat sources, showing the minimum and maximum temperatures found in the literature for each heat source as well as the respective average temperature for each range. Table 13 presents the feeding temperature range and the respective output capacity range for the selected CHP technologies, reviewed in Section 2.
Confronting Table 12 and Table 13, it is possible to observe that, as stated in the last section, PVBT, PVT-WOT, and SWH-WOT have quite low temperature levels and do not have the potential to feed the CHP technologies reviewed in Section 2. On the other hand, and following a similar analysis, one can note that all the heat sources from BRT to HRSG-ET have the potential of feeding the CHP technologies presented in Table 13 since their temperature ranges overlap at some points. Even though GT-OT and ICE-ET heat sources have a substantially high potential for feeding secondary thermal systems, they are not considered since their temperature levels are quite high and do not overlap the temperature ranges of the CHP technologies at any point. A more detailed analysis is presented in Figure 4, Figure 5, Figure 6 and Figure 7.
The next set of charts (Figure 4, Figure 5, Figure 6 and Figure 7) presents the data intersection concerning the heat sources from BRT to HRSG-ET (Table 12) and the technologies presented in Table 13. Following Table 13, 
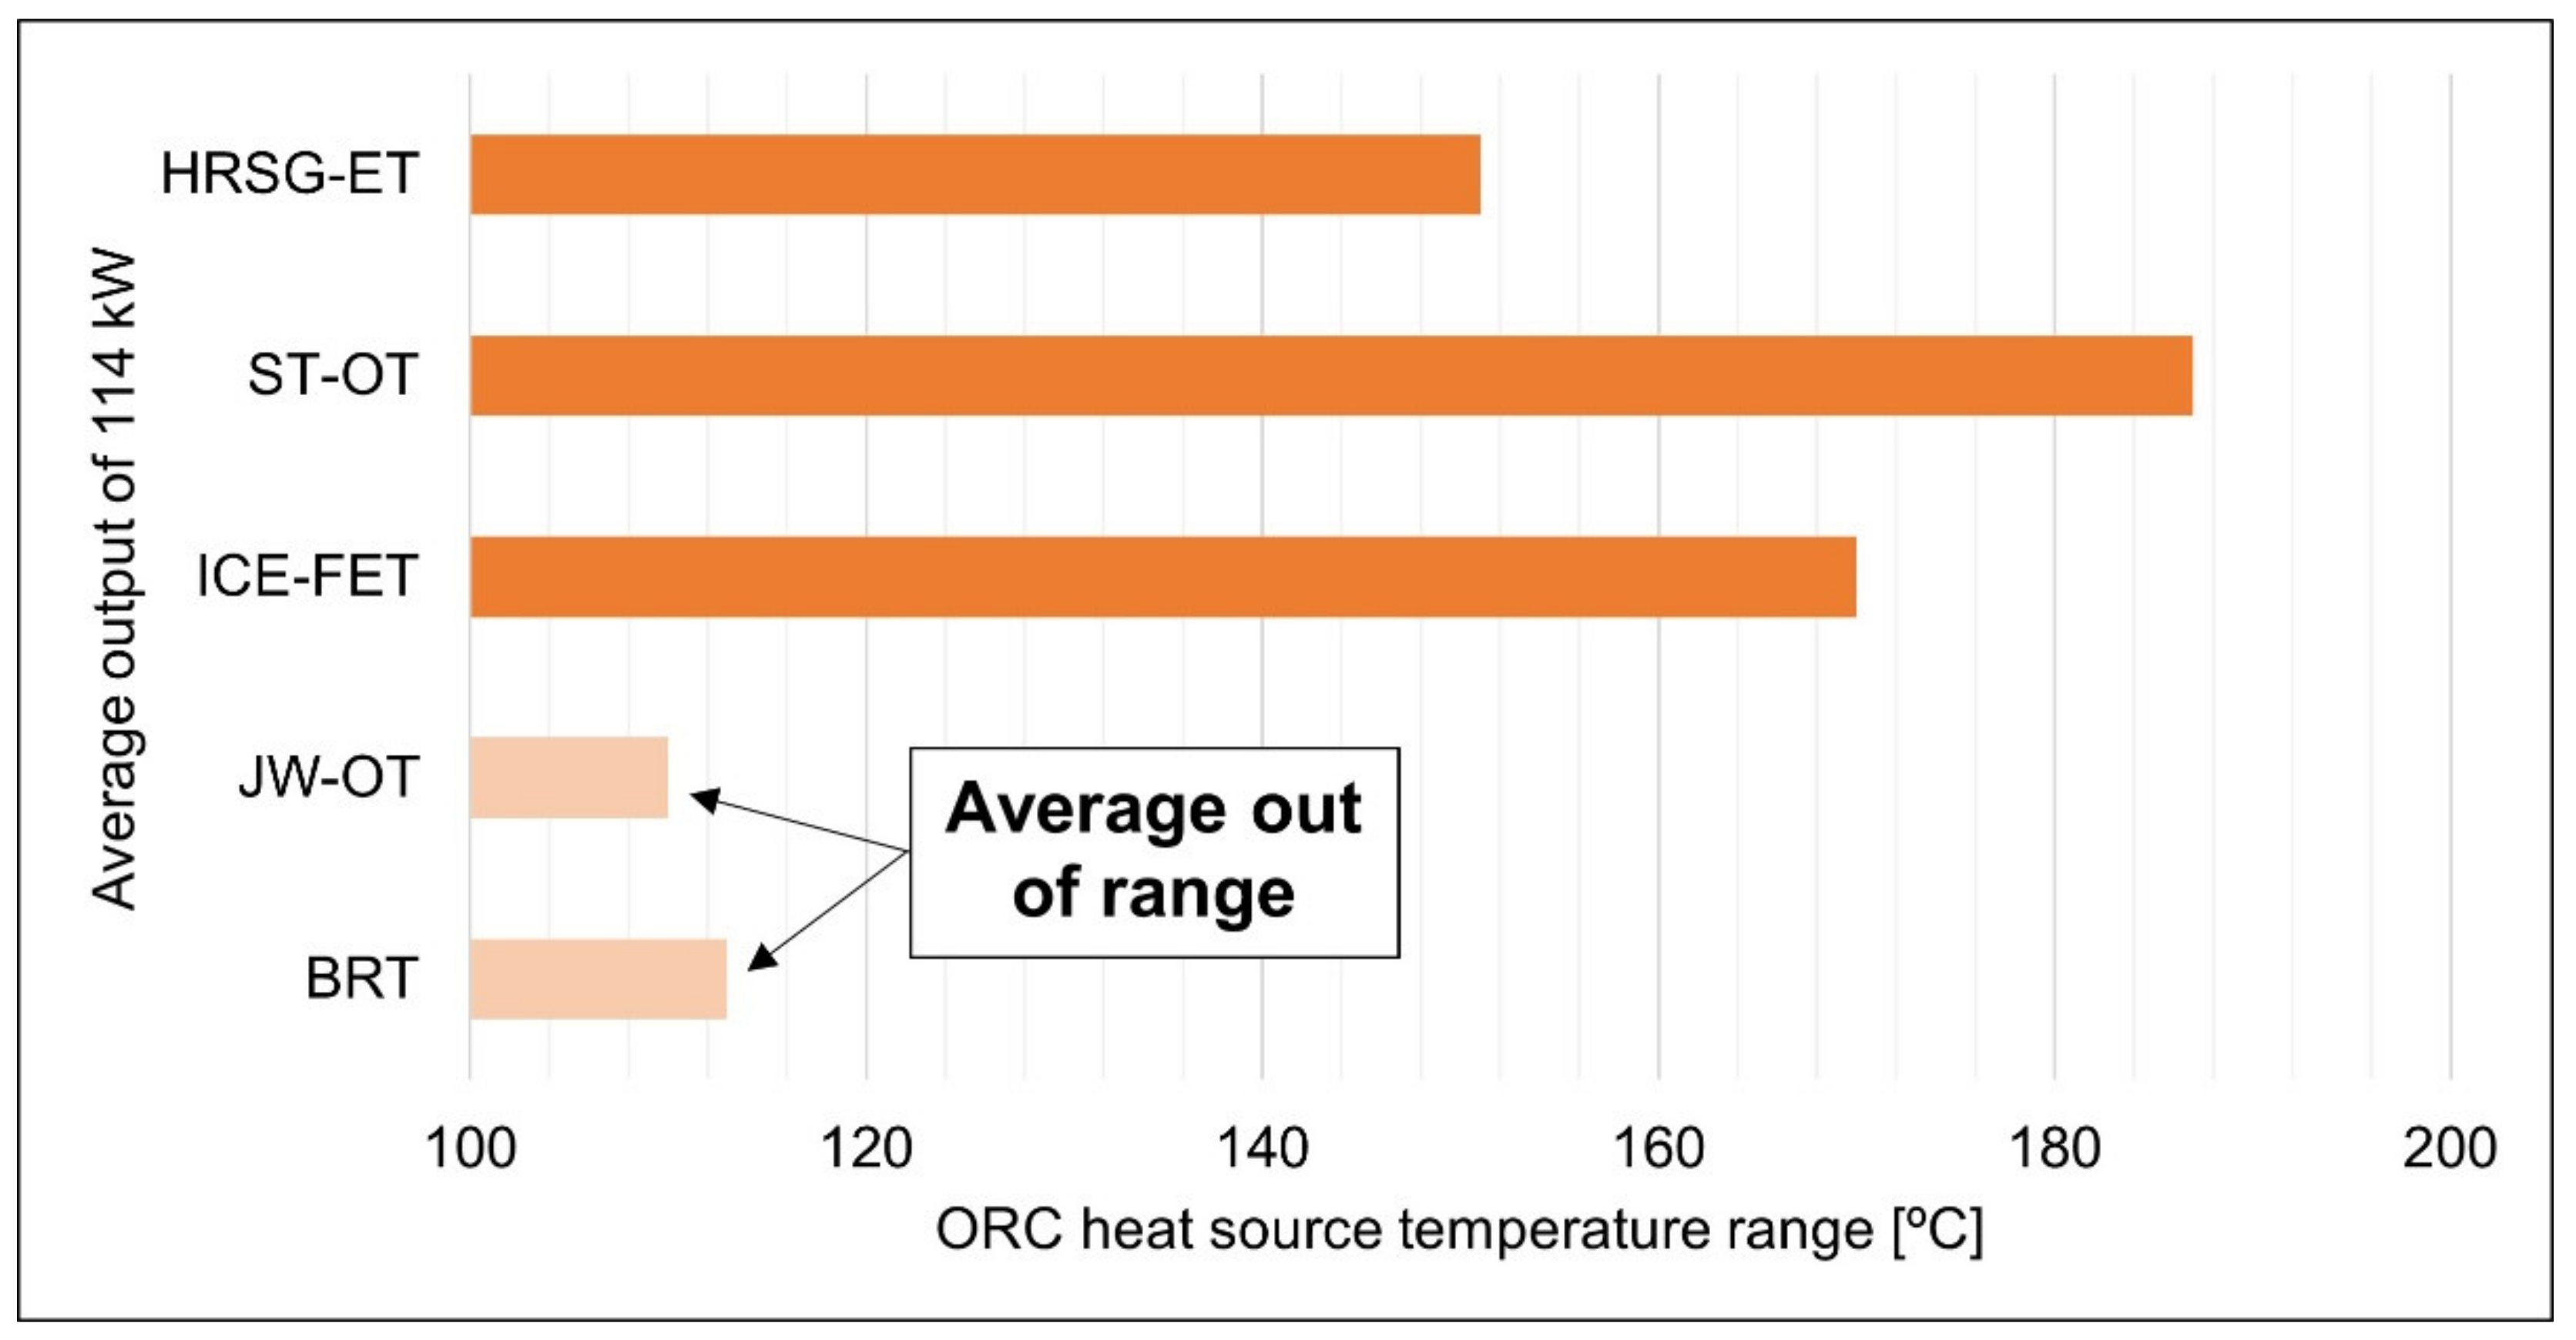
Figure 4 shows the feeding temperature range for the ORC systems reviewed in Section 2. The horizontal bars represent the temperature range for the reviewed parameters of the five selected heat sources mentioned in the last paragraph, according to Table 12. As observed in Figure 4, in this case, only the HRSG-ET, ST-OT, and ICE-FET heat sources are considered to be suitable for feeding ORC systems since their average temperatures are inside the ORC temperature range and the largest part of their temperature ranges overlap. Some cases of the JW-OT and BRT heat sources are suitable for feeding ORC systems as well; however, their average temperatures are outside the temperature range of the ORC systems, and the largest part of their temperature ranges do not overlap. For that reason, they are not considered as potential heat sources for ORC systems. According to Table 13, the reviewed ORC systems have the potential to deliver an average output of 114 kW of power within this feeding temperature range. With similar results, 
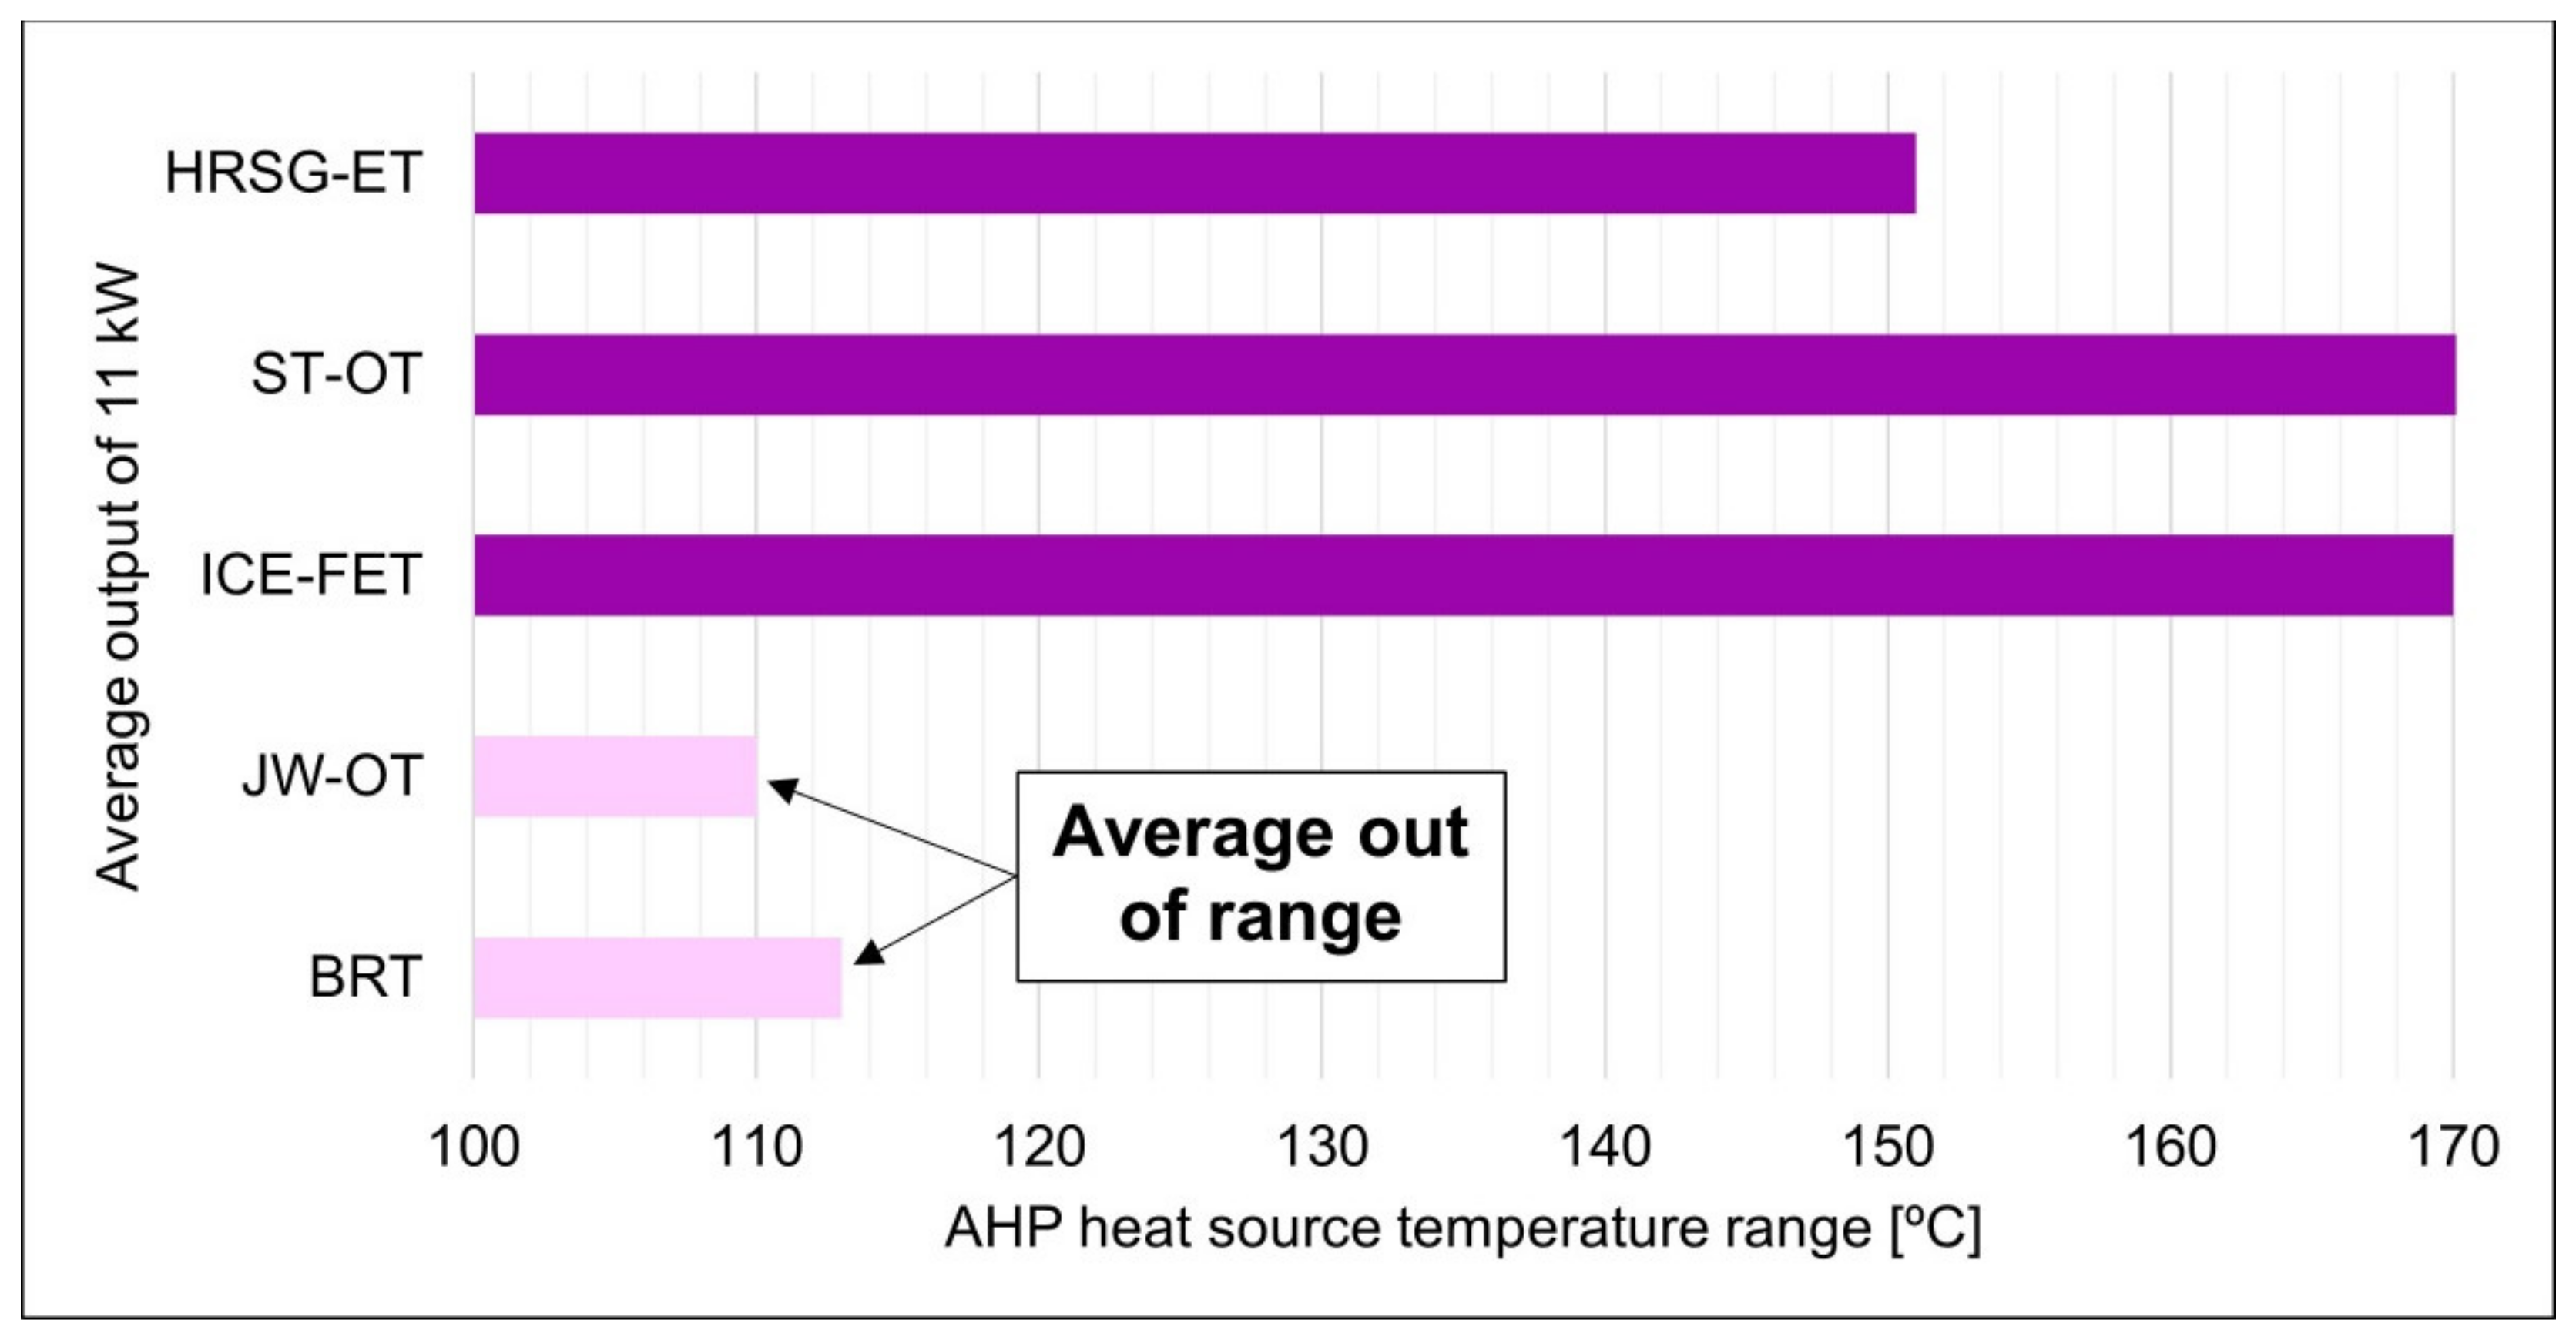
Figure 5 illustrates the crossing data between the temperature range of the considered heat sources and the feeding temperature range for absorption heat pumps (100–170 °C). The heat sources considered suitable for feeding AHP systems were also HRSG-ET, ST-OT, and ICE-FET for the same reasons stressed out for ORC systems. According to Table 13, within the reviewed feeding temperature range, each AHP unit is capable of delivering an average output of 11 kW of heat.
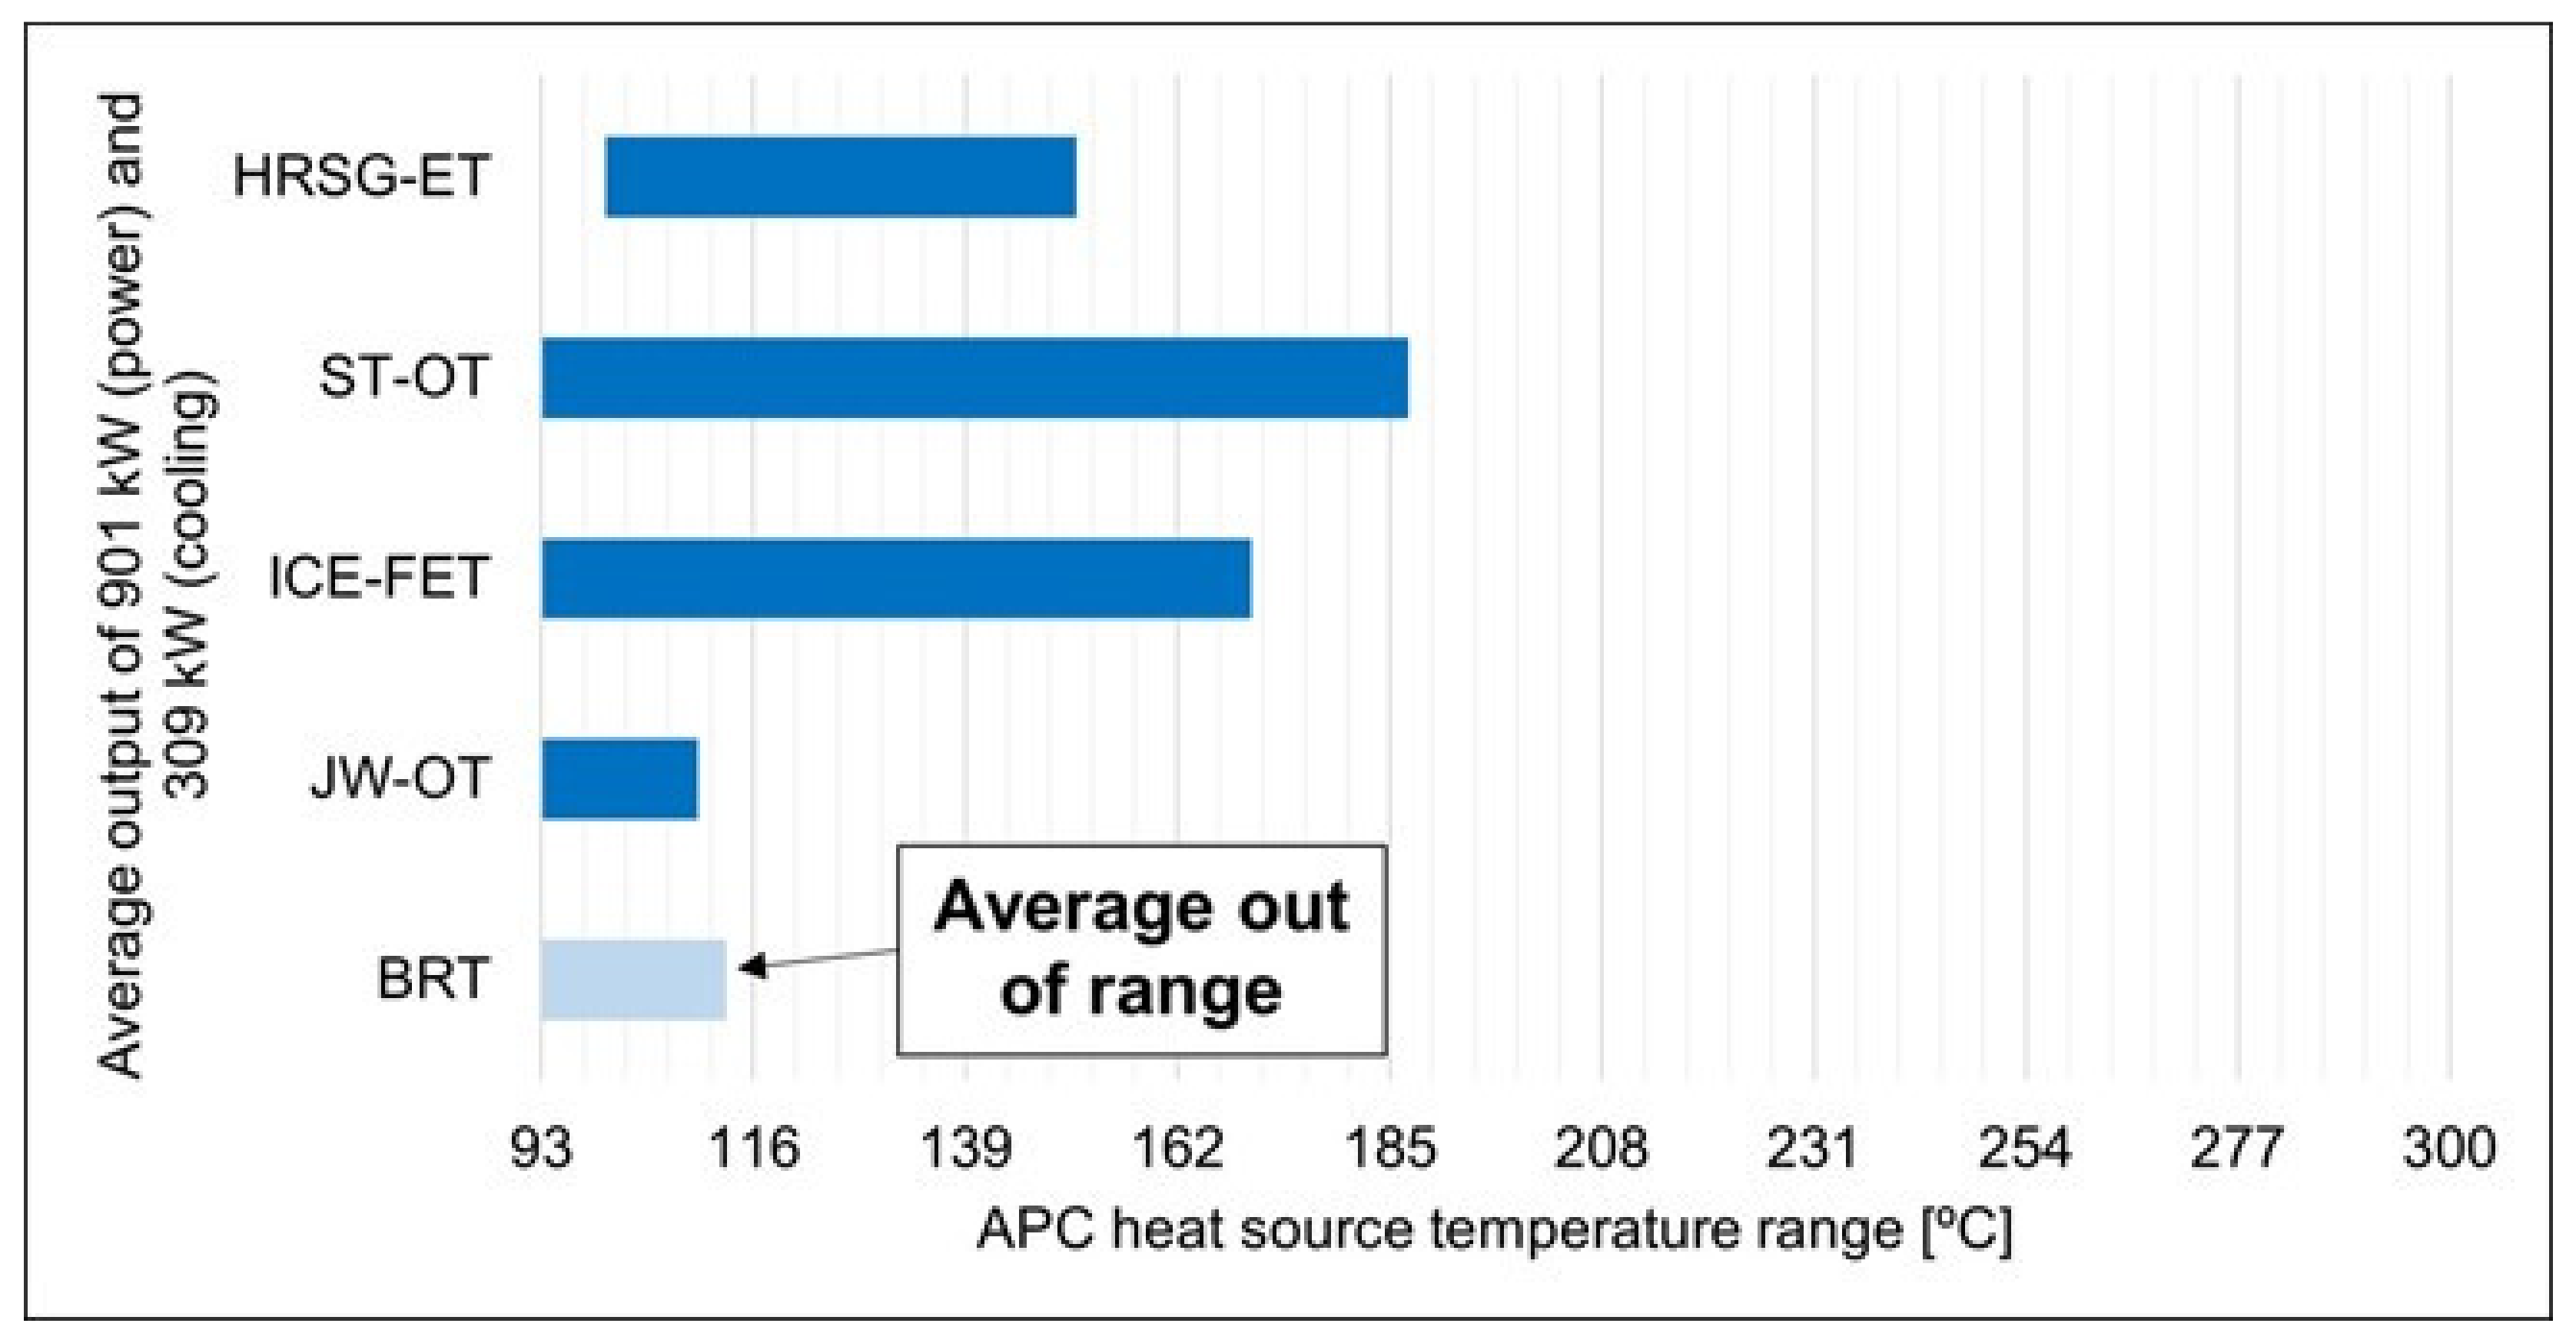
Figure 6 illustrates the feeding temperature range for the APC systems reviewed in 
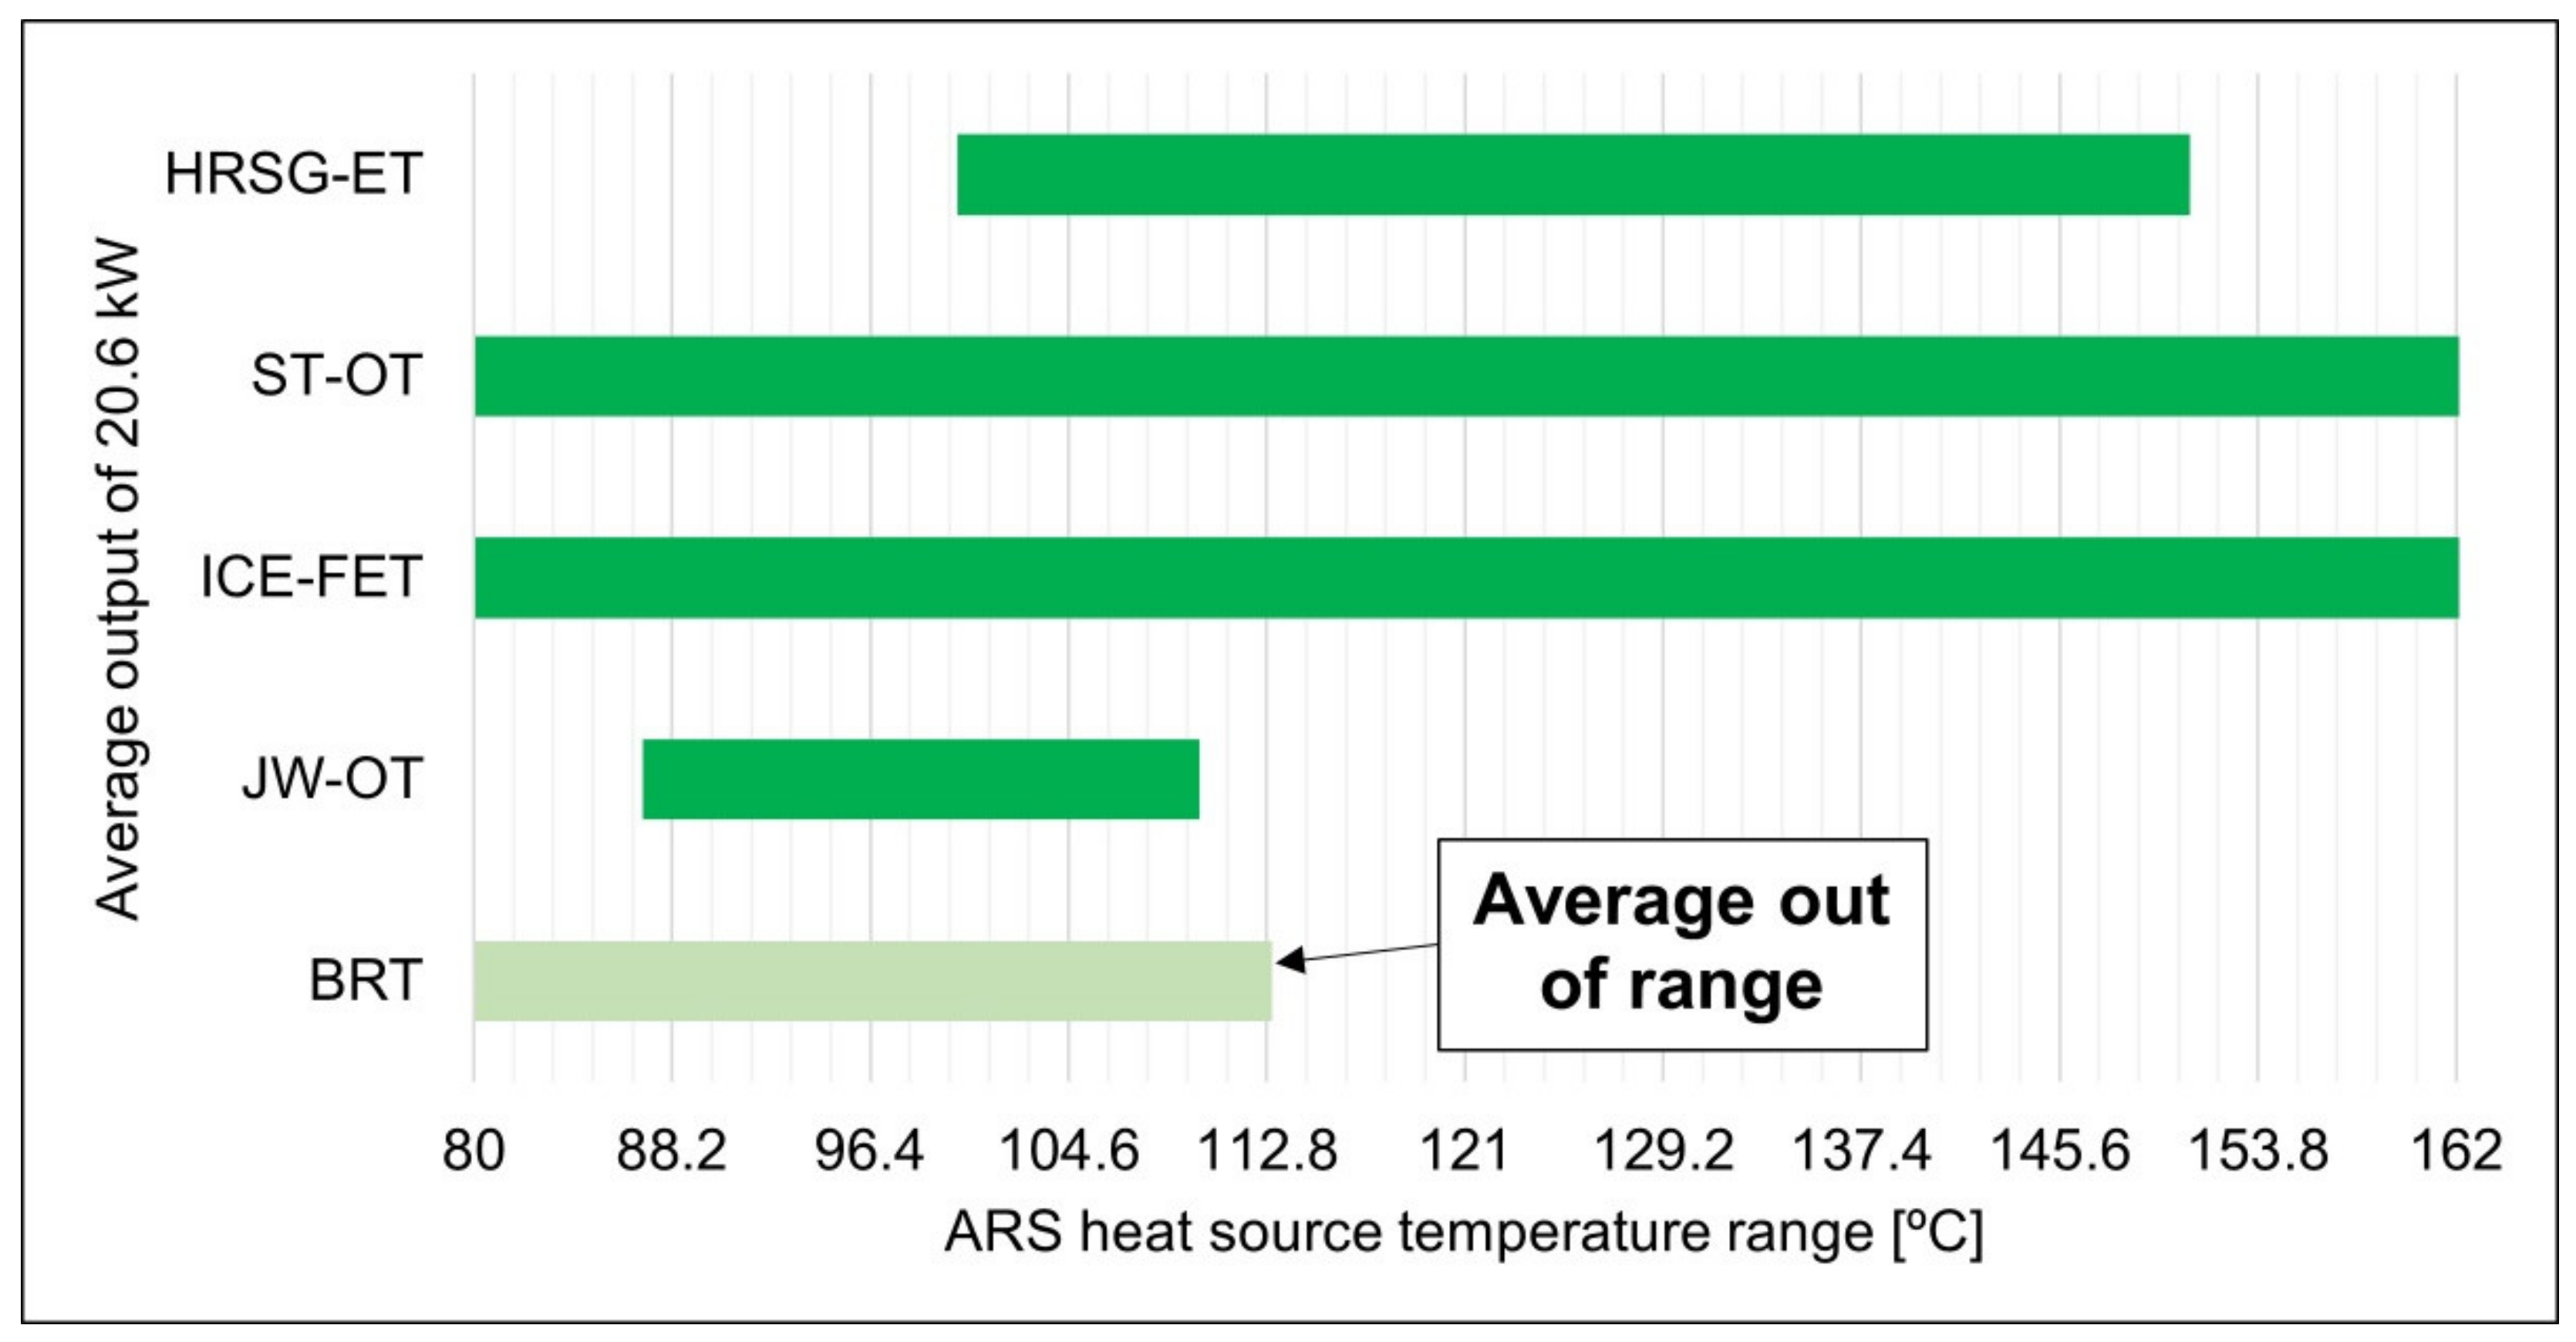
Section 2. For this type of system, it was found a broader feeding temperature range, from 93 to 300 °C. Besides the same heat sources suitable for ORC systems (HRSG-ET, ST-OT, and ICE-FET), JW-OT was also appropriate for APC systems since its average temperature is inside the APC temperature range and the largest part of their temperature ranges overlap. From the reviewed APC studies, an average output of 901 kW for power and 309 kW for cooling was found. As can be inferred from the chart, the temperature ranges of each suitable heat source are overlapping just the first half of the feeding temperature range of APC systems. Therefore, it might be expected that, with those heat sources, the designed APC system will deliver lower output levels. Comparable results were found for Absorption Refrigeration Systems, i.e., the suitable heat sources were also HRSG-ET, ST-OT, ICE-FET, and JW-OT (Figure 7). However, the review of the feeding temperature range for ARS resulted in a narrower range of temperatures (80–162 °C). Within this range, ARS is expected to deliver 20.6 kW of cooling output, which is quite achievable for all four suitable heat sources mentioned since they occupy almost the entire feeding temperature range for ARS.

4.3. Brief Economic Perspectives

The purpose of this section is to estimate the potential annual savings that each CHP technology could provide. Such estimation is based on the assumption of three key parameters, summarized in Table 14. The first one is the number of working hours per year. For all four CHP technologies reviewed in Section 2, it is assumed to be 6000 h/year of work [39]. The second key parameter is the average output (Table 13) for each CHP technology, which indicates a representative output value for the feeding temperature range of each CHP technology. The third parameter is the Levelized Cost of Electricity (LCOE) or the Levelized Cost of Heat (LCOH), calculated within the LUT model [25].
In the research conducted by Bogdanov et al. [25], they observed a decreasing trend for both LCOE and LCOH when they increased the level of energy system integration in the year 2050. For that reason, the values selected for this work were the ones calculated for 2050, with the highest integration of energy systems foreseen in the LUT model. Figure 8 illustrates the results for the potential annual savings that each CHP unit of a specified technology can provide. Those annual savings means that, if a small–medium CHP unit is incorporated into a large thermal energy system by exploiting the waste heat of the latter, the amount of power and/or heat output produced by this CHP unit may be incorporated into the main product outputs of the large thermal energy system to help meet the final energy demand. Therefore, this extra amount of product outputs produced by the CHP units would prevent the large thermal energy system from spending the correspondent amount of primary energy and, consequently, prevent spending the correspondent amount of monetary resources.
It is also possible to approach this analysis differently, namely the expected, saved economic resources per unit of installed kW of the considered CCHP technology. The expected annual savings per installed kW related to power and heat production are summarized in Figure 9. Those values correspond to approximately 16 h of daily work of a combined thermal system (CCHP unit connected to a larger thermal system). In a scenario on which those daily hours approach 24 h a day, the correspondent expected savings would approach, respectively, EUR 372.00 and EUR 302.00 per installed kW related to power and heat production.

4.4. Perspectives on the Carbon Footprint within the Presented Scenario

As stressed in the introduction, the growing energy demand caused by the social-economic development of the world has resulted in higher rates of GHG emissions. This has led to higher amounts of carbon footprint for the energy sector since it is currently fed by high rates of fossil fuels [2]. For that reason, this section aims to succinctly approach the perspective of carbon footprint for what concerns the 100% RE scenario and the proposed CHP/CCHP integration.
In order to discuss such perspective, it is crucial to keep in mind two main aspects: first, this paper has dealt with a proposal that has the potential to improve even further the economic and environmental positive characteristics of the energy system within the 100% RE scenario, through the integration of small–medium CHP/CCHP systems as shown in the previous sections; second, the direct and indirect CO2 emission concepts. Direct emissions are those resulting from directly burning fossil fuels, while indirect emissions are those regarded to the entire life cycle of a given product, such as manufacturing, transportation, installation, and maintenance [139].
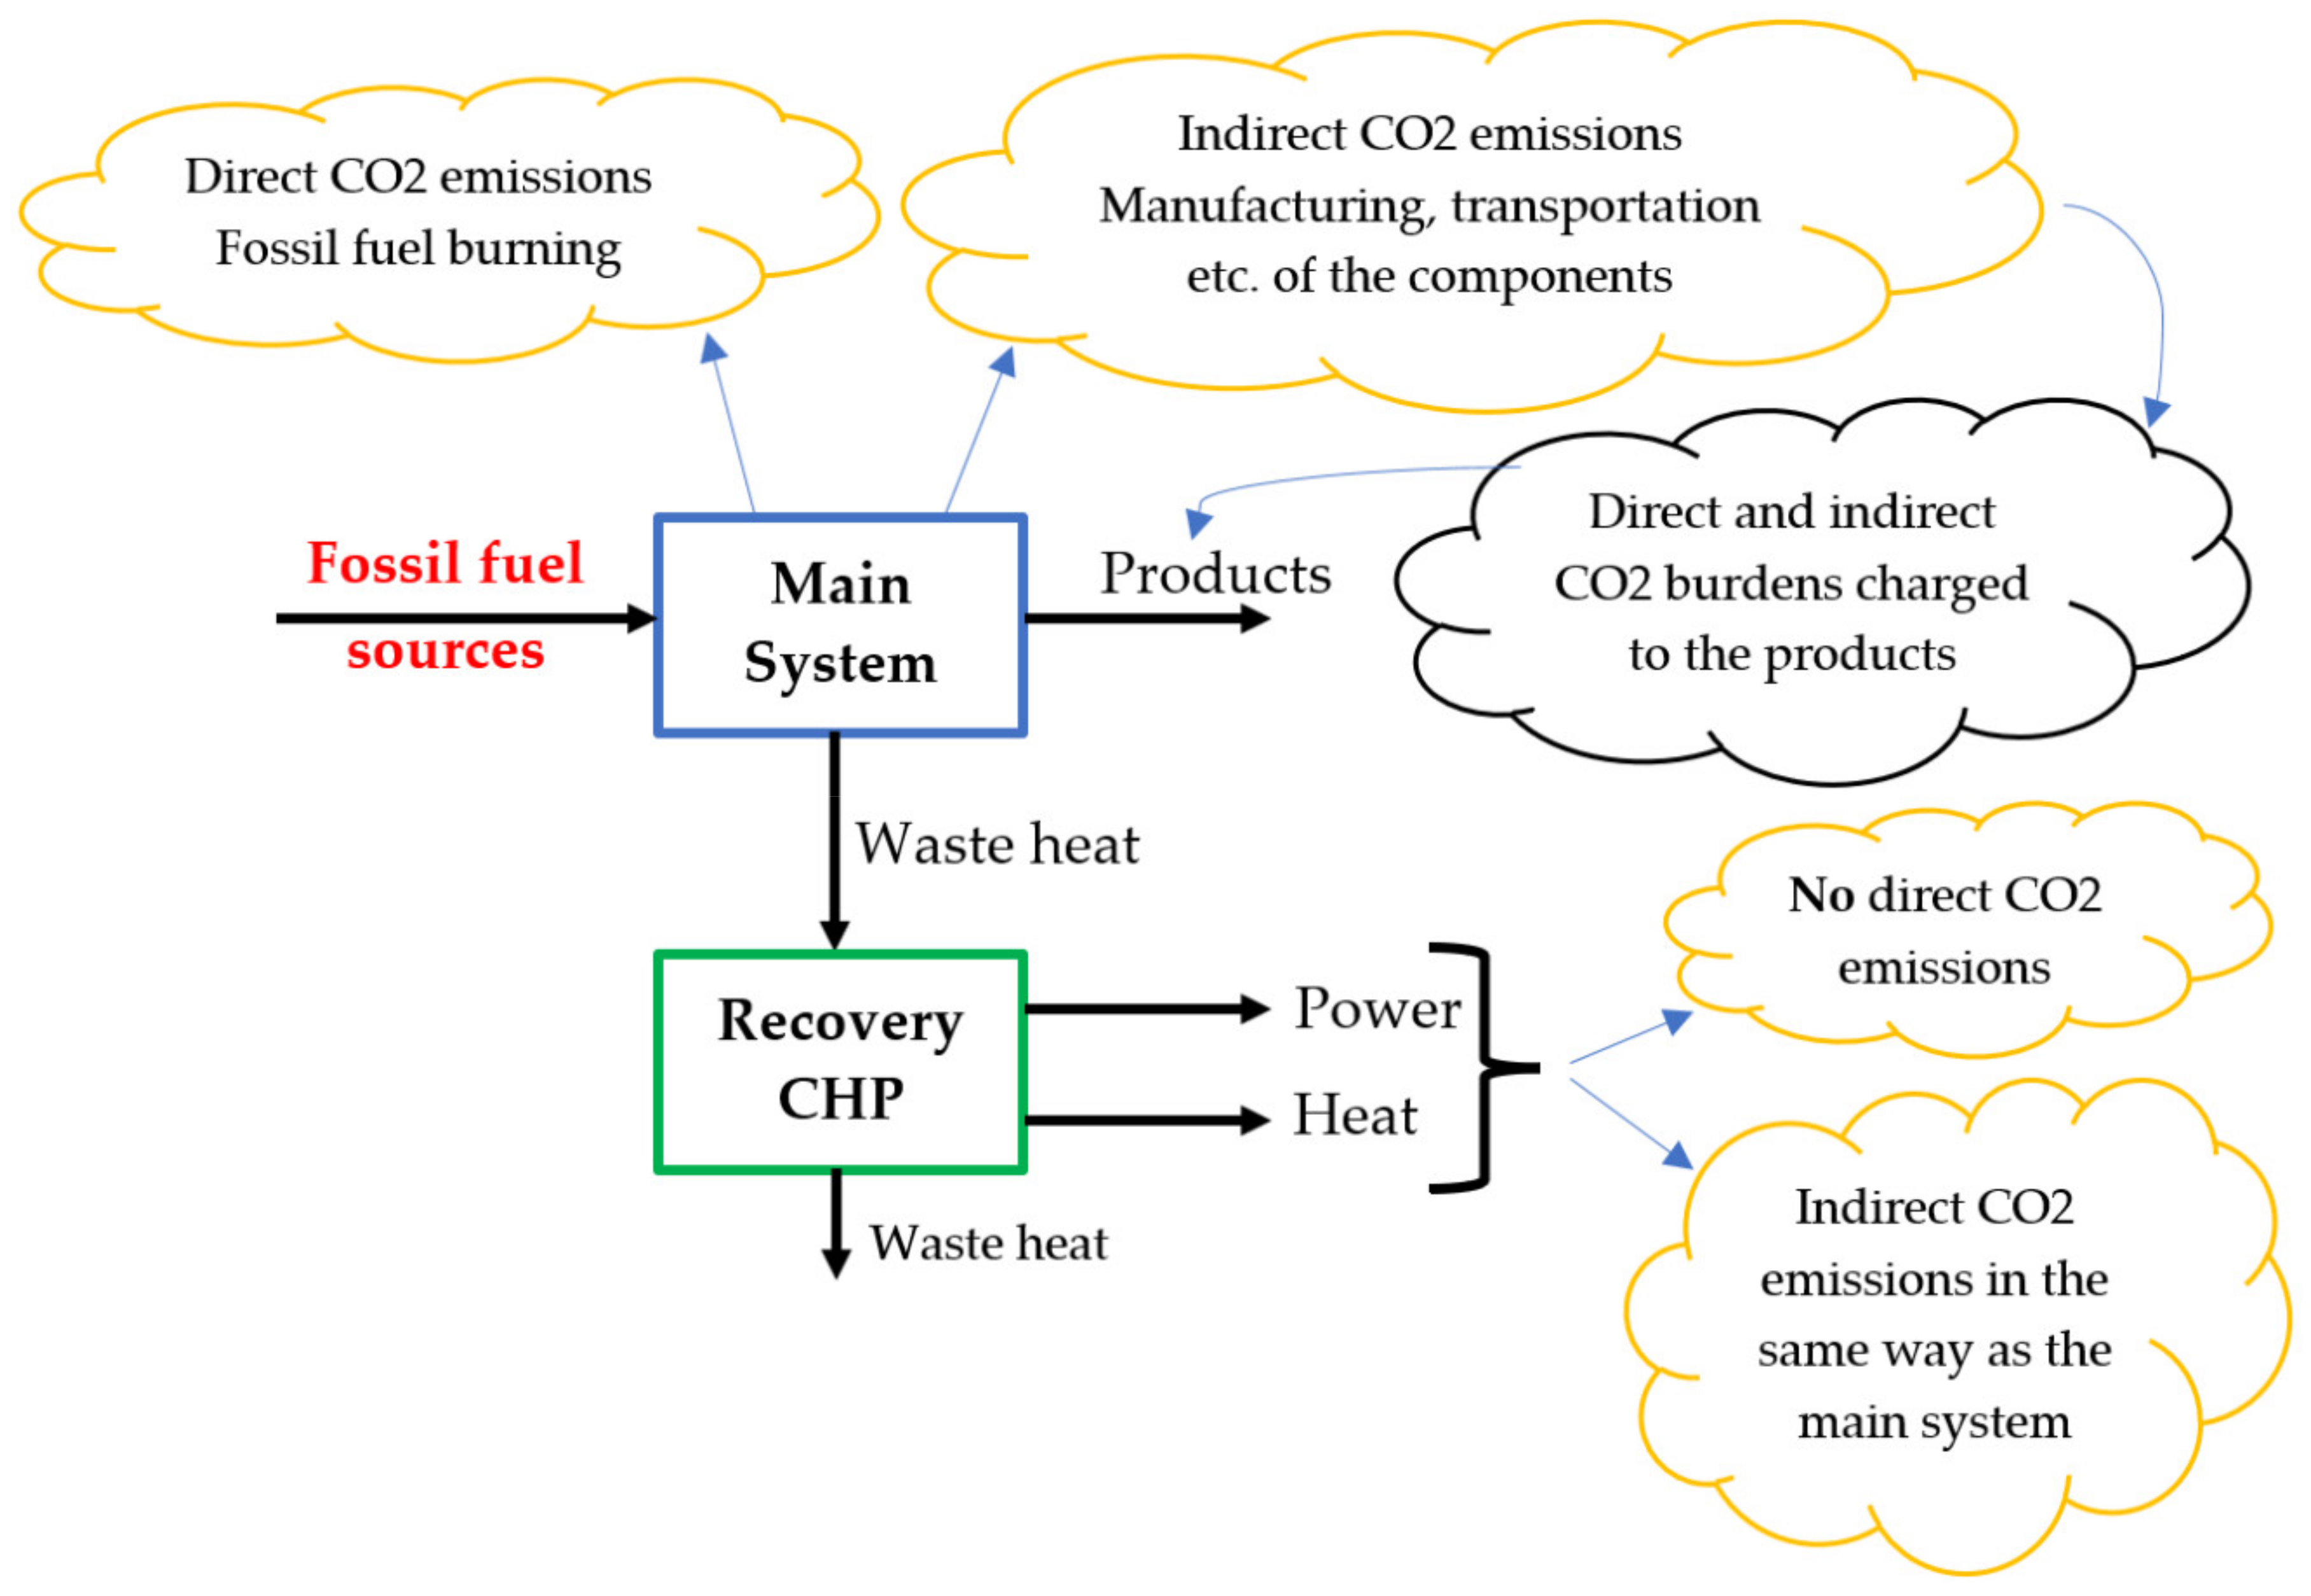
With the high rates of fossil fuels in the current primary energy sources scenario, the technologies integrating current energy systems contribute to both direct and indirect CO
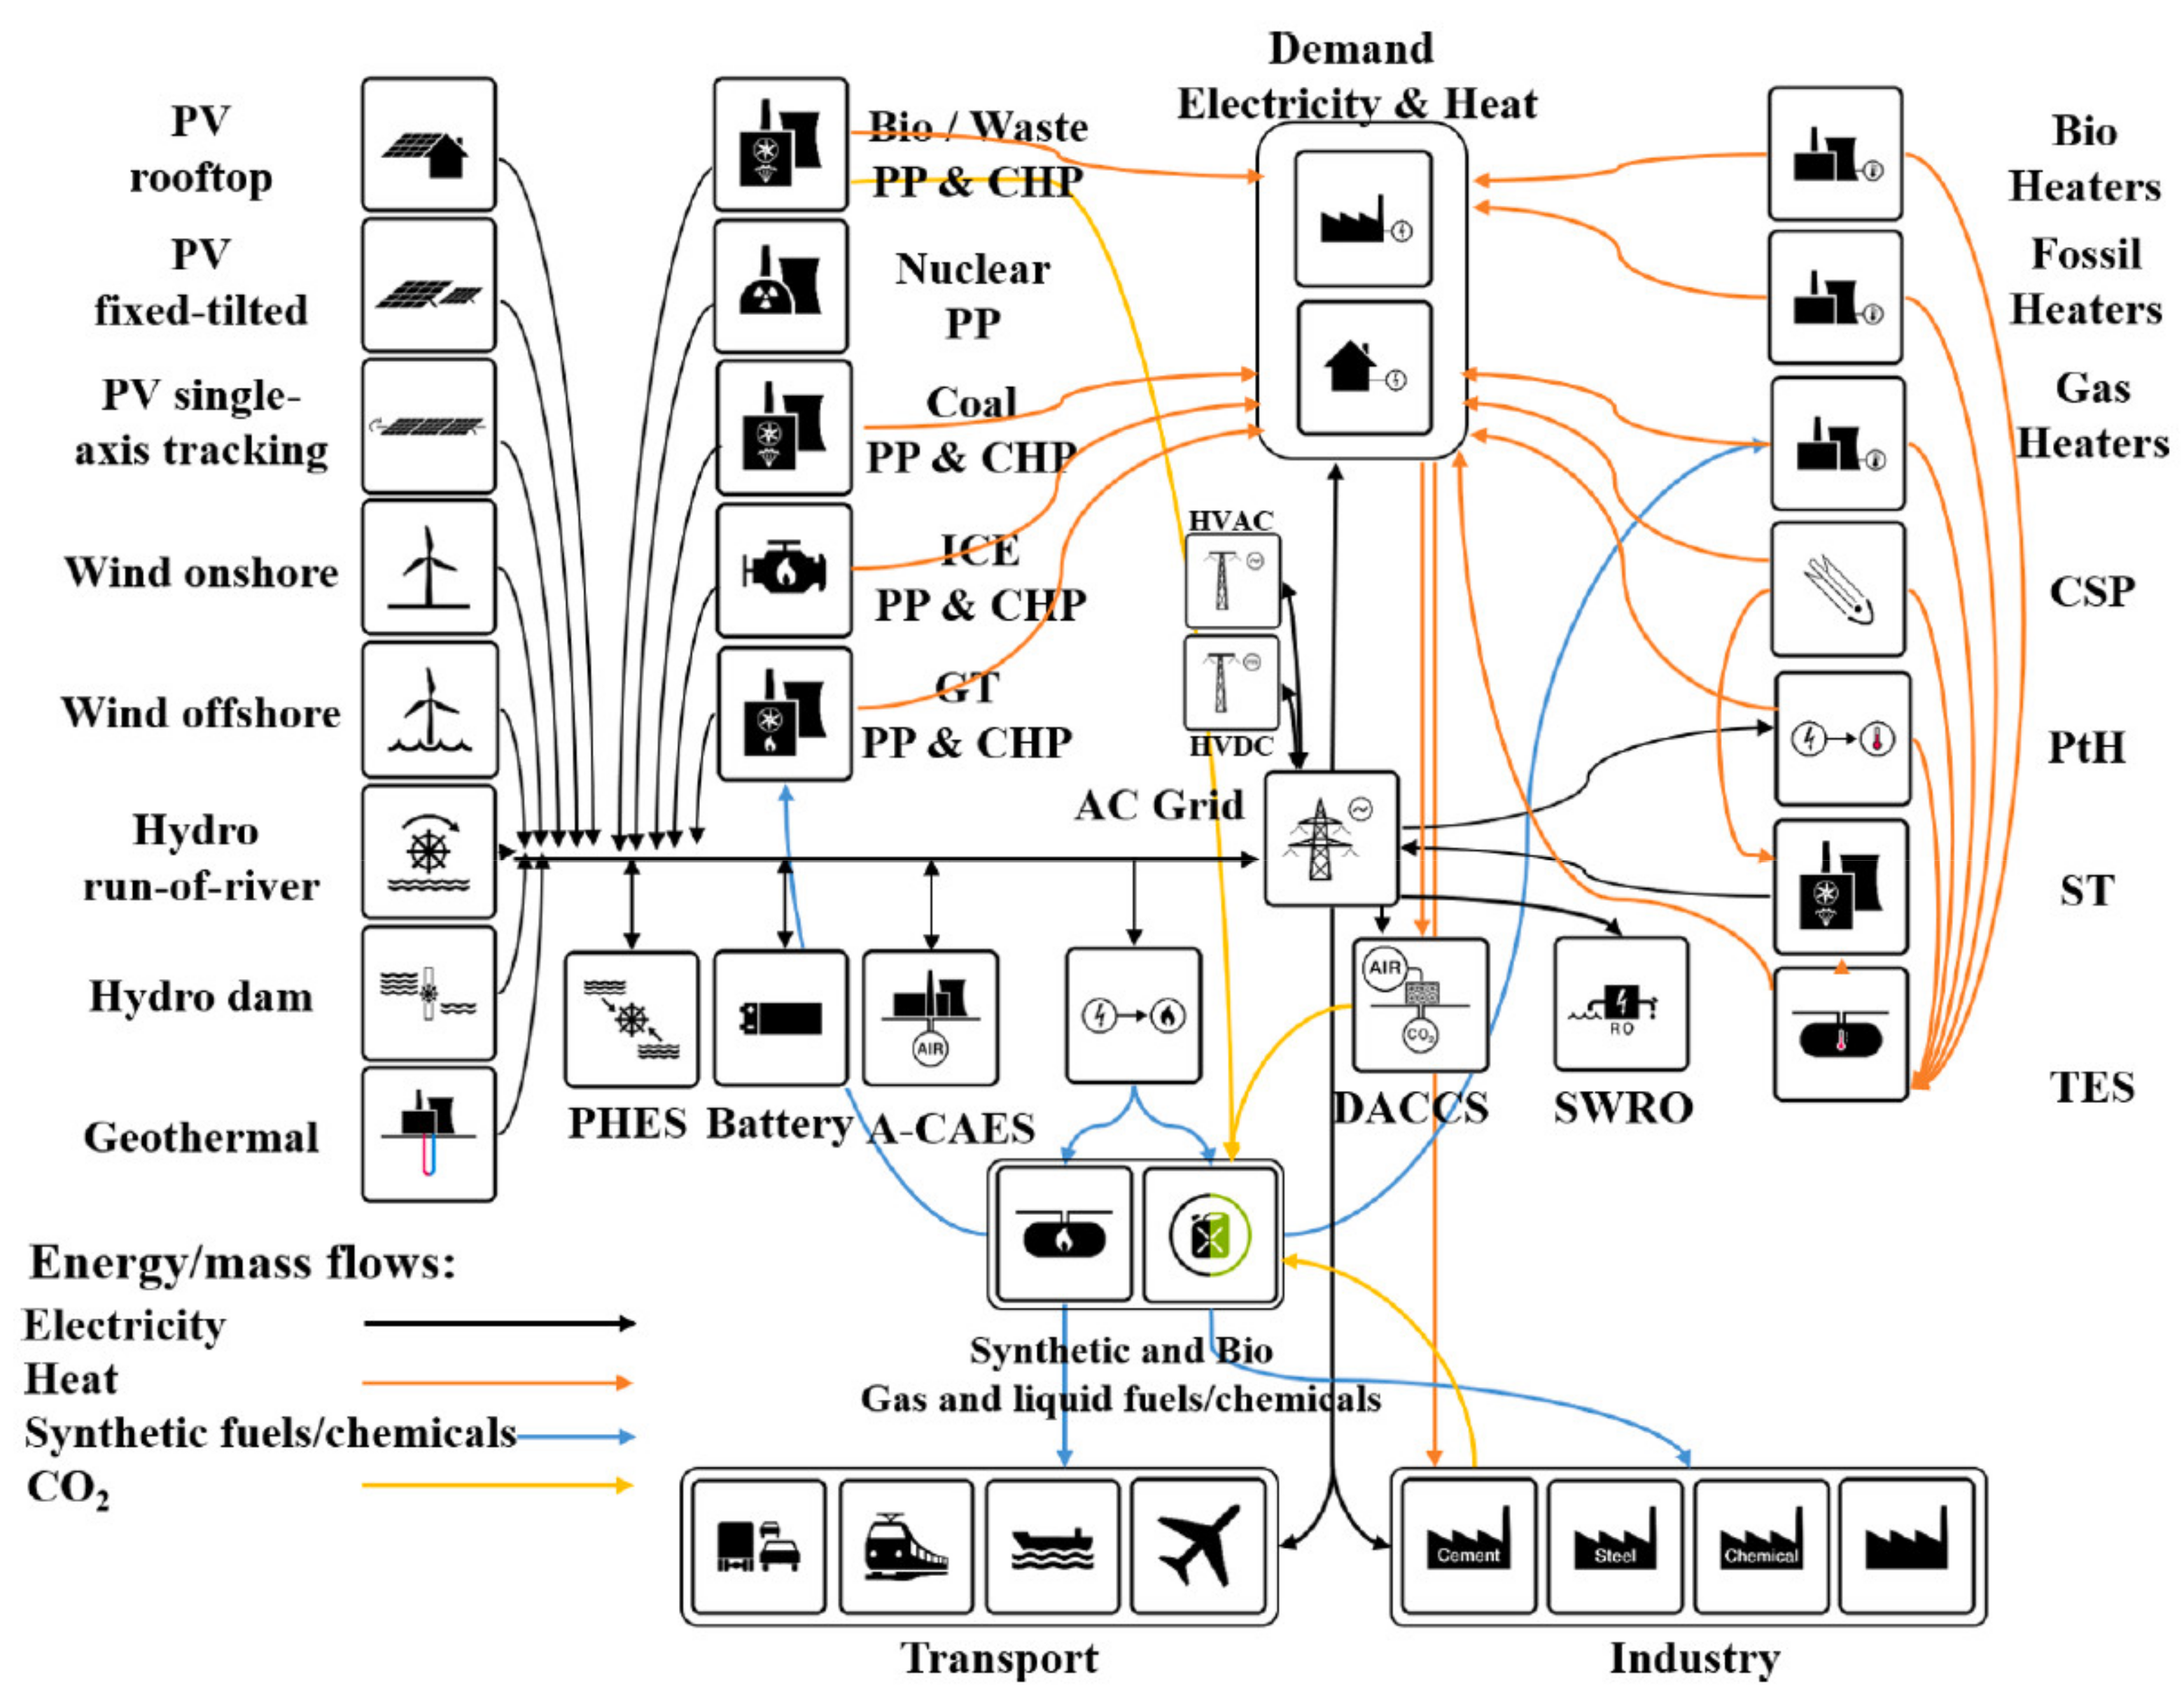
2 emissions. For instance, supposing that the main system, pictured in Figure 10, is a GT fed by natural gas, the total CO2 emissions by this system will comprise the direct CO2 emissions from burning natural gas plus CO2 emissions resulted from all processes that need to be performed to manufacturing a GT, from raw materials extraction to its disposal. Once all CO2 burden is charged on the main system’s products, the waste heat that will feed the recovery CHP/CCHP system will be free of CO2 burdens [140]. However, the products from the recovery system are not free of CO2 burdens since the recovery system’s components were manufactured in a scenario far from being 100% RES, as reported by WEO 2019 [2], which claimed that the share of RES on the world electricity generation was about 25%.
Still bearing the current energy scenario in mind and assuming that the main system in Figure 10 is now a system fed by RES (such as a solar PV power plant or a wind turbine), it is easy to infer that the products from those systems still bear CO2 carbon footprint since they were (most likely) manufactured and transported by fossil fuels fed means. For instance, in the investigation developed by Wild-Scholten [141], they studied the carbon footprint of different types of commercial PV systems. The carbon footprint for such systems ranged from 15.8 to 38.1 g CO2-eq/kWh with the consideration that, when the manufacturing process was assumed to be in China, these values increased by a factor of around two. Stylos and Koroneos [142] also performed a study about the carbon footprint of photovoltaic systems. Their investigation approached the problem through four different scenarios based on the characteristics of the manufacturing process. The result was a carbon footprint ranging from 12.28 to 58.81 g CO2/kWh. In a review performed by Kaldellis and Apostolou [143], they made a comparison between the carbon footprint of onshore and offshore wind energy. The lower value encountered in the literature was for onshore (~4.5 g CO2/kWh), while the higher value was for bottom-fixed offshore (32 g CO2/kWh). Xie et al. [144] analyzed three types of wind turbines operating in the region of Taiwan and found an average carbon footprint of 3.9 g CO2/kWh for its entire life cycle. Thus, in the current energy scenario, the carbon footprint of CHP/CCHP systems feed by recovered waste heat is expected to be in line with that of system fed by RES, i.e., about from 4 to 40 g CO2-eq/kWh, depending on the location and the manufacturing technology adopted for component production.
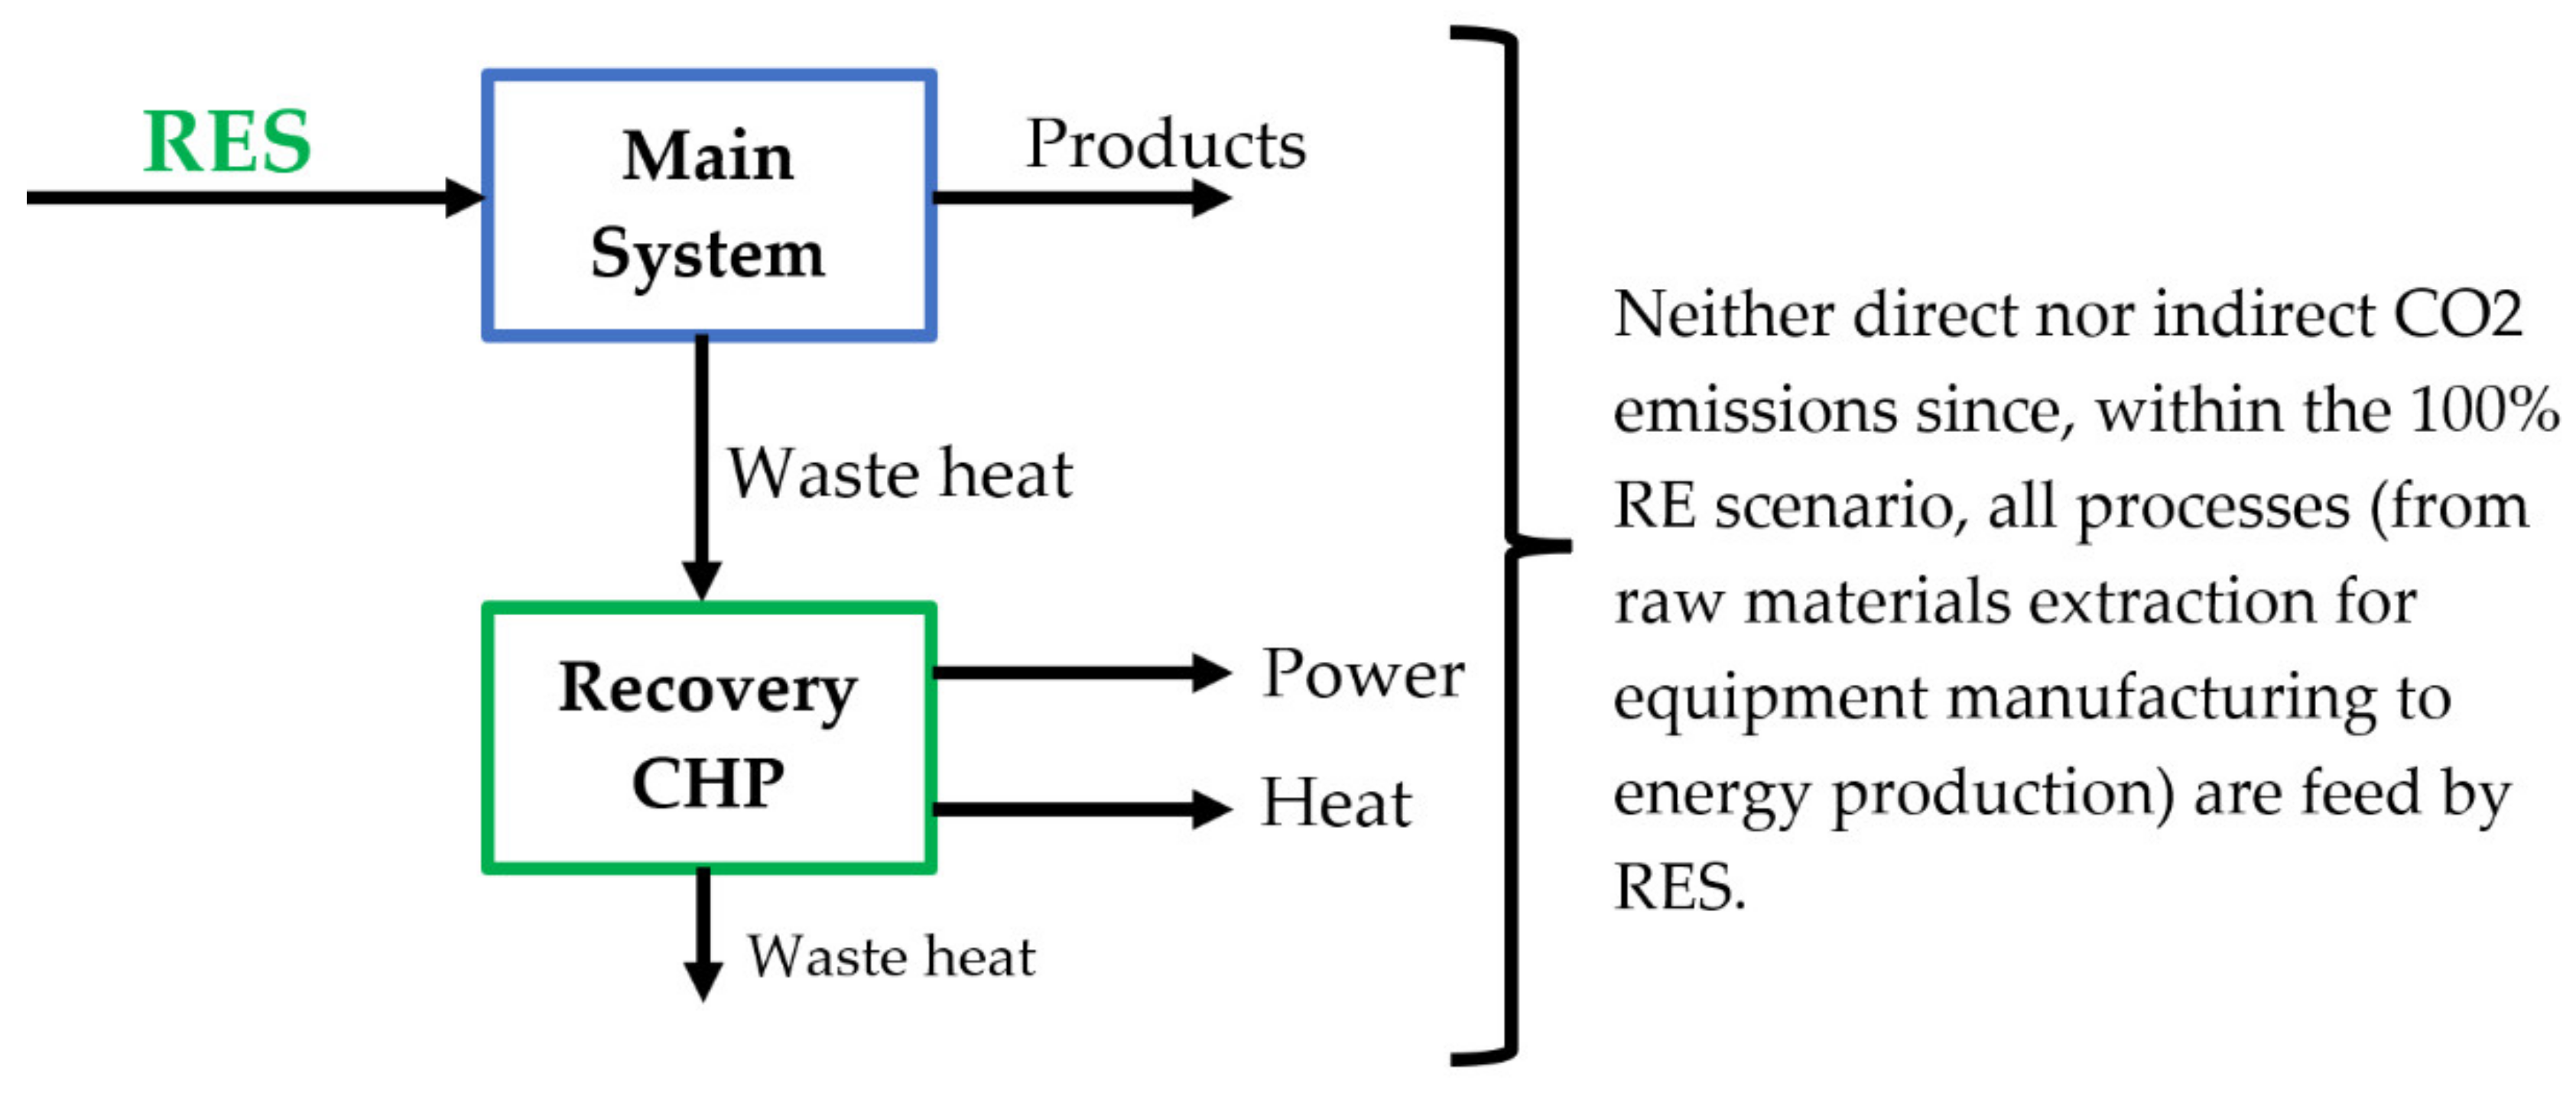
On the other hand, now considering the future scenario of 100% RES, it means that all energy consumption (direct and indirect) comes from renewable sources. For that reason, the carbon footprint of all products (Figure 11) would be zero. In that case, the comparison should be made on the basis of the amount of RES required for certain energy production.

5. Conclusions

In this paper, the options for the role of small and medium CHP technologies in a future scenario dominated by RE resources are identified and discussed. Although the 100% RE scenario envisages massive electrification, with the use of heat pumps to cope with thermal demand, CHP and CCHP systems may still play an important role within such a scenario. In fact, five potential waste heat sources within the LUT model were identified as capable of feeding the CCHP systems reviewed in Section 2. Those potential waste heat are based mainly on gas turbines, steam turbines, internal combustion engines, and geothermal energy. Moreover, according to the literature, from a general point of view, these waste heat sources are capable of offering temperature levels from 80 °C to 185 °C, which can be used directly to power low temperature CHP and CCHP systems.
The small–medium CHP heat recovery technologies selected for this work were ORC, ARS, AHP, and APC cycles. Their feeding temperature levels and the corresponding product output levels were reviewed in the literature to be further crossed with potential waste heat sources data. Those potential selected waste heat sources, extracted specifically from the LUT model (the 100% RE scenario analyzed by the Lappeenranta University of Technology [25]), were geothermal (brine reinjection temperature), gas turbine (HRSG exhaust temperature), steam turbine (turbine output temperature), and internal combustion engines (final exhaust temperature and jacket water output temperature).
The results showed that ORC systems and AHP presented similar results. For both technologies, the suitable waste heat sources were HRSG exhaust temperature, steam turbine output temperature, and ICE final exhaust temperature with the potential average delivering outputs of 114 kW (ORC) and 11 kW (AHP). The temperature ranges of jacket water output and brine reinjection did not overlap the range of feeding temperatures for ORC and AHP, which indicated the mismatch. Through the assumptions presented in Table 14, the potential annual savings for ORC and AHP units were, respectively, EUR 29,070.00 and EUR 2227.00.
Regarding ARS and APC systems, their results presented similarities when it comes to suitable sources, although their output levels are quite different. The reviewed range of feeding temperature of ARS was from 80 °C to 162 °C, while for APC systems from 93 °C to 300 °C. For both technologies, the only waste heat source that was not suitable was the geothermal brine reinjection temperature. The potential average cooling output for ARS was 20.6 kW and for APC system 901 kW (power) and 309 kW (cooling). Moreover, using the assumptions of Table 14, the potential annual savings for ARS was EUR 4264.00, and for APC was EUR 63,963.00 (cooling) and EUR 229,755.00 (power). More specifically, from the parameters considered in the economic evaluation of this study, it was concluded that the expected annual savings provided by the CCHP technologies are EUR 255.00 and EUR 207.00 per installed kW related to power and heat production, respectively.
The perspective about the carbon footprint within the 100% RE scenario and the proposed CHP/CCHP integration was also discussed. It was based on a comparison of CO2 emissions between the current primary energy sources scenario and the future 100% RE scenario. The discussion showed that, unless the energy systems achieve indeed a scenario where it is completely fed by RES, there will always be a carbon footprint related to energy production.
Therefore, the study highlights the potential heat sources and the match with the small and medium size, low temperature CCHP technologies that will be still of interest, even in a future scenario dominated by RE resources and massive electrification, showing that reductions in the LCOE and LCOH can be achieved through a wider integration of the thermal products. Full exploitation of the potential benefit of CHP could be reached only by means of an optimization procedure of CHP units, jointly with the DH local grids [145,146], in the considered economic and energy-demand scenarios.

Author Contributions

Conceptualization, M.C., D.M. and M.R.; Methodology, R.D.S., M.C., D.M. and M.R.; investigation, R.D.S. and M.C.; resources, D.M. and M.R.; data curation, R.D.S. and M.C.; writing—original draft preparation, R.D.S.; writing—review and editing, M.C., D.M. and M.R.; visualization, R.D.S. and M.C.; supervision, D.M. and M.R.; funding acquisition, D.M. and M.R.; All authors have read and agreed to the published version of the manuscript.

Funding

This research received no external funding.

Informed Consent Statement

Not applicable.

Conflicts of Interest

The authors declare no conflict of interest.

Abbreviations

AHPAbsorption Heat Pumps
APCAbsorption Power and Cooling
ARSAbsorption Refrigeration Systems
BMBiomass
BRTBrine reinjection temperature
CCGTClosed Cycle Gas Turbine
CCHPCombined Cooling Heat and Power
CHPCombined Heat and Power
CSPConcentrated Solar Power
DHDistrict Heating
DSLDiesel
GTHGeothermal
GHGGreenhouse Gas
GTGas Turbines
GT-OTGas turbine output temperature
HRHeat Recovery
HRSGHeat Recovery Steam Generator
HRSG-ETHeat Recovery Steam Generator-Exhaust gases Temperature
ICEInternal Combustion Engine
ICE-FETInternal Combustion Engine–Final Exhaust temperature
ICE-ETExhaust gases temperature
JW-OTJacket water output temperature
LUTLappeenranta University of Technology
LCOELevelized Cost of Electricity
LCOHLevelized Cost of Heat
NCEINational Centers for Environmental Information
NGNatural Gas
OCGTOpen Cycle Gas Turbine
ORCOrganic Rankine Cycle
OTOutput Temperature
PVSolar photovoltaic
PVTPhotovoltaic–Thermal
PVBSolar photovoltaic battery
RERenewable energy
RESRenewable Energy Sources
SOFCSolid Oxide Fuel Cell
STSteam Turbine
ST-OTSteam Turbine–Output Temperature
SWHSolar Water Heaters
WHRWaste Heat Recovery
WOTWater output temperature

References

  1. NOAA National Centers for Environmental Information. State of the Climate: Global Climate Report for January 2021. Available online: https://www.ncdc.noaa.gov/sotc/global/202101/supplemental/page-1 (accessed on 2 April 2021).
  2. IEA—International Energy Agency. World Energy Outlook 2019. Available online: https://www.iea.org/reports/world-energy-outlook-2019 (accessed on 2 April 2021).
  3. Waters, C.N.; Zalasiewicz, J.; Summerhayes, C.; Barnosky, A.D.; Poirier, C.; Gałuszka, A.; Cearreta, A.; Edgeworth, M.; Ellis, E.C.; Ellis, M.; et al. The Anthropocene is functionally and stratigraphically distinct from the Holocene. Science 2016, 351, aad2622. [Google Scholar] [CrossRef] [PubMed]
  4. Obama, B. The irreversible momentum of clean energy. Science 2017, 355, 126–129. [Google Scholar] [CrossRef] [Green Version]
  5. UNFCCC—United Nations Framework Convention on Climate Change. The Paris Agreement. 2015. Available online: https://unfccc.int/sites/default/files/english_paris_agreement.pdf (accessed on 3 April 2021).
  6. Rogelj, J.; Luderer, G.; Pietzcker, R.C.; Kriegler, E.; Schaeffer, M.; Krey, V.; Riahi, K. Energy system transformations for limiting end-of-century warming to below 1.5 °C. Nat. Clim. Chang. 2015, 5, 519–527. [Google Scholar] [CrossRef]
  7. NOAA National Centers for Environmental Information. State of the Climate: Global Climate Report for January 2021. Available online: https://www.ncdc.noaa.gov/sotc/global/202101 (accessed on 3 April 2021).
  8. Schellnhuber, H.J.; Rahmstorf, S.; Winkelmann, R. Why the right climate target was agreed in Paris. Nat. Clim. Chang. 2016, 6, 649–653. [Google Scholar] [CrossRef]
  9. Hughes, T.P.; Anderson, K.D.; Connolly, S.R.; Heron, S.F.; Kerry, J.T.; Lough, J.M.; Baird, A.H.; Baum, J.K.; Berumen, M.L.; Bridge, T.C.; et al. Spatial and temporal patterns of mass bleaching of corals in the Anthropocene. Science 2018, 359, 80–83. [Google Scholar] [CrossRef] [PubMed] [Green Version]
  10. IPCC. In Climate Change 2014: Synthesis Report. Contribution of Working Groups I, II and III to the Fifth Assessment Report of the Intergovernmental Panel on Climate Change; Cambridge University Press: Geneva, Switzerland, 2014. [CrossRef]
  11. Steffen, W.; Rockström, J.; Richardson, K.; Lenton, T.M.; Folke, C.; Liverman, D.; Summerhayes, C.P.; Barnosky, A.D.; Cornell, S.E.; Crucifix, M.; et al. Trajectories of the Earth System in the Anthropocene. Proc. Natl. Acad. Sci. USA 2018, 115, 8252–8259. [Google Scholar] [CrossRef] [PubMed] [Green Version]
  12. Masson-Delmotte, V.; Zhai, P.; Pörtner, H.-O.; Roberts, D.; Skea, J.; Shukla, P.R.; Pirani, A.; Moufouma-Okia, W.; Péan, C.; Pidcock, R.; et al. IPCC, 2018: Global Warming of 1.5 °C. An IPCC Special Report on the Impacts of Global Warming of 1.5 °C above pre-Industrial Levels and Related Global Greenhouse Gas Emission Pathways, in the Context of Strengthening the Global Response to the Threat of Climate Change, Sustainable Development, and Efforts to Eradicate Poverty. Available online: https://www.ipcc.ch/site/assets/uploads/sites/2/2018/07/SR15_SPM_version_stand_alone_LR.pdf (accessed on 10 April 2021).
  13. Hansen, K.; Breyer, C.; Lund, H. Status and perspectives on 100% renewable energy systems. Energy 2019, 175, 471–480. [Google Scholar] [CrossRef]
  14. Jacobson, M.Z.; Delucchi, M.A.; Bauer, Z.A.; Goodman, S.C.; Chapman, W.E.; Cameron, M.A.; Bozonnat, C.; Chobadi, L.; Clonts, H.A.; Enevoldsen, P.; et al. 100% clean and renewable wind, water, and sunlight all sector energy roadmaps for 139 countries of the world. Joule 2017, 1, 108–121. [Google Scholar] [CrossRef] [Green Version]
  15. Pursiheimo, E.; Holttinen, H.; Koljonen, T. Inter-sectoral effects of high renewable energy share in global energy system. Renew. Energy 2018, 136, 1119–1129. [Google Scholar] [CrossRef]
  16. Breyer, C.; Bogdanov, D.; Aghahosseini, A.; Gulagi, A.; Child, M.; Oyewo, A.S.; Farfan, J.; Sadovskaia, K.; Vainikka, P. Solar photovoltaics demand for the global energy transition in the power sector. Prog. Photovolt. 2017, 26, 505–523. [Google Scholar] [CrossRef]
  17. Heard, B.P.; Brook, B.W.; Wigley, T.M.L.; Bradshaw, C.J.A. Burden of proof: A comprehensive review of the feasibility of 100% renewable-electricity systems. Renew. Sustain. Energy Rev. 2017, 76, 1122–1133. [Google Scholar] [CrossRef]
  18. Brown, T.; Bischof-Niemz, T.; Blok, K.; Breyer, C.; Lund, H.; Mathiesen, B.V. Response to ‘Burden of proof: A comprehensive review of the feasibility of 100% renewable-electricity systems’. Renew. Sustain. Energy Rev. 2018, 92, 834–847. [Google Scholar] [CrossRef]
  19. Bogdanov, D.; Ram, D.; Aghahosseini, A.; Gulagi, A.; Oyewo, A.S.; Child, M.; Caldera, U.; Sadovskaia, K.; Farfan, J.; Barbosa, L.D.S.N.S.; et al. Low-cost renewable electricity as the key driver of the global energy transition towards sustainability. Energy 2021, 227, 120467. [Google Scholar] [CrossRef]
  20. Assembayeva, M.; Zhakiyev, N.; Akhmetbekov, Y. Impact of storage technologies on renewable energy integration in Kazakhstan. Materialstoday 2017, 4, 4512–4523. [Google Scholar] [CrossRef]
  21. Creutzig, F.; Agoston, P.; Goldschimidt, J.C.; Luderer, G.; Nemet, G.; Pietzcker, R.C. The underestimated potential of solar energy to mitigate climate change. Nat. Energy 2017, 2, 17140. [Google Scholar] [CrossRef]
  22. Haegel, N.M.; Margolis, R.; Buonassisi, T.; Feldman, D.; Froitzheim, A.; Garabedian, R.; Green, M.; Glunz, S.; Henning, H.M.; Holder, B.; et al. Terawatt-scale photovoltaics: Trajectories and challenges. Science 2017, 356, 141–143. [Google Scholar] [CrossRef]
  23. European Renewable Energy Council. Re-Thinking 2050. Available online: https://ec.europa.eu/clima/sites/clima/files/docs/0005/registered/91650013720-46_european_renewable_energy_council_en.pdf (accessed on 10 April 2021).
  24. Bogdanov, D.; Farfan, J.; Sadovskaia, K.; Aghahosseini, A.; Child, M.; Gulagi, A.; Oyewo, A.S.; Barbosa, L.D.S.N.S.; Breyer, C. Radical transformation pathway towards sustainable electricity via evolutionary steps. Nat. Commun. 2019, 10, 1077. [Google Scholar] [CrossRef] [Green Version]
  25. Bogdanov, D.; Gulagi, A.; Fasihi, M.; Breyer, C. Full energy sector transition towards 100% renewable energy supply: Integrating power, heat, transport and industry sectors including desalination. Appl. Energy 2021, 283, 116273. [Google Scholar] [CrossRef]
  26. Martinez, S.; Michaud, G.; Salagnac, P.; Bouvier, J.L. Micro-combined heat and power systems (micro-CHP) based on renewable energy sources. Energy Convers. Manag. 2017, 154, 262–285. [Google Scholar] [CrossRef]
  27. Ding, Z.; Hou, H.; Duan, L.; Huang, C.; Hu, E.; Yu, G.; Zhang, Y.; Zhang, N. Simulation study on a novel solar aided combined heat and power system for heat-power decoupling. Energy 2021, 220, 119689. [Google Scholar] [CrossRef]
  28. Furubayashi, T.; Nakata, T. Analysis of woody biomass utilization for heat, electricity, and CHP in a regional city of Japan. J. Clean. Prod. 2021, 290, 125665. [Google Scholar] [CrossRef]
  29. Ji, L.; Liang, X.; Xie, Y.; Huang, G.; Wang, B. Optimal design and sensitivity analysis of the stand-alone hybrid energy system with PV and biomass-CHP for remote villages. Energy 2021, 225, 120323. [Google Scholar] [CrossRef]
  30. Zhang, J.; Gu, D.; Chen, J.; He, Y.; Dai, Y.; Loh, K.-C.; Tong, Y.W. Assessment and optimization of a decentralized food-waste-to-energy system with anaerobic digestion and CHP for energy utilization. Energy Convers. Manag. 2021, 228, 113654. [Google Scholar] [CrossRef]
  31. Kim, B.R.; Kim, M.S.; An, S.K.; Park, C.W. Design of welded chevron plate heat exchanger: Application of recuperator in LiBr-water absorption systems. J. Mech. Sci. Technol. 2020, 34, 4763–4771. [Google Scholar] [CrossRef]
  32. Kong, L.B.; Li, T.; Hng, H.H.; Boey, F.; Zhang, T.; Li, S. Waste Energy Harvesting, Mechanical and Thermal Energies, 1st ed.; Springer: Berlin/Heidelberg, Germany, 2014. [Google Scholar] [CrossRef] [Green Version]
  33. US Department of Energy. Quadrennial Technology Review 2015; Chapter 6: Innovating Clean Energy Technologies in Advanced Manufacturing. Available online: https://www.energy.gov/sites/prod/files/2016/02/f30/QTR2015-6M-Waste-Heat-Recovery.pdf (accessed on 10 April 2021).
  34. Rong, A.; Lahdelma, R. Role of polygeneration in sustainable energy system development challenges and opportunities from optimization viewpoints. Renew. Sustain. Energy Rev. 2016, 53, 363–372. [Google Scholar] [CrossRef] [Green Version]
  35. Nemati, A.; Nami, H.; Ranjbar, F.; Yari, M. A comparative thermodynamic analysis of ORC and Kalina cycles for waste heat recovery: A case study for CGAM cogeneration system. Case Stud. Therm. Eng. 2017, 9, 1–13. [Google Scholar] [CrossRef] [Green Version]
  36. Jouhara, H.; Khordehgah, N.; Almahmoud, S.; Delpech, B.; Chauhan, A.; Tassou, S.A. Waste heat recovery technologies and applications. Therm. Sci. Eng. Prog. 2018, 6, 268–289. [Google Scholar] [CrossRef]
  37. Macchi, E. Theoretical basis of the Organic Rankine Cycle. In Organic Rankine Cycle (ORC) Power Systems, 1st ed.; Macchi, E., Astolfi, M., Eds.; Woodhead Publishing: Milan, Italy, 2017; pp. 3–24. ISBN 978-0-08-100510-1. [Google Scholar]
  38. Bracco, R.; Micheli, D.; Petrella, R.; Reini, M.; Taccani, R.; Toniato, G. Micro-Organic Rankine Cycle systems for domestic cogeneration. In Organic Rankine Cycle (ORC) Power Systems, 1st ed.; Macchi, E., Astolfi, M., Eds.; Woodhead Publishing: Milan, Italy, 2017; pp. 637–668. ISBN 978-0-08-100510-1. [Google Scholar]
  39. Souza, R.J.; Dos Santos, C.A.C.; Ochoa, A.A.V.; Marques, A.S.; Neto, J.L.M.; Michima, J.L.M. Proposal and 3E (energy, exergy, and exergoeconomic) assessment of a cogeneration system using an organic Rankine cycle and an Absorption Refrigeration System in the Northeast Brazil: Thermodynamic investigation of a facility case study. Energy Convers. Manag. 2020, 217, 113002. [Google Scholar] [CrossRef]
  40. Nami, H.; Anvari-moghaddam, A. Small-scale CCHP systems for waste heat recovery from cement plants: Thermodynamic, sustainability and economic implications. Energy 2020, 192, 116634. [Google Scholar] [CrossRef]
  41. Haghghi, M.A.; Mohammadi, Z.; Pesteei, S.M.; Chitsaz, A.; Parham, K. Exergoeconomic evaluation of a system driven by parabolic trough solar collectors for combined cooling, heating, and power generation; a case study. Energy 2019, 192, 116594. [Google Scholar] [CrossRef]
  42. Li, J.; Ge, Z.; Duan, Y.; Yang, Z. Effects of heat source temperature and mixture composition on the combined superiority of dual-pressure evaporation organic Rankine cycle and zeotropic mixtures. Energy 2019, 174, 436–449. [Google Scholar] [CrossRef]
  43. Fu, B.-R.; Lee, Y.-R.; Hsieh, J.-C. Design, construction, and preliminary results of a 250-kW organic Rankine cycle system. Appl. Therm. Eng. 2015, 80, 339–346. [Google Scholar] [CrossRef]
  44. Rad, E.A.; Mohammadi, S.; Tayyeban, E. Simultaneous optimization of working fluid and boiler pressure in an organic Rankine cycle for different heat source temperatures. Energy 2020, 194, 116856. [Google Scholar] [CrossRef]
  45. Herold, K.E.; Radermacher, R.; Klein, S.A. Absorption Chillers and Heat Pumps, 2nd ed.; CRC Press: Boca Raton, FL, USA, 2016; p. 352. [Google Scholar]
  46. Ayou, D.S.; Bruno, J.C.; Saravanan, R.; Coronas, A. An overview of combined absorption power and cooling cycles. Renew. Sustain. Energy Rev. 2013, 21, 728–748. [Google Scholar] [CrossRef]
  47. Patel, B.; Desai, N.B.; Kachhwaha, S.S. Optimization of waste heat based organic Rankine cycle powered cascaded vapor compression-absorption refrigeration system. Energy Convers. Manag. 2017, 154, 576–590. [Google Scholar] [CrossRef]
  48. Khan, M.M.A.; Ibrahim, N.I.; Saidur, R.; Mahbubul, I.M.; Al-Sulaiman, F.A. Performance assessment of a solar powered ammonia–water absorption refrigeration system with storage units. Energy Convers. Manag. 2016, 126, 316–328. [Google Scholar] [CrossRef]
  49. Kini, G.; Chandrasekaran, S.; Tambasco, M.; Garimella, S. A residential absorption chiller for high ambient temperatures. Int. J. Refrig. 2020, 120, 31–38. [Google Scholar] [CrossRef]
  50. Boman, D.B.; Garimella, S. Absorption heat pump cycles for simultaneous space conditioning and graywater purification. Appl. Therm. Eng. 2020, 167, 114587. [Google Scholar] [CrossRef]
  51. Chatzitakis, P.; Safarov, J.; Opferkuch, F.; Dawoud, B. Experimental investigation of an absorption heat pump with organic working pairs. Appl. Therm. Eng. 2019, 163, 114311. [Google Scholar] [CrossRef]
  52. Boman, D.B.; Hoysall, D.C.; Staedter, M.A.; Goyal, A.; Ponkala, M.J.; Garimella, S. A method for comparison of absorption heat pump working pairs. Int. J. Refrig. 2017, 77, 149–175. [Google Scholar] [CrossRef] [Green Version]
  53. Jawahar, C.P.; Saravanan, R.; Bruno, J.C.; Coronas, A. Simulation studies on gax based Kalina cycle for both power and cooling applications. Appl. Therm. Eng. 2013, 50, 1522–1529. [Google Scholar] [CrossRef]
  54. Rashidi, J.; Ifaei, P.; Esfahani, I.J.; Ataei, A.; Yoo, C.K. Thermodynamic and economic studies of two new high efficient power-cooling cogeneration systems based on Kalina and absorption refrigeration cycles. Energy Convers. Manag. 2016, 127, 170–186. [Google Scholar] [CrossRef]
  55. Wang, J.; Dai, Y.; Gao, L. Parametric analysis and optimization for a combined power and refrigeration cycle. Appl. Energy 2008, 85, 1071–1085. [Google Scholar] [CrossRef]
  56. Child, M.; Kemfert, C.; Bogdanov, D.; Breyer, C. Flexible electricity generation, grid exchange and storage for the transition to a 100% renewable energy system in Europe. Renew. Energy 2019, 139, 80–101. [Google Scholar] [CrossRef]
  57. Farfan, J.; Breyer, C. Structural changes of global power generation capacity towards sustainability and the risk of stranded investments supported by a sustainability indicator. J. Clean. Prod. 2017, 141, 370–384. [Google Scholar] [CrossRef]
  58. Caldera, U.; Bogdanov, D.; Afanasyeva, S.; Breyer, C. Role of Seawater Desalination in the Management of an Integrated Water and 100% Renewable Energy Based Power Sector in Saudi Arabia. Water 2018, 10, 3. [Google Scholar] [CrossRef] [Green Version]
  59. Child, M.; Breyer, C.; Bogdanov, D.; Fell, H.-J. The role of storage technologies for the transition to a 100% renewable energy system in Ukraine. Energy Procedia 2017, 135, 410–423. [Google Scholar] [CrossRef]
  60. Kilickaplan, A.; Bogdanov, D.; Peker, O.; Caldera, U.; Aghahosseini, A.; Breyer, C. An energy transition pathway for Turkey to achieve 100% renewable energy powered electricity, desalination and non-energetic industrial gas demand sectors by 2050. Sol. Energy 2017, 158, 218–235. [Google Scholar] [CrossRef]
  61. Ram, M.; Aghahosseini, A.; Breyer, C. Job creation during the global energy transition towards 100% renewable power system by 2050. Technol. Forecast. Soc. Chang. 2020, 151, 119682. [Google Scholar] [CrossRef]
  62. Child, M.; Breyer, C. Vision and initial feasibility analysis of a recarbonised Finnish energy system for 2050. Renew. Sustain. Energy Rev. 2016, 66, 517–536. [Google Scholar] [CrossRef]
  63. Bogdanov, D.; Breyer, C. North-East Asian Super Grid for 100% renewable energy supply: Optimal mix of energy technologies for electricity, gas and heat supply options. Energy Convers. Manag. 2016, 112, 176–190. [Google Scholar] [CrossRef]
  64. Fasihi, M.; Efimova, O.; Breyer, C. Techno-economic assessment of CO2 direct air capture plants. J. Clean. Prod. 2019, 224, 957–980. [Google Scholar] [CrossRef]
  65. IEA. Energy Technology Perspectives 2020; IEA: Paris, France, 2020; Available online: https://www.iea.org/reports/energy-technology-perspectives-2020 (accessed on 2 April 2021).
  66. Davis, S.J.; Lewis, N.S.; Shaner, M.; Aggarwal, S.; Arent, D.; Azevedo, I.L.; Benson, S.M.; Bradley, T.; Brouwer, J.; Chiang, Y.M.; et al. Net-zero emissions energy systems. Science 2018, 360, 9763. [Google Scholar] [CrossRef] [Green Version]
  67. Breyer, C.; Gerlach, A. Global overview on grid-parity. Prog. Photovolt. 2013, 21, 121–136. [Google Scholar] [CrossRef]
  68. Haegel, N.M.; Atwater, H., Jr.; Barnes, T.; Breyer, C.; Burrell, A.; Chiang, Y.M.; De Wolf, S.; Dimmler, B.; Feldman, D.; Glunz, S.; et al. Terawatt-scale photovoltaics: Transform global energy. Science 2019, 364, 836–838. [Google Scholar] [CrossRef] [PubMed] [Green Version]
  69. Ram, M.; Child, M.; Aghahosseini, A.; Bogdanov, D.; Lohrmann, A.; Breyer, C. A comparative analysis of electricity generation costs from renewable, fossil fuel and nuclear sources in G20 countries for the period 2015–2030. J. Clean. Prod. 2018, 199, 687–704. [Google Scholar] [CrossRef]
  70. US Department of Energy. Simulation-Based Design and Optimization of Waste Heat Recovery Systems. Available online: https://www.energy.gov/sites/prod/files/2020/05/f74/2067-NREL-LBNL_URBANopt_compliant.pdf (accessed on 20 August 2021).
  71. US Department of Energy. Thermal Energy Storage Overview. Available online: https://www.energy.gov/sites/default/files/2021/03/f83/Thermal_Energy_Storage_Fact_Sheet.pdf (accessed on 20 August 2021).
  72. Jossen, A.; Garche, J.; Sauer, D.U. Operation conditions of batteries in PV applications. Sol. Energy 2004, 76, 759–769. [Google Scholar] [CrossRef]
  73. Aissou, S.; Rekioua, D.; Mezzai, N.; Rekioua, T.; Bacha, S. Modeling and control of hybrid photovoltaic wind power system with battery storage. Energy Convers. Manag. 2015, 89, 615–625. [Google Scholar] [CrossRef]
  74. Vega-Garita, V.; Ramirez-Elizondo, L.; Bauer, P. Physical integration of a photovoltaic-battery system: A thermal analysis. Appl. Energy 2017, 208, 446–455. [Google Scholar] [CrossRef]
  75. Hasan, M.M.; Pourmousavi, S.A.; Bai, F.; Saha, T.K. The Impact of Temperature on Battery Degradation for Large-Scale BESS in PV Plant. In Proceedings of the 2017 IEEE Australasian Universities Power Engineering Conference (AUPEC), Melbourne, VIC, Australia, 19–22 November 2017; Available online: https://ieeexplore.ieee.org/stamp/stamp.jsp?arnumber=8282448 (accessed on 2 May 2021).
  76. Kim, M.; Bae, S. Decentralized control of a scalable photovoltaic (PV)-battery hybrid power system. Appl. Energy 2017, 188, 444–455. [Google Scholar] [CrossRef]
  77. Satapathy, P.; Dhar, S.; Dash, P.K. Performance validation of battery management system under prediction error for photovoltaic based distribution system. IET Digit. Libr. 2018, 12, 702–717. [Google Scholar] [CrossRef]
  78. Vega-Garita, V.; Hanif, A.; Narayan, N.; Ramirez-Elizondo, L.; Bauer, P. Selecting a suitable battery technology for the photovoltaic battery integrated module. J. Power Sources 2019, 438, 227011. [Google Scholar] [CrossRef]
  79. López-Vargas, A.; Fuentes, M.; García, M.V.; Muñoz-Rodríguez, F.J. Low-Cost Datalogger Intended for Remote Monitoring of Solar Photovoltaic Standalone Systems Based on Arduino™. IEEE Sens. J. 2019, 19, 4308–4320. [Google Scholar] [CrossRef]
  80. Bonkile, M.P.; Ramadesigan, V. Physics-based models in PV-battery hybrid power systems: Thermal management and degradation analysis. J. Energy Storage 2020, 31, 101458. [Google Scholar] [CrossRef]
  81. Zhu, S.; He, C.; Zhao, N.; Sha, J. Data-driven analysis on thermal effects and temperature changes of lithium-ion battery. J. Power Sources 2021, 482, 228983. [Google Scholar] [CrossRef]
  82. Casisi, M.; Reini, M. The Gouy-Stodola Theorem and the derivation of exergy revised. Energy 2020, 210, 118486. [Google Scholar] [CrossRef]
  83. Casisi, M.; Reini, M. Exergy Analysis with Variable Ambient Conditions. In Proceedings of the Ecos 2016—The 29th International Conference on Efficiency, Cost, Optimization, Simulation and Environmental Impact of Energy Systems, Portorož, Slovenia, 19–23 June 2016; Available online: https://vbn.aau.dk/ws/portalfiles/portal/242397766/ECOS2016_Proceedings_Contents.pdf (accessed on 15 May 2021).
  84. Deng, J.; Tian, Z.; Fan, J.; Yang, M.; Furbo, S.; Wang, Z. Simulation and optimization study on a solar space heating system combined with a low temperature ASHP for single family rural residential houses in Beijing. Energy Build. 2016, 126, 2–13. [Google Scholar] [CrossRef] [Green Version]
  85. Fudholi, A.; Sopian, K.; Yazdi, M.H.; Ruslan, M.H.; Ibrahim, A.; Kazem, H.A. Performance analysis of photovoltaic thermal (PVT) water collectors. Energy Convers. Manag. 2014, 78, 641–651. [Google Scholar] [CrossRef]
  86. Kumar, A.; Baredar, P.; Qureshi, U. Historical and recent development of photovoltaic thermal (PVT) technologies. Renew. Sustain. Energy Rev. 2015, 42, 1428–1436. [Google Scholar] [CrossRef]
  87. Liang, R.; Zhang, J.; Ma, L.; Li, Y. Performance evaluation of new type hybrid photovoltaic/thermal solar collector by experimental study. Appl. Therm. Eng. 2015, 75, 487–492. [Google Scholar] [CrossRef]
  88. Yazdanpanahi, J.; Sarhaddi, F.; Adeli, M.M. Experimental investigation of exergy efficiency of a solar photovoltaic thermal (PVT) water collector based on exergy losses. Sol. Energy 2015, 118, 197–208. [Google Scholar] [CrossRef]
  89. Fudholi, A.; Zohri, M.; Rukman, N.S.B.; Nazri, N.S.; Mustapha, M.; Yen, C.H.; Mohammad, M.; Sopian, K. Exergy and sustainability index of photovoltaic thermal (PVT) air collector: A theoretical and experimental study. Renew. Sustain. Energy Rev. 2019, 100, 44–51. [Google Scholar] [CrossRef]
  90. Kazemian, A.; Salari, A.; Hakkaki-Fard, A.; Ma, T. Numerical investigation and parametric analysis of a photovoltaic thermal system integrated with phase change material. Appl. Energy 2019, 238, 734–746. [Google Scholar] [CrossRef]
  91. AL-Musawi, A.I.A.; Taheri, A.; Farzanehnia, A.; Sardarabadi, M.; Passandideh-Fard, M. Numerical study of the effects of nanofluids and phase-change materials in photovoltaic thermal (PVT) systems. J. Therm. Anal. Calorim. 2019, 137, 623–636. [Google Scholar] [CrossRef]
  92. Islam, M.M.; Hasanuzzaman, M.; Rahim, N.A.; Pandey, A.K.; Rawa, M.; Kumar, L. Real time experimental performance investigation of a NePCM based photovoltaic thermal system: An energetic and exergetic approach. Renew. Energy 2021, 172, 71–87. [Google Scholar] [CrossRef]
  93. Kazemian, A.; Parcheforosh, A.; Salari, A.; Ma, T. Optimization of a novel photovoltaic thermal module in series with a solar collector using Taguchi based grey relational analysis. Sol. Energy 2021, 215, 492–507. [Google Scholar] [CrossRef]
  94. Alsalame, H.A.M.; Lee, J.H.; Lee, G.H. Performance Evaluation of a Photovoltaic Thermal (PVT) System Using Nanofluids. Energies 2021, 14, 301. [Google Scholar] [CrossRef]
  95. Liu, Y.M.; Chung, K.M.; Chang, K.C.; Lee, T.S. Performance of Thermosyphon Solar Water Heaters in Series. Energies 2012, 5, 3266–3278. [Google Scholar] [CrossRef] [Green Version]
  96. Fazilati, M.A.; Alemrajabi, A.A. Phase change material for enhancing solar water heater, an experimental approach. Energy Convers. Manag. 2013, 71, 138–145. [Google Scholar] [CrossRef]
  97. Sathyamurthy, R.; Harris Samuel, D.G.; Nagarajan, P.K.; Jaiganesh, V. Experimental investigation of a semi circular trough solar water heater. Sol. Plants Appl. 2015, 51, 94–98. [Google Scholar] [CrossRef]
  98. Sheng Xue, H. Experimental investigation of a domestic solar water heater with solar collector coupled phase-change energy storage. Renew. Energy 2016, 86, 257–261. [Google Scholar] [CrossRef]
  99. Assari, M.R.; Tabrizi, H.B.; Savadkohy, M. Numerical and experimental study of inlet-outlet locations effect in horizontal storage tank of solar water heater. Sustain. Energy Technol. Assess. 2018, 25, 181–190. [Google Scholar] [CrossRef]
  100. Mandal, S.K.; Kumar, S.; Singh, P.K.; Mishra, S.K.; Singh, D.K. Performance investigation of nanocomposite based solar water heater. Energy 2020, 198, 117295. [Google Scholar] [CrossRef]
  101. Mandal, S.; Ghosh, S.K. Experimental investigation of the performance of a double pass solar water heater with reflector. Renew. Energy 2020, 149, 631–640. [Google Scholar] [CrossRef]
  102. Britvin, O.V.; Povarov, O.A.; Klochkov, E.F.; Tomarov, G.V.; Luzin, V.E. Mutnovsky Geothermal power complex in Kamchatka. In Proceedings of the World Geothermal Congress 2000, Kyushu-Tohoku, Japan, 28 May–10 June 2000; Available online: https://www.geothermal-energy.org/pdf/IGAstandard/WGC/2000/R0234.PDF (accessed on 6 May 2021).
  103. Kanoglu, M.; Bolatturk, A. Performance and parametric investigation of a binary geothermal power plant by exergy. Renew. Energy 2008, 33, 2366–2374. [Google Scholar] [CrossRef]
  104. Keçebaş, A.; Kayfeci, M.; Gedik, E. Performance investigation of the Afyon geothermal district heating system for building applications: Exergy analysis. Appl. Therm. Eng. 2011, 31, 1229–1237. [Google Scholar] [CrossRef]
  105. Gabbrielli, R. A novel design approach for small scale low enthalpy binary geothermal power plants. Energy Convers. Manag. 2012, 64, 263–272. [Google Scholar] [CrossRef]
  106. Srinivas, S.; Eisenberg, D.; Seifkar, N.; Leoni, P.; Paci, M.; Field, R.P. Simulation-Based Study of a Novel Integration: Geothermal–Biomass Power Plant. Energy Fuels 2014, 28, 7632–7642. [Google Scholar] [CrossRef]
  107. Clarke, J.; McLeskey, J.T., Jr. Multi-objective particle swarm optimization of binary geothermal power plants. Appl. Energy 2015, 138, 302–314. [Google Scholar] [CrossRef]
  108. Sinaga, R.H.M.; Manik, Y. Optimizing the Utility Power of a Geothermal Power Plant using Variable Frequency Drive (VFD) (Case Study: Sibayak Geothermal Power Plant). In Proceeding of the IOP Conference Series: Earth and Environmental Science, South Lampung, Indonesia, 25–26 August 2017. [Google Scholar] [CrossRef]
  109. Prananto, L.A.; Zaini, I.N.; Mahendranata, B.I.; Juangsa, F.B.; Aziz, M.; Soelaiman, T.A.F. Use of the Kalina cycle as a bottoming cycle in a geothermal power plant: Case study of the Wayang Windu geothermal power plant. Appl. Therm. Eng. 2018, 132, 686–696. [Google Scholar] [CrossRef]
  110. Song, Z.; Wang, N.; You, S.; Wang, Y.; Zhang, H.; Wei, S.; Zheng, X.; Guo, J. Integration of geothermal water into secondary network by absorption-heat-pump-assisted district heating substations. Energy Build. 2019, 202, 109403. [Google Scholar] [CrossRef]
  111. Garapati, N.; Adams, B.M.; Fleming, M.R.; Kuehn, T.H.; Saar, M.O. Combining brine or CO2 geothermal preheating with low-temperature waste heat: A higher-efficiency hybrid geothermal power system. J. CO2 Util. 2020, 42, 101323. [Google Scholar] [CrossRef]
  112. Martins, J.; Brito, F.P. Alternative Fuels for Internal Combustion Engines. Energies 2020, 13, 4086. [Google Scholar] [CrossRef]
  113. Anozie, A.N.; Odejobi, O.J. The search for optimum condenser cooling water flow rate in a thermal power plant. Appl. Therm. Eng. 2011, 31, 4083–4090. [Google Scholar] [CrossRef]
  114. Kaviri, A.G.; Jaafar, M.N.M.; Lazim, T.M.; Barzegaravval, H. Exergoenvironmental optimization of Heat Recovery Steam Generators in combined cycle power plant through energy and exergy analysis. Energy Convers. Manag. 2013, 67, 27–33. [Google Scholar] [CrossRef]
  115. Choi, J.H.; Ahn, J.H.; Kim, T.S. Performance of a triple power generation cycle combining gas/steam turbine combined cycle and solid oxide fuel cell and the influence of carbon capture. Appl. Therm. Eng. 2014, 71, 301–309. [Google Scholar] [CrossRef]
  116. Aguilar, F.J.E.; Quintero, R.R.; Trujillo, E.C.; García, M.T. Analysis of regulation methods of a combined heat and power plant based on gas turbines. Energy 2014, 72, 574–589. [Google Scholar] [CrossRef]
  117. Gebreegziabher, T.; Oyedun, A.O.; Luk, H.T.; Lam, T.Y.G.; Zhang, Y.; Hui, C.W. Design and optimization of biomass power plant. Chem. Eng. Res. Des. 2014, 92, 1412–1427. [Google Scholar] [CrossRef]
  118. Athari, H.; Soltani, S.; Bölükbaşi, A.; Rosen, M.A.; Morosuk, T. Comparative exergoeconomic analyses of the integration of biomass gasification and a gas turbine power plant with and without fogging inlet cooling. Renew. Energy 2015, 76, 394–400. [Google Scholar] [CrossRef]
  119. Ganjehkaviri, A.; Jaafar, M.N.M.; Hosseini, S.E. Optimization and the effect of steam turbine outlet quality on the output power of a combined cycle power plant. Energy Convers. Manag. 2015, 89, 231–243. [Google Scholar] [CrossRef]
  120. Ibrahim, T.K.; Basrawi, F.; Awad, O.I.; Abdullah, A.N.; Najafi, G.; Mamat, R.; Hagos, F.Y. Thermal performance of gas turbine power plant based on exergy analysis. Appl. Therm. Eng. 2017, 115, 977–985. [Google Scholar] [CrossRef]
  121. Ziółkowski, P.; Kowalczyk, T.; Lemański, M.; Badur, J. On energy, exergy, and environmental aspects of a combined gas-steam cycle for heat and power generation undergoing a process of retrofitting by steam injection. Energy Convers. Manag. 2019, 192, 374–384. [Google Scholar] [CrossRef]
  122. Omar, A.; Nashed, A.; Li, Q.; Leslie, G.; Taylor, R.A. Pathways for integrated concentrated solar power—Desalination: A critical review. Renew. Sustain. Energy Rev. 2020, 119, 109609. [Google Scholar] [CrossRef]
  123. Parvez, M.; Khan, O. Parametric simulation of biomass integrated gasification combined cycle (BIGCC) power plant using three different biomass materials. Biomass Convers. Biorefin. 2020, 10, 803–812. [Google Scholar] [CrossRef]
  124. Koç, Y.; Yağlı, H.; Görgülü, A.; Koç, A. Analysing the performance, fuel cost and emission parameters of the 50 MW simple and recuperative gas turbine cycles using natural gas and hydrogen as fuel. Int. J. Hydrog. Energy 2020, 45, 22138–22147. [Google Scholar] [CrossRef]
  125. Niu, M.; Xie, J.; Liang, S.; Liu, L.; Wang, L.; Peng, Y. Simulation of a new biomass integrated gasification combined cycle (BIGCC) power generation system using Aspen Plus: Performance analysis and energetic assessment. Int. J. Hydrog. Energy 2021, 46, 22356–22367. [Google Scholar] [CrossRef]
  126. Zhao, X.L.; Fu, L.; Zhang, S.G.; Jiang, Y.; Li, H. Performance improvement of a 70 kWe natural gas combined heat and power (CHP) system. Energy 2010, 35, 1848–1853. [Google Scholar] [CrossRef]
  127. Rabovitser, J.; Pratapas, J.M.; Kezerle, J.; Kasab, J. Gas Turbine/Reciprocating Internal Combustion Engine Integrated System for Fuel-Flexible, High Efficiency and Low Emissions Power Generation. In Proceedings of the ASME 2013 Internal Combustion Engine Division Fall Technical Conference, Dearborn, MI, USA, 13–16 October 2013. [Google Scholar] [CrossRef]
  128. Zhao, X.; Fu, L.; Li, F.; Liu, H. Design and operation of a tri-generation system for a station in China. Energy Convers. Manag. 2014, 80, 391–397. [Google Scholar] [CrossRef]
  129. Wang, S.; Bai, K.; Xie, Y.; Di, J.; Cheng, S. Analysis of Combined Power and Refrigeration Generation Using the Carbon Dioxide Thermodynamic Cycle to Recover the Waste Heat of an Internal Combustion Engine. Math. Probl. Eng. 2014, 2014, 689398. [Google Scholar] [CrossRef]
  130. Maheswari, K.S.; Murugavel, K.K.; Esakkimuthu, G. Thermal desalination using diesel engine exhaust waste heat—An experimental analysis. Desalination 2015, 358, 94–100. [Google Scholar] [CrossRef]
  131. Scaccabarozzi, R.; Tavano, M.; Invernizzi, C.M.; Martelli, E. Thermodynamic Optimization of heat recovery ORCs for heavy duty Internal Combustion Engine: Pure fluids vs. zeotropic mixtures. Energy Procedia 2017, 129, 168–175. [Google Scholar] [CrossRef]
  132. Frigo, S.; Spazzafumo, G. Cogeneration of power and substitute of natural gas using biomass and electrolytic hydrogen. Int. J. Hydrog. Energy 2018, 43, 11696–11705. [Google Scholar] [CrossRef]
  133. Mohammadkhani, F.; Yari, M. A 0D model for diesel engine simulation and employing a transcritical dual loop Organic Rankine Cycle (ORC) for waste heat recovery from its exhaust and coolant: Thermodynamic and economic analysis. Appl. Therm. Eng. 2019, 150, 329–347. [Google Scholar] [CrossRef]
  134. Kim, J.; Kim, Y.; Choi, W.; Ahn, K.Y.; Song, H.H. Analysis on the operating performance of 5-kW class solid oxide fuel cell-internal combustion engine hybrid system using spark-assisted ignition. Appl. Energy 2020, 260, 114231. [Google Scholar] [CrossRef]
  135. Choi, W.; Song, H.H. Composition-considered Woschni heat transfer correlation: Findings from the analysis of over-expected engine heat losses in a solid oxide fuel cell–internal combustion engine hybrid system. Energy 2020, 203, 117851. [Google Scholar] [CrossRef]
  136. Wolf, S. Industrial heat pumps in Germany: Potentials, technological development and market barriers. In Proceedings of the ECEEE 2012 Summer study on energy efficiency in industry, Arnhem, The Netherlands, 11–14 September 2012; Available online: https://proceedings.eceee.org/docs/2012/contents.pdf (accessed on 30 May 2021).
  137. Novotny, V.; Kolovratník, M. Absorption power cycles for low-temperature heat sources using aqueous salt solutions as working fluids. Int. J. Energy Res. 2017, 41, 952–975. [Google Scholar] [CrossRef]
  138. Zvingilaite, E.; Ommen, T.; Elmegaard, B.; Franck, M.L. Low temperature district heating consumer unit with micro heat pump for domestic hot water preparation. In Proceedings of the 13th International Symposium on District Heating and Cooling, Copenhagen, Denmark, 3–4 September 2012; Available online: https://core.ac.uk/download/pdf/13799392.pdf (accessed on 30 May 2021).
  139. Radhi, H. On the optimal selection of wall cladding system to reduce direct and indirect CO2 emissions. Energy 2010, 12, 1412–1424. [Google Scholar] [CrossRef]
  140. US Department of Energy. Absorption Chillers for CHP Systems. Available online: https://www.energy.gov/sites/default/files/2017/06/f35/CHP-Absorption%20Chiller-compliant.pdf (accessed on 20 August 2021).
  141. Wild-Scholten, M.J. Energy payback time and carbon footprint of commercial photovoltaic systems. Sol. Energy Mater. Sol. Cells 2013, 119, 296–305. [Google Scholar] [CrossRef]
  142. Stylos, N.; Koroneos, C. Carbon footprint of polycrystalline photovoltaic systems. J. Clean. Prod. 2014, 64, 639–645. [Google Scholar] [CrossRef]
  143. Kaldellis, J.K.; Apostolou, D. Life cycle energy and carbon footprint of offshore wind energy. Comparison with onshore counterpart. Renew. Energy 2017, 108, 72–84. [Google Scholar] [CrossRef]
  144. Xie, J.; Fu, J.; Liu, S.; Hwang, W. Assessments of carbon footprint and energy analysis of three wind farms. J. Clean. Prod. 2020, 254, 120159. [Google Scholar] [CrossRef]
  145. Casisi, M.; Buoro, D.; Pinamonti, P.; Reini, M. A comparison of different district integration for a distributed generation system for heating and cooling in an urban area. Appl. Sci. 2019, 9, 3521. [Google Scholar] [CrossRef] [Green Version]
  146. Casisi, M.; Costanzo, S.; Pinamonti, P.; Reini, M. Two-Level evolutionary multi-objective optimization of a district heating system with distributed cogeneration. Energies 2019, 12, 114. [Google Scholar] [CrossRef] [Green Version]
Figure 1. Schematic diagram of a single-effect water/lithium bromide absorption chiller. Adapted from [45].
Energies 14 05338 g001
Figure 2. Schematic diagram of an APC system (Goswami cycle) with water/ammonia as working fluid. Adapted from [46].
Energies 14 05338 g002
Figure 3. Integration of the energy sectors within the LUT model (Bogdanov et al., 2021 [25]). Reprint with permission; Copyright 2021, Elsevier.
Energies 14 05338 g003
Figure 4. Potential waste heat sources suitable for feeding organic Rankine cycles.
Energies 14 05338 g004
Figure 5. Potential waste heat recovery technologies suitable for feeding Absorption Heat Pump systems.
Energies 14 05338 g005
Figure 6. Potential waste heat recovery technologies suitable for feeding Absorption Power and Cooling systems.
Energies 14 05338 g006
Figure 7. Potential waste heat recovery technologies suitable for feeding Absorption Refrigeration Systems.
Energies 14 05338 g007
Figure 8. Potential annual savings that each technology can provide based on the data reviewed in this work and on the cost of electricity and heat foreseen within the LUT model.
Energies 14 05338 g008
Figure 9. Expected annual savings per unit of installed kW from heat-related CCHP technologies (AHP, ARS, and APC cooling) and power-related technologies (ORC and APC power) working approximately 16 h a day.
Energies 14 05338 g009
Figure 10. Schematic diagram of CO2 emissions for a generic cogeneration system fed by fossil fuels as its primary energy source (current energy system scenario).
Energies 14 05338 g010
Figure 11. Schematic diagram of CO2 emissions for a generic cogeneration system fed by RES as its primary energy source (future 100% RE scenario).
Energies 14 05338 g011
Table 2. Power generation technologies (adapted from [24]).
Primary EnergyTechnologies
Renewable-basedSolar PV, Wind turbines, Hydro, Geothermal, Solar thermal (CSP)
Biomass-basedBiomass (power and CHP), Municipal waste incinerator (CHP), Biogas (CHP)
Fossil-fuel-basedClosed Cycle Gas Turbine (CCGT), Open Cycle Gas Turbine (OCGT), Coal (power and CHP), Liquid hydrocarbons (power and CHP), Nuclear (power)
Table 3. Heat generation technologies (adapted from [24]).
Primary EnergyTechnologies
Renewable/power-basedSolar thermal, Electrical heating, Heat pump
Biomass-basedBiomass heat (district heat and individual heat), Biogas heat (individual heat)
Fossil-basedDistrict heat and individual heat (Gas, Coal, and Liquid Hydrocarbons)
Table 4. Fuel production, storage, power transmission, and water desalination and supply technologies (adapted from [24]).
CategoryTechnologies
Fuel productionWater electrolysis, CO2 Direct air capture, Methanation reactor, Fischer-Tropsch reactor, Biorefinery, Biogas separator, Biogas digester
StoragePV batteries, Pumped hydro, Hot heat, Hydrogen, District heat, Biogas, Adiabatic compressed air, Gas, Liquid hydrocarbons
Power transmissionHigh voltage AC and DC lines, Converters station
Water desalination and supplyReverse Osmosis Seawater Desalination, Multi-Stage Flash Stand alone, Multi-Stage Flash Cogeneration, Multi-Effect Distillation Stand alone, Multi-Effect Distillation Cogeneration, Water storage, Horizontal pumping, Vertical pumping
Table 5. Selected parameters to evaluate potential waste heat sources.
TechnologySelected ParameterSelected Parameter Acronym Notes
PVBBattery temperaturePVBT-
PVTWater output temperaturePVT-WOT-
SWHWater output temperatureSWH-WOT-
GTHBrine reinjection temperatureBRTFlash Steam and Binary Cycle only.
GTTurbine output temperatureGT-OTOr the HRSG output temperature
STTurbine output temperatureST-OTOr the condenser temperature
ICEExhaust gases temperatureICE-ETOr the coolant water temperature
Table 6. Literature review of the values for PVB selected parameter.
ReferenceBattery Temperature (°C)Notes
Jossen et al., 2004 [72]55Maximum operating temperature
Aissou et al., 2015 [73]45Maximum, but temperature affects storage capacity
Vega-Garita et al., 2017 [74]39Maximum temperature of operation: 60 °C
Hasan et al., 2017 [75]30 and 43Higher temperature increased degradation
Kim and Bae 2017 [76]26 and 30With and without power management
Satapathy et al., 2018 [77]25, 40, and 50High temperatures led to lower discharging capacity and state of health
Vega-Garita et al., 2019 [78]45Selected temperature for simulations
López-Vargas et al., 2019 [79]25Average ambient temperature around 20 °C
Bonkile and Ramadesigan 2020 [80]35For thermal management control simulation
Zhu et al., 2021 [81]38Average temperature considered in the simulations
Table 12. Summary of the values for all reviewed parameters.
Heat SourceTemperature Range (°C)Average (°C)
PVBT25 to 5540
PVT-WOT27 to 8053.5
SWH-WOT40 to 74.757.3
BRT25 to 11369
JW-OT87 to 11098.5
ICE-FET66 to 170118
ST-OT41 to 187114
HRSG-ET100 to 151138
GT-OT450 to 645547.5
ICE-ET350 to 880615
Table 13. Feeding temperature ranges and capacity ranges for the selected CHP heat recovery technologies.
TechnologyTemp. Range (°C)Output Range (kW)Output Range Average (kW)
ORC100–20015–214114
APC93–300 *80–1722 (power)901
224.6–393 (cooling)309
ARS80–16210.5–30.720.6
AHP100–1707–1511
* Desorber temperature.
Table 14. Summary of the key parameters for the estimation of annual savings that each CHP technology could provide.
ParameterValueNotes
Working hours per year6000 h/year-
Average outputTable 13-
LCOE42.5 EUR/MWh [25]Used for ORC and APC (power)
LCOH34.5 EUR/MWh [25]Used for AHP, ARS, and APC (cooling)
Publisher’s Note: MDPI stays neutral with regard to jurisdictional claims in published maps and institutional affiliations.

