Article

High-Power Closed-Loop SMPC-Based Photovoltaic System Characterization under Varying Ambient Conditions

1
Laboratory for Information and Decision Systems, Massachusetts Institute of Technology, Cambridge, MA 02139, USA
2
Department of Electrical Engineering, Indian Institute of Science, Bengaluru 560012, India
*
Author to whom correspondence should be addressed.
Energies 2021, 14(17), 5296; https://doi.org/10.3390/en14175296
Submission received: 30 June 2021 / Revised: 16 August 2021 / Accepted: 21 August 2021 / Published: 26 August 2021
(This article belongs to the Special Issue Future Integration of Photovoltaic Systems)

Abstract

:
Photovoltaic energy generation potential can be tapped with maximum efficacy by characterizing the source behaviour. Characterization refers to the systematic terminal measurement-based PV modeling which can further facilitate output prediction and fault detection. Most of the existing PV characterization methods fail for high-power PV array due to increased thermal losses in electronic components. Here, we propose a switched-mode power converter-based PV characterization setup which is designed with input filter to limit switching ripple entering into PV array under test, thereby enhancing system life and efficiency. The high resonant frequency input filter ensures its compactness with high-speed characterization capability. To further enhance the system performance, a closed-loop current control of the system is designed for high bandwidth and stable phase margins. Variation of the controller parameters under varying ambient conditions of 200–1000 W/m 2 irradiation and 25–70 °C temperature is documented and an adaptive PI controller is proposed. Experimental and simulation results validate the high performance of the closed loop operation of the PV characterization at 1.2 kW range power level in real-time field conditions. Compared to the open loop operation, the closed-loop operation eliminates the waveform ringing by 100% during characterization.

Graphical Abstract

1. Introduction

Photovoltaic characterization is extremely useful in PV research for output prediction, fault diagnosis, and system efficiency estimation. Characterization is defined as the measurement of output voltage and current of a PV panel under given irradiation and temperature conditions. PV characterization finds direct application in performance assessment of different PV technologies [1] based on which the optimization of photovoltaic devices and systems can be achieved [2]. With the onset of new technologies such as renewable energy storage and building integrated photovoltaic system design, high-power characterization-based design and performance evaluation are the need of the hour [3,4]. PV characterization is also being applied for reliability studies of PV systems to map the effect of outdoor soiling and shading [5,6]. Recent examples show the use of PV characterization for important design decisions such as the use of reconfigurable PV systems or the need for distributed maximum power point tracking under shading conditions [7,8].
Based on the terminal measurement of electrical output characteristics, the PV system model is identified using parameter extraction [9], which can further be used to predict the system output under varying ambient conditions [10], along with cell degradation-based aging studies [11] and fault diagnosis [12]. Characterization for low-power solar cells is found extensively both in literature [13,14,15,16] with several low-power single cell/module characterization devices available in industry. The focus of the above-mentioned cell-level characterization is typically in the early design and performance validation stages of the PV device development [17,18]. However, high-power PV array characterization in the range of kilo Watts is not as widely available due to challenges posed by thermal losses in electronic components [19]. It has been noted in [20] that accurate power determination of large area multi-junction modules has been a challenge in recent years.
PV panel characterization requires a light source and an electrical load. To prevent high power handling capability in characterization equipment, dark IV measurements are sometimes utilized [21] or a controlled single light source is used indoors [22,23]. However, using real-time field-evaluated IV characteristics helps in classifying the effect of internal and external factors on slow and fast changing terminal response of PV modules [24]. To handle the field challenges such as unpredictable temporal variation in solar insolation and wind-based temperature variation requires fast response of the characterization setup [25,26].
PV characterization is undertaken by subjecting the PV array to a variable load, which can take PV array’s rated current and voltage [27]. As the load varies or is varied manually, the terminal current-voltage measurements are noted simultaneously. Rheostat is the simplest variable load whose resistance can be varied manually [28]. However, this simple and cost-effective approach is limited by low sensitivity with extremely sparse data points near the open-circuit and short-circuit regions with slow speed and accuracy for fast changing ambient conditions. Large size of high power variable resistors is another major concern [29] in remote PV applications. Another passive method of PV characterization is discussed in [30,31], wherein a capacitor array is charged to vary the voltage at PV array terminals, which is noted along with terminal current, thereby obtaining the current-voltage characteristics of the PV system [32]. This method is however limited by the response time which is a function of capacitance network’s charging and discharging time constant, affecting the time lapse between subsequent current-voltage sweeps [33].
For controllable and faster response times, numerous electronic loads are proposed for PV characterization, some of the most popular ones use transistors whose gate charging is controlled to vary its output resistance [34]. The complete sweep of PV curve from open-circuit to short-circuit, however, requires the operation of transistor in all three modes, causing high energy dissipation in the active region, depending on the maximum irradiation level and PV array ratings. Another similar approach is the use of linearly operated MOSFET in series with a passive resistor which is proposed in [34]. The success of this method lies in proper sizing of MOSFET as per the maximum power dissipation in its active region.
Most of the photovoltaic energy conversion systems consist of switched mode dc-dc converters for power conditioning in various industrial applications [35,36]. Dedicated SMPC systems for PV characterization are proposed in [37]. These SMPC systems are promising to be one of the best methods of characterizing PV arrays owing to their controllable and fast response, designed ability to handle high power and optional power conditioning capability [29]. These converters are further useful in transient characterization of PV panels for dynamic modeling [38] and can therefore be instrumental in fault diagnosis. SMPC systems also work well in fast changing environmental conditions wherein special cautions such as high characterization speeds are needed when irradiation changes fast [26]. IEC standard 60904-1 specifies conditions for PV characterization, namely, within ±1% irradiation variation, within ±2% temperature variation, and at least one point within 0–3% of open circuit voltage for short-circuit interpolation [39]. To satisfy these standard specifications, the developed characterization setup should have a very good dynamic performance, which can be met by a well-designed and well-controlled switched mode power converter.
In this work, we propose a buck-boost converter based PV characterization set up which can sweep the PV array from open circuit to short circuit in a controlled manner with fast response time. To solve the problem of high switching ripple feeding to the source, an input filter with damping is designed for high frequency operation without sacrificing the system bandwidth. To further enhance the system performance, a closed loop controller is designed using an adaptive PI controller for robust operation under varying ambient conditions. Experimental results are produced for both open and closed loop operation of the converter, where closed loop controller shows smooth transition between operating conditions with the elimination of the overshoot as compared to the open loop operation.

Contributions of This Work

The main contributions of this work are as follows.
  • A switched-mode power conversion-based PV characterization setup is introduced in this work which not only reduces system losses, but also prevents high frequency noise injection in the PV source.
  • Design and development of the high frequency damped input filter providing high-speed characterization without affecting closed-loop controller performance and system stability, while ensuring compact size.
  • An adaptive closed loop controller is introduced and implemented, which ensures complete short circuit to open circuit characterization under varying ambient conditions and completely eliminates overshoot and ringing in electrical response under closed-loop operation as compared to open loop.
  • The designed system is validated using simulations and experimental results showing high-speed characterization under real-time field operation.
  • Closed-form mathematical expressions and lookup tables have been derived and documented for system operation under closed-loop operation with changing ambient conditions.
  • The system is shown to remain stable under 200–1000 W/m 2 irradiation variation and 25–70 °C temperature with a high characterization speed within tens of milliseconds.
  • This study presents a 1.2 kW range high power PV system characterization based on high performance converter with scalability owing to low loss and stable operation under varying ambient conditions. Switched mode power converter provides greater than 80% efficiency, unlike linear electronic loads.
  • The results show superior performance in terms of fast variable characterization speed and tunable sensitivity of the converter: the features which are absent in the commercially available IV tracers.
  • The developed PV characterization method is ten times more cost effective compared to commercial PV equipment with comparable speed.
  • Compared to commercial PV characterization equipment the proposed method offers at least three times higher power level with comparable accuracy.
  • It lays the foundation for PV parameter extraction, fault diagnosis, shading studies, accelerated life, and reliability testing of PV systems.
This paper is organized into five sections: Following introduction, the theory of a damped input filter design is discussed in Section 2. Section 3 discusses the design of the closed loop controller along with simulation results. Experimental results constitute Section 4, and Section 5 concludes the paper followed by Appendix A and references.

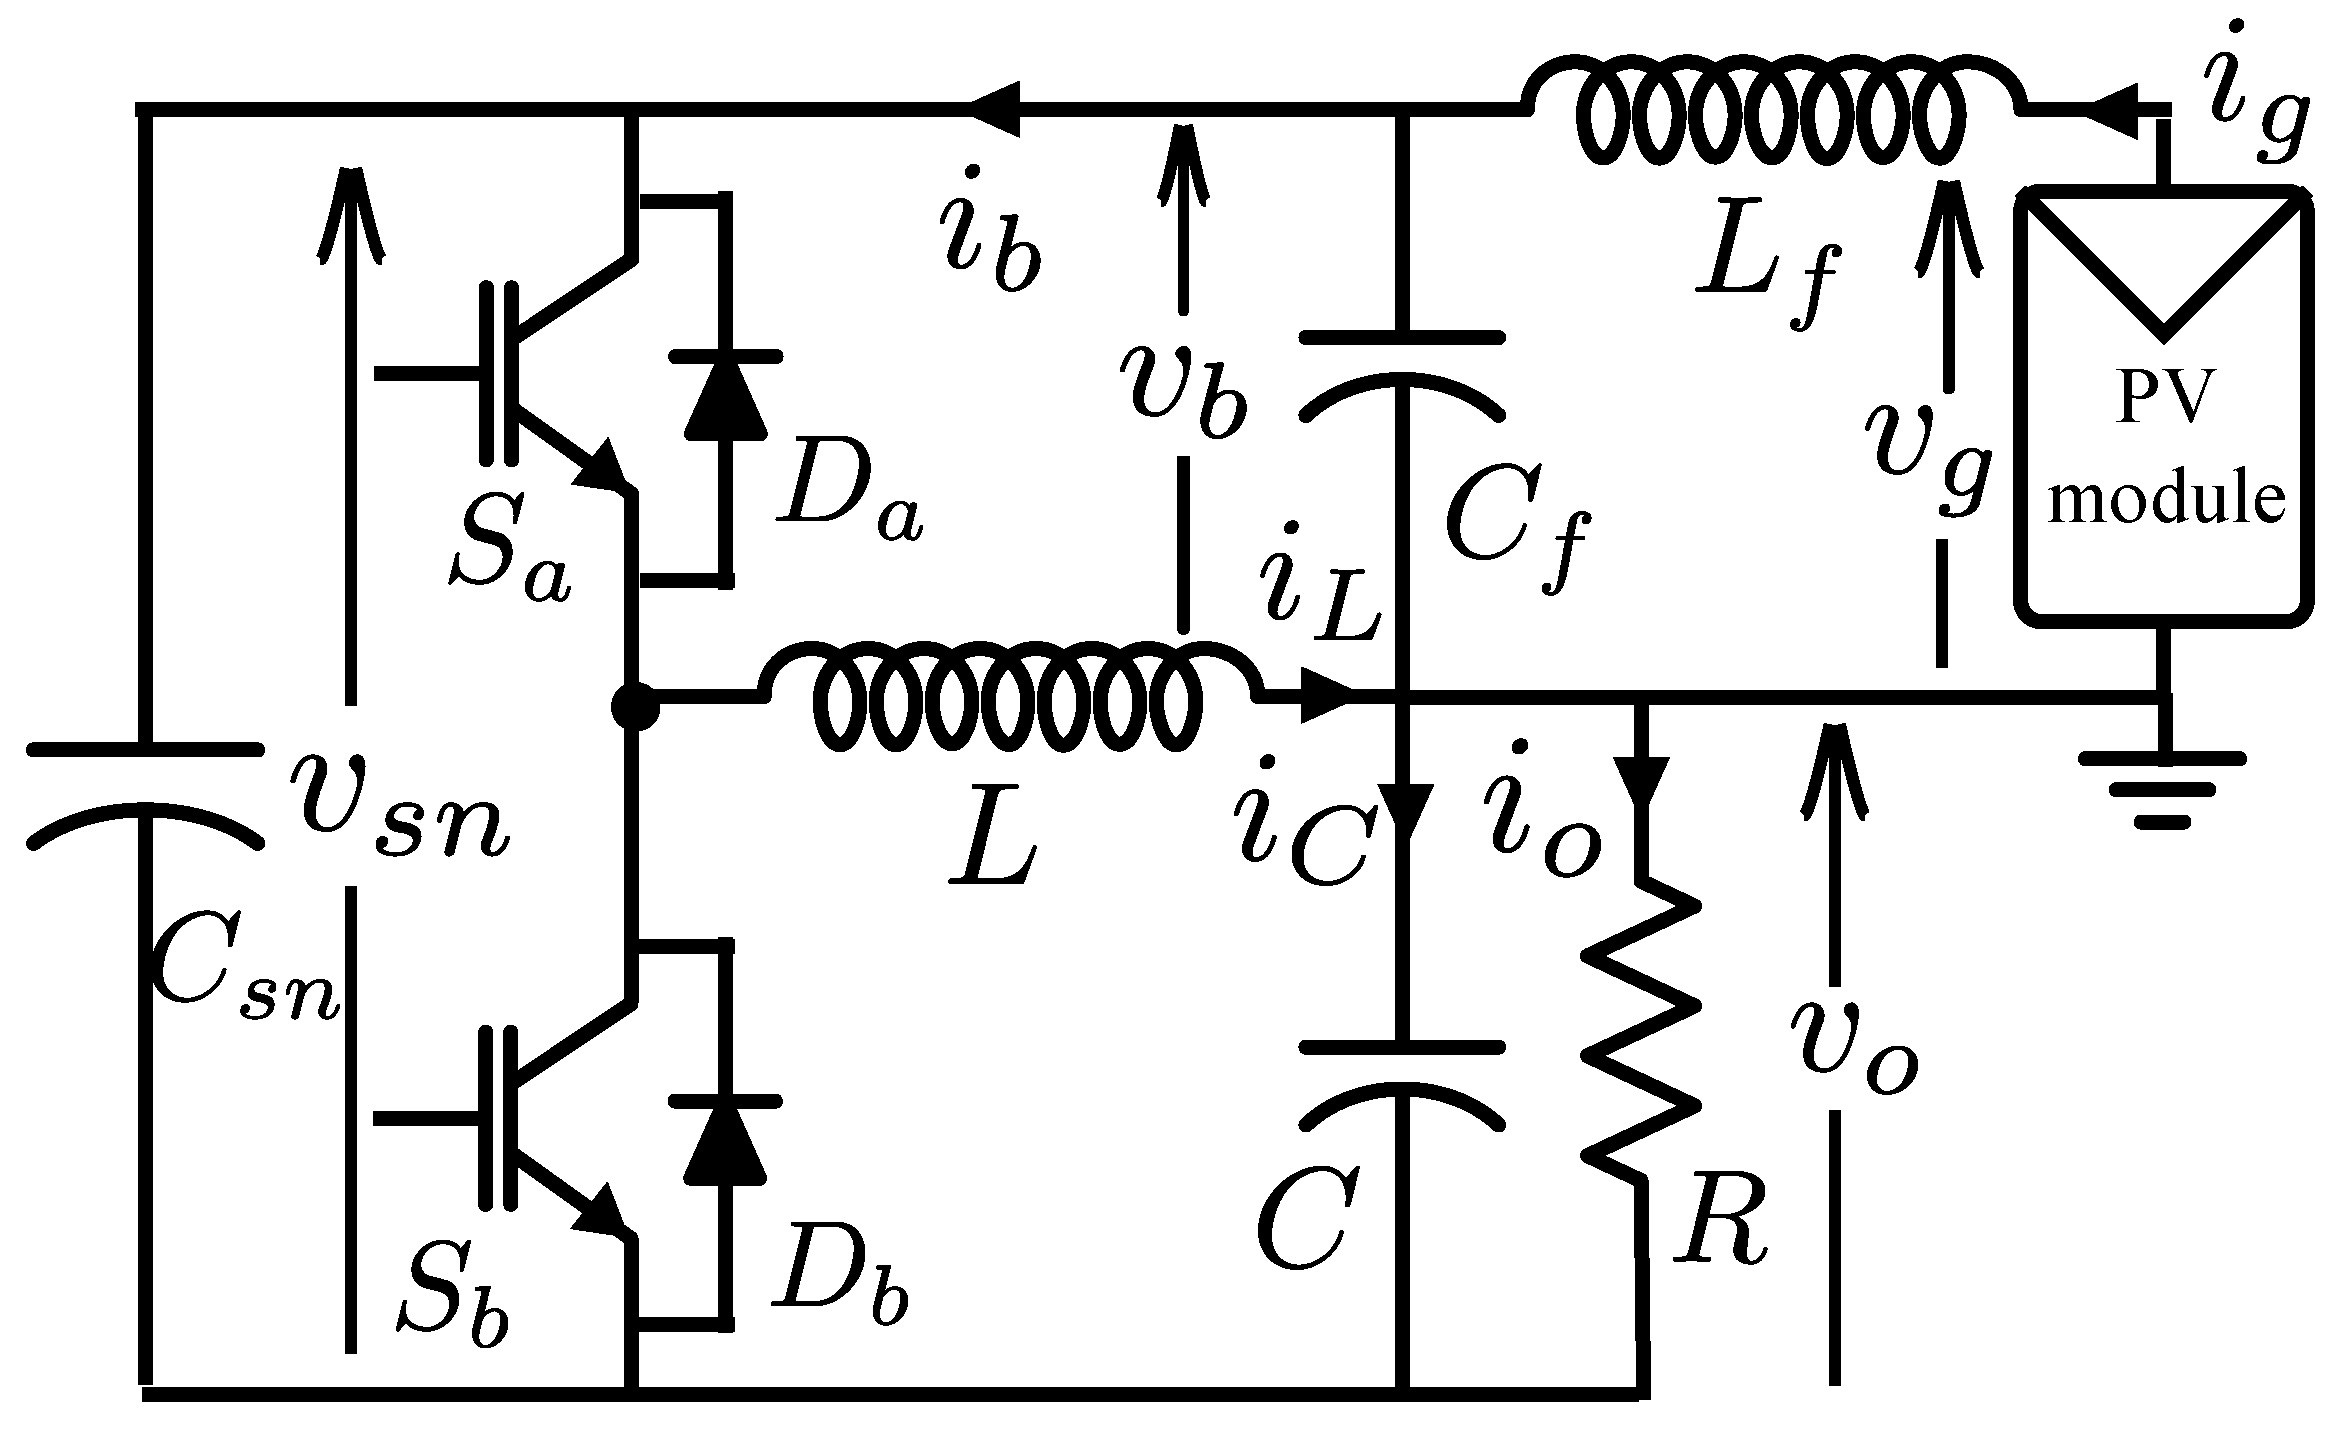
2. Design of Damped Input Filter for SMPC-Based PV Characterization System

In order to characterize a 1.2 kW PV array of series and parallel connected PV panels, a buck-boost converter is operated as an electronic load. This converter causes high input current ripple at the PV terminals, which can be prevented by the introduction of an input filter. To ensure that the introduction of an input filter does not affect the control of the system in any way, Middlebrook’s extra element theorem is used in its dual form [40]. The transfer function G ( s ) of the system with an extra element (input filter with transfer function Z o ( s ) in this case) can be written in terms of the original transfer function as
G ( s ) = ( G ( s ) | Z o ( s ) = 0 ) 1 + Z o ( s ) Z N ( s ) 1 + Z o ( s ) Z D ( s )
where the driving point impedance Z D ( s ) of the system is computed with zero variation in control input (duty ratio d):
Z D ( s ) = Z i ( s ) | d ˜ = 0
and the null point impedance Z N is computed as the input impedance of converter which makes the output null. It can be expressed as
Z N ( s ) = Z i ( s ) | o / p = n u l l
To ensure that the new transfer function is not significantly different than the original transfer function in the frequency range of interest, the following conditions need to be satisfied [40]:
| Z o ( j ω ) | < < | Z D ( j ω ) | , | Z o ( j ω ) | < < | Z N ( j ω ) |
The driving point impedance for the buck-boost converter can be derived from its small signal ac equivalent circuit as shown in Figure 1 [40].
Z D ( s ) = ( 1 D ) 2 R D 2 1 + L R ( 1 D ) 2 s + L C ( 1 D ) 2 s 2 1 + R C s
Note that the Z N in PV characterization is computed unlike the case of conventional output voltage nulling as the input current is to be controlled, for which case Z N needs to be computed differently. To make the input current null, an impedance Z N needs to be introduced such that the value of i ˜ g due to d ˜ is nullified by introduction of Z N . This is possible only when the current i ˜ b flows through Z N and does not enter PV. Equivalently, a voltage source v ˜ b is introduced across Z N to produce a counter current i ˜ b . When the transfer function v b ˜ i b ˜ , in the small signal ac equivalent circuit of the buck-boost converter, as given in Figure 1 is computed, this ratio comes out to be the driving point impedance of the converter Z D . Therefore, to control the PV input current for characterization using the buck-boost converter, Z N = Z D is obtained, making the comparison of | | Z o | | and | | Z D | | sufficient to satisfy the Middlebrook’s Extra Element Theorem.
For an LC input filter, the transfer function can be written as
Z o = s L f 1 + L f C f s 2
Introducing a damping factor of ζ = 0.36 ensures (4) conditions are satisfied in the frequency range of interest. The circuit of the damped input filter is shown in Figure 2.
With damping, the input filter transfer function modifies to (7).
i g i b = s C b R f + 1 s 3 C b C f R f L f + s 2 L f ( C b + C f ) + s C b R f + 1
Following the damped filter design procedure of [40], C b and R f are designed.

3. Closed Loop Control Design

To control the PV terminal current or voltage for characterization, there are two approaches: One is to control the system in open loop and other is the closed-loop operation. Under open-loop operation, the duty ratio command to the buck boost converter is given, which leads to a certain operating point on the current-voltage characteristic. This operating point on the PV module characteristic depends on the net resistance posed by the DC-DC converter, which in steady state is a function of output load and duty ratio. The block diagram of the open loop operation is shown in Figure 3a, wherein by periodically updating duty ratio in predefined steps, complete open-circuit to short-circuit operation of the PV module under test can be captured. This method however suffers from high waveform ringing and oscillations in the measured terminal characteristics [19]. Limitations of the open-loop operation in terms of waveform ringing can be overcome with the help of a well-designed closed-loop controller whose block diagram is given in Figure 3b.
Figure 3b depicts the reference PV source current i ˜ g * compared with the sensed source current i ˜ g , and the error e is fed to the controller to produce the control parameter duty ratio d ˜ which controls the plant operation.
Small signal transfer function from the duty cycle to the source current is the product of (7) and (8), the values of which are computed at standard test conditions (STC) of 1000 W/m 2 , 25 °C with rated open circuit V g = 45 V and short circuit current of I g = 9 A for each 300 W PV module, scaled up as per series/parallel connection. Values for this plant transfer function can be obtained using the detailed analysis presented in the Appendix A, where a look-up table is developed which connects the varying ambient conditions in terms of irradiation and temperature to varying PV module voltage values from open-circuit operation to short-circuit operation as quantified by the duty ratio variation.
i ˜ b d ˜ = 2 V g D R ( 1 D ) 3 1 + L + R 2 C ( 1 D ) 2 R ( 1 D ) s + L C 2 ( 1 D ) s 2 1 + L R ( 1 D ) 2 s + L C ( 1 D ) 2 s 2
To control this system in closed loop, a proportional integral (PI) controller is used. A PI controller ensures negligible steady state error while ensuring fast dynamic response compared to an integral control [19]. In order to evaluate the performance and stability of a closed loop system, one approach is to analyze the frequency response of its open loop transfer function (OLTF). In the present analysis, this approach is followed by creating MATLAB script files by coding the plant transfer functions using lookup tables as described in the Appendix A. Further, the bode function of the MATLAB toolbox is used to plot the frequency response of the combined controller-plant transfer function. Based on the control theory, a closed-loop system is considered stable when the gain margin (GM) and phase margin (PM) are positive for its open-loop transfer function. To apply this approach in our analysis, we use the frequency response of the OLTF which is the product of the PI controller transfer function along with plant transfer function as described above. In this analysis, the GM and PM are determined for stability and bandwidth is determined for performance or the time response of the closed loop system. Note that in open loop operation, the controller transfer function is not involved. To design the PI controller parameters, the stability and performance are both taken into account here. A K p = 1 / 24 is chosen to give nearly 40 phase margin at STC and K I = 26.2 gives a zero at 100 Hz, which ensures complete phase recovery of 90 at gain cross over. The bode plots of the open loop transfer function at varying duty ratios are plotted in Figure 4.
From the frequency response of the OLTF in Figure 4, for a given operating condition given by the duty ratio, the gain margin is obtained from the bode plot by evaluating the OLTF magnitude below zero dB when the phase crosses −180 . Further, the phase margin is determined by noting the phase and adding 180 to it when the magnitude crosses zero dB. From this analysis, it can be seen that minimum phase margin of 45 is seen across entire duty ratio variation and gain margins are infinite except for 5% duty ratio, for which a 40 dB gain margin is obtained. Therefore the designed controller will lead to a stable operation under real-time field conditions. Bandwidth is seen to be in kHz range for a majority of operating conditions except for near open circuit condition, thereby ensuring high characterization speed and lower response time under closed loop operation.
The designed controller is seen to perform well except for lower duty ratio range, where the controller bandwidth becomes low. This calls for an adaptive gain PI controller as the plant itself varies with the point of operation.

3.1. Introduction of Adaptive Gain PI Controller

As seen from Figure 4 the controller performance is not satisfactory at low duty ratios, therefore an adaptive gain PI controller is introduced here. At low duty ratios, the gain is enhanced for higher bandwidth. The resulting open loop transfer functions for the open circuit operation of the system is shown in Figure 5.
With the introduction of the adaptive gain PI controller: at low duty ratio of 0.05, a bandwidth of 237 rad/s is achieved showing a seventeen time improvement compared to the fixed gain PI controller. On further analysis it is seen that the performance near 0.25 duty ratio can also be enhanced with a gain of 4, as higher gain at this condition reduces the phase margin. Based on the theoretical analysis of the plant transfer function, for duty ratios of less than 25% a gain of 2 4 is used, and for duty ratios of more than 25% but less than 45%, a gain of 2 2 is used in this algorithm. Choosing gains as the multiples of 2 comes in handy while digital programming. The adaptive gain scheduling with specific transition values are given in the complete algorithm flowchart in Figure 6.

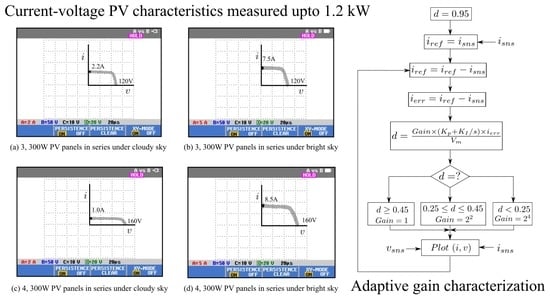
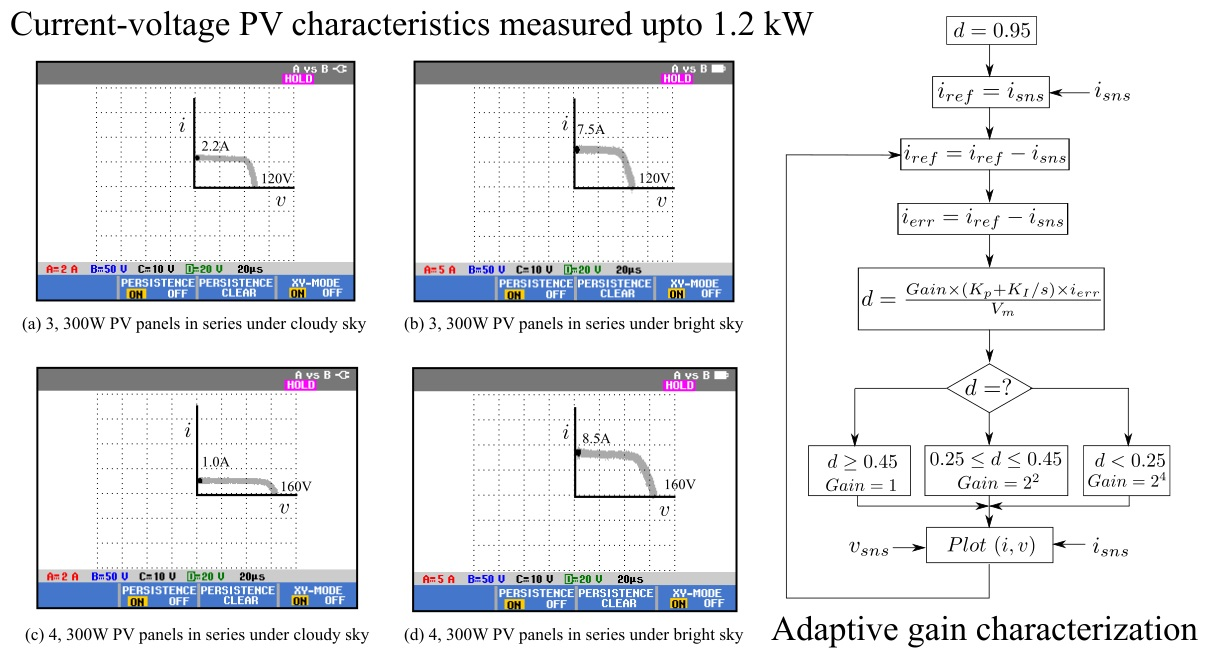
3.2. Algorithm for Complete Curve Tracing

For controlling the input current from zero to short circuit value, its upper limit needs to be evaluated. To get that value in real-time, at the start of the characterization a high duty ratio (d) command is given to the controller and the sensed input current ( i s n s ) is noted as reference ( i r e f ). For complete curve tracing, this reference value is reduced in predefined current steps ( Δ i ) to trace the compete curve. The gain of the PI controller is decided as per the duty ratio value. PI controller proportionality ( K p ) and integral gains ( K I ) remain fixed. The switch PWM duty ratio (d) is determined as the product of the controller gain and the error signal ( i e r r ), which is further scaled down by the sawtooth carrier amplitude ( V m ). This entire procedure as represented in the flowchart of Figure 6, sequentially measures the i s n s and v s n s as the real-time sensed current and voltage of the PV array terminals for complete iv characterization.

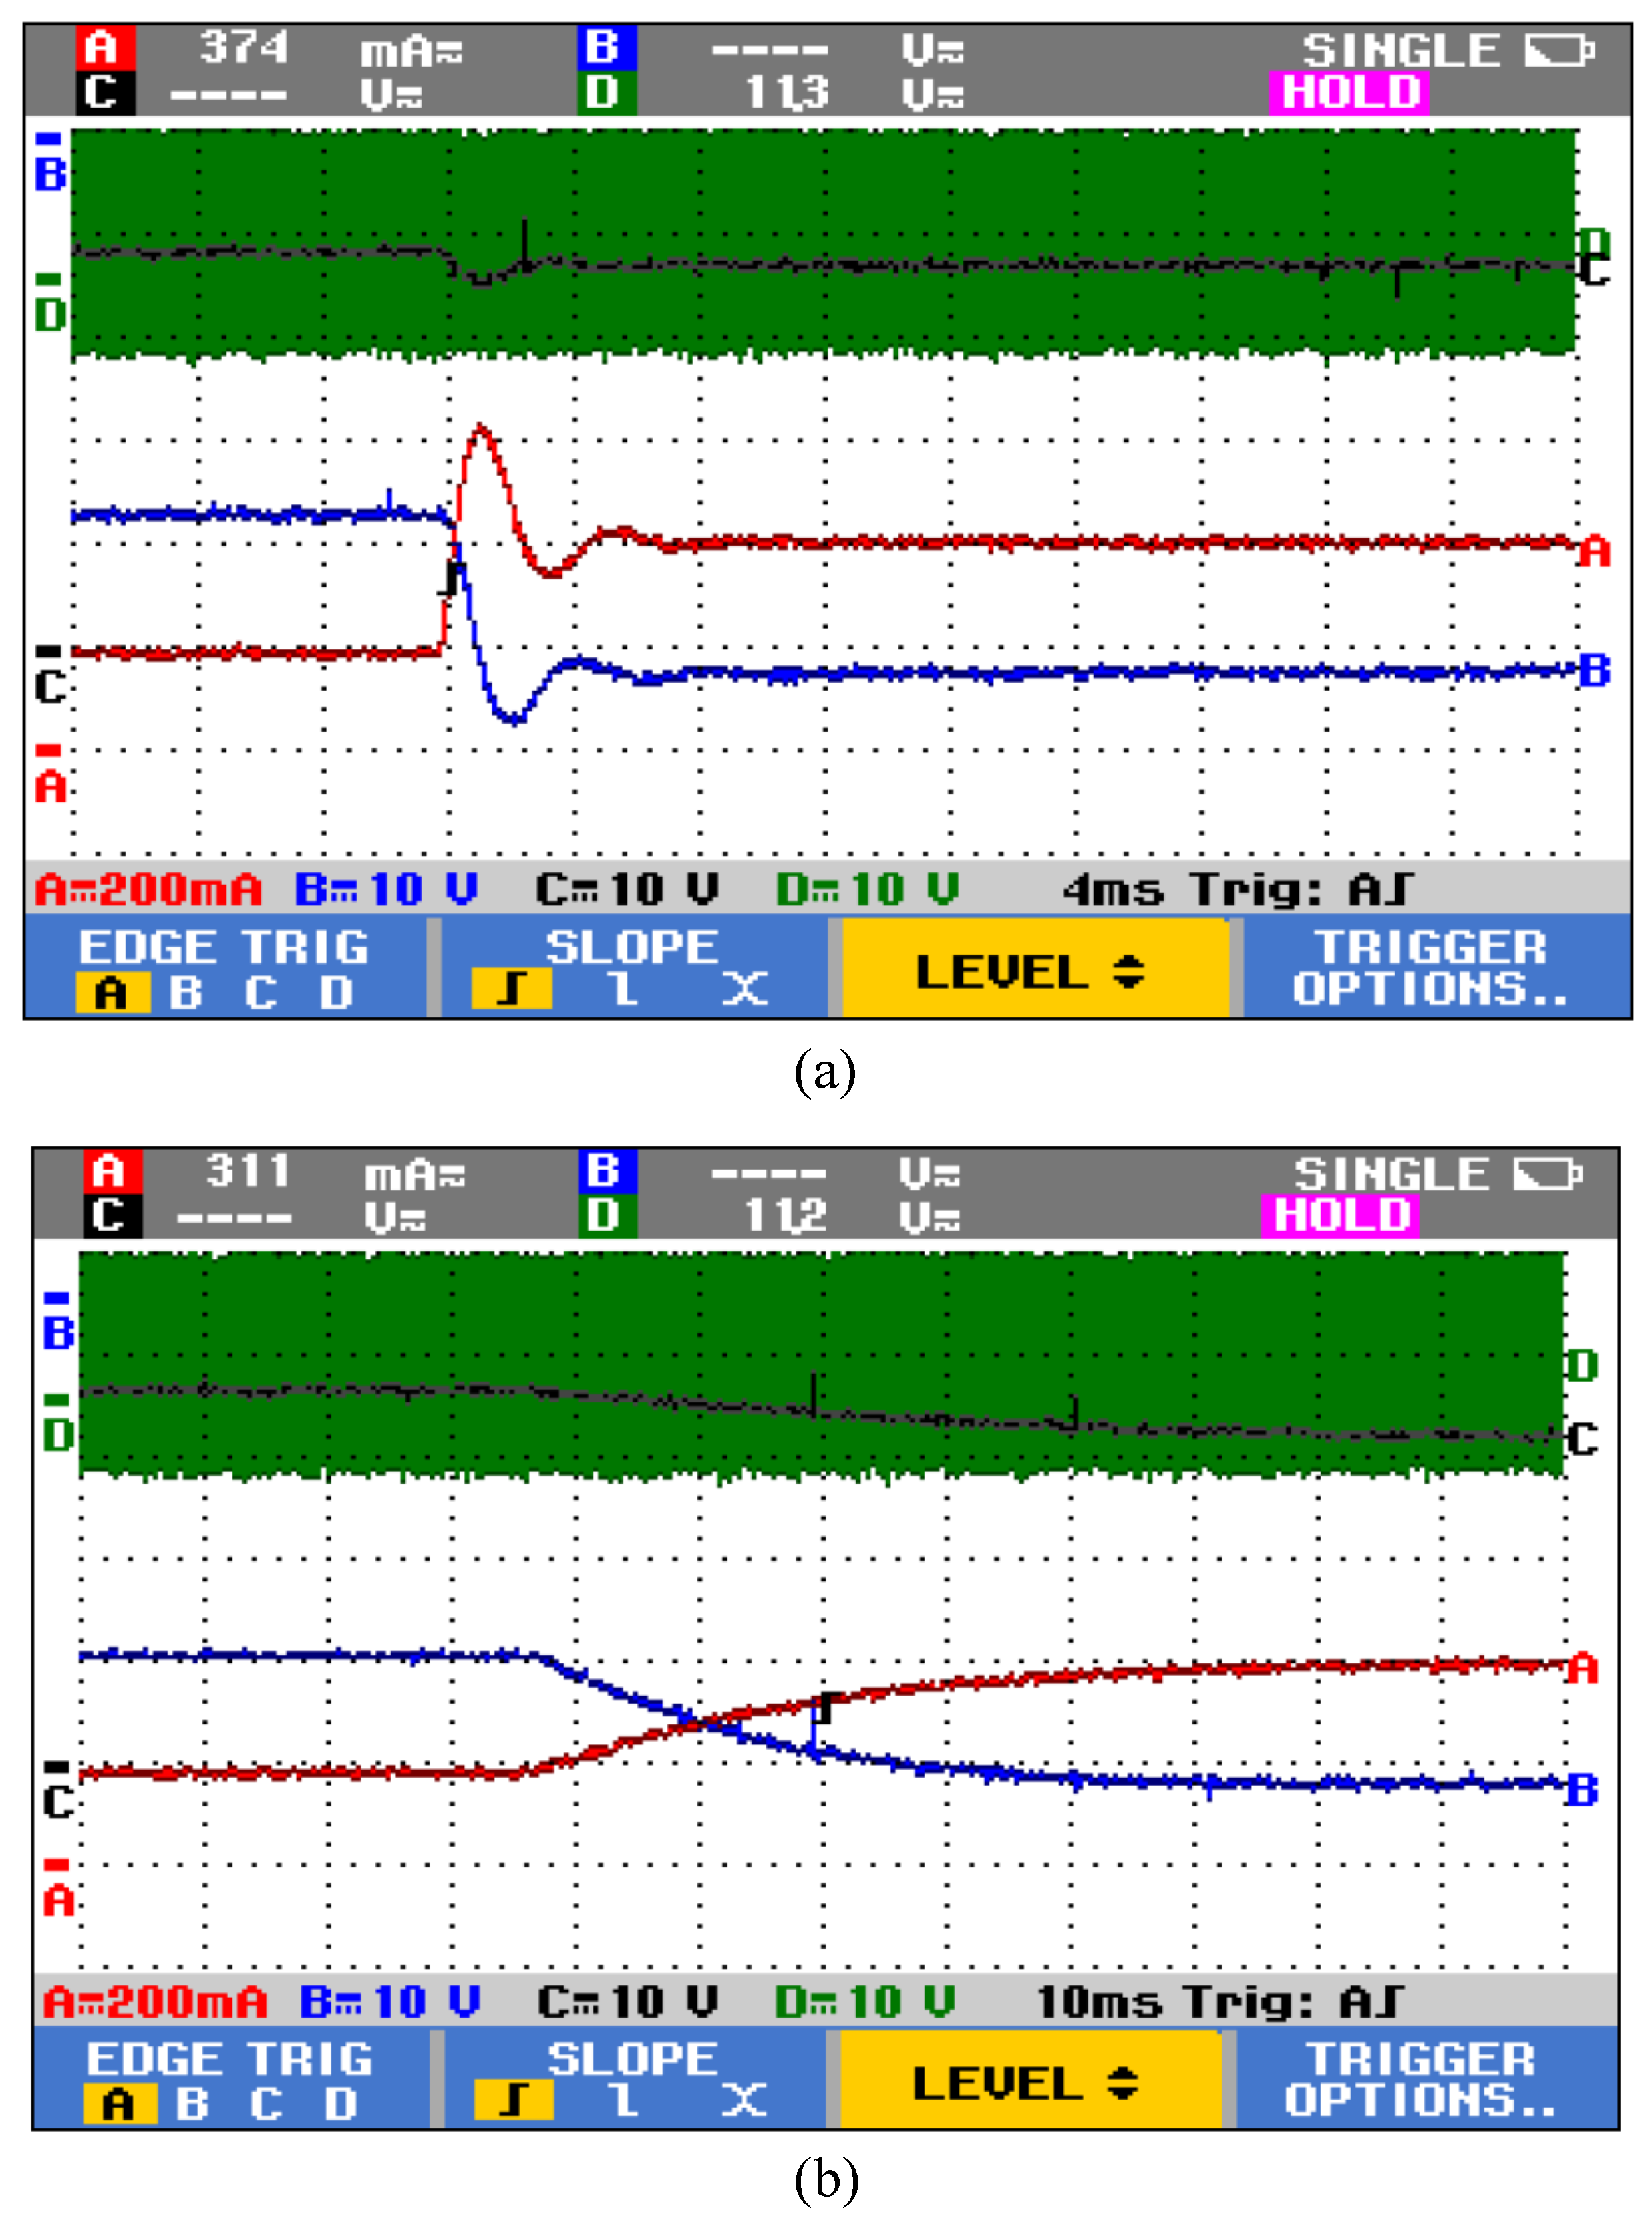
3.3. Comparison of Open Loop and Closed Loop System Response

To quantify the performance comparison of PV array characterization in closed and open loop operations, the PV current and voltage characteristics are simulated for near open circuit condition, near short-circuit condition, and maximum power point conditions, respectively. These results are quantified in terms of percentage overshoot above its steady state value and 5% settling time as shown in Table 1. Percentage overshoot for open loop condition is denoted by P O O L , and settling times are denoted with S T O L and S T C L for open and closed loop conditions, respectively. Overshoot for closed loop response is seen to reduce significantly with comparable settling time in closed and open loops except for near short circuit condition which has lower bandwidth. Note that overshoot was not observed for closed loop response and is therefore not reported in Table 1, showing achieved desired performance.

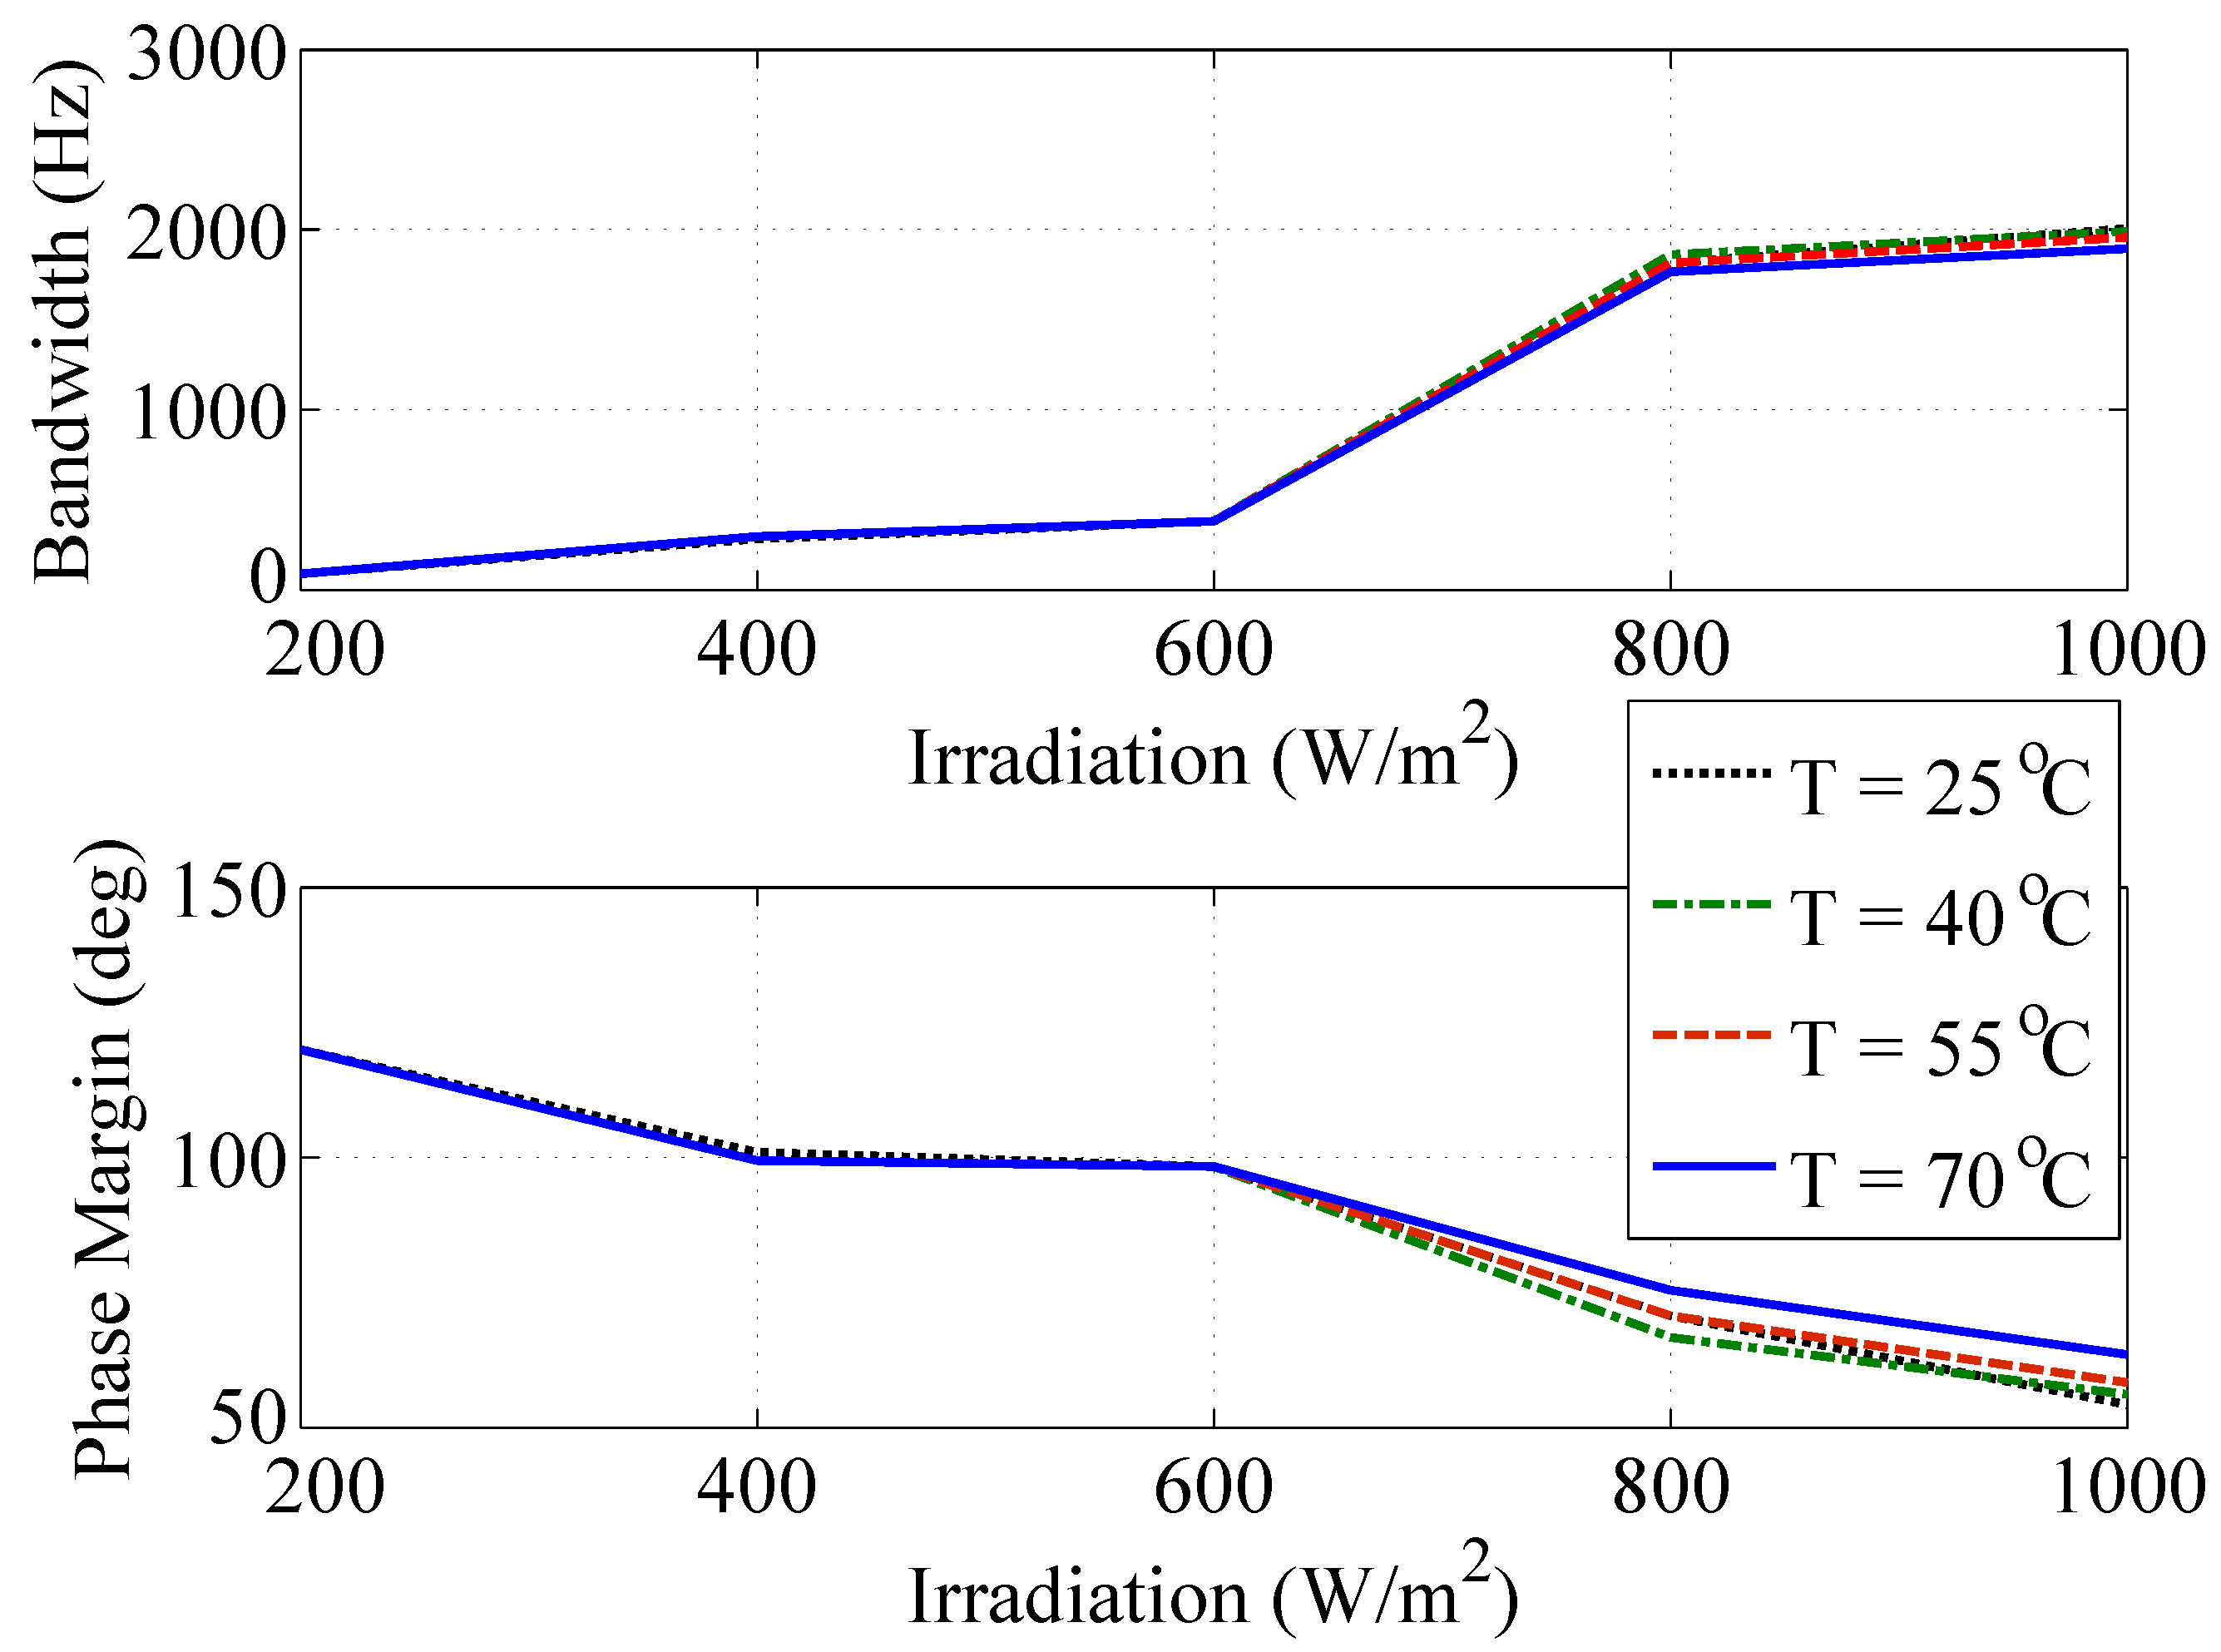
3.4. Effect of Ambient Conditions on Controller Performance

Variation of closed loop controller performance with change in ambient conditions can be gauged by plotting the bode plots of the open loop transfer function, wherein solar irradiance variation from 200 to 1000 W/m 2 is shown along with the temperature variation from 25 to 70 °C. The impact of ambient conditions on the plant transfer function is evaluated in terms of the PV terminal voltage and duty ratio correlation which varies with irradiation and temperature. These correlated data are produced in the Appendix A for reference. Figure 7 shows the variation of the controller bandwidth and phase margin with ambient conditions for maximum power point operation near the converter duty ratio d = 0.6 . It can be seen that as the irradiation increases the bandwidth improves but phase margin reduces. The effect of temperature occurs only at higher irradiation levels above 600 W/m 2 as seen from Figure 7. As temperature increases the phase margin improves but the bandwidth reduces for the system under consideration.
To study the performance of the designed adaptive gain PI controller across a range of operating points with changing ambient conditions, Table 2 is produced. It gives the worst case and best case controller performance parameters such as the bandwidth and stability parameters namely the gain and phase margins. Here, ω B W m i n marks the minimum bandwidth and ω B W m a x marks the maximum bandwidth. Table 2 also marks the point of operation of the converter in terms of duty ratio denoted in parentheses for every maximum and minimum condition. Phase margins are indicated as P M m i n and P M m a x for minimum and maximum values. As far as gain margins are concerned, the system holds an infinite value for other than very low duty ratios, for which case a minimum gain margin of nearly 40 dB is observed at d = 0.05 with a constant phase cross over frequency of 58.3 krad/s, thereby ensuring system stability.
This analysis shows that with the designed controller, the system remains stable with a high bandwidth despite the changes in the ambient conditions of varying irradiance and temperature.

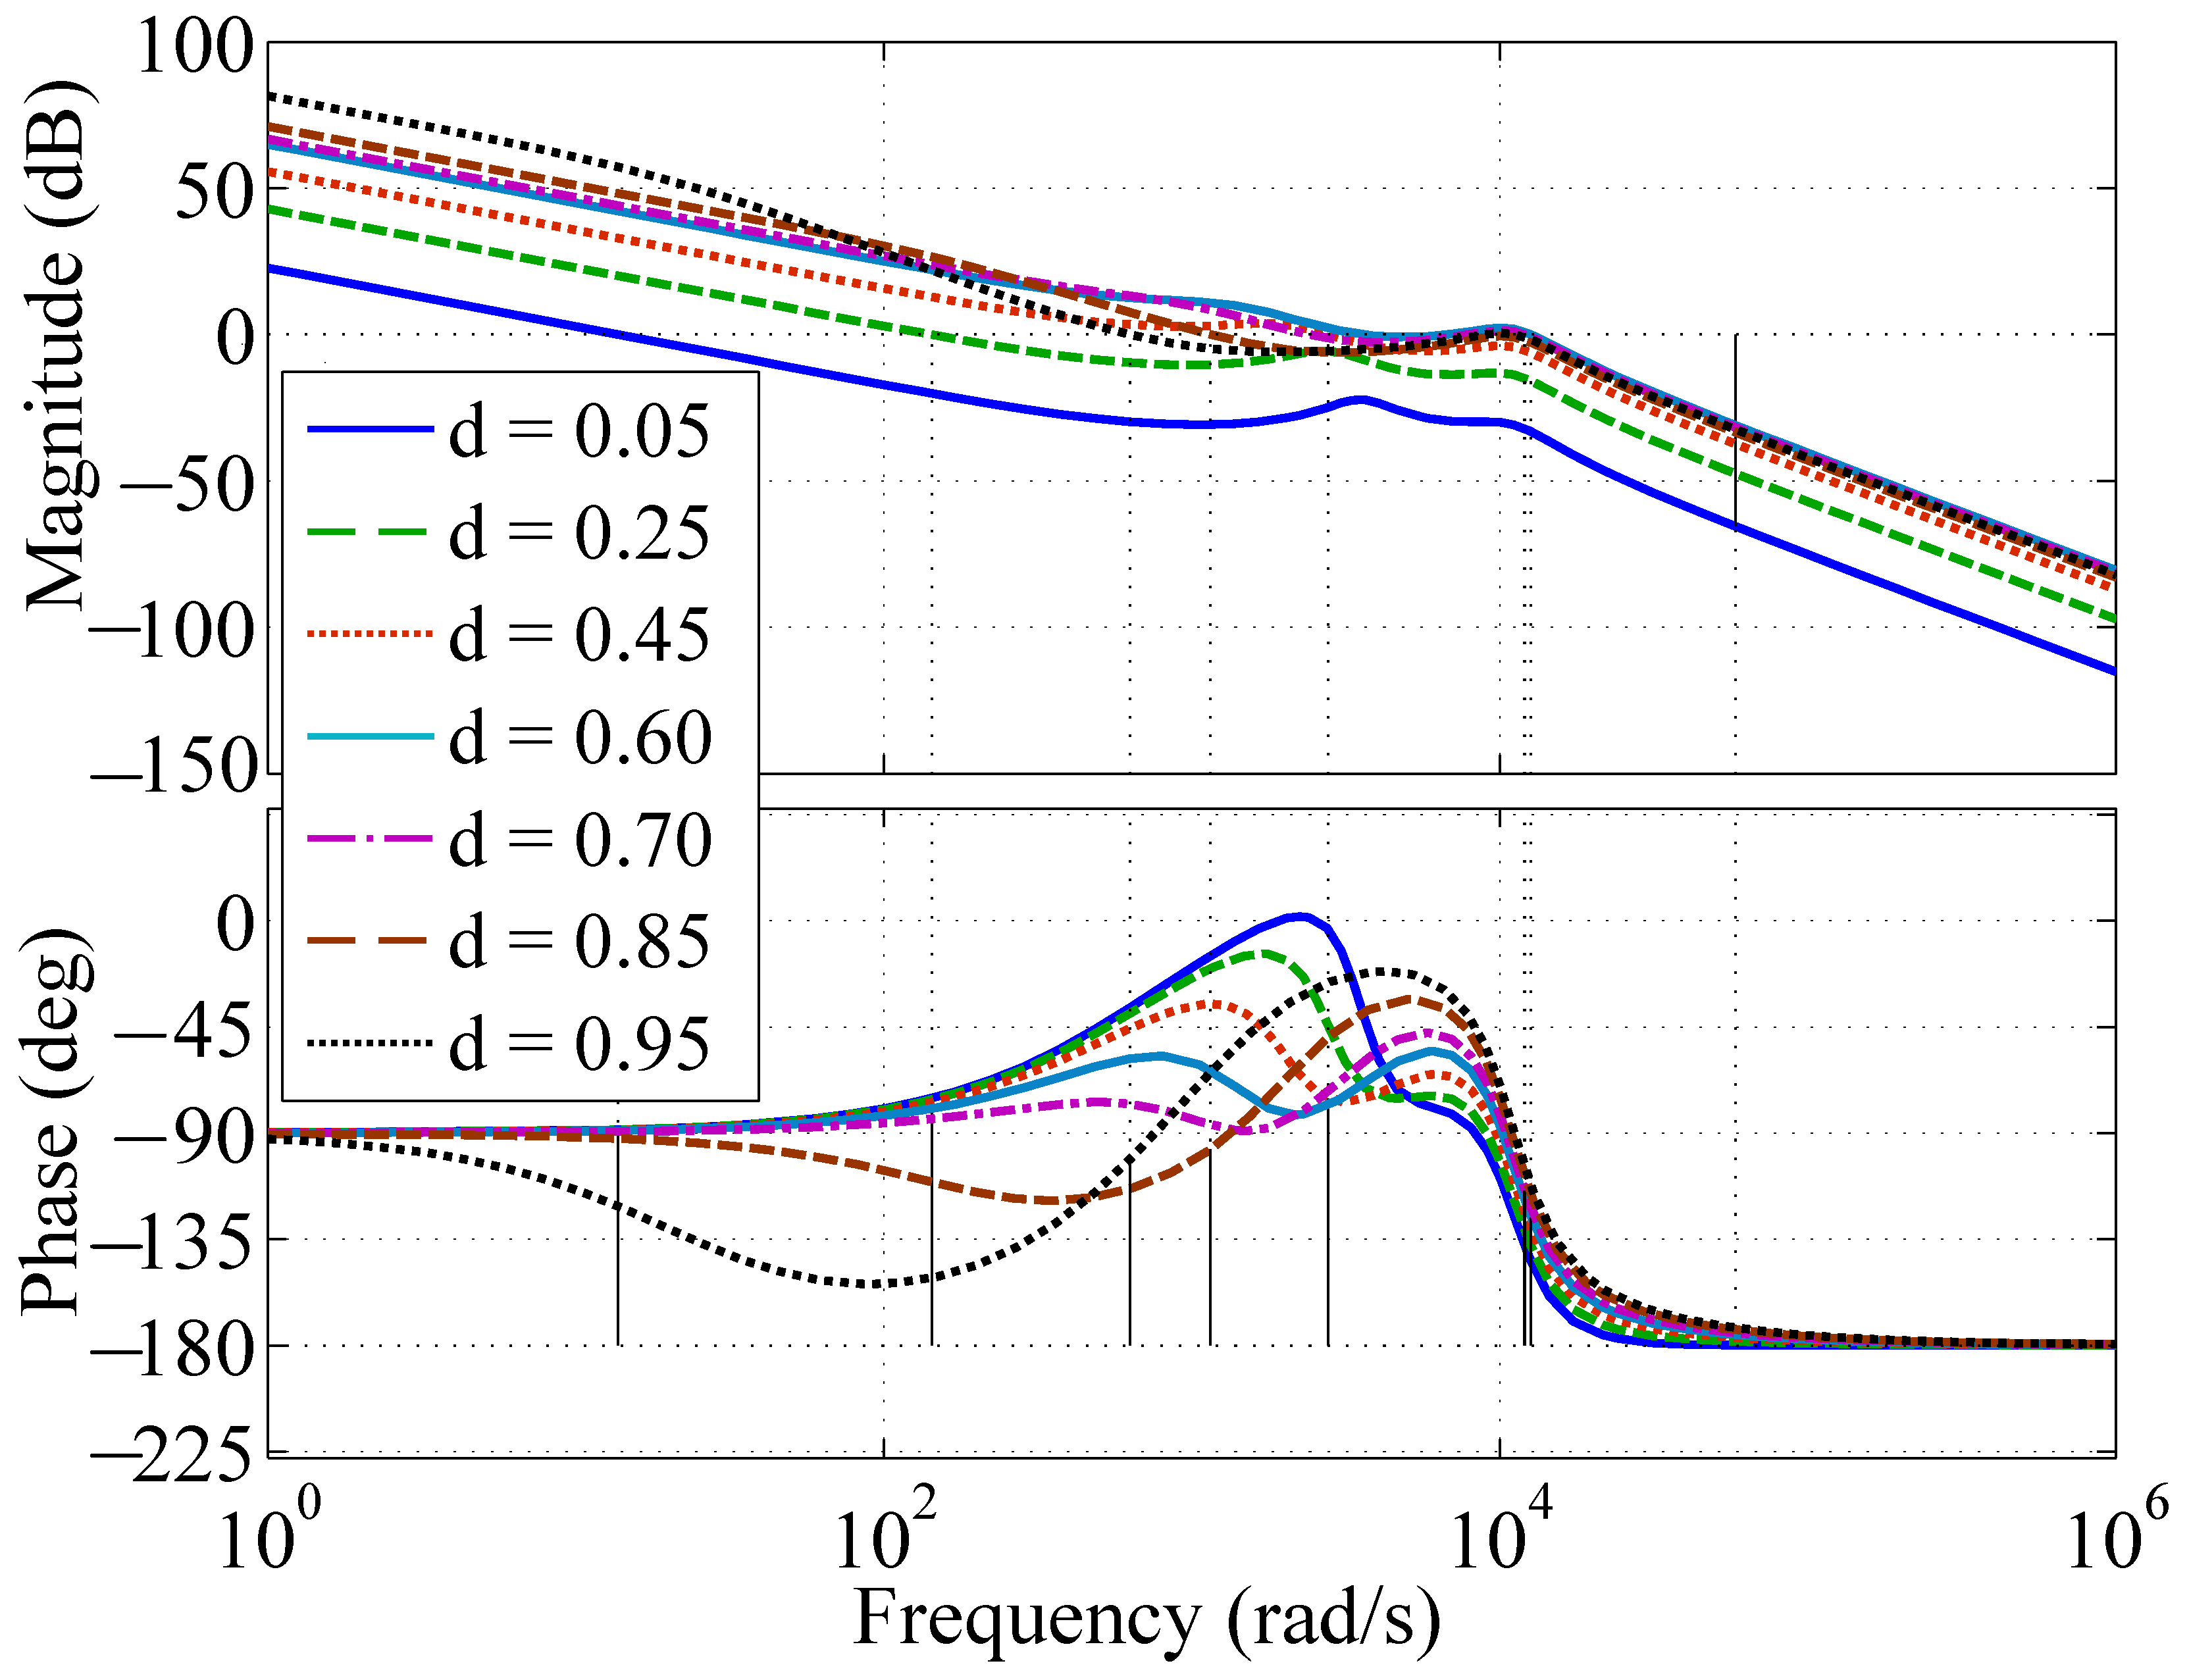
3.5. Linking Frequency-Domain Analysis to Time-Domain Performance

Table 1 shows the time domain performance which can further be correlated to the frequency domain analysis as quantified in Table 2. The bandwidth of the controller as shown in columns 2 and 3 of Table 2 is inversely related to the settling time of the systems, which is quantified in columns 4 and 5 of Table 1. It can be seen that under higher values of duty ratio, which correspond to the short circuit condition in a buck-boost converter, the bandwidth is low. This leads to larger values of settling times. Similarly, at low duty ratio values, corresponding to the open circuit operation, the system bandwidth is higher in Table 2, due to the adaptive gain of the controller, leading to lower settling times in Table 1. Time-domain and frequency-domains are also related in terms of stability. When the gain and phase margins are higher, system is stable with lower overshoots observed in the time-response. It can be seen that throughout the operating ranges of varying ambient conditions, a phase margin of more than 45 and a gain margin of more than 40 dB in Table 2, helps in complete elimination of overshoot in Table 1 for closed loop operation as compared to the open loop operation.

4. Experimental Validation

In this section, the complete experimental setup along with the obtained experimental results under real-field characterization are presented followed by the bench-marking of the quantified results with existing PV characterization methods.

4.1. Experimental Setup

Photovoltaic (PV) modules under test are shown in Figure 8. This PV array consists of polycrystalline PV panels each of which is rated for 300 W power level and are together mounted on a building rooftop. Using connecting cables, different series and parallel combinations of the PV modules are made possible. Under present analysis the results for PV characterization up to 1.2 kW power level are presented. To connect this rooftop PV array to the characterization equipment, connecting cables are further run to the switched mode power converter (SMPC).
The assembled hardware for the buck-boost SMPC-based PV characterization setup is shown in Figure 9. This system consists of several subsystems, namely, input filter, IGBT (insulated-gate bipolar transistor) based dc-dc converter, gate-drive card, current and voltage protection card, current and voltage sensor cards, FPGA controller board, and converter status display card. The adaptive-gain duty ratio variation control algorithm is coded in VHDL (very high speed integrated circuit hardware description language) and fed to the FPGA (field-programmable gate array) controller for generating PWM (pulse width modulation) signal for the buck-boost converter. The dc-dc converter is designed to work at 20 kHz switching frequency and PV terminal voltage and current signals are sampled at 20 Hz rate. The circuit diagram of the buck-boost converter is shown in Figure 10.
The ratings of the passive components and switches are as follows, with more details on the experimental setup design being given in [19].
  • inductor: 1.2 mH, 25 A;
  • output capacitor: 60 μ F, 400 V;
  • IGBT switches: 1200 V, 50 A;
  • input filter inductor: 100 μ H, 25 A;
  • input filter capacitor: 60 μ F, 400 V;
  • output load resistor: 50 Ω , 10 A.

4.2. Experimental Results

PV characterization under real field conditions, of varying solar irradiation and wind-induced varying PV module temperature, is a challenging problem. With the help of the developed buck-boost dc-dc conversion-based switched mode power converter this has been achieved. The performance of the converter under open-loop operation and under closed-loop operation are analyzed here based on the experimental results obtained while operating the characterization of the PV modules under both conditions.
Comparison between the open-loop and closed-loop performance of the characterization setup can be gauged by the experimental step response of the system. When the PV module is connected to the converter, under open-loop operation, the system response shows waveform ringing and oscillations. The percentage overshoot in the open-loop operation is observed to be as high as 100% of its steady state value as seen in Figure 11a. When the response of the closed-loop controller is captured, it is seen to achieve its desired performance as shown in Figure 11b, where PV voltage, current, and output voltage are seen to transition smoothly without any overshoot or ringing unlike open loop operation, as expected from Table 1. An improvement of 100% is observed in PV current overshoot prevention in Figure 11b compared to Figure 11a. Initial startup transitions are also compared for open-loop and closed-loop operations in Figure 12, wherein a 160% reduction is observed in the overshoot of PV current in Figure 12b compared to Figure 12a. This shows that the open loop system settles faster with very high overshoot and ringing as compared to the closed loop operation of the PV characterization set up. The closed loop system has clear advantage in terms of lower overshoot and ringing, with a comparatively slower response, but for PV applications where the fastest irradiance changes are in a few seconds, a closed loop response time of few tens of milliseconds meets the requirement of high speed characterization.
Several configurations of series and parallel connection of PV panels are characterized using the developed set-up, some of which are reported in Figure 13 which show complete current-voltage characteristics captured up to 1.2 kW power level. Each 300 W polycrystalline PV panel is rated at open circuit V g = 45 V and short circuit current of I g = 9 A for standard test conditions (STC) of 1000 W/m 2 , 25 °C. Under actual field testing conditions of 55 °C surface temperature of PV panel, the open circuit voltage is seen to reduce to 40 V, as expected from the thermal coefficient of open circuit voltage as specified in PV panel datasheet [41] and current is seen to be linearly proportional to irradiation level [42] which changes with the time of the day and the cloud cover.
Here, 55 °C is observed as the average PV module surface temperature under Bengaluru weather, where these experiments are conducted. However, under varying ambient conditions including solar irradiation and PV module temperature, the expected voltage and current can be computed using the developed PV steady-state models in [43] which gives a direct relation between the linear scaling of current with irradiance and logarithmic relation of voltage with temperature. Under such conditions also, the developed method remains applicable as the controller is stable with high performance under wide variation of irradiance from 200–1000 W/m 2 and wide variation of temperature from 25 to 70 °C.
The experimental results validate the high-speed characterization ability with eliminated overshoot and ringing in the closed loop operation as shown in the time response plots in Figure 11 and Figure 12, whereas current-voltage (IV) plots of Figure 13 show complete short circuit to open circuit characterization under varying ambient conditions captured via real time field characterization of PV array up to 1.2 kW power level. Note that all the reported PV characterization results are with high power polycrystalline PV modules, each rated at 300 W and irradiated with solar irradiation under actual ambient conditions. Due to varying irradiance and PV module temperature owing to passing clouds and wind flow changes, fast characterization at high power levels are needed and has been achieved in this study.
Some open questions that have evolved as next steps to this study but beyond the scope of present article include dynamic impedance estimation of PV modules using small signal ac characterization with the present SMPC closed loop controller. Another challenging yet exciting application of this work is the accelerated lifetime, aging and reliability study of PV modules using the developed PV characterization setup.

4.3. Performance Comparison with Other Characterization Methods

From the experimental results, the dynamic performance of the proposed characterization method is quantified and benchmarked against existing methods in terms of speed, accuracy, efficiency, power level, and cost effectiveness.
  • From Figure 11 and Figure 12, the settling time of the SMPC-based closed loop characterization is seen to be in tens of milliseconds, which is comparable to the best performing commercial PV electronic loads [44]. A measurement time of 20 ms is reported in [45] and 50–100 ms is reported in [34].
  • The proposed method has a high accuracy which is at par with 0.1% or less characterization error in commercial electronic loads for PV characterization [45]. The accuracy of the proposed method is based on the resolution and accuracy of the voltage and current sensors [46] and data logging equipments [47].
  • The developed switched mode power converter (SMPC) has an accuracy in the range of 85–90% which is much higher than the linear electronic loads which use linear operation of MOSFET [34] or BJT [48]. The efficiency of linear power supplies is typically noted in the range of 40 to 60%, whereas that of SMPC is in the upwards of 80% [49].
  • The power level of the proposed method is in kW range whereas the maximum power level of the commercial equipment and setups developed in PV literature varies from tens of watts [48] to 100 W [34] and goes to a maximum of 300 W [44]. These commercial equipments are also limited by voltage and current ratings and prevent the characterization of series and parallel connected PV modules in an array.
  • The proposed equipment can be developed in a few hundred dollars whereas the price range of equivalent commercial equipment is above thousand US dollars [44]. Therefore, the developed equipment is at least ten times more cost effective.

5. Conclusions

In this work, the design, development, and implementation of a high-power closed-loop photovoltaic characterization setup based on switched mode power converter is presented. The developed buck-boost converter is seen to be efficient, accurate, and fast when applied to the electrical output measurement of PV arrays. The present system is operated up to 1.2 kW and can be directly scaled up for higher power PV system characterization owing to lower operational losses and compact size. Performance of the system is optimized using a proposed adaptive gain PI controller. This closed loop controller is designed for high bandwidth and stable phase margin under varying ambient conditions of 200–1000 W/m 2 irradiance and 25–70 °C temperature. The proposed controller is validated with simulation and experimental results showing its superior performance in terms of lower overshoot and ringing for step change in the point of operation near maximum power point and initial startup transient with respect to the open loop operation where a 100% reduction in the PV current’s overshoot is observed. The motivation for a SMPS-based PV load follows from desirable attributes of variable capture speed and tunable sensitivity, which help in partial shading analysis and global maximum power point tracking. This lays the foundation for a PV energy conversion system which not only processes the solar energy, but can also be used for system modeling through high-performance characterization, which further helps in output prediction and fault diagnosis, and can be instrumental in accelerated life testing of PV arrays.

Author Contributions

Conceptualization, P.B. and V.J.; methodology, P.B. and V.J.; software, P.B.; validation, P.B.; formal analysis, P.B. and V.J.; investigation, P.B.; resources, V.J.; data curation, P.B.; writing—original draft preparation, P.B.; writing—review and editing, P.B. and V.J.; visualization, P.B. and V.J.; supervision, V.J.; project administration, V.J.; funding acquisition, P.B. and V.J. Both authors have read and agreed to the published version of the manuscript.

Funding

This research received no external funding.

Institutional Review Board Statement

Not applicable.

Informed Consent Statement

Not applicable.

Data Availability Statement

Exclude this statement: no data reported.

Conflicts of Interest

The authors declare no conflict of interest.

Appendix A

To understand the impact of ambient conditions on plant parameters, the PV source voltage and the duty ratio correlation is produced here as shown in Table A1. It can be seen that as the irradiation increases voltages for same duty ratios increase and as temperature increases voltages for same duty ratios decrease. This data correlation is used in evaluation of the controller performance in varying ambient conditions and is obtained by simulation of PV characteristics based on datasheet model of the 300 W polycrystalline PV module [43] when connected to a buck-boost converter with 50 Ω resistive load. These data are useful for lifetime and reliability estimation of PV systems [50].
Table A1. Duty ratio versus voltage lookup-table at varying ambient conditions.
Ambient ConditionsD = [0.05 0.25 0.45 0.60 0.70 0.85 0.95]
200 W/m 2 , 25 °CV (V) = [0.1 0.6 3.2 7.7 25.4 40.9 41.6]
400 W/m 2 , 25 °CV (V) = [0.2 1.2 6.4 15.4 39.3 42.6 43.1]
600 W/m 2 , 25 °CV (V) = [0.2 1.7 9.5 22.9 41.6 43.6 43.9]
800 W/m 2 , 25 °CV (V) = [0.2 2.1 12.6 30.5 42.7 44.3 44.5]
1000 W/m 2 , 25 °CV (V) = [0.3 2.7 15.7 36.7 43.5 44.8 45.0]
200 W/m 2 , 40 °CV (V) = [0.1 0.6 3.3 7.7 26.0 38.3 39.0]
400 W/m 2 , 40 °CV (V) = [0.2 1.1 6.3 15.5 37.2 40.0 40.6]
600 W/m 2 , 40 °CV (V) = [0.2 1.7 9.6 23.2 39.3 41.2 41.4]
800 W/m 2 , 40 °CV (V) = [0.3 2.2 12.8 30.3 40.4 41.8 42.1]
1000 W/m 2 , 40 °CV (V) = [0.3 2.7 16.1 35.3 41.0 42.3 42.6]
200 W/m 2 , 55 °CV (V) = [0.1 0.6 3.2 7.9 25.7 35.7 36.4]
400 W/m 2 , 55 °CV (V) = [0.2 1.2 6.6 15.6 32.6 35.0 35.6]
600 W/m 2 , 55 °CV (V) = [0.2 1.7 9.7 23.4 36.9 38.6 39.0]
800 W/m 2 , 55 °CV (V) = [0.2 2.2 12.9 30.1 38.0 39.3 39.6]
1000 W/m 2 , 55 °CV (V) = [0.3 2.8 16.1 33.8 38.8 39.8 40.2]
200 W/m 2 , 70 °CV (V) = [0.1 0.6 3.3 8.0 25.6 33.2 33.8]
400 W/m 2 , 70 °CV (V) = [0.2 1.2 6.6 15.6 32.6 35.0 35.6]
600 W/m 2 , 70 °CV (V) = [0.3 2.2 13.1 29.2 35.6 36.9 37.3]
800 W/m 2 , 70 °CV (V) = [0.3 2.8 16.4 32.0 36.4 37.4 37.7]
1000 W/m 2 , 70 °CV (V) = [0.3 2.8 16.5 30.1 33.9 35.0 35.4]

References

  1. Premkumar, M.; Subramaniam, U.; Babu, T.S.; Elavarasan, R.M.; Mihet-Popa, L. Evaluation of Mathematical Model to Characterize the Performance of Conventional and Hybrid PV Array Topologies under Static and Dynamic Shading Patterns. Energies 2020, 13, 3216. [Google Scholar] [CrossRef]
  2. Morishige, A.E.; Laine, H.S.; Looney, E.E.; Jensen, M.A.; Vogt, S.; Li, J.B.; Lai, B.; Savin, H.; Buonassisi, T. Increased Throughput and Sensitivity of Synchrotron-Based Characterization for Photovoltaic Materials. IEEE J. Photovolt. 2017, 7, 763–771. [Google Scholar] [CrossRef]
  3. Barelli, L.; Bidini, G.; Bonucci, F.; Castellini, L.; Castellini, S.; Ottaviano, A.; Pelosi, D.; Zuccari, A. Dynamic Analysis of a Hybrid Energy Storage System (H-ESS) Coupled to a Photovoltaic (PV) Plant. Energies 2018, 11, 396. [Google Scholar] [CrossRef] [Green Version]
  4. Martín-Chivelet, N.; Guillén, C.; Trigo, J.F.; Herrero, J.; Pérez, J.J.; Chenlo, F. Comparative Performance of Semi-Transparent PV Modules and Electrochromic Windows for Improving Energy Efficiency in Buildings. Energies 2018, 11, 1526. [Google Scholar] [CrossRef] [Green Version]
  5. Conceição, R.; Silva, H.G.; Mirão, J.; Collares-Pereira, M. Organic Soiling: The Role of Pollen in PV Module Performance Degradation. Energies 2018, 11, 294. [Google Scholar] [CrossRef] [Green Version]
  6. Bharadwaj, P.; John, V. Optimized Global Maximum Power Point Tracking of Photovoltaic Systems Based on Rectangular Power Comparison. IEEE Access 2021, 9, 53602–53616. [Google Scholar] [CrossRef]
  7. Balato, M.; Petrarca, C. The Impact of Reconfiguration on the Energy Performance of the Distributed Maximum Power Point Tracking Approach in PV Plants. Energies 2020, 13, 1511. [Google Scholar] [CrossRef] [Green Version]
  8. Bharadwaj, P.; Lehman, B. Maximising Energy Yield Using Global Maximum Power Point Tracking of Reconfigurable Photovoltaic Panel Array. In Proceedings of the 2020 IEEE 21st Workshop on Control and Modeling for Power Electronics (COMPEL), Aalborg, Denmark, 9–12 November 2020; pp. 1–7. [Google Scholar] [CrossRef]
  9. Kim, K.A.; Seo, G.S.; Cho, B.H.; Krein, P.T. Photovoltaic Hot-Spot Detection for Solar Panel Substrings Using AC Parameter Characterization. IEEE Trans. Power Electron. 2016, 31, 1121–1130. [Google Scholar] [CrossRef]
  10. Hallam, B.J.; Hamer, P.G.; Bonilla, R.S.; Wenham, S.R.; Wilshaw, P.R. Method of Extracting Solar Cell Parameters From Derivatives of Dark I–V Curves. IEEE J. Photovolt. 2017, 7, 1304–1312. [Google Scholar] [CrossRef]
  11. Tanahashi, T.; Sakamoto, N.; Shibata, H.; Masuda, A. Localization and Characterization of a Degraded Site in Crystalline Silicon Photovoltaic Cells Exposed to Acetic Acid Vapor. IEEE J. Photovolt. 2018, 8, 997–1004. [Google Scholar] [CrossRef]
  12. Bertram, T.; Deprédurand, V.; Siebentritt, S. Electrical Characterization of Defects in Cu-Rich Grown CuInSe2 Solar Cells. IEEE J. Photovolt. 2016, 6, 546–551. [Google Scholar] [CrossRef] [Green Version]
  13. Baumgartner, H.; Oksanen, B.; Kärhä, P.; Ikonen, E. Optical Characterization of III-V Multijunction Solar Cells for Temperature-Independent Band Gap Features. IEEE J. Photovolt. 2019, 9, 1631–1636. [Google Scholar] [CrossRef]
  14. Kruse, C.N.; Wolf, M.; Schinke, C.; Hinken, D.; Brendel, R.; Bothe, K. Impact of Contacting Geometries When Measuring Fill Factors of Solar Cell Current–Voltage Characteristics. IEEE J. Photovolt. 2017, 7, 747–754. [Google Scholar] [CrossRef]
  15. Rutzinger, M.; Salzberger, M.; Nesswetter, H.; Lackner, D.; Bett, A.W.; Lugli, P.; Zimmermann, C.G. Subcell Characterization in Multijunction Solar Cells Using Pulsed Light. IEEE J. Photovolt. 2017, 7, 709–714. [Google Scholar] [CrossRef]
  16. Koutsourakis, G.; Cashmore, M.; Hall, S.R.G.; Bliss, M.; Betts, T.R.; Gottschalg, R. Compressed Sensing Current Mapping Spatial Characterization of Photovoltaic Devices. IEEE J. Photovolt. 2017, 7, 486–492. [Google Scholar] [CrossRef] [Green Version]
  17. Paternoster, G.; Nicolai, M.; de Ceglia, G.; Zanuccoli, M.; Bellutti, P.; Ferrario, L.; Sangiorgi, E.; Fiegna, C. Fabrication, Simulation, and Experimental Characterization of EWT Solar Cells With Deep Grooved Base Contact. IEEE J. Photovolt. 2016, 6, 1072–1079. [Google Scholar] [CrossRef]
  18. Alonso-Álvarez, D.; Ekins-Daukes, N. Photoluminescence-Based Current–Voltage Characterization of Individual Subcells in Multijunction Devices. IEEE J. Photovolt. 2016, 6, 1004–1011. [Google Scholar] [CrossRef] [Green Version]
  19. Bharadwaj, P.; John, V. High performance buck-boost converter based PV characterisation set-up. In Proceedings of the 2017 IEEE Energy Conversion Congress and Exposition (ECCE), Cincinnati, OH, USA, 1–5 October 2017; pp. 4425–4432. [Google Scholar] [CrossRef]
  20. Apolloni, M.; Keller, K.; Seghrouchni, Z.; Sinicco, I. Power Measurement of MICROMORPH Tandem Modules—An Overview. IEEE J. Photovolt. 2016, 6, 1228–1242. [Google Scholar] [CrossRef]
  21. Luo, W.; Hacke, P.; Singh, J.P.; Chai, J.; Wang, Y.; Ramakrishna, S.; Aberle, A.G.; Khoo, Y.S. In-Situ Characterization of Potential-Induced Degradation in Crystalline Silicon Photovoltaic Modules Through Dark I–V Measurements. IEEE J. Photovolt. 2017, 7, 104–109. [Google Scholar] [CrossRef]
  22. Minnaert, B.; Veelaert, P. A Proposal for Typical Artificial Light Sources for the Characterization of Indoor Photovoltaic Applications. Energies 2014, 7, 1500–1516. [Google Scholar] [CrossRef] [Green Version]
  23. Liang, T.S.; Pravettoni, M.; Singh, J.P.; Khoo, Y.S. A Metrological Study of Accurate Indoor Characterisation of Commercial Bifacial Photovoltaic Module With Single Light Source. IEEE J. Photovolt. 2020, 10, 1448–1454. [Google Scholar] [CrossRef]
  24. Yandt, M.D.; Cook, J.P.D.; Kelly, M.; Schriemer, H.; Hinzer, K. Dynamic Real-Time I–V Curve Measurement System for Indoor/Outdoor Characterization of Photovoltaic Cells and Modules. IEEE J. Photovolt. 2015, 5, 337–343. [Google Scholar] [CrossRef] [Green Version]
  25. Kawagoe, K.; Hishikawa, Y.; Yamada, N. Outdoor Direct STC Performance Measurement of PV Modules Based on a Sun-Shading Technique. IEEE J. Photovolt. 2017, 7, 1725–1730. [Google Scholar] [CrossRef]
  26. Hishikawa, Y.; Doi, T.; Higa, M.; Yamagoe, K.; Ohshima, H. Precise Outdoor PV Module Performance Characterization Under Unstable Irradiance. IEEE J. Photovolt. 2016, 6, 1221–1227. [Google Scholar] [CrossRef]
  27. Bharadwaj, P.; John, V. Subcell Modeling of Partially Shaded Photovoltaic Modules. IEEE Trans. Ind. Appl. 2019, 55, 3046–3054. [Google Scholar] [CrossRef]
  28. Mathew, M.; Kumar, N.M.; i Koroth, R.P. Outdoor measurement of mono and poly c-Si PV modules and array characteristics under varying load in hot-humid tropical climate. Mater. Today Proc. 2018, 5, 3456–3464. [Google Scholar] [CrossRef]
  29. Faifer, M.; Cristaldi, L.; Piegari, L.; Soulatiantork, P. Design of a converter for photovoltaic panels testing. In Proceedings of the 2015 International Conference on Clean Electrical Power (ICCEP), Taormina, Italy, 16–18 June 2015; pp. 674–681. [Google Scholar] [CrossRef]
  30. Erkaya, Y.; Moses, P.; Marsillac, S. On-site characterization of PV modules using a portable, MOSFET-based capacitive load. In Proceedings of the 2016 IEEE 43rd Photovoltaic Specialists Conference (PVSC), Portland, OR, USA, 5–10 June 2016; pp. 3119–3122. [Google Scholar] [CrossRef]
  31. Carrillo, J.M.; Martínez-Moreno, F.; Lorenzo, C.; Lorenzo, E. Uncertainties on the outdoor characterization of PV modules and the calibration of reference modules. Sol. Energy 2017, 155, 880–892. [Google Scholar] [CrossRef] [Green Version]
  32. Spertino, F.; Sumaili, J.; Andrei, H.; Chicco, G. PV Module Parameter Characterization From the Transient Charge of an External Capacitor. IEEE J. Photovolt. 2013, 3, 1325–1333. [Google Scholar] [CrossRef]
  33. Muñoz, J.; Lorenzo, E. Capacitive load based on IGBTs for on-site characterization of PV arrays. Sol. Energy 2006, 80, 1489–1497. [Google Scholar] [CrossRef] [Green Version]
  34. Kuai, Y.; Yuvarajan, S. An electronic load for testing photovoltaic panels. J. Power Sources 2006, 154, 308–313. [Google Scholar] [CrossRef]
  35. Andrade, A.M.S.S.; Schuch, L.; da Silva Martins, M.L. High Step-Up PV Module Integrated Converter for PV Energy Harvest in FREEDM Systems. IEEE Trans. Ind. Appl. 2017, 53, 1138–1148. [Google Scholar] [CrossRef]
  36. Amirabadi, M.; Toliyat, H.A.; Alexander, W.C. A Multiport AC Link PV Inverter With Reduced Size and Weight for Stand-Alone Application. IEEE Trans. Ind. Appl. 2013, 49, 2217–2228. [Google Scholar] [CrossRef]
  37. Lima, N.N.; de Freitas, L.C.; Buiatti, G.M.; Vieira, J.B.; Freitas, L.C.G.; Coelho, E.A.A. Low complexity system for real-time determination of current-voltage characteristic of PV modules and strings. In Proceedings of the 2013 Twenty-Eighth Annual IEEE Applied Power Electronics Conference and Exposition (APEC), Long Beach, CA, USA, 17–21 March 2013; pp. 2817–2823. [Google Scholar] [CrossRef]
  38. Bharadwaj, P.; Kulkarni, A.; John, V. Impedance estimation of photovoltaic modules for inverter start-up analysis. Sādhanā 2017, 42, 1377–1387. [Google Scholar] [CrossRef]
  39. IEC 60904-1, Photovoltaic Devices, Part 1: Measurement of Photovoltaic Current–Voltage Characteristics; Standard; International Electrotechnical Commission: Geneva, Switzerland, 2006.
  40. Erickson, R.W.; Maksimovic, D. Fundamentals of Power Electronics; Springer Science & Business Media: Berlin, Germany, 2007. [Google Scholar]
  41. ES 275-295 P72, EMMVEE Photovoltaics. Photovoltaic Module. 2012. Available online: https://www.enfsolar.com/pv/panel-datasheet/Polycrystalline/63 (accessed on 1 October 2017).
  42. Chatterjee, A.; Keyhani, A.; Kapoor, D. Identification of photovoltaic source models. IEEE Trans. Energy Convers. 2011, 26, 883–889. [Google Scholar] [CrossRef]
  43. Bharadwaj, P.; Chaudhury, K.N.; John, V. Sequential Optimization for PV Panel Parameter Estimation. IEEE J. Photovolt. 2016, 6, 1261–1268. [Google Scholar] [CrossRef]
  44. Keysight Technologies. N3300 Series DC Electronic Loads. 2020. Available online: https://www.testworld.com/wp-content/uploads/solar-cell-and-module-testing.pdf (accessed on 7 August 2021).
  45. Agilent Technologies. Solutions for Solar Cell and Module Testing. 2021. Available online: https://www.keysight.com/us/en/assets/7018-06712/data-sheets/5980-0232.pdf (accessed on 7 August 2021).
  46. Abhijit, K. Design of Grid Connected Solar Inverter with Reduced THD Using Adaptive Harmonic Elimination Technique; Department of Electrical Engineering, Indian Institute of Science: Bengaluru, India, 2011. [Google Scholar]
  47. Fluke. Fluke 190-204 ScopeMeter. 2016. Available online: https://www.fluke.com/en-us/product/electrical-testing/portable-oscilloscopes/190-series-ii/fluke-190-ii-190-204 (accessed on 7 August 2021).
  48. Ameri, O.; Serhan, M.; Lamont, L.; Chaar, L. Variable electronic load for testing PV performance. Appl. Sol. Energy 2010, 46, 89–96. [Google Scholar] [CrossRef]
  49. Sam Sattel. Linear Regulated vs. Switch Mode Power Supply. 2016. Available online: https://www.autodesk.com/products/eagle/blog/linear-regulated-vs-switch-mode-power-supply/ (accessed on 7 August 2021).
  50. Sangwongwanich, A.; Yang, Y.; Sera, D.; Blaabjerg, F.; Zhou, D. On the Impacts of PV Array Sizing on the Inverter Reliability and Lifetime. IEEE Trans. Industry Appl. 2018, 54, 3656–3667. [Google Scholar] [CrossRef] [Green Version]
Figure 1. Small signal AC equivalent circuit for buck-boost converter with PV voltage v g , inductor L’s current i, capacitor C, load resistor R’s voltage v and control input d where D = 1 D . ˜ refers to the small signal variation in the steady state variables marked in capital letters.
Energies 14 05296 g001
Figure 2. Damped input filter circuit with L f , C f as main LC filter and the series combination of R f , C b as parallel damping branch.
Energies 14 05296 g002
Figure 3. (a) Open-loop block diagram of the PV characterization setup. (b) Closed-loop block diagram of the PV characterization setup.
Energies 14 05296 g003
Figure 4. Open loop transfer function of the system is plotted for varying duty ratios with phase margin and gain crossover frequencies marked at STC G = 1000 W/m 2 , T = 25 °C for a single 300 W polycrystalline PV module.
Energies 14 05296 g004
Figure 5. Open loop transfer function frequency response for 0.05 duty ratio with Gain of 16 multiplied to the PI controller transfer function.
Energies 14 05296 g005
Figure 6. Complete current-voltage characterization algorithm using adaptive gain PI controller with stable operation under varying ambient conditions.
Energies 14 05296 g006
Figure 7. Variation in phase margin and bandwidth with ambient conditions, namely, irradiation and temperature, for maximum power point operation corresponding to 0.6 duty ratio here.
Energies 14 05296 g007
Figure 8. Array of several 300 W PV modules under test in a rooftop setting.
Energies 14 05296 g008
Figure 9. Picture of the high power PV characterization hardware set-up with different subsystems marked. IGBT based buck-boost switched mode power converter characterizing 1.2 kW rated rooftop solar panels via input filter.
Energies 14 05296 g009
Figure 10. Circuit diagram of the buck-boost converter topology along with input and output filters.
Energies 14 05296 g010
Figure 11. Experimentally measured response of the converter with PV source: (a) open-loop system and (b) closed-loop system, to a step change in control variable, showing Ch A: source current with 1 V/5 A sensor gain and 200 mV/div, Ch B: converter output voltage 10 V/div, Ch C: source voltage 10 V/div, Ch D: gate pulses given to IGBT 10 V/div.
Energies 14 05296 g011
Figure 12. Experimentally measured response of the converter with PV source: (a) open-loop system and (b) closed-loop system, to the startup transient in the control variable, showing Ch A: source current with 1 V/5 A sensor gain and 200 mV/div, Ch B: converter output voltage 10 V/div, Ch C: source voltage 10 V/div, Ch D: gate pulses given to IGBT 10 V/div.
Energies 14 05296 g012
Figure 13. Measured current-voltage characteristics as obtained from the developed characterization system for (a) cloudy sky irradiating three PV panels connected in series, (b) bright sky irradiating three PV panels in connected in series, (c) cloudy sky irradiating four series connected PV panels (d) bright sky irradiating four series connected panels. Each polycrystalline PV panel under test is rated at 300 W. Scale: (a) current on y-axis is 2 A/div, voltage on x-axis is 50 V/div; (b) current on y-axis is 5 A/div, voltage on x-axis is 50 V/div; (c) current on y-axis is 2 A/div, voltage on x-axis is 50 V/div; (d) current on y-axis is 5 A/div, voltage on x-axis is 50 V/div.
Energies 14 05296 g013
Table 1. Comparison of closed and open loop response of PV characterization.
CaseSteady State PO OL ST OL (ms) ST CL (ms)
i g , M P P 8.42 A01.201314
v g , M P P 32.20 V00.121214
i g , o c 0.02 A73.901020
v g , o c 44.95 V00.021030
i g , s c 8.59 A23.75121.5 s
v g , s c 1.60 V00.34121.5 s
Table 2. Variation in controller parameters with changing ambient conditions of irradiation (G) and temperature (T) for complete duty ratio (d) variation.
G
W/m
T
°C
ω BW min
rad/s
ω BW max
krad/s
PM min
deg
PM max
deg
GM min
 dB@ 58.3 krad/s
20025309 (0.95)4.56 (0.05)45.9 (0.95)112 (0.45)40.1 (0.05)
20040309 (0.95)4.39 (0.05)45.9 (0.95)113 (0.05)40.8 (0.05)
20055240 (0.05)4.10 (0.45)45.9 (0.95)128 (0.45)41.4 (0.05)
20070222 (0.05)3.80 (0.25)45.9 (0.95)128 (0.05)42.0 (0.05)
40025658 (0.85)4.62 (0.05)63.5 (0.95)109 (0.05)39.9 (0.05)
40040309 (0.95)4.47 (0.05)45.9 (0.95)111 (0.05)40.4 (0.05)
40055472 (0.95)4.33 (0.05)63.5 (0.95)114 (0.05)41.0 (0.05)
40070237 (0.05)3.96 (0.25)63.5 (0.95)114 (0.05)41.5 (0.05)
60025472 (0.95)4.67 (0.05)63.5 (0.95)108 (0.05)39.7 (0.05)
60040472 (0.95)4.52 (0.05)63.5 (0.95)110 (0.05)40.3 (0.05)
60055472 (0.95)4.39 (0.05)63.5 (0.95)113 (0.05)40.8 (0.05)
60070241 (0.05)4.03 (0.25)63.5 (0.95)114 (0.05)41.4 (0.05)
80025472 (0.95)4.67 (0.05)63.5 (0.95)108 (0.05)39.6 (0.05)
80040472 (0.95)4.58 (0.05)63.5 (0.95)110 (0.05)40.1 (0.05)
80055472 (0.95)4.44 (0.05)63.5 (0.95)112 (0.05)40.6 (0.05)
80070241 (0.05)4.09 (0.25)54.2 (0.60)115 (0.05)41.2 (0.05)
100025630 (0.95)4.74 (0.25)56.1 (0.60)108 (0.05)39.5 (0.05)
100040630 (0.95)4.54 (0.05)58.3 (0.60)108 (0.05)40.0 (0.05)
100055630 (0.95)4.44 (0.05)63.5 (0.60)112 (0.05)40.6 (0.05)
100070630 (0.95)4.33 (0.05)75.4 (0.60)114 (0.05)41.0 (0.05)
Publisher’s Note: MDPI stays neutral with regard to jurisdictional claims in published maps and institutional affiliations.

