Article

Comprehensive Design of DC Shipboard Power Systems for Pure Electric Propulsion Ship Based on Battery Energy Storage System

1
School of Electronic and Electrical Engineering, IT College, Kyungpook National University, Daegu 41566, Korea
2
Department of Electrical Engineering, Korea Naval Academy, Changwon 51704, Korea
3
System Control Research Center, Industry Applications Research Division, Korea Electrotechnology Research Institute, Changwon 51543, Korea
*
Author to whom correspondence should be addressed.
Energies 2021, 14(17), 5264; https://doi.org/10.3390/en14175264
Submission received: 20 July 2021 / Revised: 12 August 2021 / Accepted: 22 August 2021 / Published: 25 August 2021
(This article belongs to the Special Issue Advances in Shipboard Power Systems)

Abstract

:
With the strengthening of international environmental regulations, many studies on the integrated electric propulsion systems applicable to eco-friendly ship are being conducted. However, few studies have been performed to establish a guide line for the overall pure electric propulsion ship design. Therefore, this paper introduces the comprehensive design of DC shipboard power system for pure electric propulsion ship based on battery energy storage system (BESS). To design and configure the pure electric propulsion ship, 2 MW propulsion car ferry was assumed and adopted to be the target vessel in this paper. In order to design the overall system, a series of design processes, such as the decision of the ship operation profile, BESS capacity selection, configuration of the power conversion systems for propulsion, battery charging/discharging procedures, classification of system operation modes, and analysis of the efficiency, were considered. The proposed efficient design and analysis of the pure electric propulsion ship was qualitatively and quantitatively validated by MATLAB Simulink tool. The methodology presented in this paper can help design real ships before the system commissioning.

1. Introduction

Currently, about 90% of international import and export cargoes rely on international shipping, and carbon dioxide emissions occurring in the maritime sector account for about 3.3% of greenhouse gas emissions [1,2,3]. Issues such as greenhouse gases, sulfur oxides, nitrogen oxides, and fine dust emitted by ships are emerging as environmental pollution problems [4]. Accordingly, the International Maritime Organization (IMO) is restricting greenhouse gas and air pollutant emissions by revising the Marine Pollution Treaty (MARPOL Annex VI) to strengthen international marine and air pollution regulations [5]. The IMO has implemented greenhouse gas reduction regulations since 2013 and aims to reduce greenhouse gas emissions by 30% by 2025 compared to the present in stages [6]. The operation of ships that are not equipped with technologies to reduce greenhouse gas emissions will be fundamentally blocked by the IMO’s greenhouse gas regulations, and the demand for eco-friendly ships and related equipment is expected to expand further with the introduction of various environmental regulations. As an alternative to the regulations, there is an integrated power system (IPS) that integrates and operates propulsion power and auxiliary power. The design and operation of IPSs has the advantage of being able to significantly reduce air pollutant emissions while increasing energy efficiency [7,8,9,10]. In the past, mechanical propulsion systems using diesel engines or gas turbine engines, which are internal combustion engines, were applied. However, since noises and vibration increase, and fuel efficiency is lowered under the conditions where the load factor of the internal combustion engines for propulsion is lowered in the case of mechanical propulsion systems as such, the fuel efficiency should be improved, and the exhaust gases should be reduced. In addition, as the size, speed and power load of ships increase rapidly, the need for electric propulsion technology for ships applying an integrated electric propulsion system capable of supplying large-capacity power is gradually increasing [11]. The electric propulsion methods can be largely divided into diesel-electric propulsion, pure electric propulsion, and hybrid electric propulsion depending on the power source, and studies on pure electric propulsion ships intended to save energy on board and increase cost efficiency are in the limelight [12,13,14].
Electric propulsion by batteries is an eco-friendly operation method that does not generate exhaust gases [15,16], and it can increase energy efficiency by supplying temporary power or storing regenerative energy using the characteristics of batteries that can be charged/discharged. When designing a system, the performance, volume, weight, and price of a battery should be considered as important factors, and the optimal design considering other power conversion systems (PCSs) as well as batteries should be possible. Many comprehensive studies have been conducted to design a pure electric propulsion ship, in academia as well as in industry. Table 1 shows the representative and conventional studies on the design of electric propulsion ship which are relative to this paper. This table introduces the major elemental technologies and their specific design elements, in terms of the related works and the relevance to this paper. It is necessary to establish a guide line for the overall electric ship design in reference to the related works.
Therefore, in this paper, a method of design through the design of the battery capacity for application as the power source of pure electric propulsion systems and the analysis of the efficiency of major equipment units according to the time-variant power distribution and the system structures was proposed. Furthermore, the integrated MATLAB simulation was performed by establishing DC distribution system and its operation modes.
The target vessel of this paper was assumed to be a 2 MW propulsion car ferry that operates round-trips between land and an island, and the detailed specifications were assumed referring to the specifications of the world’s first electric propulsion ships, the MV Ampere and the Future of the Fjords. The battery model provided by MATLAB was used to design the capacity of the Battery Energy Storage System (BESS) applied as a power source for the target vessel, and lithium-ion batteries that have high energy density and low self-discharge were applied [17]. Therefore, the aforementioned analysis of the system design requirement is described in Section 2.
There are two types of power distribution methods for electric propulsion systems: AC distribution and DC distribution; the DC distribution method is attracting attention due to the recent development of power electronics technologies and power conversion systems [18]. Compared to the AC power distribution method, the DC distribution method has the advantages that energy efficiency can be improved as its loss due to power conversion and line loss are small and that fuel consumption is reduced thanks to its optimal operation of the genset [19]. In addition, it also has the advantages that power conversion efficiency can be improved and that the control is simplified because an additional power conversion device becomes unnecessary thanks to the direct connection of an energy storage system (ESS). Therefore, the DC power distribution method has the advantages of low transmission loss, space and weight reduction, and flexibility in the arrangement of electrical equipment [20,21]. In Section 3 of this paper, the system configuration method for the target ferry is proposed based on the DC distribution, and operation modes are also established by accident situation.
In Section 4 of this paper, the analysis of the efficiency of the system components using MATLAB Simulink is described. Reflecting the propulsion speed and torque profile of the target vessel, a simulation of motor propulsion was performed for one of the two propulsion axes. In the case of a pure electric propulsion system, the analysis of the efficiency of ship components according to the charging/discharging sequence of the battery acting as a power source should also be conducted, and in the case of the inverter for propulsion, the average model was used to calculate the loss. The loss was derived based on one round trip, and when designing the actual system, the battery capacity should be designed with a larger margin reflecting the loss.
Table 1. Conventional studies on the design of an electric propulsion ship.
Elemental TechnologiesSpecific Design ElementsRelated WorksExplanatory NoteRelevance to This Paper
Extraction of ship operation profileFerry operation profile[22,23]-++
Load profile[22,24]-+++
BESS designBESS capacity[8,24,25]without system loss consideration+++
BESS equivalent circuit modelling[22,23,26,27,28,29,30,31,32]Ref. [22] with battery degradation modelling+
SOC estimator[22,33,34]-×
DC distribution designPower conversion system[13,21,35,36]Ref. [21] with transient and steady-state consideration+++
Propulsion motor[8,37,38,39]-++
Efficiency analysisEquivalent loss modelling[40,41]without pure electric propulsion ship consideration+++
Development of overall system simulationNon-real-time simulation[13,23,36]without instantaneous loss consideration++
Real-time simulation[35]-×
Degree of relevance: high (+++), intermediate (++), weak (+), unrelated (×).

2. Analysis of System Design Requirements

2.1. Selection of a Target Vessel for the Calculation of the Required Propulsion Power

In order to calculate the power required for the propulsion of the 2 MW-class target ferry, the MV Ampere and the Future of the Fjords, which are representative pure electric propulsion ships, were referred to. The target vessel used in this study was assumed to operate at a speed of up to 11 knots by operating two 900 kW class motors. In addition, in order to select the operation profile of the target vessel, the operation profile of an actual car ferry with similar vessel specifications was referred to. Table 2 shows the operation profiles by section of the target vessel. The target vessel in this paper operates a distance of 2.7 nautical miles between land and the island at speeds up to 11 knots. The power required for propulsion during operation is 1740 kW, and the auxiliary load used in the ship is 150 kW. In this case, the sailing time between land and the island is 15 min for one-way. After finishing sailing from land to the island, the vessel anchors on the island for about 15 min, and at this time, the power required for propulsion and aux. loads of the vessel are 3.3 kW and 150 kW, respectively. For simplicity of the discussion, the propulsion power (3.3 kW) during island anchoring was omitted in the simulation. After finishing a round-trip operation, the target vessel anchors on land and takes about 75 min to recharge the BESS.
The propulsion RPM and vessel speed according to the operation profile of the target vessel were implemented using MATLAB, as shown in Figure 1. In this paper, as shown in Figure 2, it was assumed that the vessel operates at a rated speed of 11 knots 30 s after the start of acceleration. If the speed is accelerated by rapidly increasing the RPM at the start of the operation, instantaneous overcurrent will occur, and this will lead to an unnecessary system price increase when designing the electrical system. Therefore, limiting the operation profile within the allowed limit is reasonable. Therefore, the load profile was derived applying the optimal operating speed and RPM that can reduce the fuel consumption of the target vessel.
The load profile of the target vessel was calculated reflecting the operation profile as shown in Figure 3. When the vessel operates in a section for a round trip between land and the islands, the total power consumption is 1890 kW, which is the sum of the power required for propulsion 1740 kW and the auxiliary load 150 kW. In the section for anchorage on land, the power consumption is 0 kW because there is no power consumption due to the power required for propulsion or auxiliary load. After a round-trip operation ended, the vessel has a recharge time of at least 1 h (about 75 min). The maximum propulsion power is 1740 kW, and it was assumed that 150 kW would be consumed as the auxiliary power during operation and loading and 0 kW would be consumed during charging.

2.2. Simulation of the Propulsion Motor of the Target Vessel

The propulsion of the target vessel in this paper, requires a large torque at low speed as shown in the operation profile. As a reference for the foregoing, the 1.7 MW-class electric motor can be cited as an example [37]. However, when the propulsion FFX-II EPM is applied, although high torque can be generated at low RPM, it is difficult to secure system parameters. Therefore, in this study, the simulation was carried out based on the 2.5 MW motor, which has been actually fabricated. Table 3 shows the specifications of that motor.
The simulation of the propulsion motor of the target vessel was performed applying the parameters shown in Table 3. A gearbox (1:10) for the implementation of low RPM and high torque was applied, and a simulation of one of the two propulsion axes was carried out.
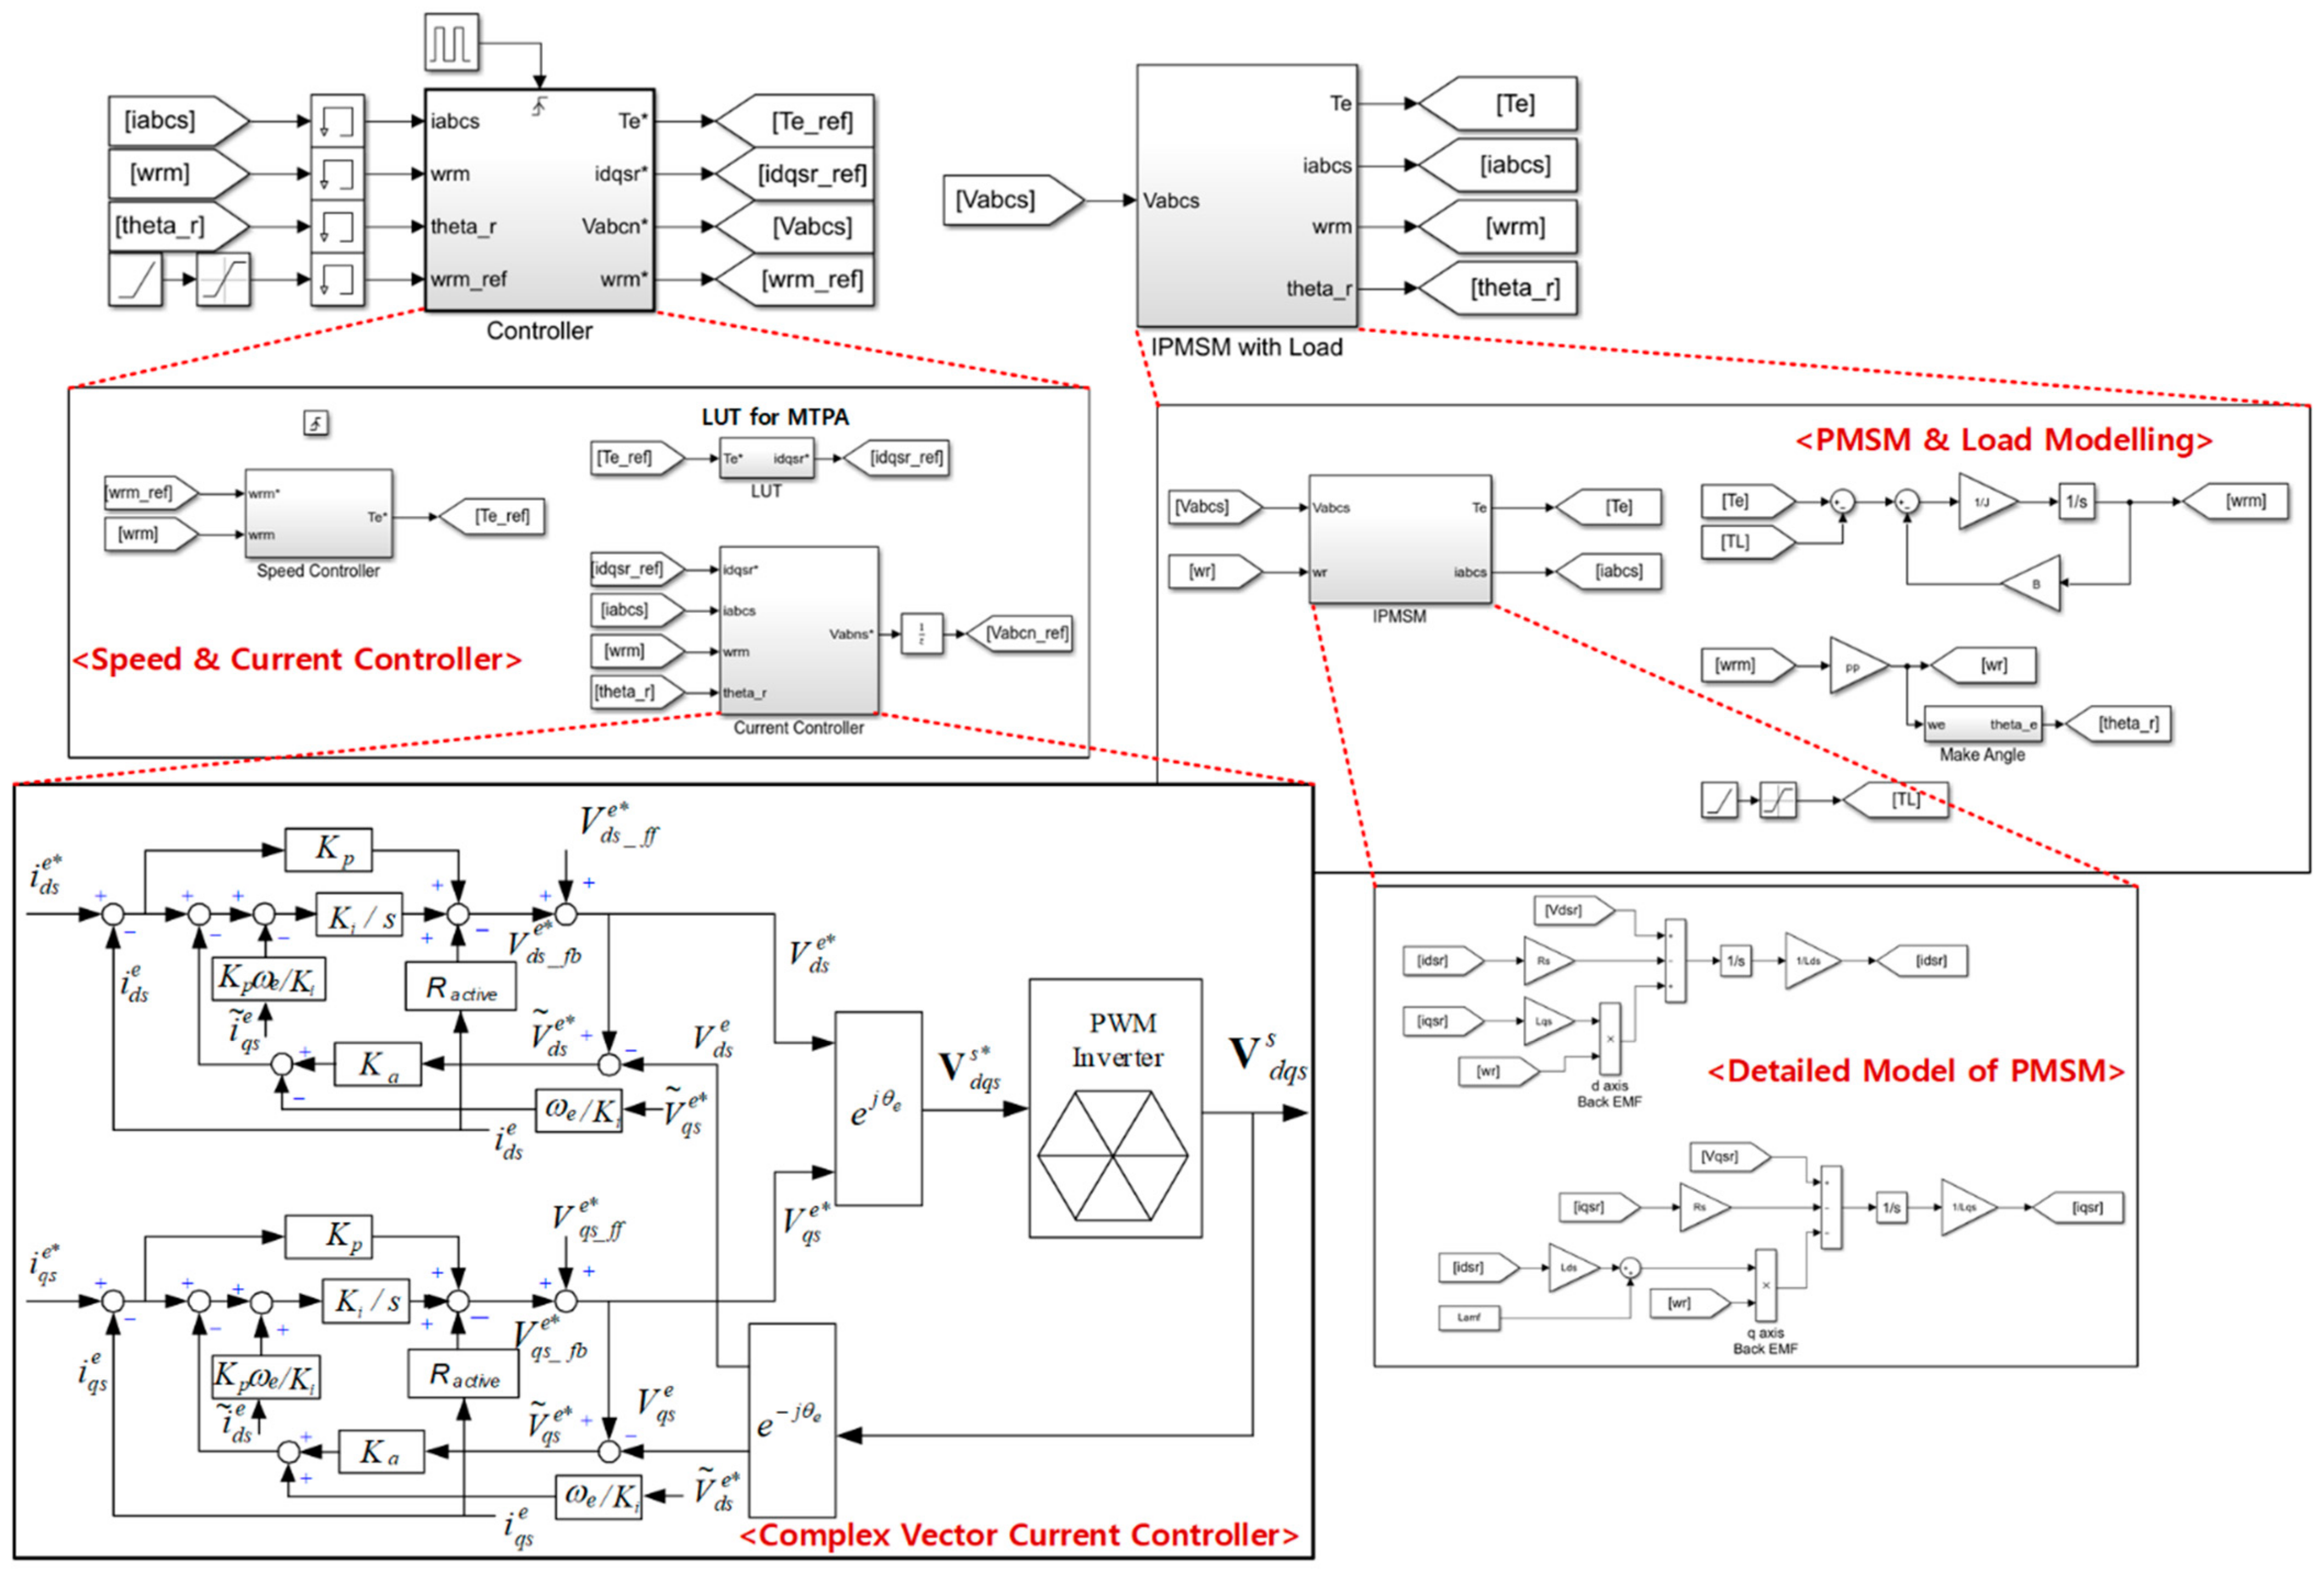
The MATLAB SIMULINK-based propulsion simulation is as shown in Figure 4. The simulation consists of the control unit including the speed and current controllers, and the power unit, including the permanent magnet motor and the load torque part. The speed controller receives the command value to output the torque command, and the current command according to the relevant torque was generated using MTPA (Maximum Torque Per Ampere) for maximum efficiency point operation.
The current controller was configured as a complex vector current controller, which receives current commands as inputs to generate inverter voltage commands. The voltage command of the inverter goes into the power unit, but the switching model of the inverter was omitted, and the controller was configured so that the voltage command goes into the input voltage of the permanent magnet synchronous motor (PMSM). The result of the propulsion simulation shown in Figure 4 is as shown in Figure 5, and the configuration of the propulsion inverter was proposed based on this simulation result.
It was assumed that one of the two propulsion axes would be started, and about 1 MW of propulsion was simulated. As a result of the simulation, in the case of propulsion of about 1 MW, the motor has a current of 2126 A at the maximum. Therefore, if the inverter is assumed as a 2-level IGBT-based inverter with a DC link voltage of 1000 V, it is reasonable to operate the motor with two inverters per one axis. In the case of a three-phase motor that will be configured with the inverters for propulsion as such, parallel operation of the inverters must be implemented, and this is addressed in Section 2.3.

2.3. Configuration of the Inverter for Propulsion of the Target Vessel

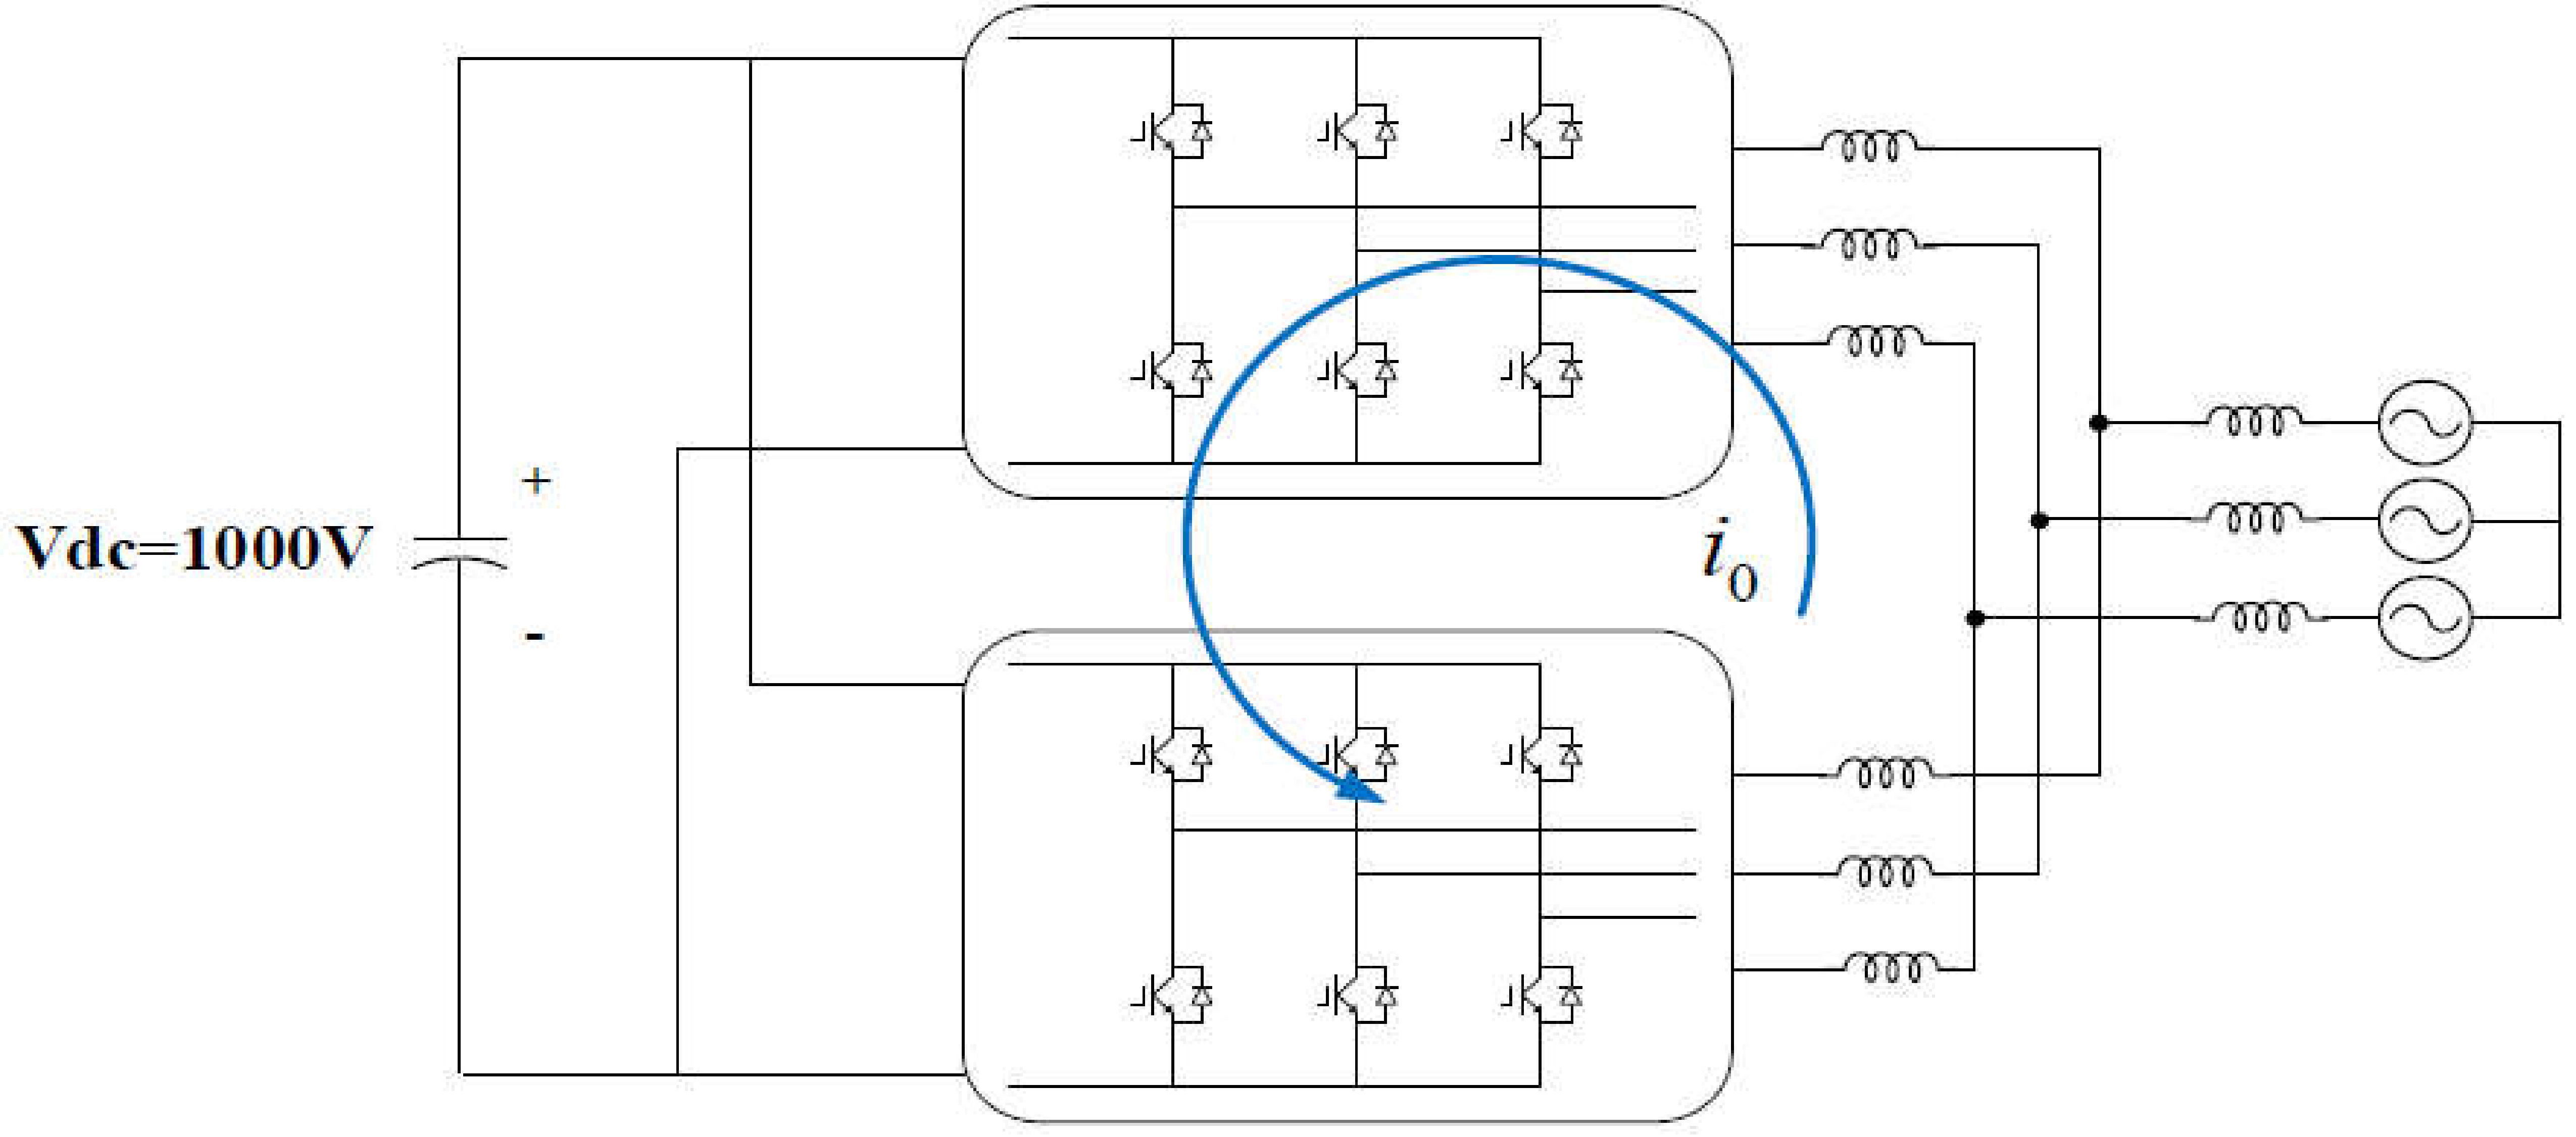
When designing based on 2.5 MW class motor, if it is assumed that the DC link voltage is 1000 V and the AC rated voltage is 690 V, a power conversion device can be configured using two-level parallel inverters as shown in Figure 6. According to the results of the simulation of the propulsion motor, parallel operation of two inverters is required to configure the electric propulsion system of the target ship. When designing a system with two-level inverters per axis in two parallel configurations, the system can be designed in a structure where multiple half-bridge inverters are connected in parallel. The system was configured so that three half-bridge inverters constitute one three-phase inverter, and two of these three-phase inverters generate an output power of 1 MW. Parallel operation has the advantage that the reliability of the system can be improved by connecting multiple single half-bridge inverter modules in parallel so that they are operated as if one large inverter is operated and designing the system to have spare modules so that when one inverter breaks down, another inverter can be operated normally. Parallel operation is also advantageous for productivity, maintenance, and mass production through module manufacturing, and if applied to light-load operation conditions, parallel operation has the advantage that the loss at light loads can be reduced, and the efficiency can be improved by adjusting the number of inverters operated [42]. In addition, power quality improvement can be expected in the case of interleaving operation as the output voltage and current ripple are reduced. However, since circulating current ( i 0 ) inevitably occurs due to the mismatch of the switching state, parallel operation can cause the distortion of the output current and system loss without controlling the circulating current. Therefore, efforts to reduce losses are necessary such as reducing the circulating current through control [43].

2.4. Design of Battery Energy Storage System Capacity

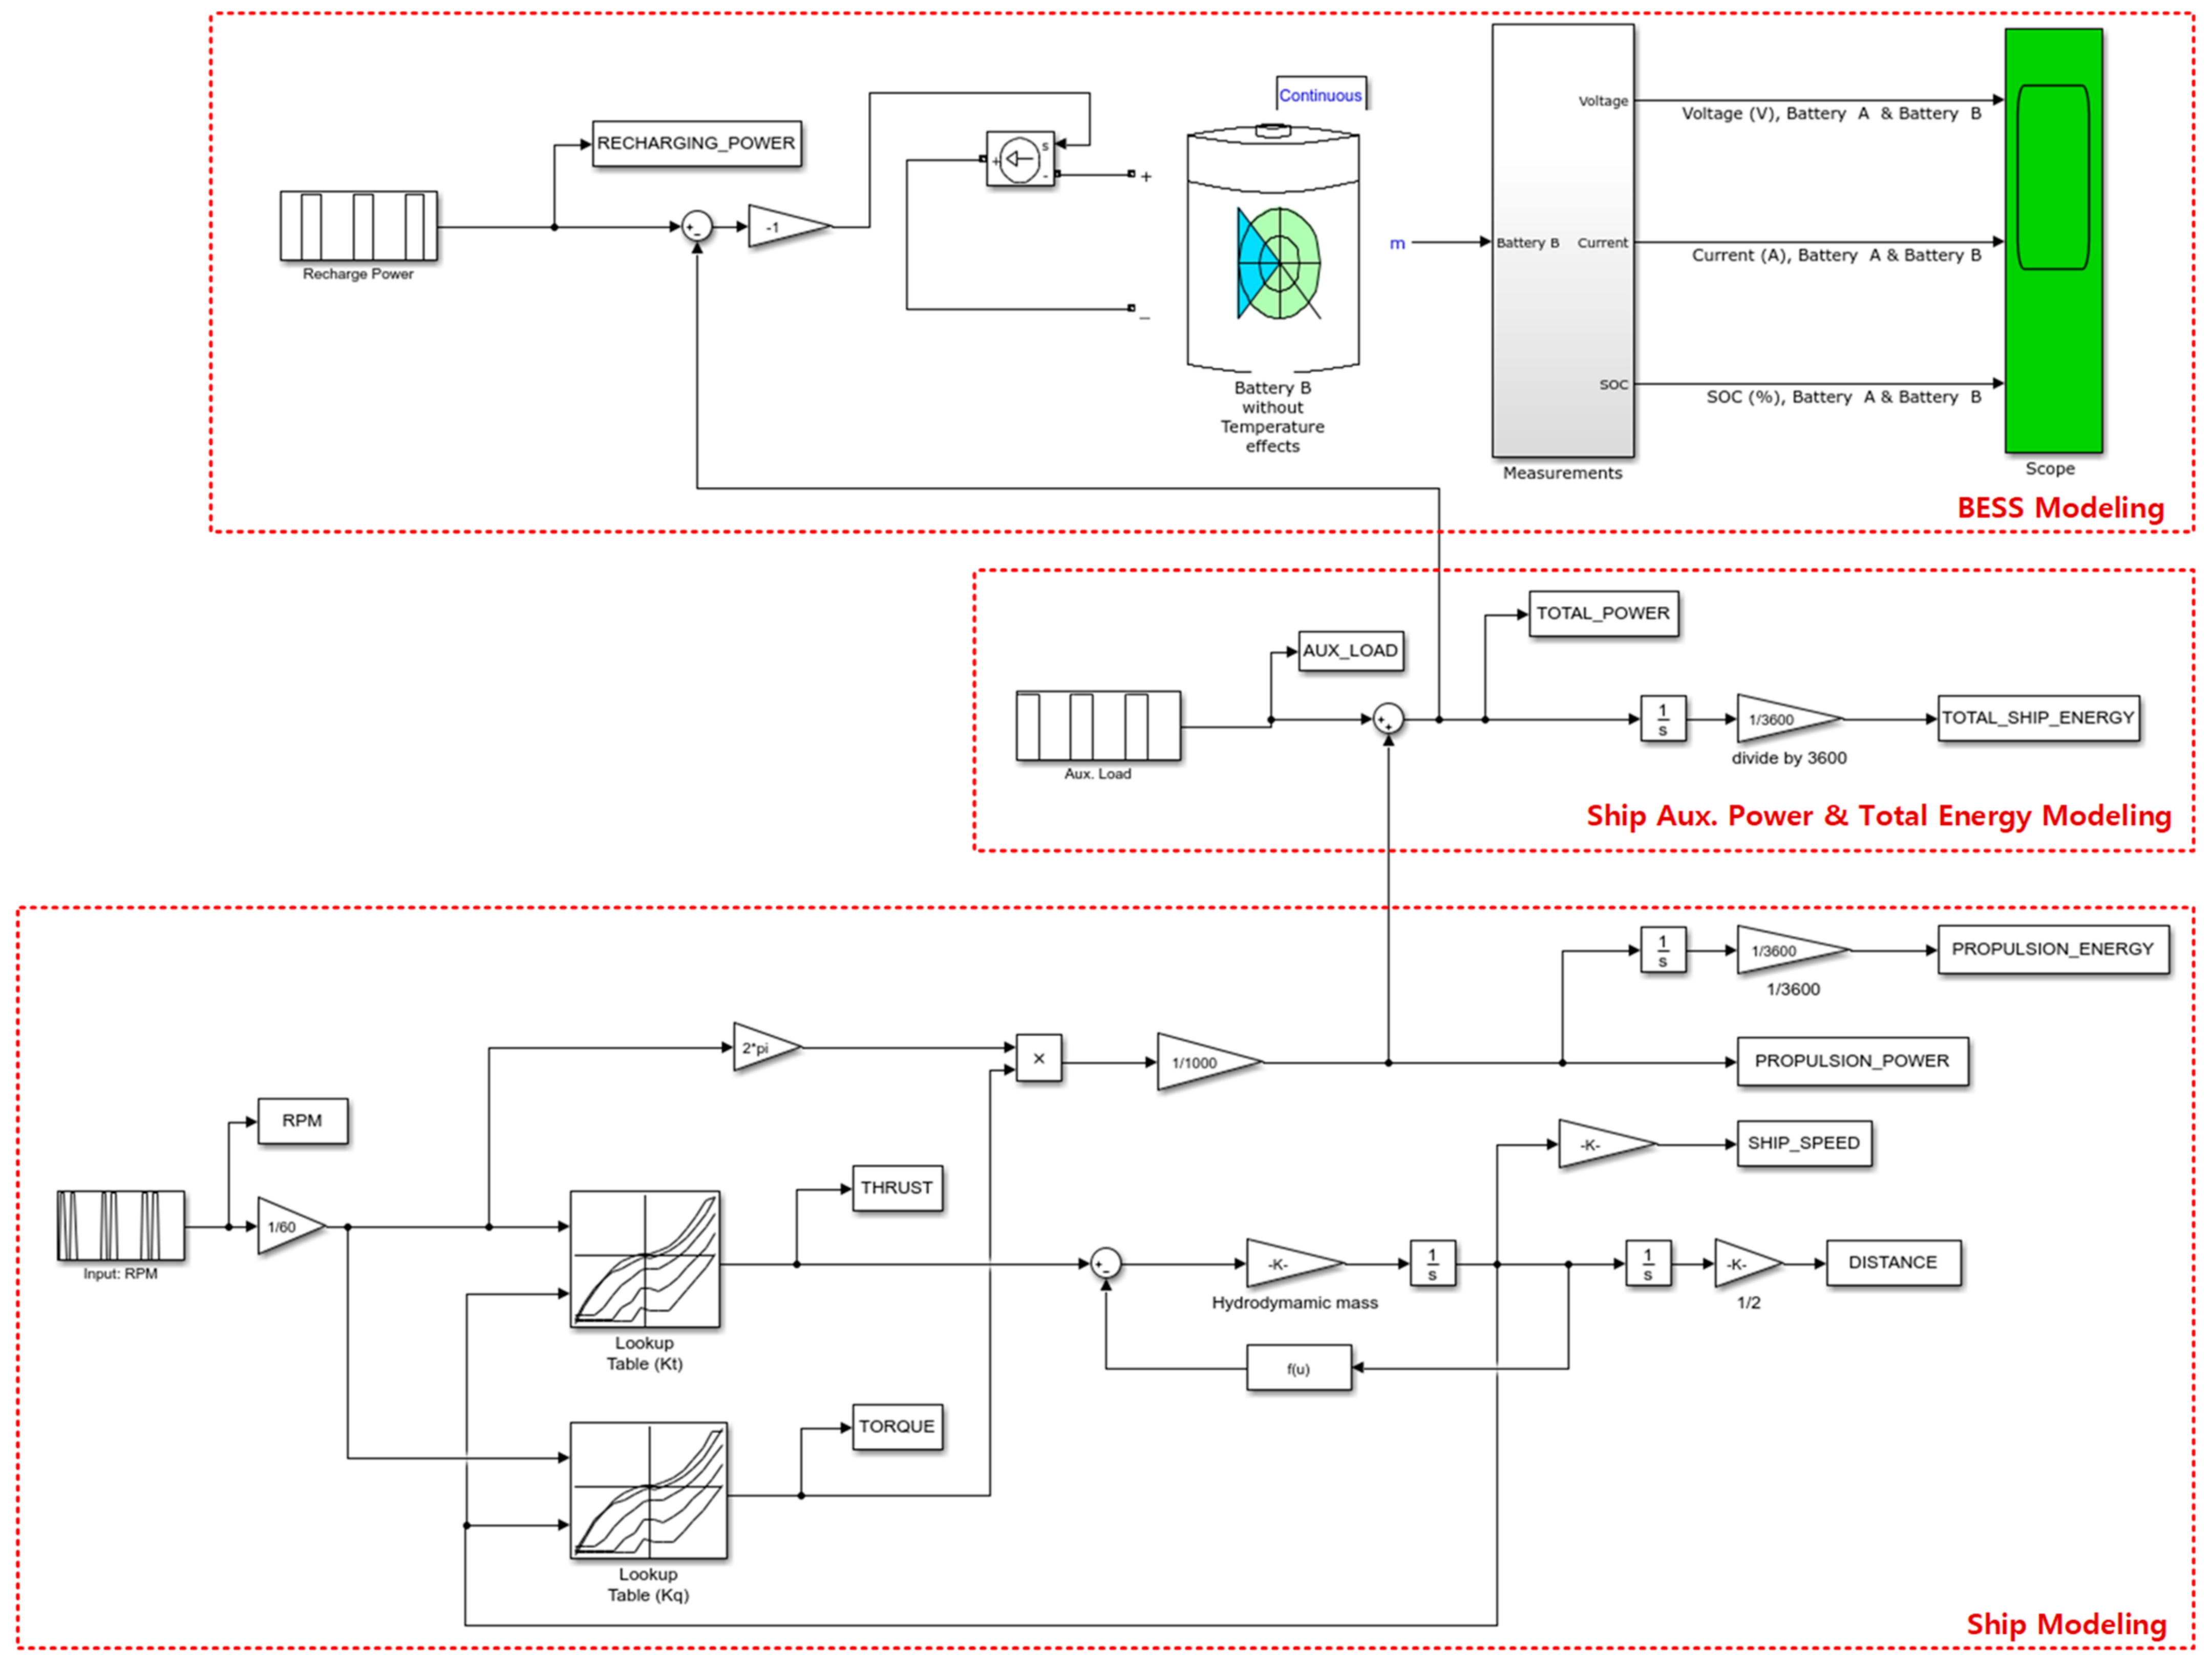
For the design of the capacity of the BESS applied as the power source of the target vessel, the BESS was simulated with MATLAB SIMULINK as shown in Figure 7. The required propulsion was calculated reflecting the operation profile, and the total energy consumed by the vessel was calculated by adding the auxiliary loads used on the vessel. During the time when charging is possible, the battery is charged by as much as the power that is consumed in one voyage.
The simulation implemented BESS modeling using the battery model provided by MATLAB, and the detailed specifications of the battery are as follows [29,30,31,32], provided that, the initial condition of SOC is set to 80–90% according to the recommendation of the battery manufacturer.
  • Battery Type: Lithium-Ion;
  • Nominal Voltage: 1000 [V];
  • Rated Capacity: 1800–2500 [Ah];
  • Initial SOC: 80–90%.

2.5. BESS Charge/Discharge Profile According to Operation

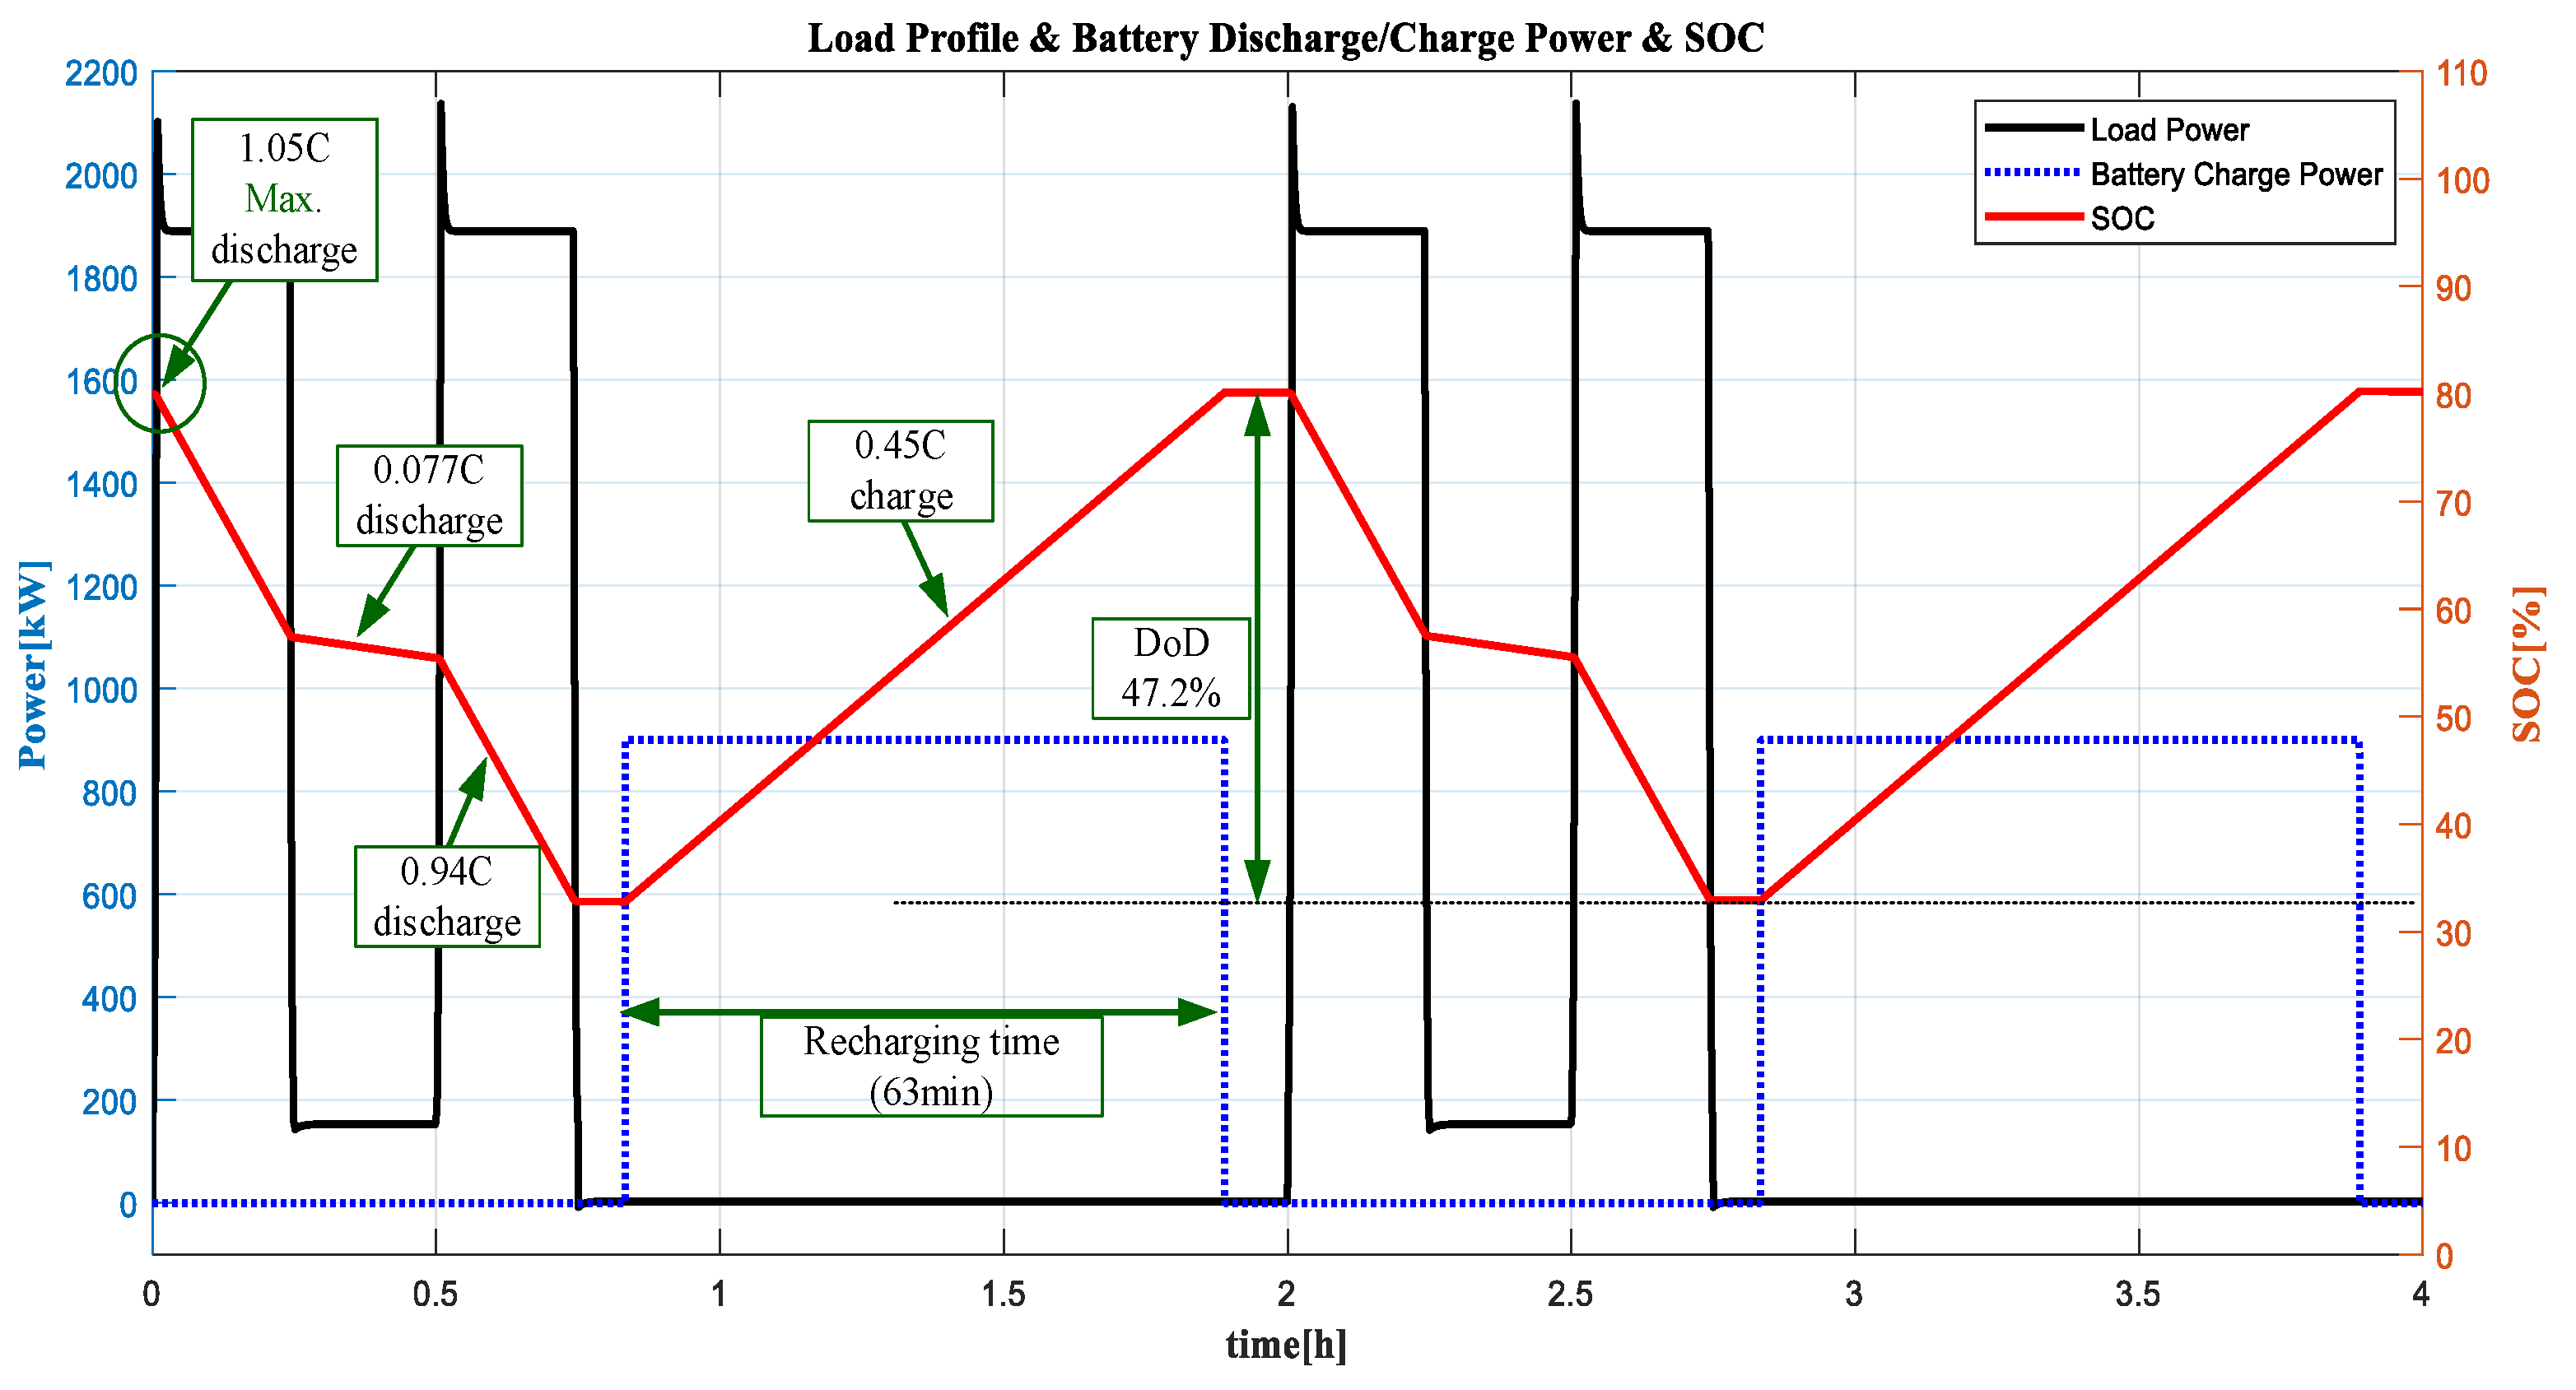
The target vessel consumes 1740 kW for propulsion and 150 kW for auxiliary load when operating at 11 knots, and 150 kW for auxiliary load when anchored. The total load for one round trip operation calculated is about 980 kWh. When the battery capacity is designed as 2 MWh according to the operation profile, the DoD discharges at a discharge rate of 47.2%. In this case, the SOC of the battery is adjusted to 30–90% to protect it from over-charge and over-discharge [44]. The capacity of the battery was selected in consideration of DoD and C-rate when the initial charging capacity was assumed to be 80%.
Figure 8 shows the charge/discharge profile of the BESS according to the operation of the target vessel. The BESS is discharged at a discharge rate of 1.05 C during the operation between land and the island and is charged at a rate of 0.45 C when the vessel is anchored on land. It was identified that the charging time in this case was 63 min. The temperature of lithium-ion batteries rises rapidly when operating under operating conditions of overcharge or over-discharge. Therefore, heat generation due to rapid charging/discharging of the battery should be considered without fail when the BESS is actually applied because it affects the lifespan of the battery pack [45,46].

2.6. BESS Design According to the Charge/Discharge Profile

Lithium-ion batteries, which have excellent energy density, are one of the most widely used batteries. Although the development of battery miniaturization technology and cathode materials with high energy storage efficiency have achieved great results, the amount of energy that can be stored in one cell is limited. Therefore, when using batteries in actual systems, multiple cells are connected in series and parallel to form and use battery packs to fit the voltage, current, and capacity required by each system [46]. The lithium-ion cells used in the battery system pack configuration are made using an active material called Li-NMC (Lithium Nickel Manganese Cobalt Oxide), which is mainly used in applications such as ESS and EV. These cells have nominal voltages of 3.6~3.7 V and are designed in the configuration of 2P-252S (2 parallel and 252 series). The voltage range of the cells is 3.0 to 4.2 V and that of the battery pack is 756 to 1058 V. Assuming the design life of the battery system as 10 years, in order to design a system with a capacity of 2.0 MWh, 16 battery packs with 124 kWh/pack are connected in parallel.

3. Design of a High-Efficiency Eco-Friendly Integrated Power System

3.1. Proposal of a System Configuration Method

In Section 2.4 and Section 2.5, simulations were carried out using the battery model provided by MATLAB to design the capacity of the BESS, which is applied as the power source of the target vessel. Considering the required load energy according to the operation profile of the target vessel, the capacity was calculated as 2 MW based on lithium-ion batteries. Accordingly, the DC/DC converter for the purpose of voltage regulation during battery charging/discharging has a capacity of 1 MW per axis. The target vessel obtains propulsion by operating 900 kW motor per one axis, and the inverter connected to the motor and operating as a variable frequency drive (VFD) has a capacity of 1 MW in this case. As such, the capacities of the main equipment units were selected according to the capacity of the battery, and based on the foregoing, a system configuration method was presented in this section. In addition, based on MATLAB SIMULINK, the loss models of the main components of the power distribution system were simulated to analyze the efficiency of the main components according to the battery charge/discharge sequence.
An electric propulsion vessel is an integrated power system that integrates and operates power generation, power conversion, and distribution systems. In this paper, the DC distribution structure of the pure electric propulsion system is proposed. In addition, a DC distribution method, which has the advantage of low transmission loss, enabling space and weight saving, and flexibility in the arrangement of electrical equipment units is proposed. In the proposed DC distribution structure, a solid-state circuit breaker (SSCB) is applied to the bus tie to cope with failures and battery accidents. This is to prepare for safety and enable emergency operation in the event of an accident in the battery, which serves as the power source of the electric motor that generates propulsion. Figure 9 shows a schematic diagram of the proposed DC distribution structure, and the system operation method according to the configuration method is described in Section 3.2.

3.2. Establishment of System Operation Modes

Reflecting the operation profile of the target vessel, the operation modes were separately established for cruising, anchor, and shore. By establishing operation modes by situation, system stability and energy efficiency were increased, and the battery charge/discharge sequence and situations where fault currents occurred were considered and reflected. Battery charging is performed when the vessel is anchored on land, and the relevant schematic diagram is as shown in Figure 10. The shore operation mode means the target vessel’s BESS charging when anchored on land. In this case, the battery charging is carried out by receiving electricity from an alternative maritime power (AMP). The AMP is a device with which vessels anchored in the port is supplied with electricity from a power plant on land. It enables auxiliary loads to be supplied with power continuously. This has the advantage of preventing the emission of air pollutants such as sulfur oxides (SOx) and nitrogen oxides (NOx) that are generated when conventional ships use bunker fuel to generate electricity [47].
In the shore operation mode, the battery is charged by receiving 660 V with the AMP. When charging is carried out, the AC circuit breaker performs a closed operation and charges the battery through a power conversion system (PCS). In this case, the SSCB of the DC Bus performs a closed operation. The DC/DC converter manages battery charging and the prevention of over-charging.
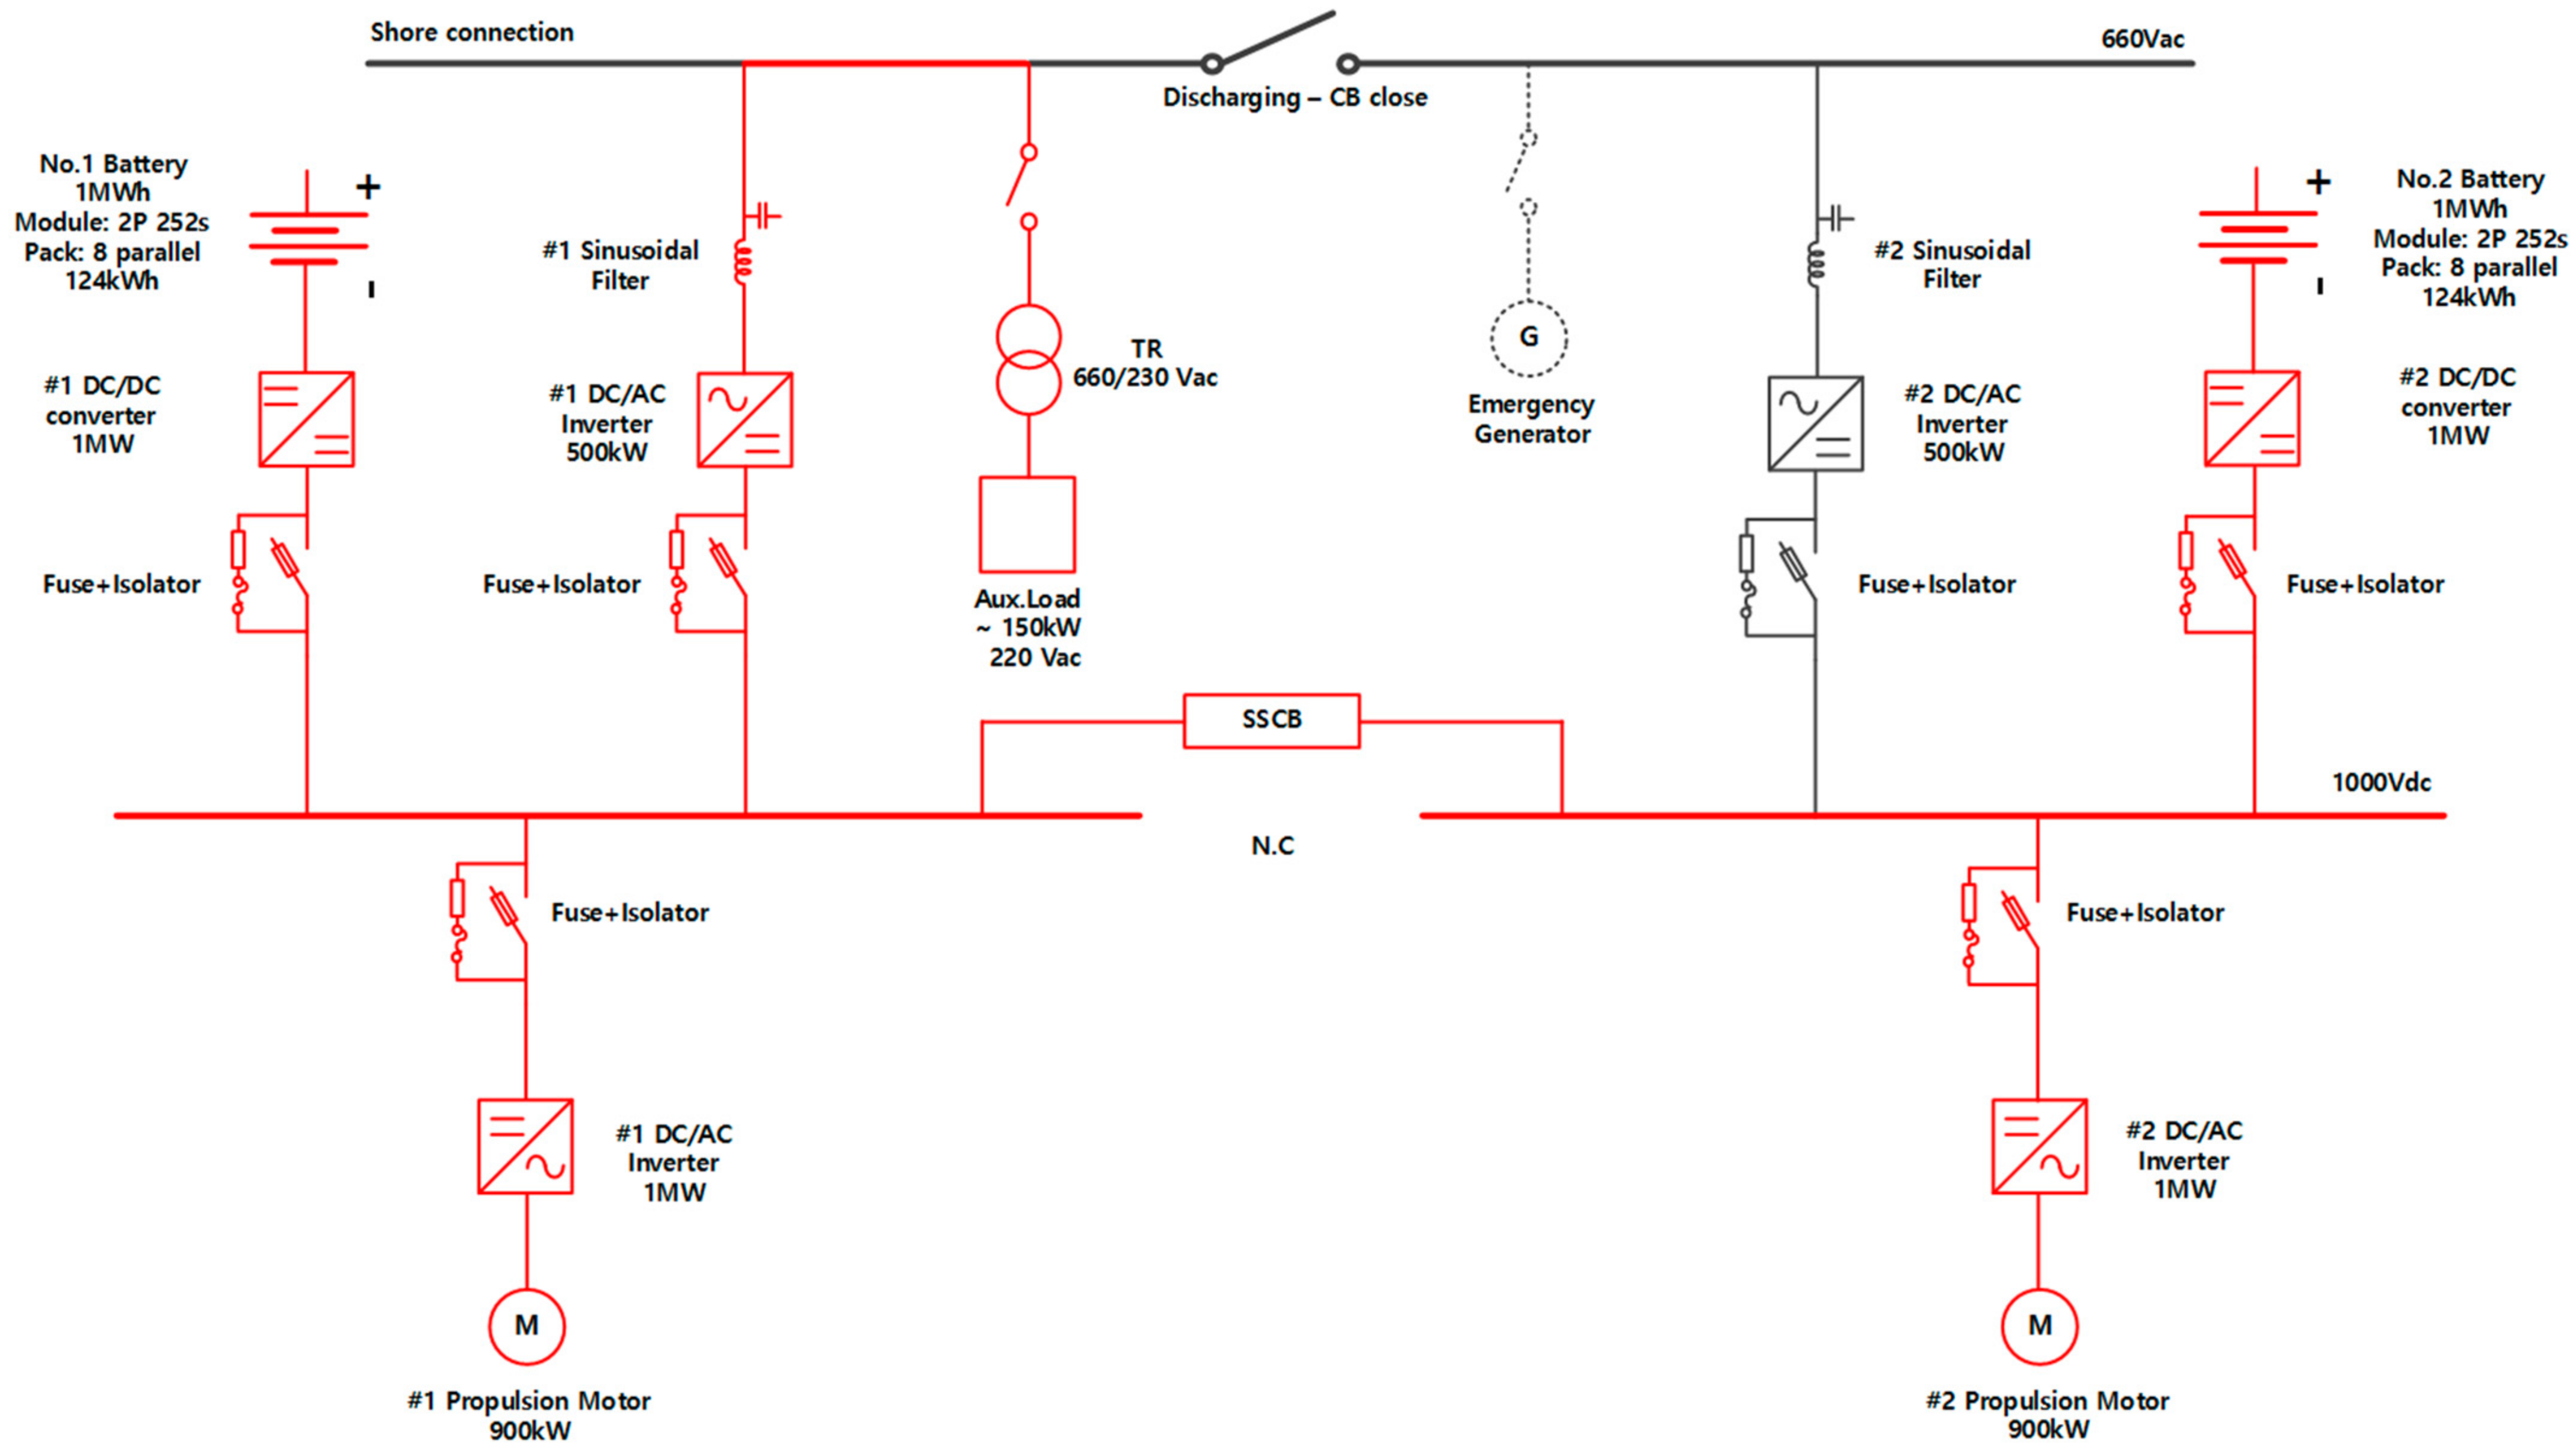
In the cruising operation mode, the battery is discharged by receiving the power required for the propulsion of the electric motor and the auxiliary load on board (Aux.load) from the battery acting as the power source of the propulsion. The auxiliary loads used on board include air conditioning loads, fan loads, and pump loads. The air conditioning loads have no direct effect on the vessel operation and are loads for the crew’s living environment, which are adjusted according to the outboard temperature. Room heating/cooling systems, ventilation systems, and lighting systems correspond to air conditioning loads [48]. When discharging is performed, the AC circuit breaker carries out open operation and the power loss occurring during discharging can be reduced by supplying the entire power from #1 and #2 batteries through SSCB, and not operating the #2 sine filter and #2 500 kW DC/AC inverter. Through the DC/DC converter connected to the batteries, both batteries become to consume the same energy. Figure 11 shows a schematic diagram of the battery discharge sequence in the cruising operation mode.
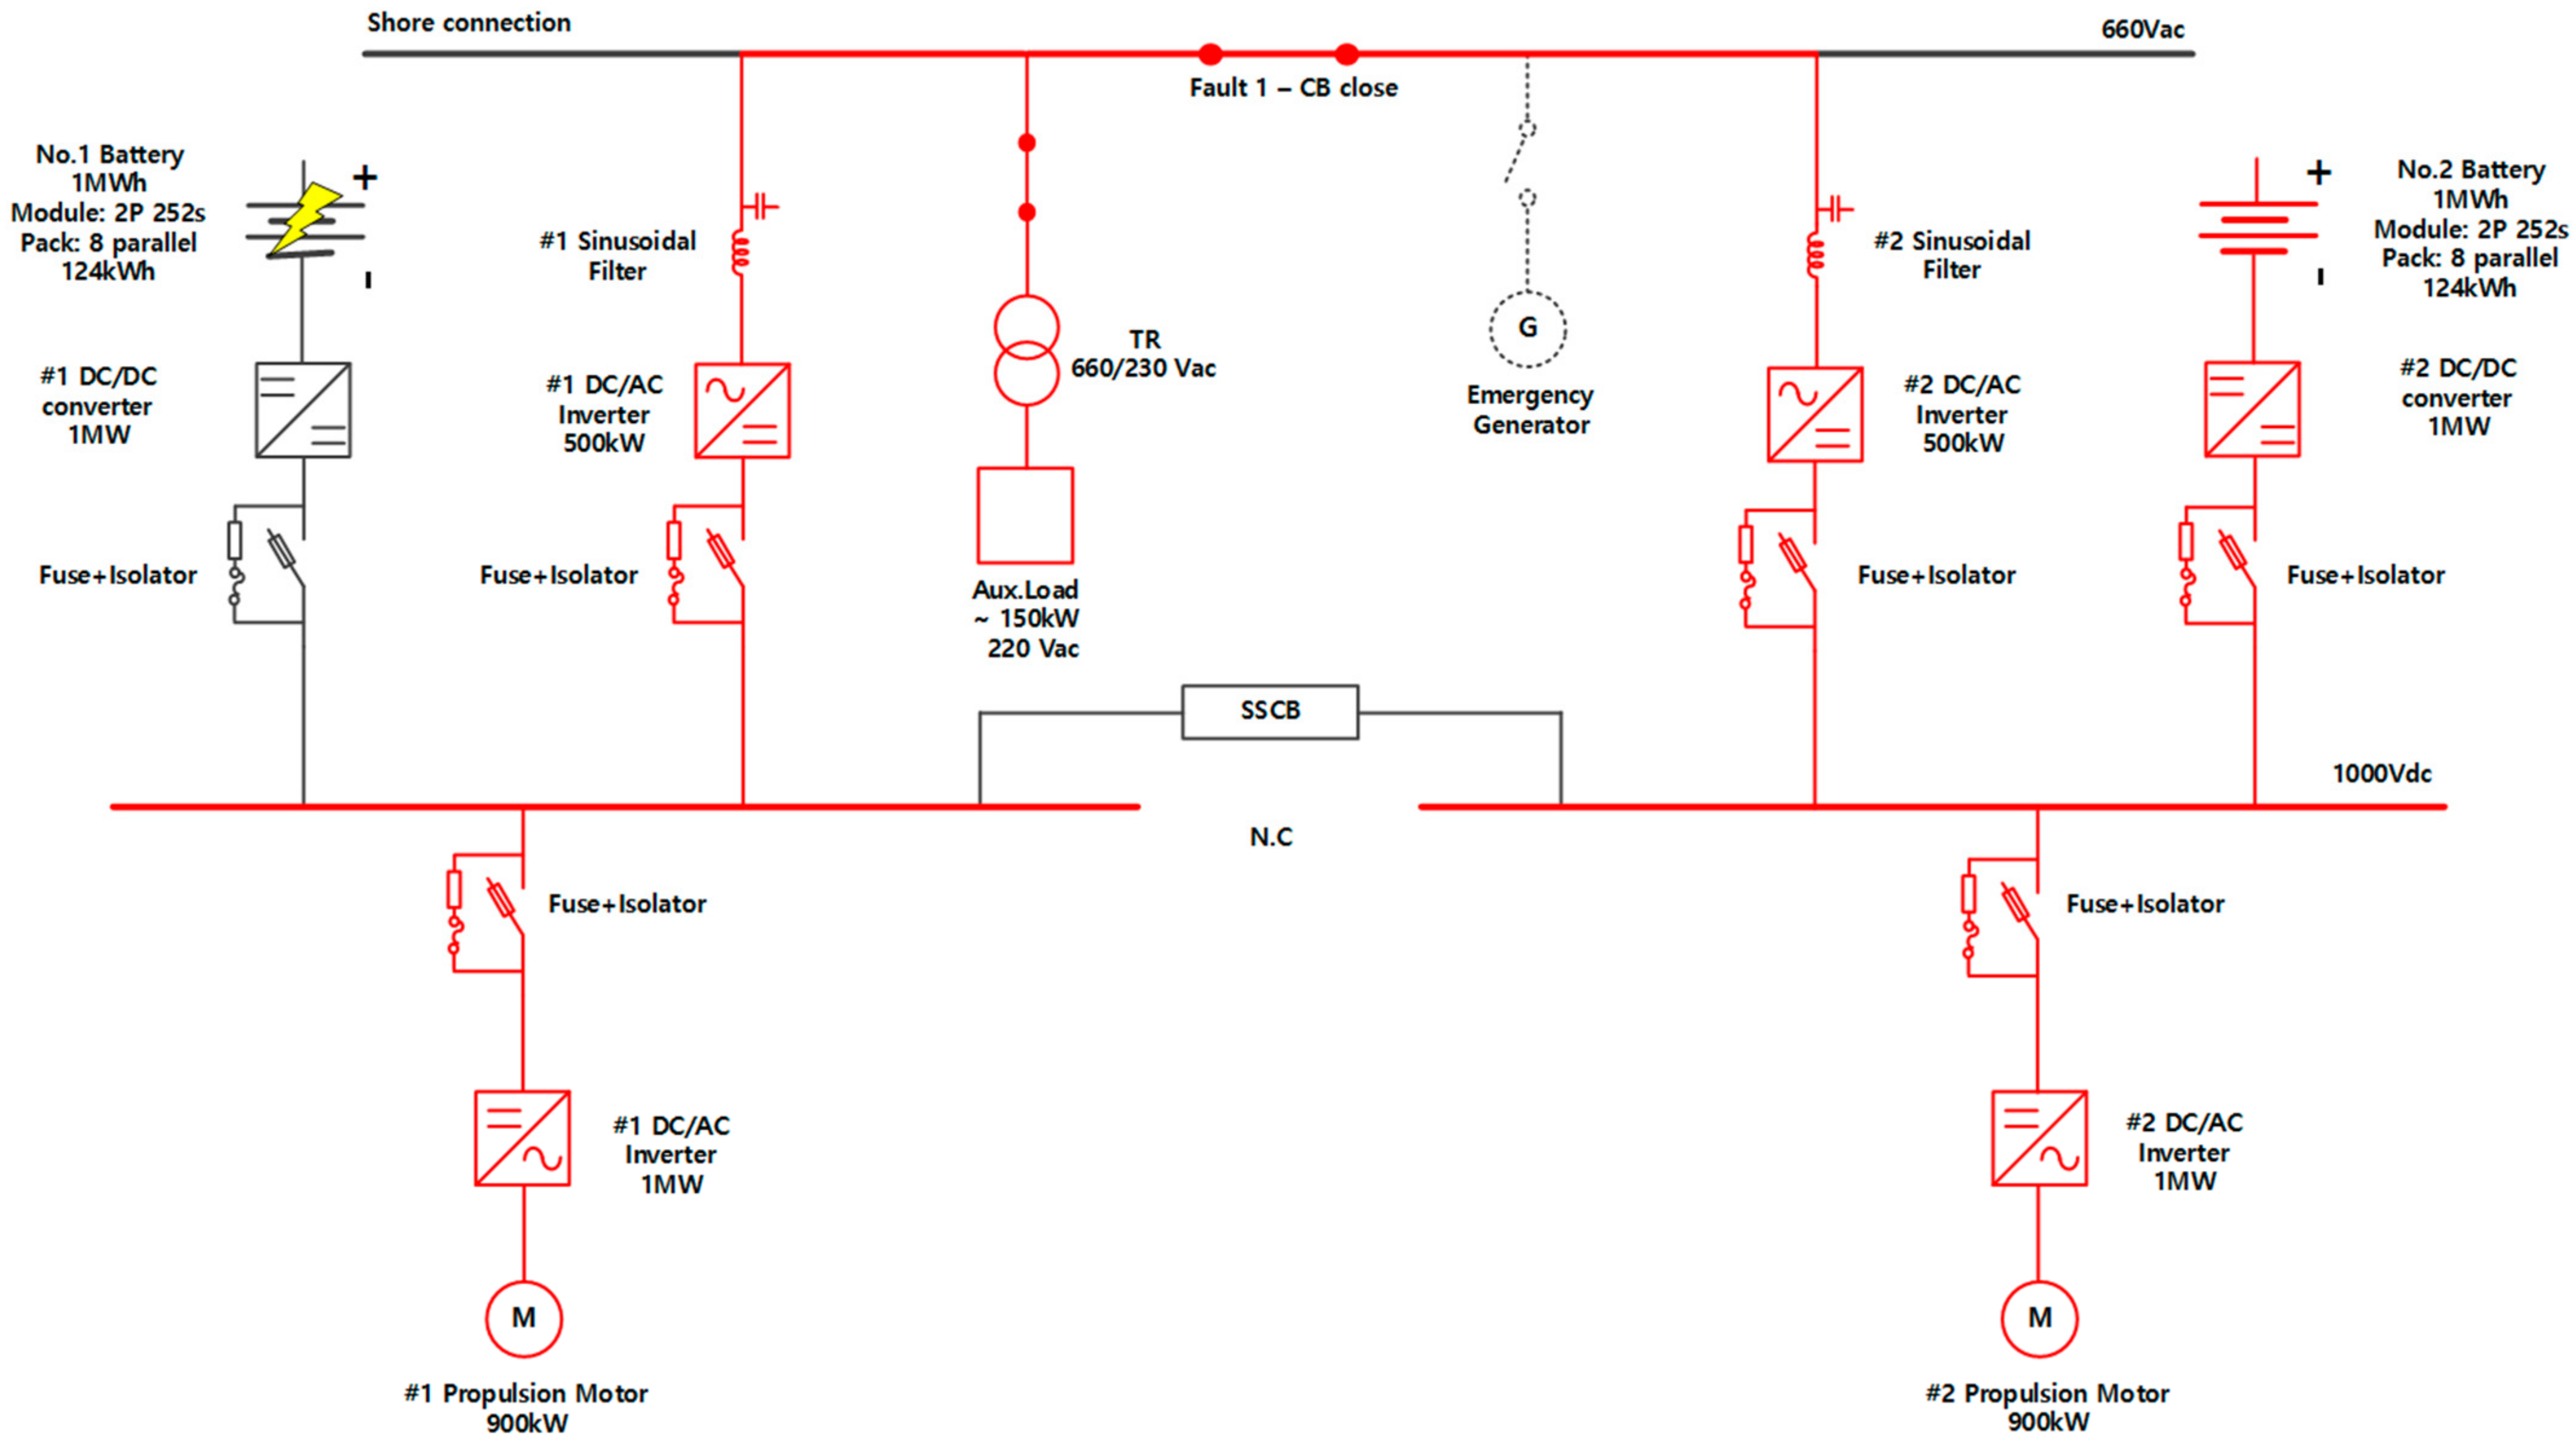
Figure 12 shows a schematic diagram of battery discharge reflecting a situation of a battery accident during operation. In Figure 12, a situation is assumed where when a No. 1 battery accident has occurred during operation, a fault current occurred, the SSCB detected the accident and carried out open operation thereafter, and the battery-side fuse was blown so that the fault current is completely cut off was assumed. Even in the event of an accident, the AC circuit breaker in the 660 V bus tie operates close for the normal operation of the vessel so that No. 2 battery supplies power to the two axes of the motor and the auxiliary loads on board. In this case, an emergency generator can be additionally operated to supply power together with a No. 2 battery. When an accident with the same condition has also occurred in a No. 2 battery, power can be supplied while maintaining a similar sequence.
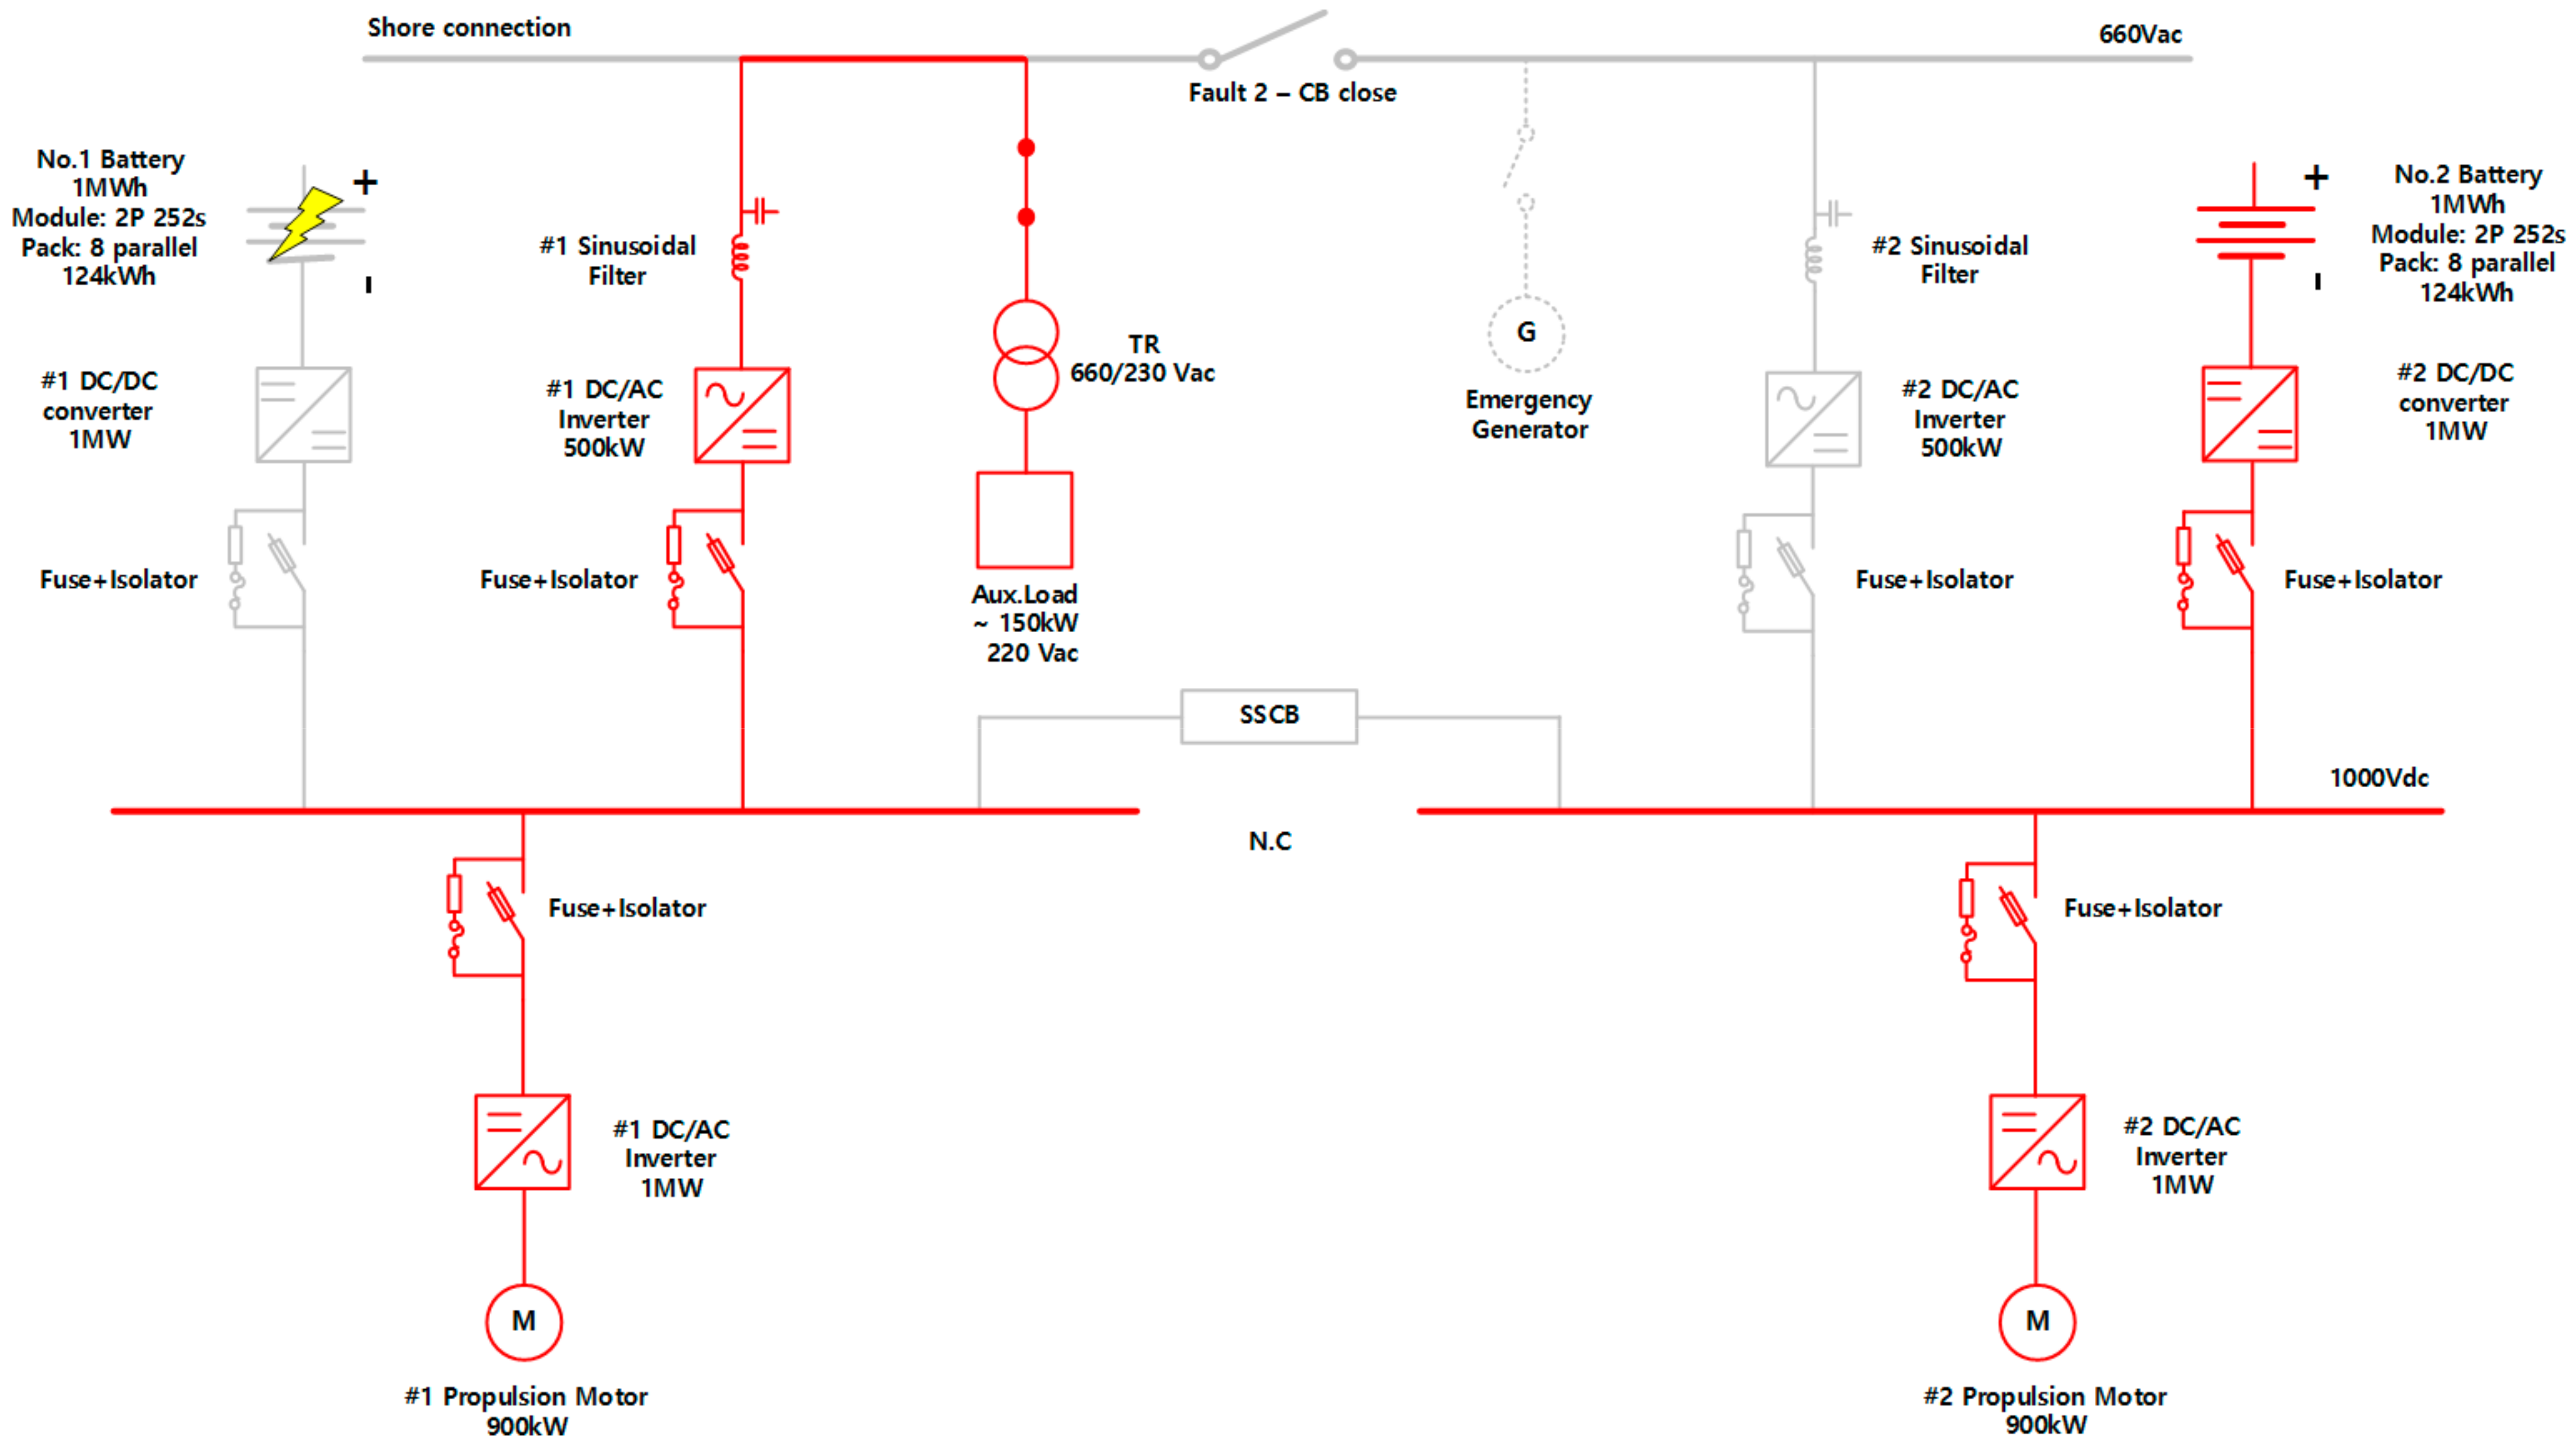
As shown in Figure 13, a situation where when a battery accident has occurred in the No. 1 battery, the fuse was blown so that the fault current was completely cut off while the current and voltage within the rated range were maintained. Such a case mainly occurs when the point where the accident occurred and the SSCB are far away in distance. Since the SSCB operates normally, No. 2 battery supplies power to the two axes of the motor and the auxiliary loads on board through the SSCB. In this case, since only the #1 or #2 sine filter and the 500 kW DC/AC inverter operate, the power loss is reduced compared to the Fault 1 situation assumed earlier, as shown in Figure 12. In this case, an emergency generator can be additionally operated to supply power together with No. 2 battery. Identically to the situation of Fault 1, when an accident with the same condition has occurred in No. 2 battery too, power can be supplied by No.1 battery while maintaining a similar sequence.
Figure 14 shows the DC distribution structure, where two 1 MW DC/DC converters connected to the 1 MWh batteries were removed. The 1 MW DC/DC converter used for voltage balance at the DC bus terminal was removed by separating the two batteries by N.O (Normally Open) operating the DC Bus Tie. In this case, in the event of a battery accident, the SSCB or DC breaker can be used to transmit power from the normal battery to the two axes of the motor and the auxiliary load on board. In addition, the AC circuit breaker in the 660 V bus tie can be close operated to additionally transmit power through an emergency generator. However, since one battery deals with the auxiliary load on board in normal operation, problems that may occur due to battery energy imbalance should be considered. It can be controlled by selecting starting or non-starting of #1 and #2 DC/AC inverters depending on the battery SOC or its output voltage, but there is the disadvantage that the control is complicated.

4. Analysis of the Efficiency of a Pure Electric Propulsion Ship

4.1. Simulation of the Loss Model for a Pure Electric Propulsion Ship

Based on the proposed DC distribution system configuration method and the calculation of the capacity of major equipment units in the previous sections, a MATLAB and SIMULINK-based simulation of the electric propulsion of the entire system was constructed. The efficiency of the major equipment units was analyzed through the simulation.

4.1.1. Implementation of the Average Model-Based Converter Loss Model

In the case of the converter loss model, the average model was implemented through three processes [48].
(a) Nonideal half-bridge converter
As shown in Figure 15, the nonideal switch is composed of a transistor and a diode and was configured with a voltage drop component ( V d ) and a resistance ( r o n ) occurring in the conduction state.
(b) Nonideal half-bridge converter average model
An average model was implemented reflecting the tail current generated during transistor turn-off and the reverse recovery current generated during diode turn-off. In the nonideal half-bridge converter shown in Figure 15, the average output voltage ( V ¯ t ) on the AC side in one cycle when the AC side current ( i ) is positive can be obtained with Equation (1):
V ¯ t = 1 T S 0 T S V t ( τ ) d τ = 1 T S 0 t r r V t ( τ ) d τ + t r r d T S V t ( τ ) d τ + d T S d T S + t t c V t ( τ ) d τ + d T S + t t c T S V t ( τ ) d τ
where T S , d , t r r , t t c refer to the switching period, duty ratio, reverse recovery time, and tail current time, respectively. If Equation (1) is calculated for each section, the results can be expressed as in Equation (2), where Q r r , Q t c refer to the quantity of electric charge of the reverse recovery current and that of the tail current, respectively. The values of Q r r , Q t c are commonly provided in datasheets of the power semiconductor switches. In addition, m is the modulation index, and V ¯ t includes two parasitic terms in addition to m V D C 2 : the effective voltage offset ( V e ) and the effective resistive voltage drop ( r e i ):
V ¯ t = m V D C 2 V e r e i , w h e r e i > 0 , V e = V d Q r r + Q t c T S r o n + V D C t r r T S , r e = 1 t r r T S r o n
Likewise, the average AC side output voltage ( V ¯ t ) for one cycle when the AC side current ( i ) is negative can be obtained with Equation (3), and each section can be calculated as shown in Equation (4):
V ¯ t = 1 T S 0 T S V t ( τ ) d τ = 1 T S 0 t t c V t ( τ ) d τ + t t c d T S V t ( τ ) d τ + d T S d T S + t r r V t ( τ ) d τ + d T S + t r r T S V t ( τ ) d τ
V ¯ t = m V D C 2 + V e r e i , w h e r e i < 0 , V e = V d Q r r + Q t c T S r o n + V D C t r r T S , r e = 1 t r r T S r o n
Using Equations (2) and (4), the average output voltage on the AC side can be expressed as shown in Equation (5):
V ¯ t = m V D C 2 i i V e r e i , w h e r e i 0
In this case, the power loss of the converter may be defined as the value obtained by subtracting the average power of the AC side ( P 2 ) from the average power of the DC side ( P 1 ). The average power of the DC side and the average power of the AC side are as shown in Equations (6) and (7), respectively. Therefore, the average power loss of the converter can be expressed as shown in Equation (8):
P ¯ 1 = 1 T S 0 T S P 1 ( τ ) d τ = m V D C 2 i + V D C Q r r + Q t c T S
P ¯ 2 = V ¯ t i = m V D C 2 i V e i r e i 2
P ¯ l o s s = P ¯ 1 P ¯ 2 = V D C Q r r + Q t c T S + V e i + r e i 2
Figure 16 shows the average equivalent circuit of the nonideal half-bridge converter reflecting the average output voltage of the AC side and the average power loss of the converter. Since the reverse recovery time is much shorter than one cycle in general, it can be expressed as r e r o n , and since m V D C 2 is much larger than V e , i i V e can be ignored. Therefore, the average equivalent circuit in Figure 16 can be simplified as shown in Figure 17.
(c) Nonideal 3-phase 2-level converter average model
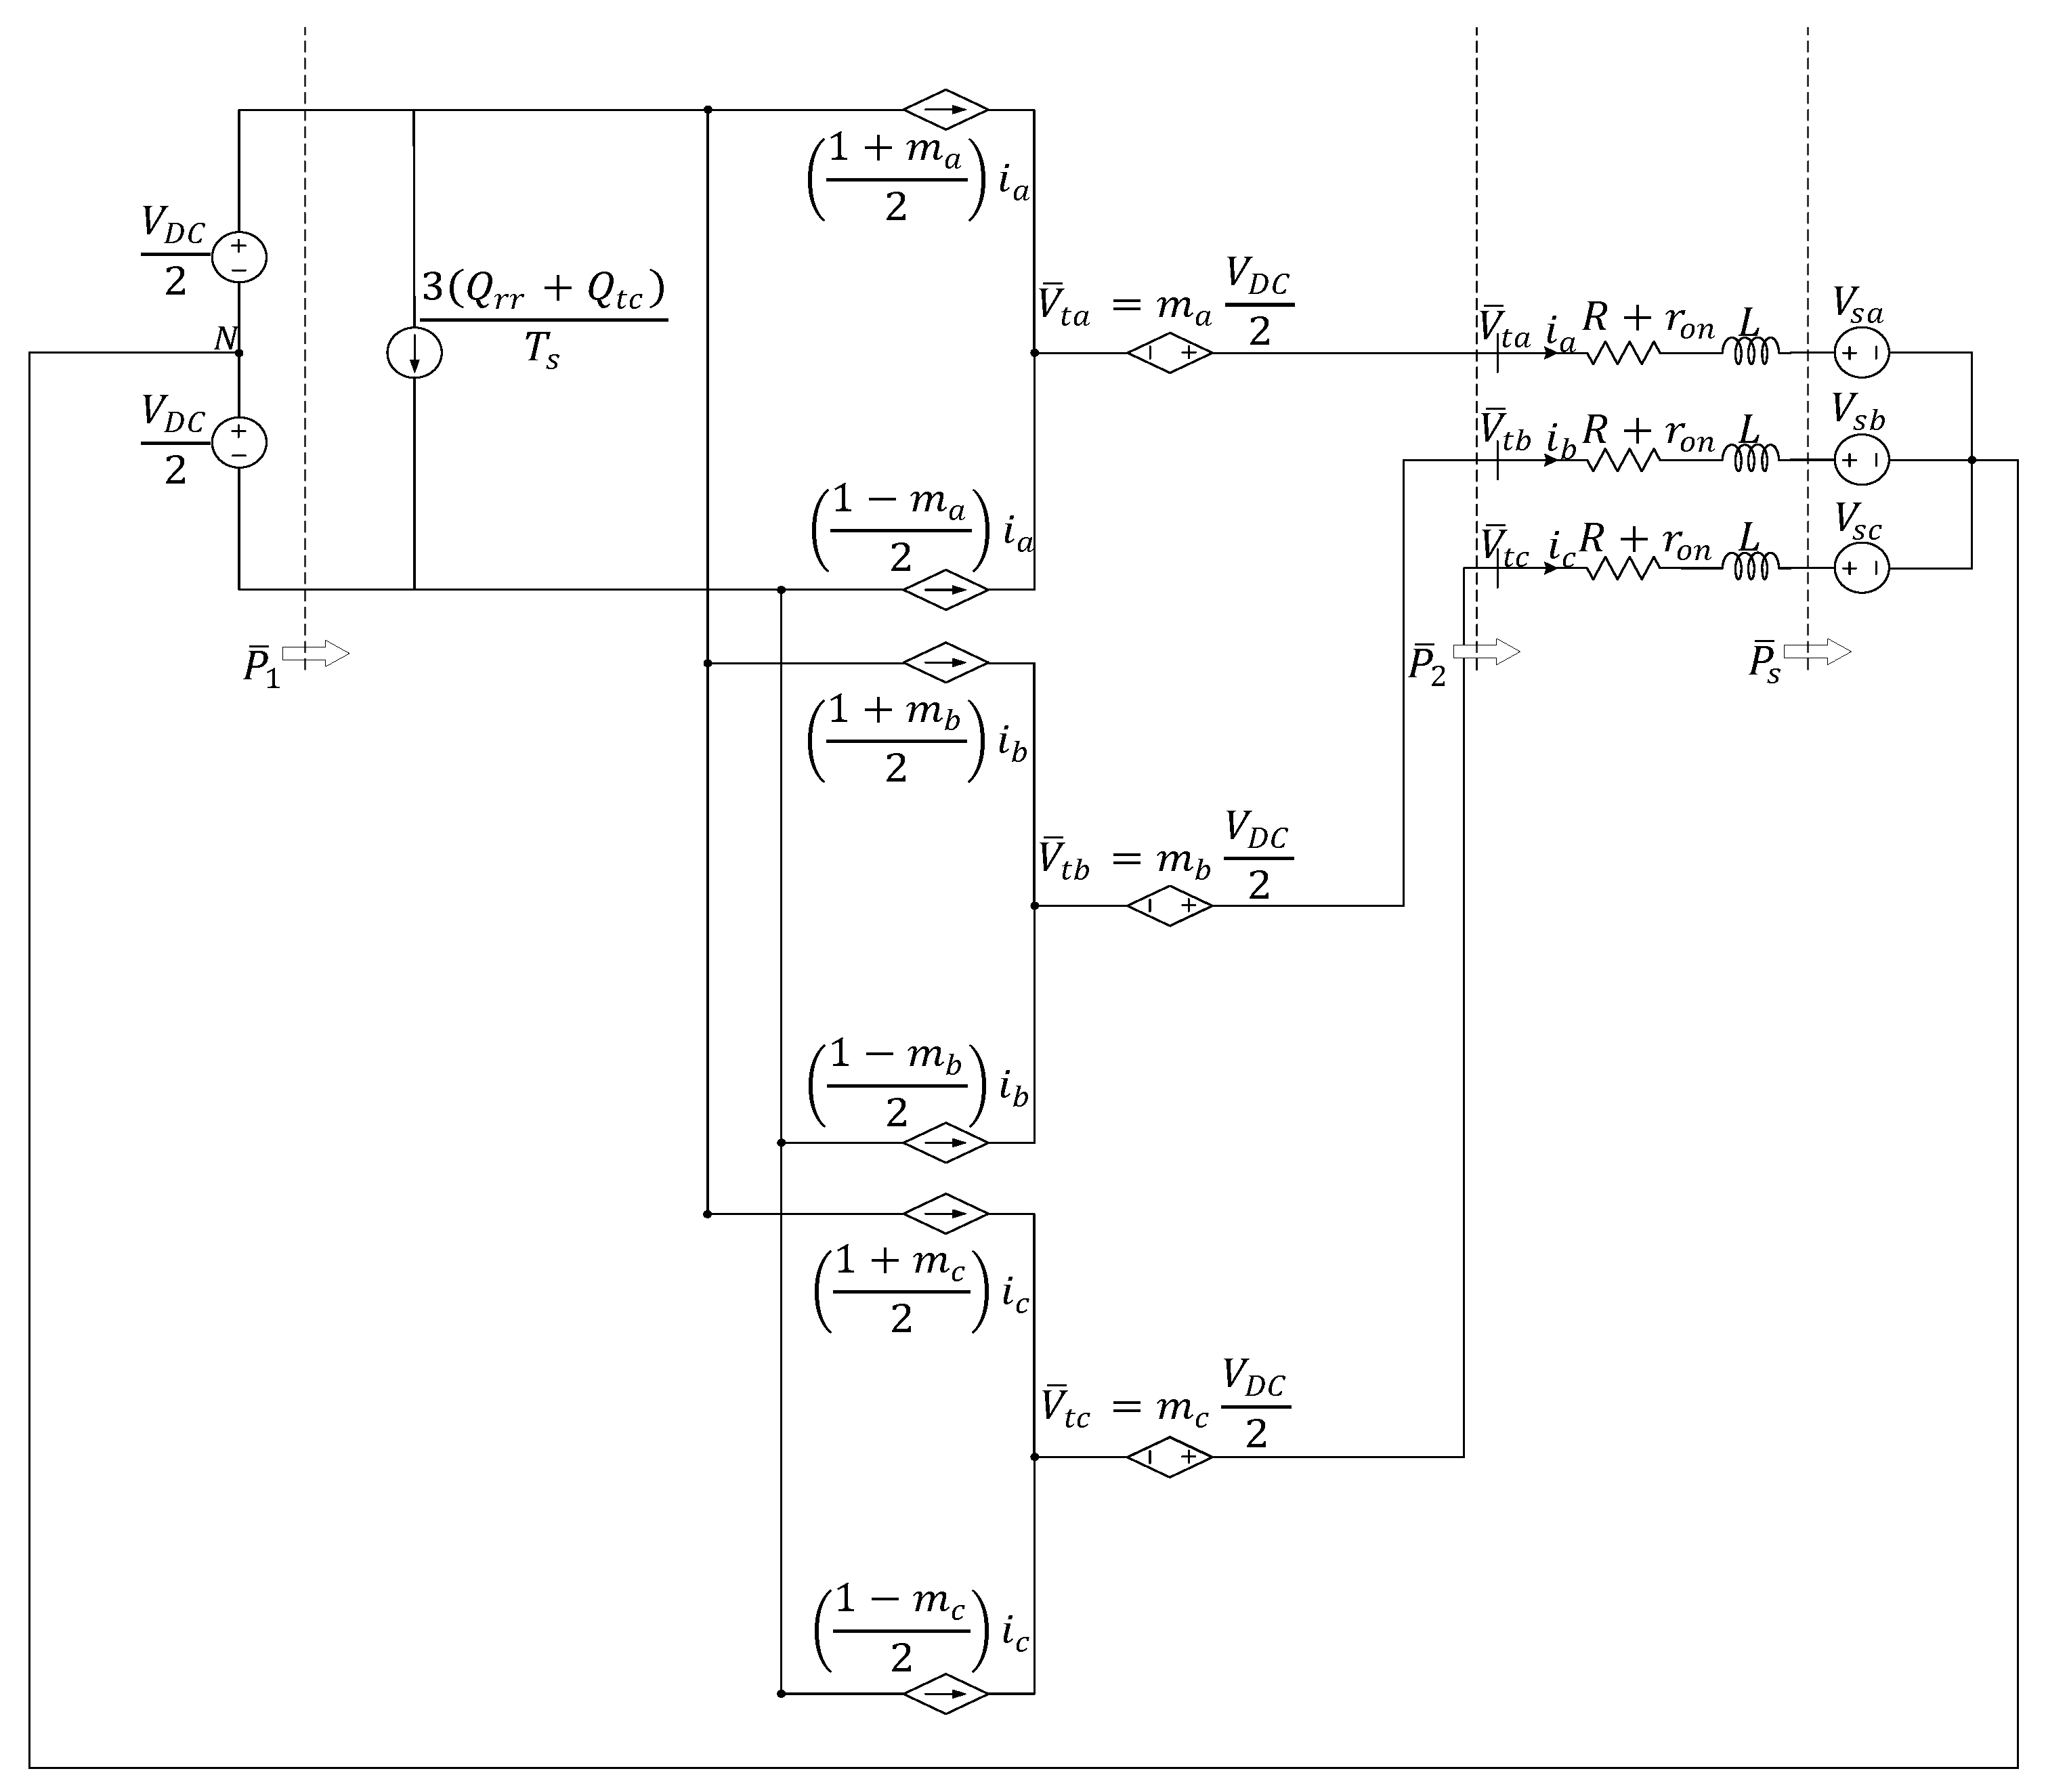
Based on the average equivalent circuit of the nonideal half-bridge converter shown in Figure 17, the average equivalent circuit of the 3-phase 2-level converter was implemented as shown in Figure 18. The average power loss of the 3-phase 2-level converter can be expressed as shown in Equation (9) based on Equation (8).
P ¯ t o t a l l o s s = x = a , b , c P ¯ l o s s ( x p h a s e ) = 3 V D C Q r r + Q t c T S + V e i a + i b + i c + r e i a 2 + i b 2 + i c 2
Based on the average power loss equation of the 3-phase 2-level converter shown in Equation (9), the MATLAB/SIMULINK model was implemented as shown in Figure 19.

4.1.2. Loss Model of the Entire DC Power Distribution System

Based on the MATLAB/SIMULINK model of the average power loss of 3-phase 2-level converters, the simulations of 1 MW VFD inverters #1 and #2, 500 kW DC/AC inverters #1 and #2, and 1 MW DC/DC converters #1 and #2 were carried out.
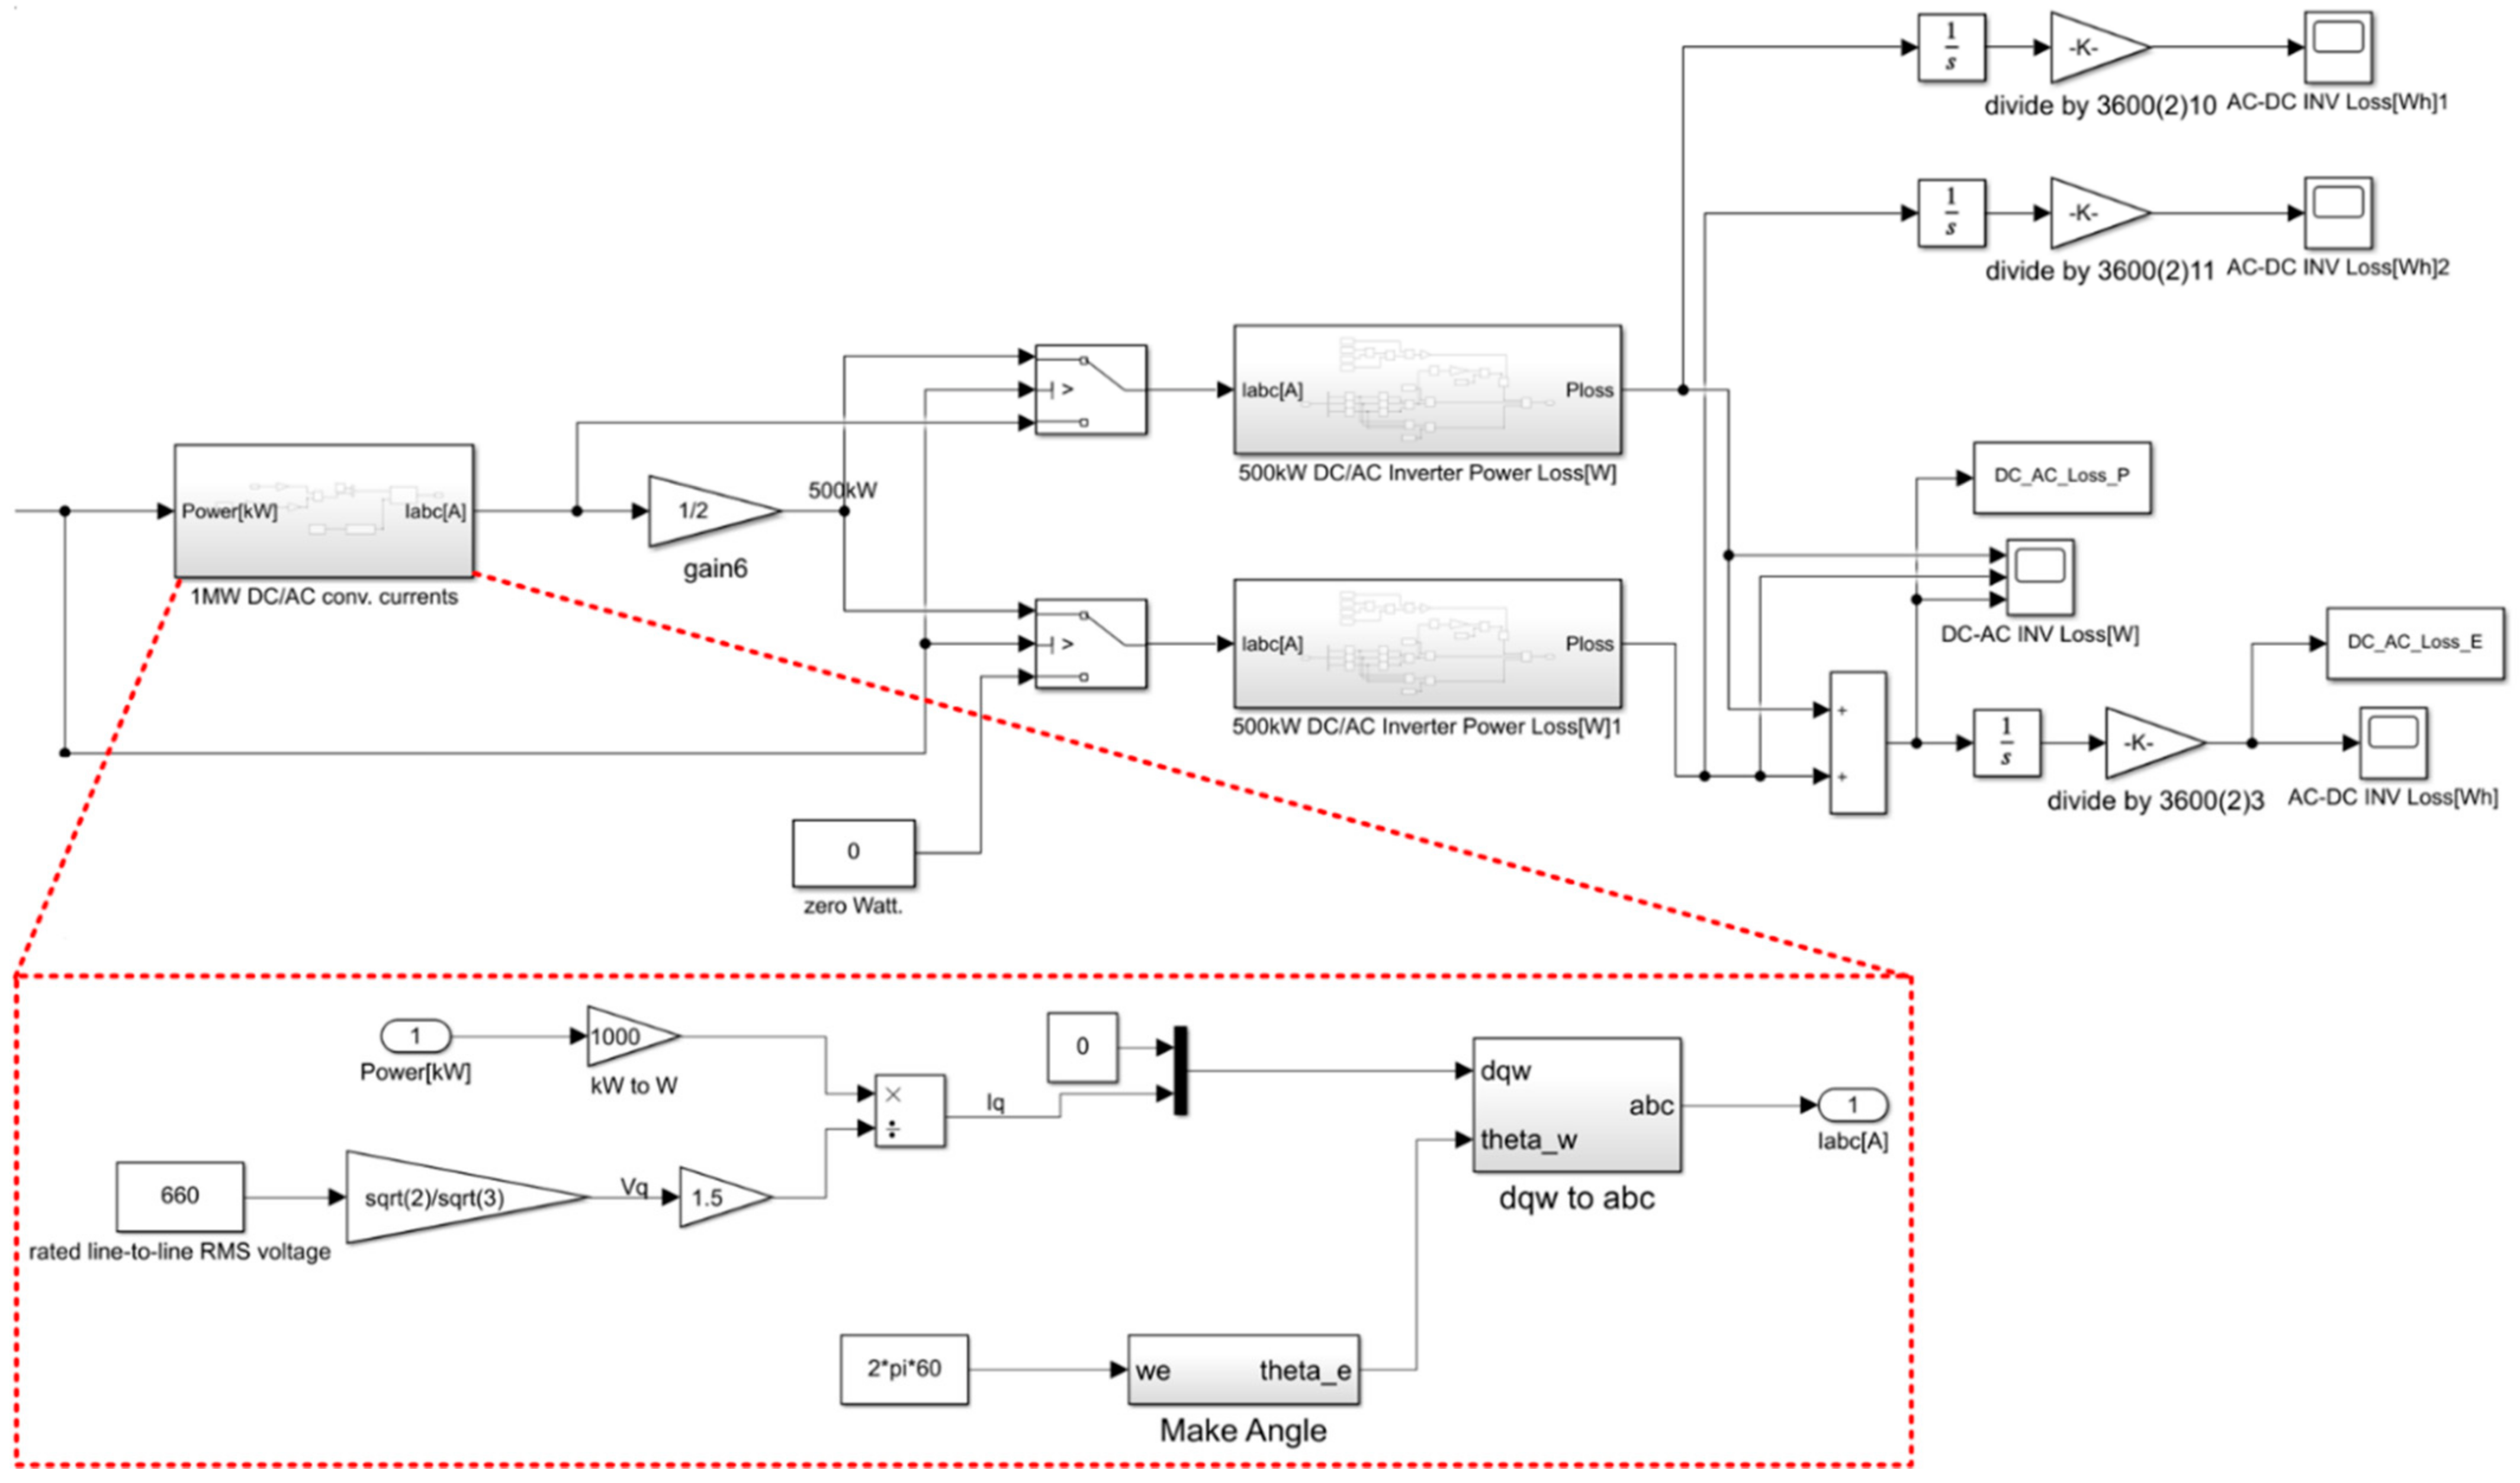
The 1 MW VFD inverter was made with two parallel configurations of 500 kW 2-level inverters. Figure 20 and Figure 21 show the average power loss of the 500 kW DC/AC inverter and the MATLAB/SIMULINK model of the 1 MW VFD inverter power loss, respectively.
In order to simulate the power loss of the DC/AC inverter shown in Figure 20, the process of converting the input power into the current is necessary. Therefore, the current was calculated based on 660 V, which is the AC bus voltage of the DC/AC inverter. If it is assumed that the power factor that is controlled at 1 is close to the optimum efficiency point, the d-axis current which controls the reactive power should be 0% and the q-axis current which provides the active power should be 100% of the converter’s current. Therefore, a process to calculate the q-axis current and convert it into the current in the stationary coordinate system which has an abc-frame, as shown in Figure 20, is necessary.
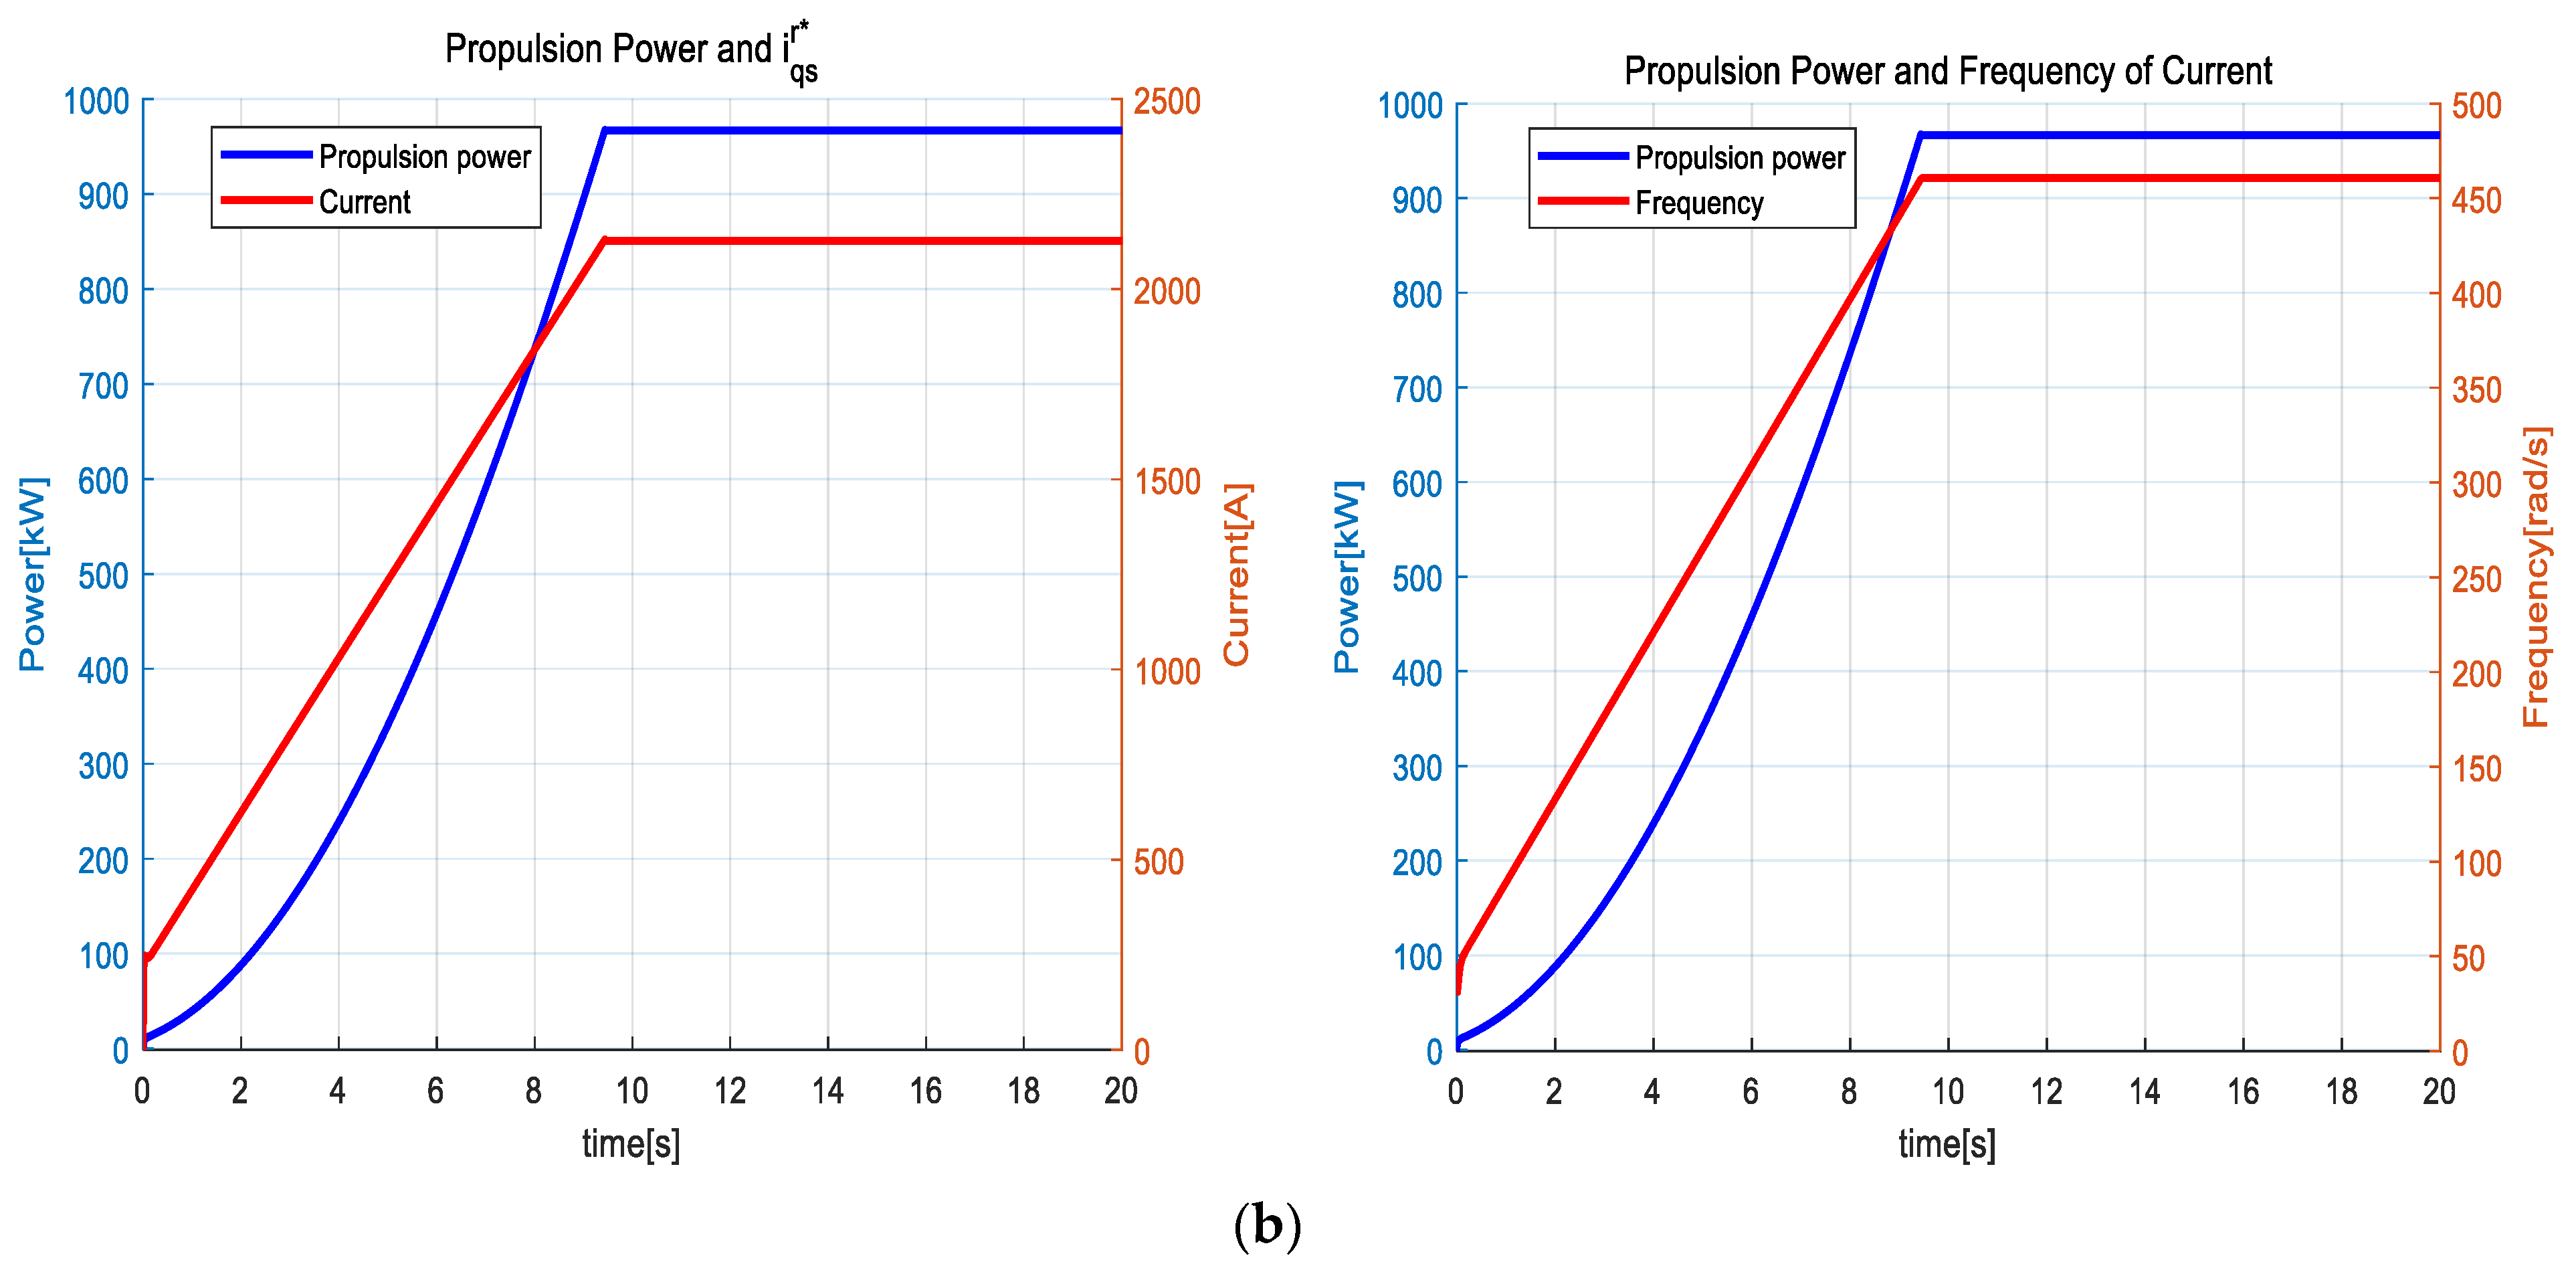
In order to simulate the VFD inverter power loss shown in Figure 21, the loss according to the operation profile should be calculated. Therefore, the results of the simulation of motor propulsion shown in Figure 4 were used. The current and frequency according to the propulsion power in the simulation of motor propulsion shown in Figure 21b were extracted, and a Look Up Table (LUT), as shown in Figure 21a, was constructed and applied to the simulation. Since the input power of the VFD changes instantaneously according to the operation profile, reflecting the changes, the output current of the VFD was simulated using the magnitude and frequency of the current, which is the output of the LUT according to the input power. The resultant value was input to the inverter loss simulation to extract the final loss. The total loss varies because the operating efficiency is different depending on the proportions of low-speed operation and high-speed operation. If this simulation is used, the loss can be simulated even if the operation profile is changed, considering the foregoing.
As shown in Figure 22, the average power loss model of the 1 MW DC/DC converter was constructed with two parallel configurations of 500 kW 3-phase 2-level converters by connecting them back-to-back. Consequently, it is expected that the efficiency will be lower compared to that of the 1 MW DC/DC converter actually manufactured. Considering the foregoing, the maximum rated efficiency was corrected to about 98% when the simulation was carried out, and this study is meaningful in that it presented the methodology of the analysis.
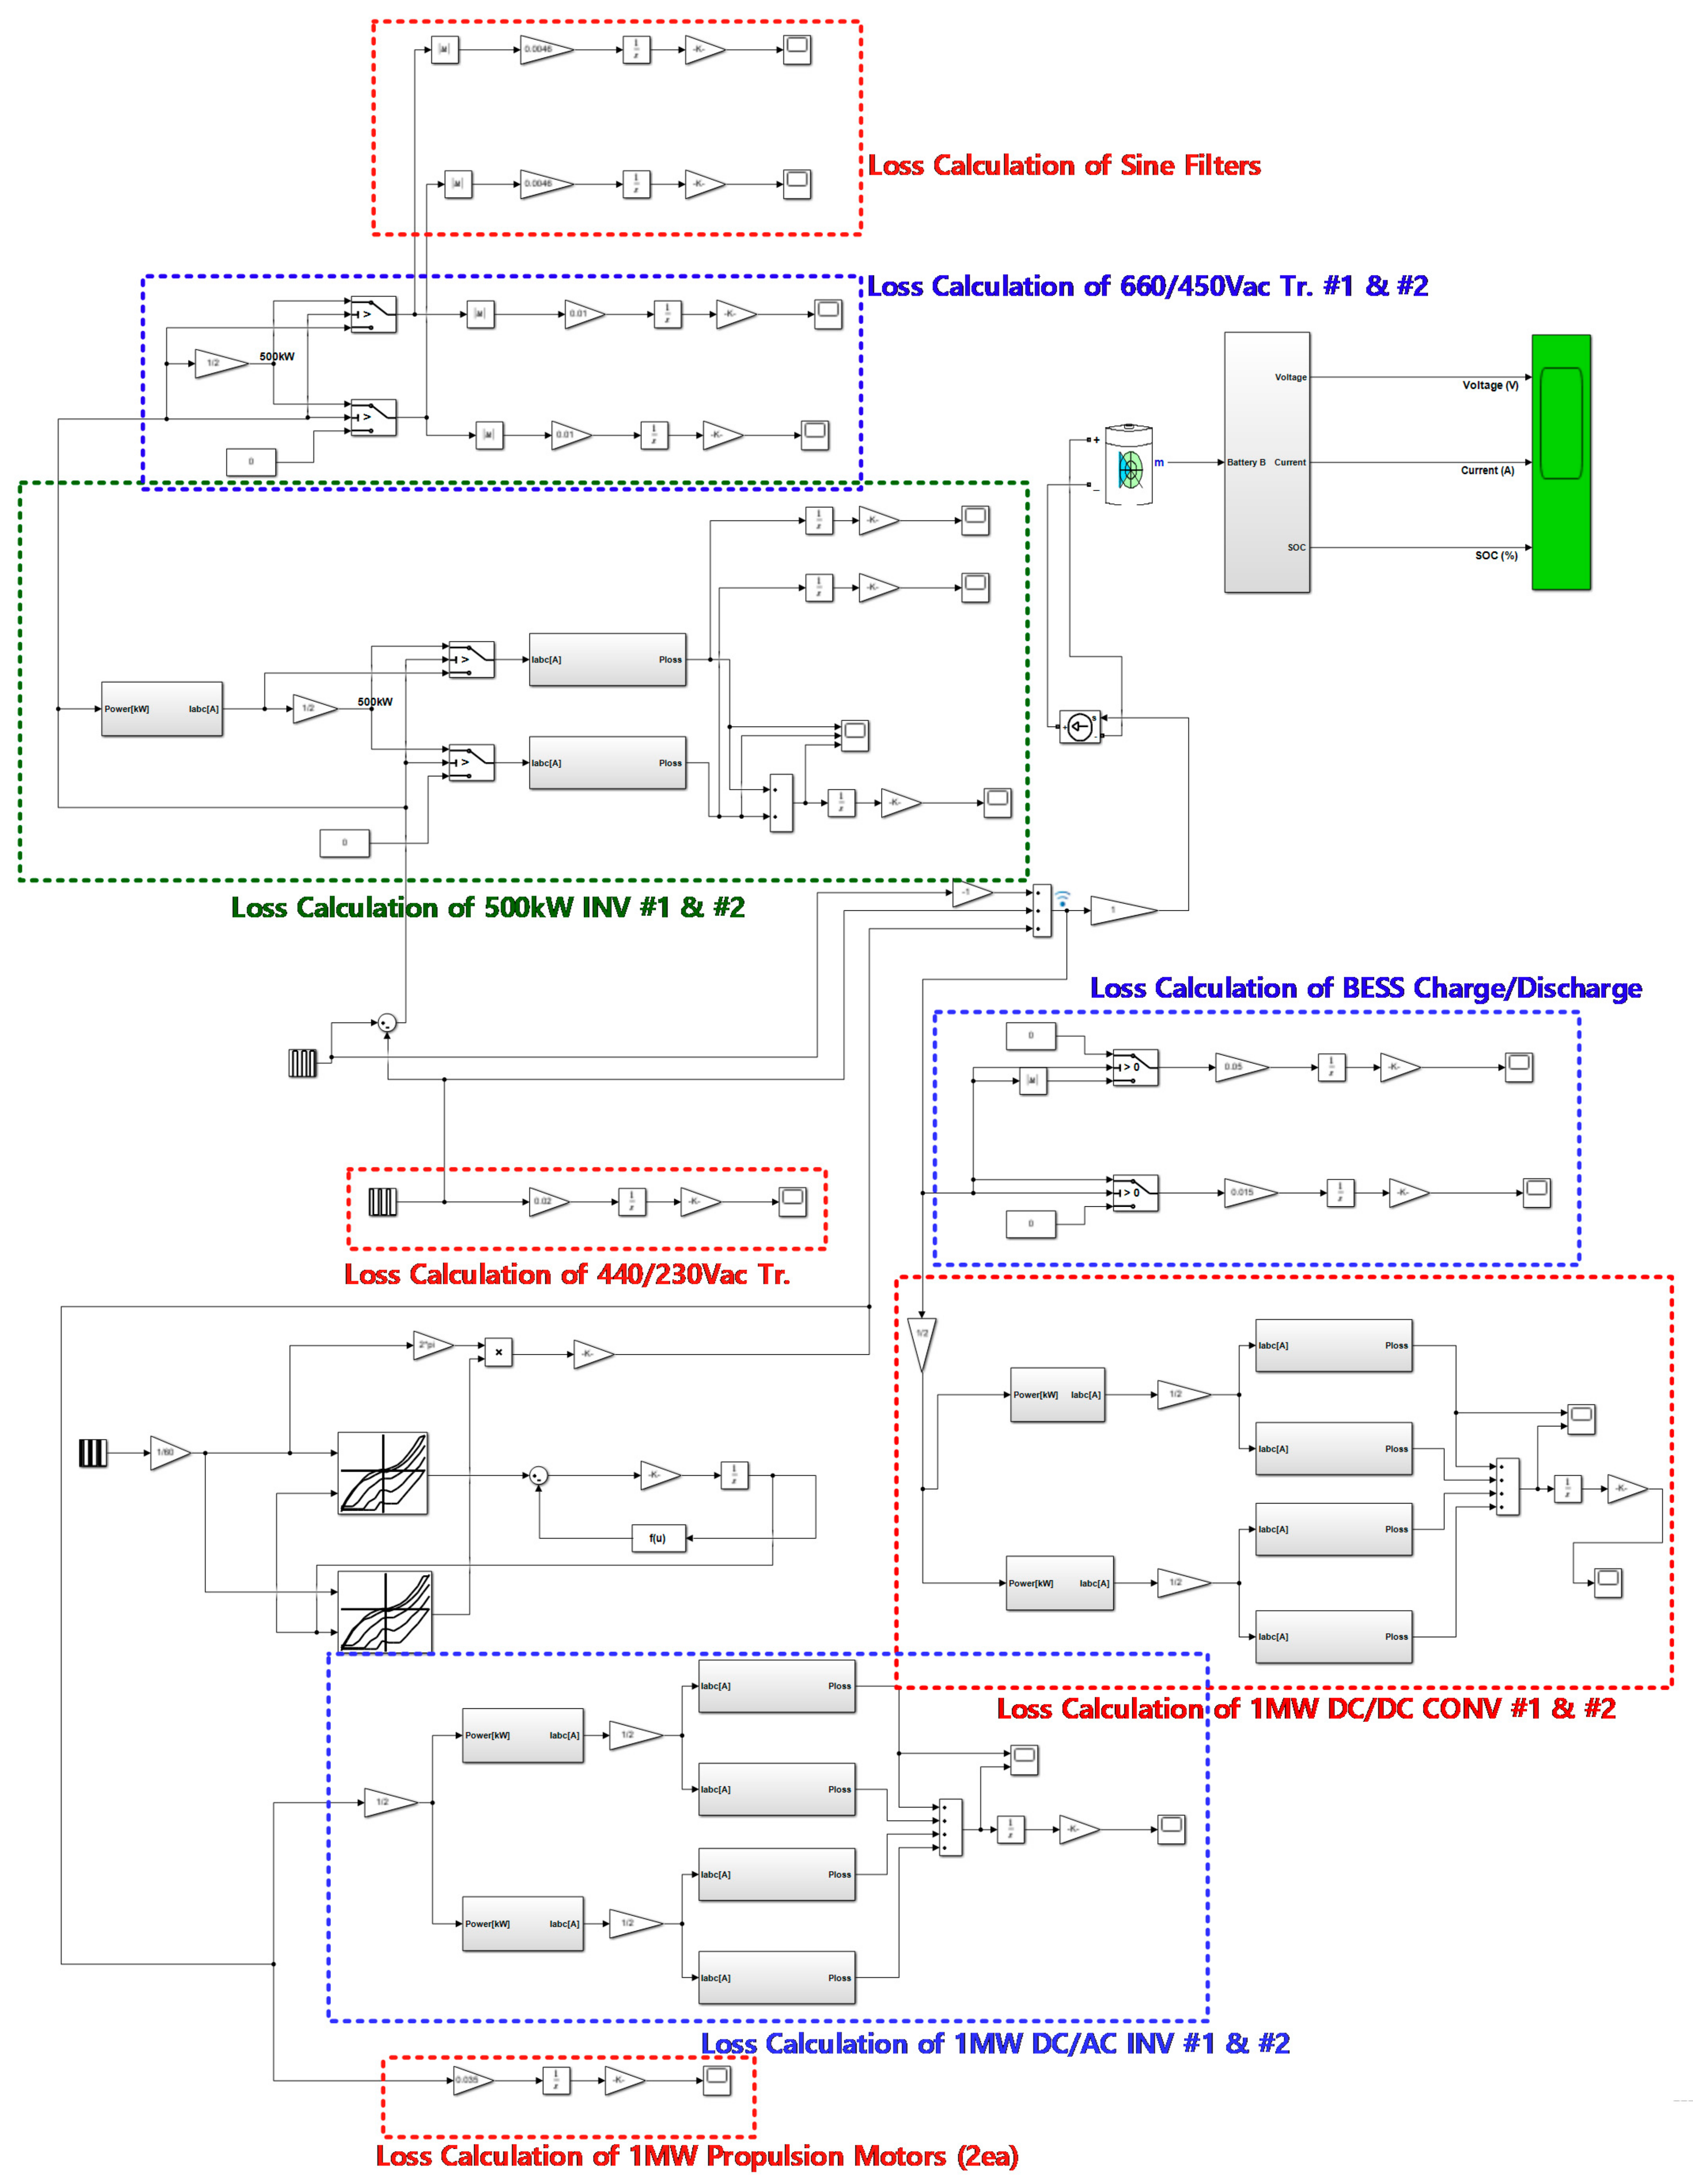
The overall DC distribution loss simulation model is shown in Figure 23. The transformer, motor, and sine filter were simulated based on the loss in the data sheet for the actual equipment, and the battery charge/discharge efficiency was assumed to be about 97.5%. The entire DC distribution loss simulation model is as shown in Figure 23.

4.2. Simulation Results of System Efficiency

System loss and efficiency were analyzed through the simulation of the entire DC distribution loss model. Thereafter, reflecting the derived system loss and efficiency, BESS design and system loss analysis were conducted again.
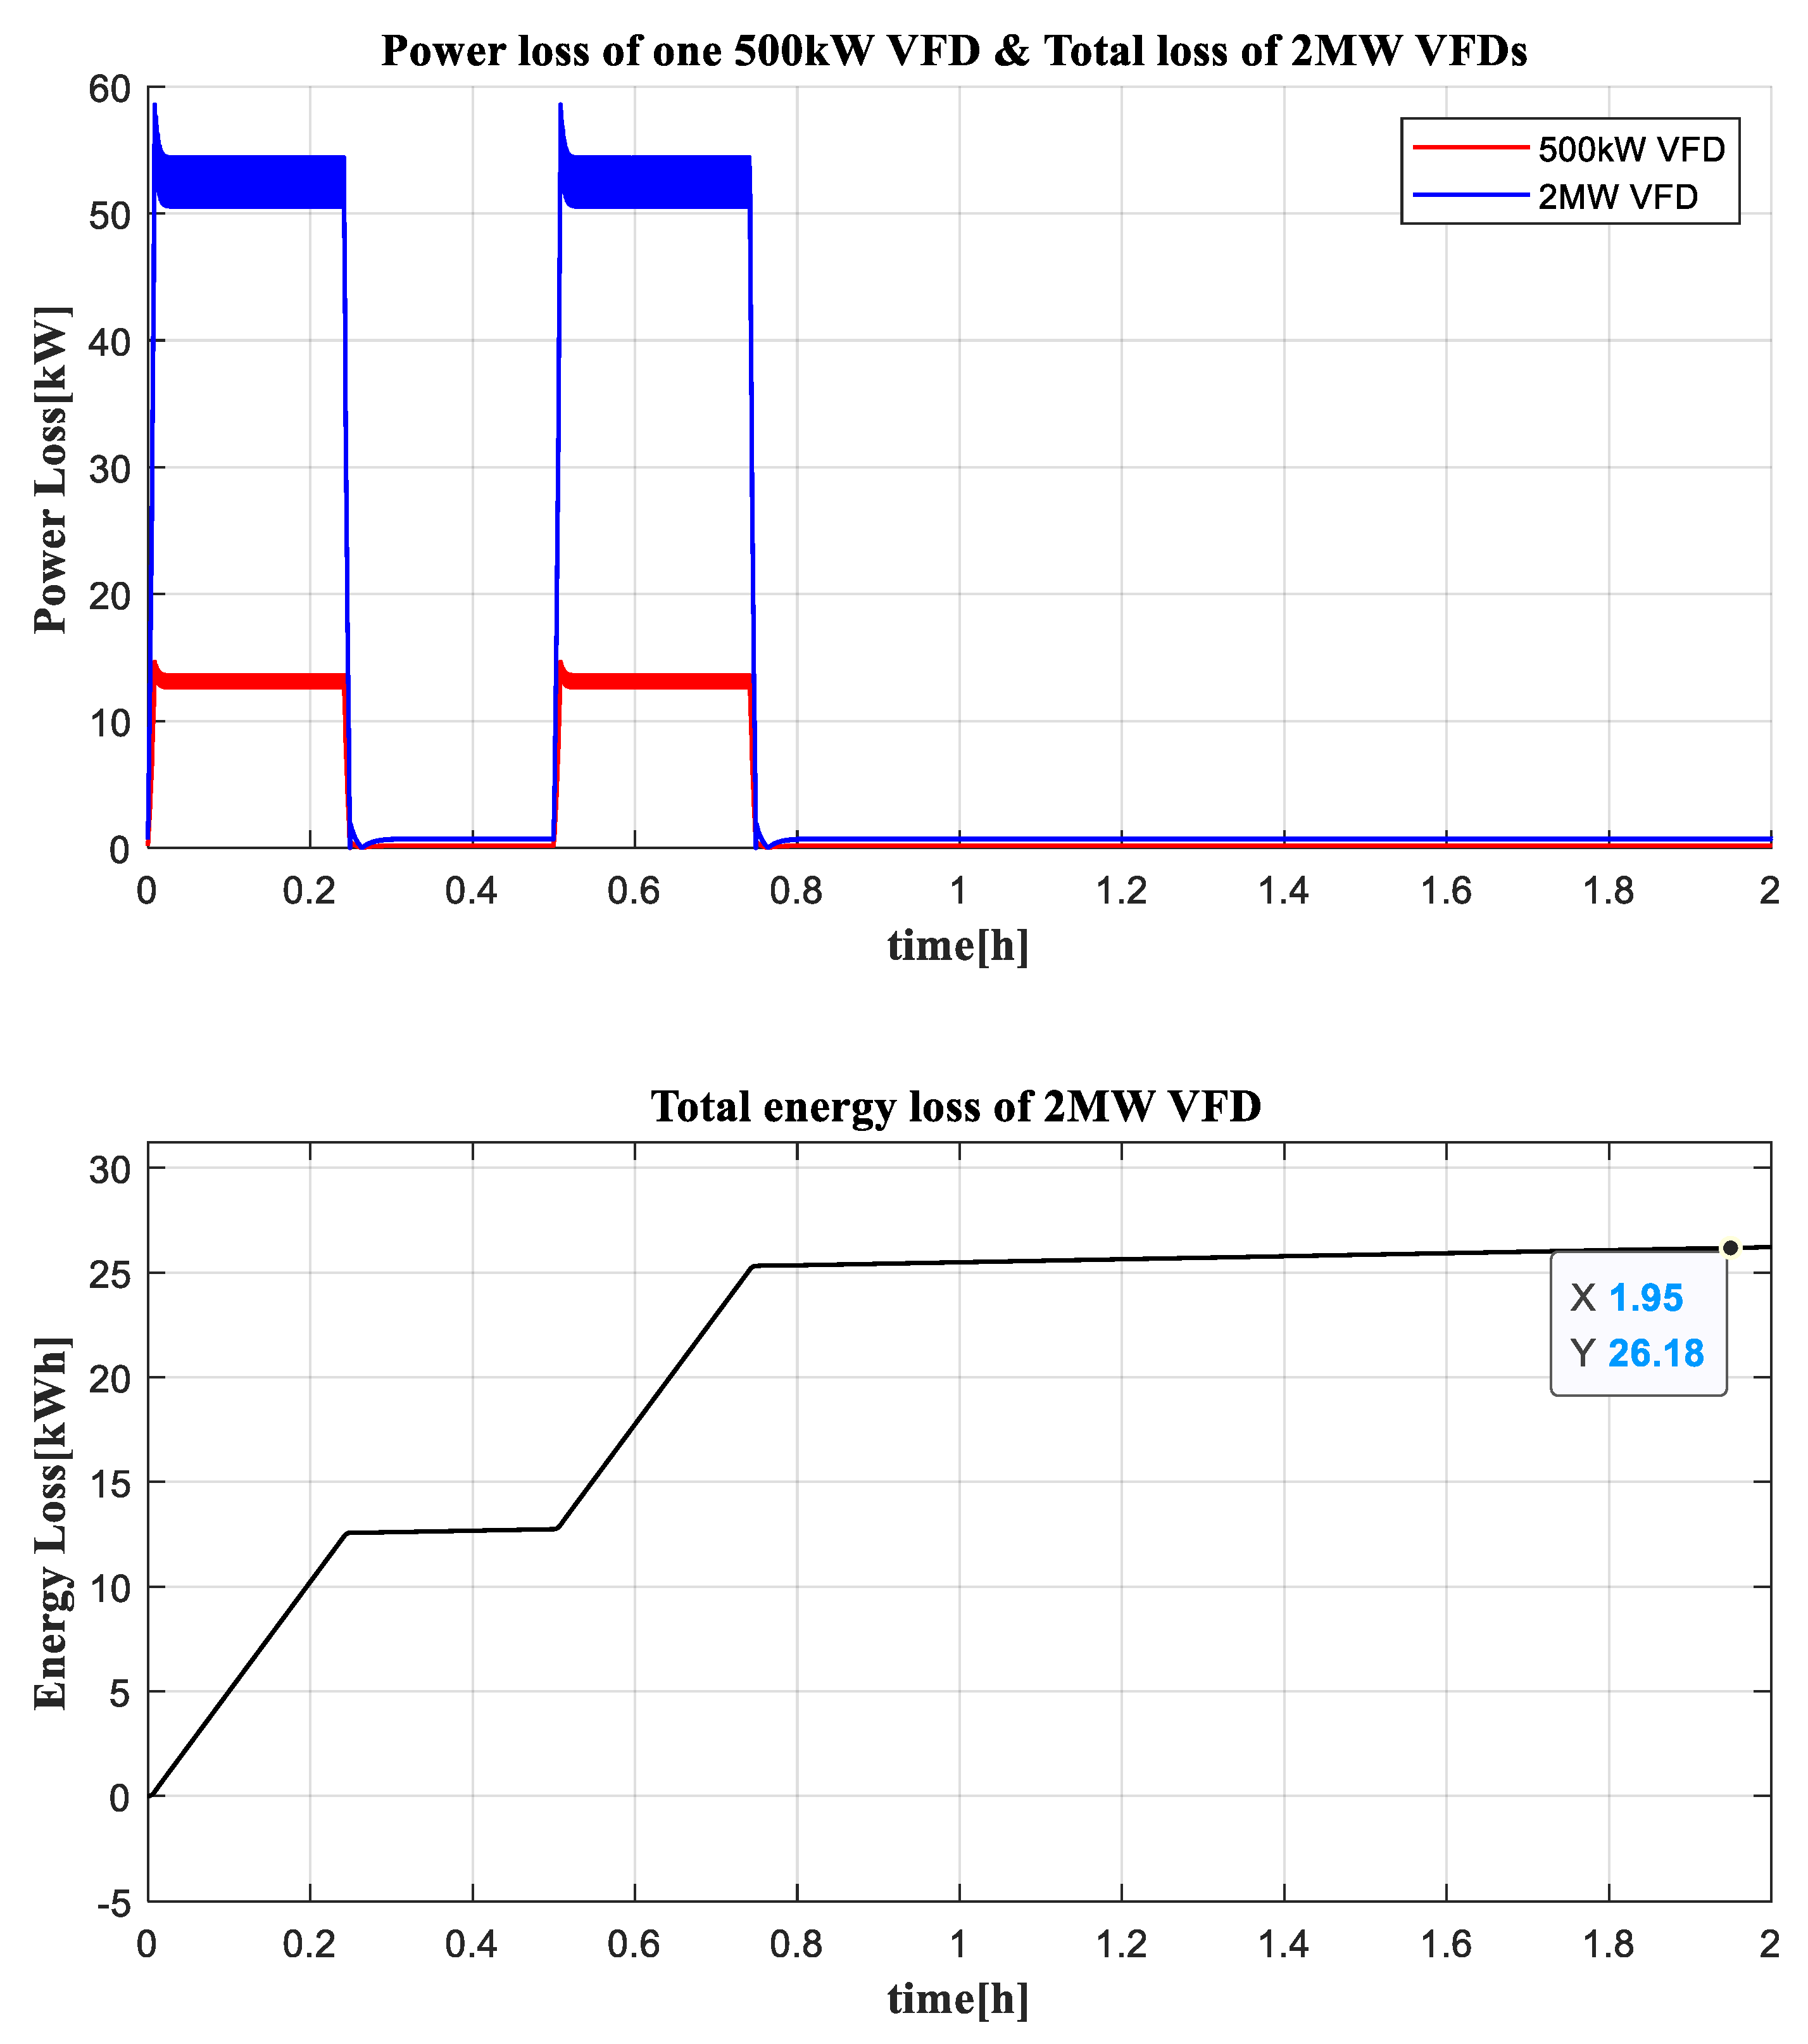
Figure 24 shows the simulation results for the power and energy loss of 500 kW DC/AC inverters #1 and #2. In the battery charging section, since both 500 kW DC/AC inverters #1 and #2 operate, power loss occurs in both inverters. However, in the battery discharge section, since only 500 kW DC/AC inverter #1 operates, power loss occurs only in inverter #1.
Figure 25 shows the sum of the power loss and energy loss of 1 MW VFD inverters #1 and #2. As shown in Figure 2, which shows the load profiles according to the operation profiles, the propulsion power increases rapidly in the section where the speed of the ship increases to the maximum speed at the beginning of the operation. Therefore, the power loss of the 1 MW VFD inverter connected to the motor also increases rapidly in the same section. Since the motor does not operate in the section where the vessel is anchored and the section where the battery is charged by anchoring, there is little loss of the VFD inverter in these sections. It can be seen that the efficiency of the VFD inverter improves as the input power approaches the rated input power, as shown in Figure 26.
Figure 27 and Figure 28 show the sum of the power loss and the sum of the energy loss of the 1 MW DC/DC converter, respectively. In the section where the vessel does not charge the battery and only anchors, power is supplied only to the auxiliary loads, so that less power loss occurs compared to the operation section. As mentioned earlier, the average power loss model for the 1 MW DC/DC converter was constructed with two parallel configurations of the 500 kW 3-phase 2-level converters by connecting the converters back-to-back, and the simulation efficiency calculation was corrected reflecting the loss of the actually manufactured DC/DC converters.
Figure 29 shows the BESS charge/discharge profiles reflecting the entire system loss according to the target vessel operation profile. Considering battery life and safety, the initial charging capacity was set to 80%. The battery capacity was calculated reflecting the system loss and surplus. Those battery cells that have a capacity of 2.2 MWh with an increase by 200 kWh and are the same as 2 MWh batteries and series/parallel configurations were used. With an increase in the battery capacity, the number and weight of the packs increased, and the capacity of the 1 MW DC/DC converter also increased to 1.1 MW. After one round trip operation, the battery’s SOC is 27.2% and the DoD is 52.8%. The maximum discharge C-rate was shown to be 1.15 C, and when charging 1000 kWh, the charging C-rate is 0.49 C, and the total charging time is 65.2 min. The losses of DC/AC inverter, DC/DC converter, and sine filter occurring in the charging section are not reflected in the battery SOC because the shore system must consider the losses.

5. Conclusions

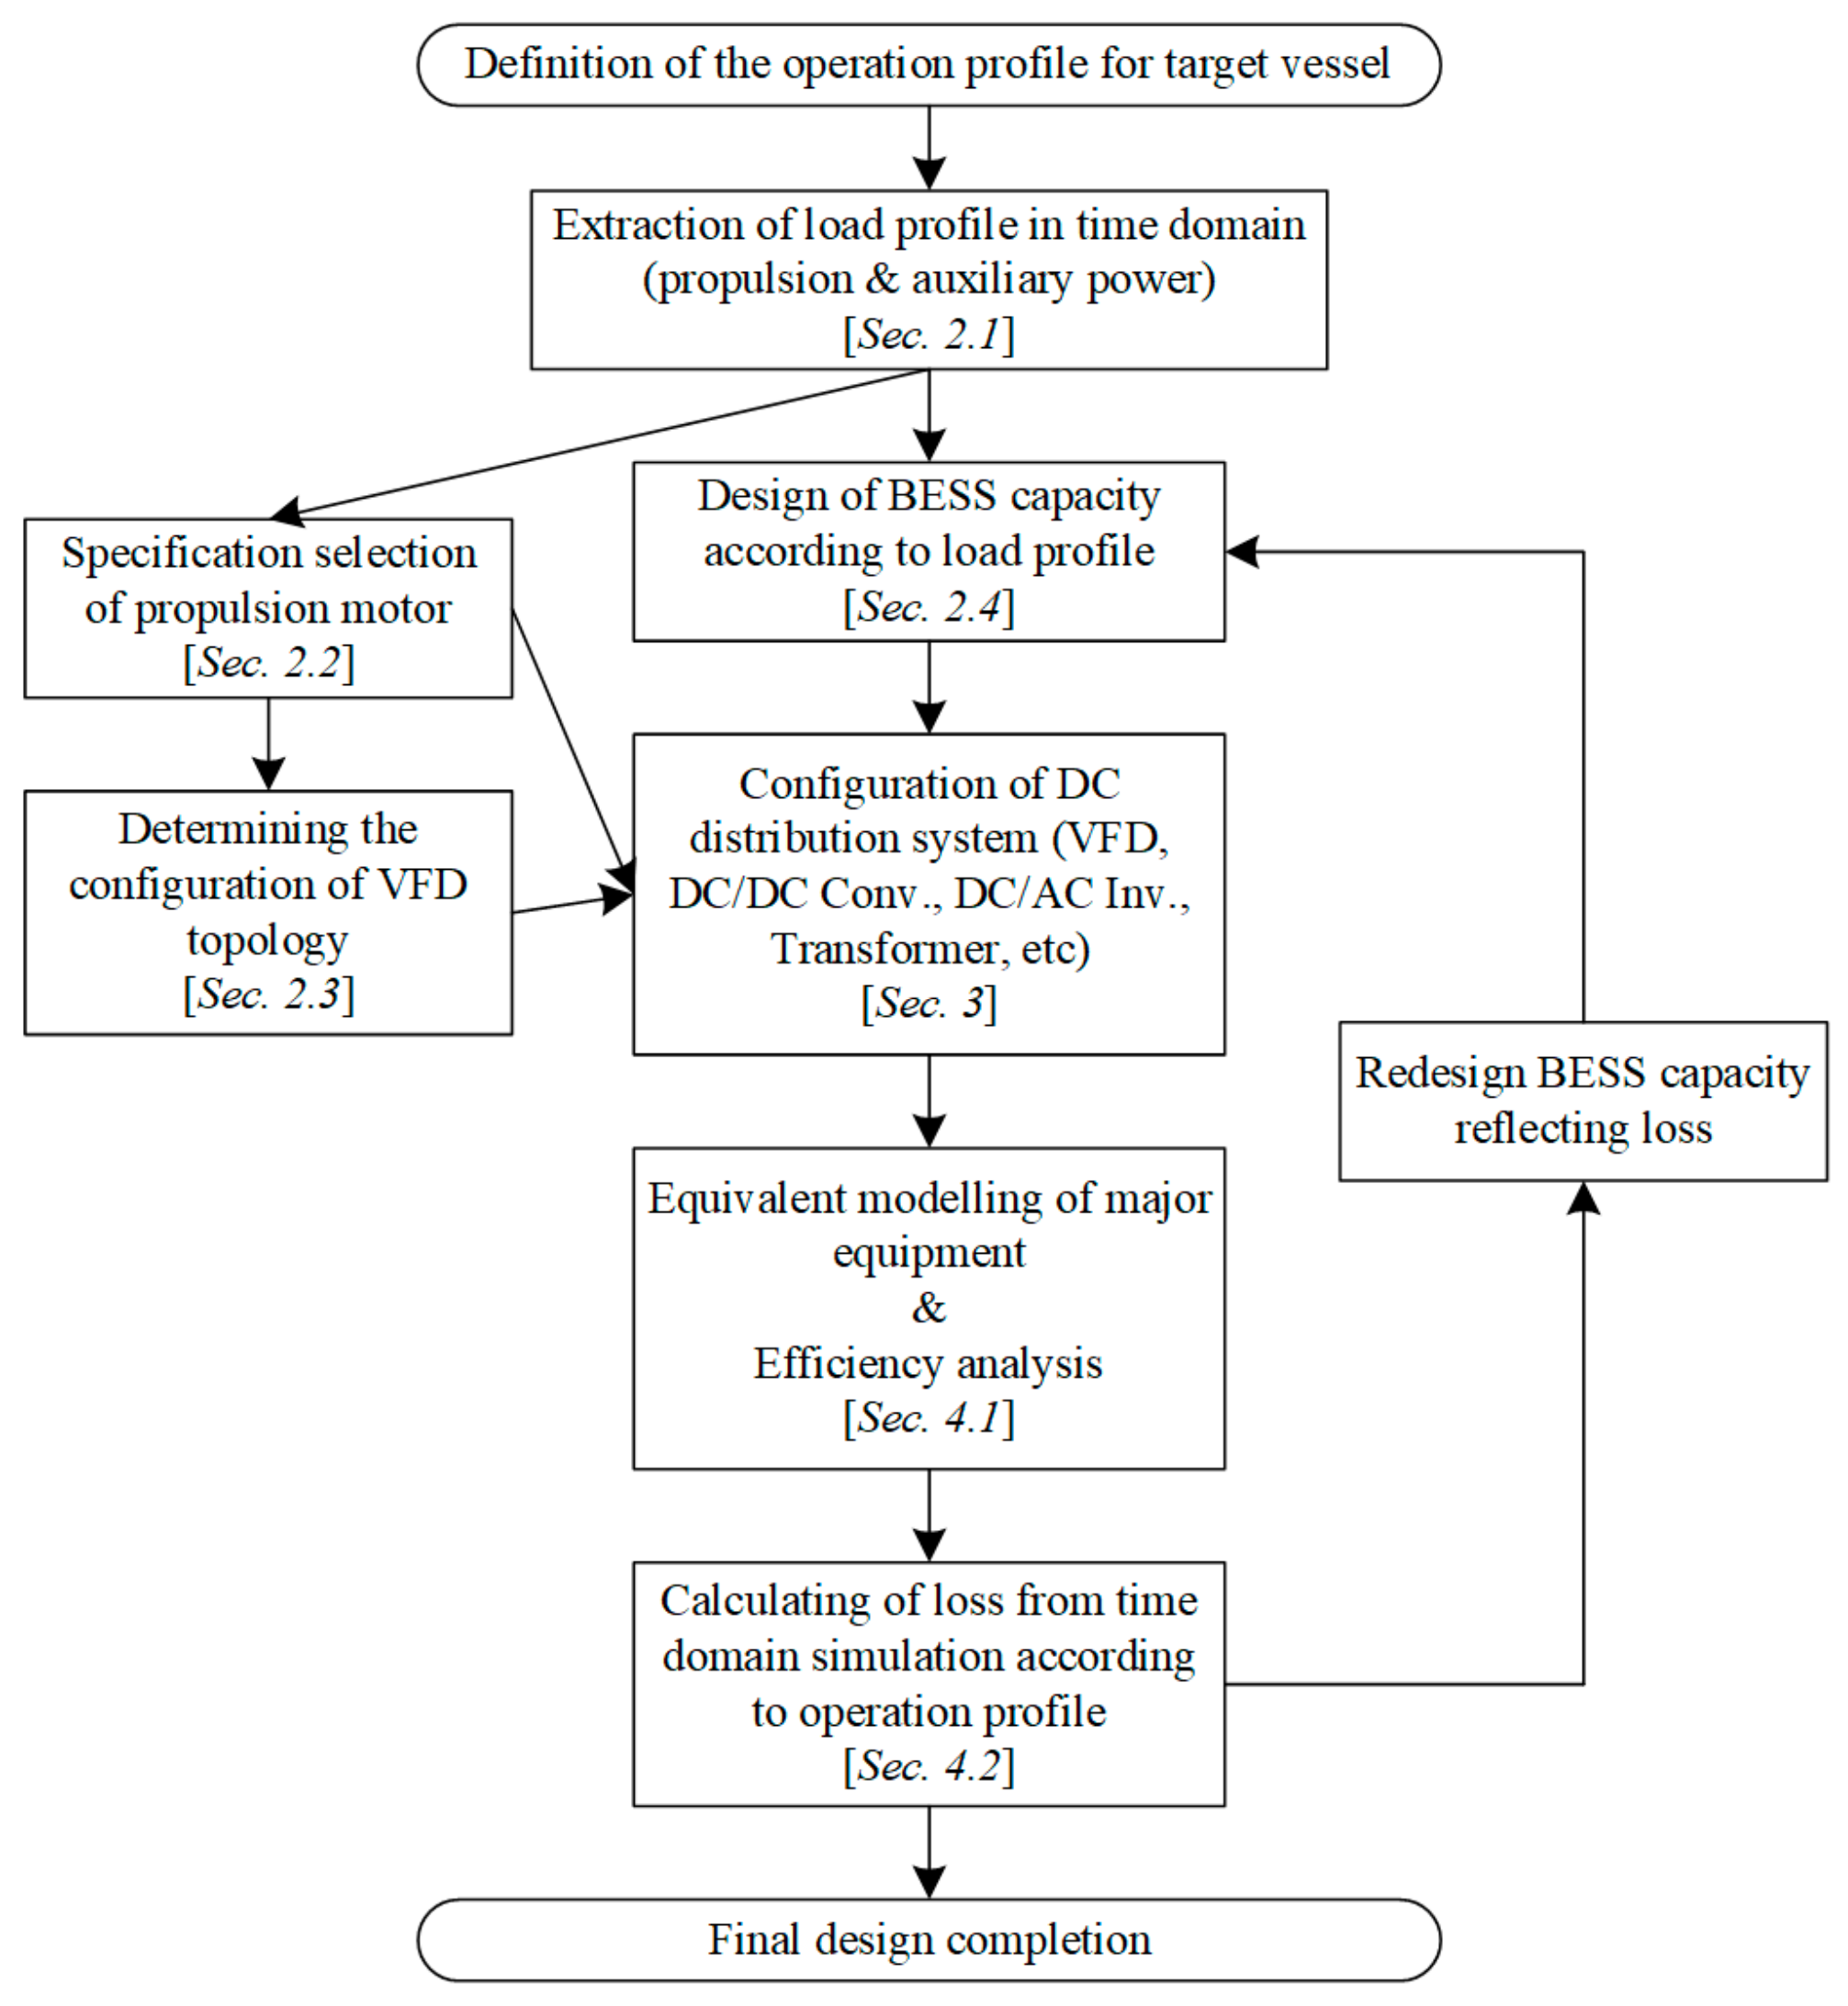
This paper proposed the comprehensive design of a pure electric propulsion ship which has BESS as the only source of power. Additionally, this paper has covered a series of design processes such as the extraction of load profile in time domain according to the operation profile, specification selection of propulsion motor, configurating VFD circuits, BESS capacity design, DC distribution configuration, efficiency analysis from equivalent modelling of major equipment, loss calculation, and so on. Furthermore, the proposed design and analysis have been conducted and validated through the MATLAB Simulink tool. Therefore, the design methodology can help to provide a design guide for the electric ship building industry. Finally, the workflow chart for comprehensive design of DC shipboard power system for pure electric propulsion ship based on BESS is drawn as shown in Figure 30, which briefly covers most of the contents of this paper.

Author Contributions

Conceptualization, Y.-R.K. and J.-J.J.; methodology, Y.-R.K., J.-M.K. and J.-J.J.; software, J.-J.J.; validation, Y.-R.K., J.-M.K. and J.-J.J.; formal analysis, Y.-R.K.; investigation, J.-J.J., S.-Y.K., J.-H.C. and H.-G.L.; resources, S.-Y.K., J.-H.C. and H.-G.L.; writing—original draft preparation, Y.-R.K. and J.-J.J.; writing—review and editing, Y.-R.K. and J.-J.J.; visualization, Y.-R.K. and J.-M.K.; supervision, J.-J.J.; project administration, J.-H.C. and J.-J.J.; funding acquisition, J.-H.C., H.-G.L., and J.-J.J. All authors have read and agreed to the published version of the manuscript.

Funding

This research was funded by the Korea Electrotechnology Research Institute (KERI) and the Korea Institute of Energy Technology Evaluation and Planning (KETEP).

Institutional Review Board Statement

Not applicable.

Informed Consent Statement

Not applicable.

Data Availability Statement

Not applicable.

Acknowledgments

This research was supported by the Korea Electrotechnology Research Institute (KERI) Primary research program through the National Research Council of Science & Technology (NST) funded by the Ministry of Science and ICT (MSIT) (No. 20A01017), and was also supported by the Human Resources Program in Energy Technology of the Korea Institute of Energy Technology Evaluation and Planning(KETEP) granted financial resource from the Ministry of Trade, Industry & Energy, Republic of Korea (No. 20204010600060).

Conflicts of Interest

The authors declare no conflict of interest.

Nomenclature

Abbreviations
AMPalternative maritime power
AUX.LOADauxiliary load on board
BESSbattery energy storage system
CBcircuit breaker
DODdepth of discharge
EPMelectric propulsion motor
ESSenergy storage system
IPSintegrated power system
LUTlook up table
MTPAmaximum torque per ampere
N.C.normally closed
N.O.normally open
PCSpower conversion system
PMSMpermanent magnet synchronous motor
SOCstate of charge
SSCBsolid state circuit breaker
VFDvariable frequency drive
Superscript
*reference value
sstationary reference frame
eSynchronously rotating reference frame
Subscript
a, b, cbasic three phase
d, qdirect axis, quadrature axis
Symbols
d duty ratio
i 0 circulating current
i D k diode conduction current (where, k = 1, 2, 3...)
i Q k switch conduction current (where, k = 1, 2, 3...)
m modulation index
P ¯ 1 average power of the dc side
P ¯ 2 average power of the ac side
Q r r quantity of electric charge of the reverse recovery current
Q t c quantity of electric charge of the tail current
r o n on-state resistance
r e effective resistance
T r r reverse recovery time
T s switching period
T t c tail current time
V d voltage drop
V e effective voltage offset
V ¯ e average ac side output voltage
V ¯ t average output voltage

References

  1. Fiadomor, R. Assessment of Alternative Maritime Power (Cold Ironing) and Its Impact on Port Management and Operations. Master’s Thesis, World Maritime University, Malmö, Sweden, 2009. [Google Scholar]
  2. Čampara, L.; Hasanspahić, N.; Vujičić, S. Overview of MARPOL ANNEX VI regulations for prevention of air pollution from marine diesel engines. SHS Web Conf. 2018, 58, 01004. [Google Scholar] [CrossRef]
  3. Buhaug, Ø.; Corbett, J.; Endresen, Ø.; Eyring, V.; Faber, J.; Hanayama, S.; Lee, D.; Lee, D.; Lindstad, H.; Markowska, A. Second IMO GHG Study 2009; IMO: London, UK, 2009. [Google Scholar]
  4. Viana, M.; Hammingh, P.; Colette, A.; Querol, X.; Degraeuwe, B.; de Vlieger, I.; van Aardenne, J. Impact of maritime transport emissions on coastal air quality in Europe. Atmos. Environ. 2014, 90, 96–105. [Google Scholar] [CrossRef]
  5. Deng, J.; Wang, X.; Wei, Z.; Wang, L.; Wang, C.; Chen, Z. A review of NOx and SOx emission reduction technologies for marine diesel engines and the potential evaluation of liquefied natural gas fuelled vessels. Sci. Total Environ. 2020, 766, 144319. [Google Scholar] [CrossRef] [PubMed]
  6. Joung, T.-H.; Kang, S.-G.; Lee, J.-K.; Ahn, J. The IMO initial strategy for reducing Greenhouse Gas(GHG) emissions, and its follow-up actions towards 2050. J. Int. Marit. Safety Environ. Aff. Shipp. 2020, 4, 1–7. [Google Scholar] [CrossRef] [Green Version]
  7. Vicenzutti, A.; Bosich, D.; Giadrossi, G.; Sulligoi, G. The Role of Voltage Controls in Modern All-Electric Ships: Toward the all electric ship. IEEE Electrif. Mag. 2015, 3, 49–65. [Google Scholar] [CrossRef]
  8. Lee, D.K.; Jeong, Y.K.; Shin, J.G.; Oh, D.K. Optimized design of electric propulsion system for small crafts using the differential evolution algorithm. Int. J. Precis. Eng. Manuf.-Green Tech. 2014, 1, 229–240. [Google Scholar] [CrossRef] [Green Version]
  9. Ančić, I.; Vladimir, N.; Luttenberger, L.R. Energy efficiency of ro-ro passenger ships with integrated power systems. Ocean Eng. 2018, 166, 350–357. [Google Scholar] [CrossRef]
  10. Kim, S.Y.; Cho, B.G.; Sul, S.K. Feasibility study of Integrated Power System with Battery Energy Storage System for naval ships. In Proceedings of the 2012 IEEE Vehicle Power and Propulsion Conference, Seoul, Korea, 9–12 October 2012; pp. 532–537. [Google Scholar] [CrossRef]
  11. Jin, B.Z.; Sulligoi, G.; Cuzner, R.; Meng, L.; Vasquez, J.C.; Guerrero, J.M. Next-Generation Shipboard DC Power System. IEEE Electrif. Mag. 2016, 4, 45–57. [Google Scholar] [CrossRef] [Green Version]
  12. Nuchturee, C.; Li, T.; Xia, H. Energy efficiency of integrated electric propulsion for ships—A review. Renew. Sustain. Energy Rev. 2020, 134, 110145. [Google Scholar] [CrossRef]
  13. Fang, S.; Wang, Y.; Gou, B.; Xu, Y. Toward Future Green Maritime Transportation: An Overview of Seaport Microgrids and All-Electric Ships. IEEE Trans. Veh. Technol. 2020, 69, 207–219. [Google Scholar] [CrossRef]
  14. Anwar, S.; Zia, M.Y.I.; Rashid, M.; Rubens, G.Z.d.; Enevoldsen, P. Towards Ferry Electrification in the Maritime Sector. Energies 2020, 13, 6506. [Google Scholar] [CrossRef]
  15. Koumentakos, A.G. Developments in electric and green marine ships. Appl. Syst. Innov. 2019, 2, 34. [Google Scholar] [CrossRef] [Green Version]
  16. Banaei, M.; Ghanami, F.; Rafiei, M.; Boudjadar, J.; Khooban, M.H. Energy management of hybrid diesel/battery ships in multidisciplinary emission policy areas. Energies 2020, 13, 4179. [Google Scholar] [CrossRef]
  17. Hadjipaschalis, I.; Poullikkas, A.; Efthimiou, V. Overview of current and future energy storage technologies for electric power applications. Renew. Sustain. Energy Rev. 2009, 13, 1513–1522. [Google Scholar] [CrossRef]
  18. Javaid, U.; Freijedo, F.D.; Dujic, D.; Van Der Merwe, W. Dynamic assessment of source-load interactions in marine MVDC distribution. IEEE Trans. Ind. Electron. 2017, 64, 4372–4381. [Google Scholar] [CrossRef]
  19. Son, Y.K.; Lee, S.Y.; Sul, S.K. DC Power System for Fishing Boat. In Proceedings of the 2018 IEEE International Conference on Power Electronics, Drives and Energy Systems (PEDES), Chennai, India, 18–21 December 2018. [Google Scholar] [CrossRef]
  20. Prenc, R.; Cuculić, A.; Baumgartner, I. Advantages of using a DC power system on board ship. J. Marit. Transp. Sci. 2016, 52, 83–97. [Google Scholar] [CrossRef] [Green Version]
  21. Zohrabi, N.; Shi, J.; Abdelwahed, S. An overview of design specifications and requirements for the MVDC shipboard power system. Int. J. Electr. Power Energy Syst. 2019, 104, 680–693. [Google Scholar] [CrossRef]
  22. Chen, L.; Tong, Y.; Dong, Z. Li-Ion Battery Performance Degradation Modeling for the Optimal Design and Energy Management of Electrified Propulsion Systems. Energies 2020, 13, 1629. [Google Scholar] [CrossRef] [Green Version]
  23. Bassam, A.; Phillips, A.; Turnock, S.; Wilson, P.A. Design, modelling and simulation of a hybrid fuel cell propulsion system for a domestic ferry. In Proceedings of the 13th International Symposium on PRActical Design of Ships and Other Floating Structures (PRADS’ 2016), Copenhagen, Denmark, 4–8 September 2016; Technical University of Denmark: Lyngby, Denmark, 2016; pp. 545–553. [Google Scholar]
  24. Spagnolo, G.S.; Papalilo, D.; Martocchia, A. Eco friendly electric propulsion boat. In Proceedings of the 2011 10th International Conference on Environment and Electrical Engineering, Rome, Italy, 8–11 May 2011; pp. 1–4. [Google Scholar] [CrossRef]
  25. Malla, U. Design and sizing of battery system for electric yacht and ferry. Int. J. Interact. Des. Manuf. 2020, 14, 137–142. [Google Scholar] [CrossRef]
  26. Liaw, B.Y.; Nagasubramanian, G.; Jungst, R.G.; Doughty, D.H. Modeling of lithium ion cells—A simple equivalent-circuit model approach. Solid State Ionics 2004, 175, 835–839. [Google Scholar] [CrossRef]
  27. Wei, Z.; Zhao, J.; Xiong, R.; Dong, G.; Pou, J.; Tseng, K.J. Online Estimation of Power Capacity With Noise Effect Attenuation for Lithium-Ion Battery. IEEE Trans. Ind. Appl. 2019, 66, 5724–5735. [Google Scholar] [CrossRef]
  28. Li, Y.; Wei, Z.; Xiong, B.; Vilathgamuwa, D.M. Adaptive Ensemble-Based Electrochemical-Thermal-Degradation State Estimation of Lithium-ion Batteries. IEEE Trans. Ind. Electron. 2021. [Google Scholar] [CrossRef]
  29. Saw, L.H.; Somasundaram, K.; Ye, Y.; Tay, A.A.O. Electro-thermal analysis of Lithium Iron Phosphate battery for electric vehicles. J. Power Sources 2014, 249, 231–238. [Google Scholar] [CrossRef]
  30. Omar, N.; Monem, M.A.; Firouz, Y.; Salminen, J.; Smekens, J.; Hegazy, O.; Gaulous, H.; Mulder, G.; Van den Bossche, P.; Coosemans, T.; et al. Lithium iron phosphate based battery-Assessment of the aging parameters and development of cycle life model. Appl. Energy 2014, 113, 1575–1585. [Google Scholar] [CrossRef]
  31. Tremblay, O.; Dessaint, L.A. Experimental validation of a battery dynamic model for EV applications. World Electr. Veh. J. 2009, 2, 930–939. [Google Scholar] [CrossRef] [Green Version]
  32. Zhu, C.; Li, X.; Song, L.; Xiang, L. Development of a theoretically based thermal model for lithium ion battery pack. J. Power Sources 2013, 223, 155–164. [Google Scholar] [CrossRef]
  33. Wei, Z.; Zou, C.; Leng, F.; Soong, B.H.; Tseng, K. Online Model Identification and State-of-Charge Estimate for Lithium-Ion Battery With a Recursive Total Least Squares-Based Observer. IEEE Trans. Ind. Electron. 2018, 65, 1336–1346. [Google Scholar] [CrossRef]
  34. Hannan, M.A.; Hossain Lipu, M.S.; Hussain, A.; Mohamed, A. A review of lithium-ion battery state of charge estimation and management system in electric vehicle applications: Challenges and recommendations. Renew. Sustain. Energy Rev. 2017, 78, 834–854. [Google Scholar] [CrossRef]
  35. D’Agostino, F.; Kaza, D.; Martelli, M.; Schiapparelli, G.-P.; Silvestro, F.; Soldano, C. Development of a Multiphysics Real-Time Simulator for Model-Based Design of a DC Shipboard Microgrid. Energies 2020, 13, 3580. [Google Scholar] [CrossRef]
  36. Zahedi, B.; Norum, L.E. Modeling and Simulation of All-Electric Ships With Low-Voltage DC Hybrid Power Systems. IEEE Trans. Power Electron. 2013, 28, 4525–4537. [Google Scholar] [CrossRef]
  37. Widmann, J.; Nerbun, A.; Koniers, J. Modular/Compact Hybrid Electric Drive and Permanent Magnet Motor for FFX-II. In Proceedings of the 2019 IEEE Electric Ship Technologies Symposium (ESTS), Washington, DC, USA, 14–16 August 2019; pp. 438–444. [Google Scholar] [CrossRef]
  38. Kirtley, J.L.; Banerjee, A.; Englebretson, S. Motors for Ship Propulsion. Proc. IEEE 2015, 103, 2320–2332. [Google Scholar] [CrossRef]
  39. Yanamoto, T.; Izumi, M.; Yokoyama, M.; Umemoto, K. Electric Propulsion Motor Development for Commercial Ships in Japan. Proc. IEEE 2015, 103, 2333–2343. [Google Scholar] [CrossRef]
  40. Zahedi, B.; Norum, L.E.; Ludvigsen, K.B. Optimized efficiency of all-electric ships by dc hybrid power systems. J. Power Sources 2014, 255, 341–354. [Google Scholar] [CrossRef]
  41. Fan, L.; Xiao, C.; Chao, X.; Zhang, H.; Lu, Y.; Song, E. Energy Efficiency Analysis of Parallel Ship Gas-Battery Hybrid Power System. In Proceedings of the 2019 5th International Conference on Transportation Information and Safety (ICTIS), Liverpool, UK, 14–17 July 2019; pp. 1111–1116. [Google Scholar] [CrossRef]
  42. Yu, X.; Khambadkone, A.M. Reliability analysis and cost optimization of parallel-inverter system. IEEE Trans. Ind. Electron. 2012, 59, 3881–3889. [Google Scholar] [CrossRef]
  43. Zhang, D.; Wang, F.; Burgos, R.; Lai, R.; Boroyevich, D. Impact of interleaving on AC passive components of paralleled three-phase voltage-source converters. IEEE Trans. Ind. Appl. 2010, 46, 1042–1054. [Google Scholar] [CrossRef]
  44. Li, J.; Yang, Q.; Robinson, F.; Liang, F.; Zhang, M.; Yuan, W. Design and test of a new droop control algorithm for a SMES/battery hybrid energy storage system. Energy 2017, 118, 1110–1122. [Google Scholar] [CrossRef]
  45. Bandhauer, T.M.; Garimella, S.; Fuller, T.F. Temperature-dependent electrochemical heat generation in a commercial lithium-ion battery. J. Power Sources 2014, 247, 618–628. [Google Scholar] [CrossRef]
  46. Coppola, T.; Fantauzzi, M.; Miranda, S.; Quaranta, F. Cost/benefit analysis of alternative systems for feeding electric energy to ships in port from ashore. In Proceedings of the 2016 AEIT International Annual Conference (AEIT), Capri, Italy, 5–7 October 2016. [Google Scholar] [CrossRef]
  47. Sulligoi, G.; Vicenzutti, A.; Menis, R. All-electric ship design: From electrical propulsion to integrated electrical and electronic power systems. IEEE Trans. Transp. Electrif. 2016, 2, 507–521. [Google Scholar] [CrossRef]
  48. Yazdani, A.; Iravani, R. DC/AC Half-Bridge Converter. In Voltage-Sourced Converters in Power Systems: Modeling, Control, and Applications; IEEE: New York, NY, USA, 2010; pp. 21–47. [Google Scholar] [CrossRef]
Figure 1. Propulsion RPM (left) and vessel speed (right) according to the operation profile.
Energies 14 05264 g001
Figure 2. Propulsion RPM and vessel speed graph according to the operation profile.
Energies 14 05264 g002
Figure 3. Load profile according to the operation profile.
Energies 14 05264 g003
Figure 4. Simulation of the propulsion motor.
Energies 14 05264 g004
Figure 5. Results of simulation of the propulsion motor.
Energies 14 05264 g005
Figure 6. Two parallel configurations of two-level inverters for propulsion.
Energies 14 05264 g006
Figure 7. Simulation for BESS capacity design.
Energies 14 05264 g007
Figure 8. BESS charge/discharge profile according to target vessel operation.
Energies 14 05264 g008
Figure 9. Schematic diagram of the proposed DC distribution structure.
Energies 14 05264 g009
Figure 10. Schematic diagram of battery charging sequence—shore operational mode.
Energies 14 05264 g010
Figure 11. Schematic diagram of the battery discharge sequence—cruising operational mode.
Energies 14 05264 g011
Figure 12. Schematic diagram of the discharge reflecting battery accident situation—Fault 1.
Energies 14 05264 g012
Figure 13. Schematic diagram of the discharge reflecting battery accident situation—Fault 2.
Energies 14 05264 g013
Figure 14. Schematic diagram after removing the battery side DC/DC converter.
Energies 14 05264 g014
Figure 15. Nonideal half-bridge converter equivalent circuit.
Energies 14 05264 g015
Figure 16. Nonideal half-bridge converter average equivalent circuit.
Energies 14 05264 g016
Figure 17. Simplified nonideal half-bridge converter average equivalent circuit.
Energies 14 05264 g017
Figure 18. Nonideal 2-level converter average equivalent circuit.
Energies 14 05264 g018
Figure 19. MATLAB/ SIMULINK simulation diagram of the average power loss of 3-phase 2-level converters.
Energies 14 05264 g019
Figure 20. MATLAB/ SIMULINK model of 500 kW DC/AC inverter power loss.
Energies 14 05264 g020
Figure 21. 1 MW VFD inverter power loss model and loss look up table (a) and current and frequency (b) according to propulsion power.
Energies 14 05264 g021aEnergies 14 05264 g021b
Figure 22. MATLAB/ SIMULINK model of 1 MW DC/DC converter power loss.
Energies 14 05264 g022
Figure 23. MATLAB/ SIMULINK model of the DC distribution loss.
Energies 14 05264 g023
Figure 24. Simulation results for the power and energy loss of 500 kW DC/AC inverter #1, #2.
Energies 14 05264 g024
Figure 25. Simulation results for the power and energy loss of 1 MW VFD inverter #1, #2.
Energies 14 05264 g025
Figure 26. VFD inverter efficiency graph according to the input power.
Energies 14 05264 g026
Figure 27. Simulation results for the power loss of 1 MW DC/DC converters #1, #2.
Energies 14 05264 g027
Figure 28. Simulation results for the total energy loss of 2 MW DC/DC converters.
Energies 14 05264 g028
Figure 29. BESS charge/discharge profile reflecting the entire system loss according to the operation profile.
Energies 14 05264 g029
Figure 30. Workflow chart for comprehensive design of DC shipboard power system for pure electric propulsion ship based on BESS.
Energies 14 05264 g030
Table 2. Target ferry operation profile.
Operations of Target FerryLand ↔ IslandIsland AnchorageLand Anchorage
Distance2.7 nautical miles one way (5 km)--
SpeedUp to 11 knots0 knots0 knots
Propulsion Power1740 kW3.3 kW0 kW
Auxiliary load150 kW150 kW0 kW
Time required15 min. (one way)15 min75 min (BESS charging)
Table 3. 2.5 MW class motor simulation parameters.
ItemValueItemValue
TypeIPMSMResistance0.0022 Ohm (0.012 p.u.)
Power rating2.5 MWD-axis inductance0.19 mH (0.69 p.u.)
Voltage rating (line-line rms)690 VQ-axis inductance0.34 mH (1.23 p.u.)
Current rating (rms)2100 ARated speed1650 r/min
No. of poles8--
Publisher’s Note: MDPI stays neutral with regard to jurisdictional claims in published maps and institutional affiliations.