Article

Energy Efficiency and Decarbonization in the Context of Macroeconomic Stabilization

by
Anna Misztal
1,
Magdalena Kowalska
1,
Anita Fajczak-Kowalska
2 and
Otakar Strunecky
3,*
1
Faculty of Economics and Sociology, University of Lodz, 90-214 Lodz, Poland
2
Institute of Information Technology, Lodz University of Technology, 90-924 Lodz, Poland
3
The Institute of Technology and Business, 370-05 České Budějovice, Czech Republic
*
Author to whom correspondence should be addressed.
Energies 2021, 14(16), 5197; https://doi.org/10.3390/en14165197
Submission received: 4 July 2021 / Revised: 12 August 2021 / Accepted: 19 August 2021 / Published: 23 August 2021
(This article belongs to the Special Issue Financial Development and Energy Consumption Nexus)

Abstract

:
Decarbonization is an activity aimed at reducing greenhouse gas emissions to limit climate change and global warming. Ensuring macroeconomic stabilization is the basis for ecological action. The question is whether macroeconomic stabilization helps companies, institutions and countries act for decarbonization. This article presents research on the impact of components of macroeconomic stabilization on decarbonization and energy efficiency in the largest greenhouse gas emitters in the European Union from 1990 to 2020. We focus on the following countries, France, Germany, Italy, Poland and Spain. The contribution to knowledge is using the pentagon of macroeconomic stabilization to assess macroeconomic stabilization’s impact on decarbonization and energy efficiency. According to the correlation coefficients, the Ordinary Least Squares and the Seemingly Unrelated Regression method, there is a statistically significant impact of components of macroeconomics stabilization on decarbonization and energy efficiency. Moreover, our models show a different strength and direction of relationships between the explained and explanatory variables. Research results confirm the necessity to coordinate the macroeconomic with environmental policy. We think that it is essential to use effective tools of economic support (European Union Emissions Trading System, environmental taxes) and greater pressure from European Union institutions on countries that emit harmful substances.

1. Introduction

Economic growth with respect for nature and social protection is crucial for sustainable development. The critical challenge is to ensure appropriate conditions and quality of life for the present and future generations. Counteracting climate change should focus on an action aimed at reducing the emission of harmful substances and rational management of natural resources. The problem is the discrepancy between economic growth and environmental protection [1,2,3]. Economic growth is very often the primary factor contributing to the destruction of natural resources [4,5,6].
The key challenge for the economies is decarbonization (eliminating carbon dioxide emissions due to their harmfulness to the environment) and increasing energy efficiency (using energy efficiency means acquiring the same effect under the same conditions with less energy). It seems that macroeconomic stabilization (MSP) is essential for decarbonization (DCO2) and energy efficiency (EN) [7,8,9]. Macroeconomic stabilization is one of the goals of state intervention in the economy. It is the configuration of economic indicators, political conditions and the country’s position on global markets [10,11]. The balance in the economy affects citizens’ quality of life and contributes to education and environmental awareness [12,13]. On the other hand, if the governments focus on macroeconomic stabilization, it may neglect or reduce socially and environmentally responsible activities.
A novelty in the article is using the macroeconomic stabilization pentagon to assess the impact of macroeconomic stabilization and its components on decarbonization and energy efficiency. Most researchers emphasize that economic growth, globalization and urbanization increase carbon dioxide emissions [14,15,16]. It seems that the impact of macroeconomic stabilization on decarbonization is still unclear.
This paper aims to assess the impact of internal (MSPI) and external factors (MSPE) of macroeconomic stabilization on decarbonization and energy efficiency in the largest greenhouse gas emitters in the European Union from 1990 to 2020. The analyzed problem is important, current and poorly recognized. We focus on five countries Germany, Spain, France, Italy and Poland. Most of the analyzed countries have a high level of economic growth. The exception here is Poland, which belongs to the emerging and developing economies [17].
We use the Pearson’s r, Spearman-s Rho, Gamma and Kendall rank correlation coefficients, Ordinary Least Square (OLS) and the Seemingly Unrelated Regression (SUR). Linear regression methods have some limitations. They are not very resistant to the few observations that differ significantly from the others. Moreover, it is necessary to use tests to assess linearity, normality of distribution, homoscedasticity and autocorrelation.
We create three types of indicators, decarbonization, energy efficiency and macroeconomic stabilization. We separated five components (relations) of MSP: the relation between the rate of economic growth and unemployment rate (A), the unemployment rate and inflation rate (B), inflation rate and the budget (C), the budget and the current account balance (D), current account balance and economic growth (E).
The presented model can support economic decisions that respect the climate aspect. The model will also help identify which triangle of macroeconomic stabilization pentagon is essential for the decarbonization process and energy efficiency.

2. Conceptual Background

Decarbonization aims to systematically reduce carbon dioxide emissions to the atmosphere, which is crucial to stop global warming [18,19]. Decarbonization can follow various scenarios, including high energy efficiency, diversified supply technologies, high renewable energy sources, delayed carbon capture and storage and low nuclear. The key challenge is implementing an economic growth model to consider social and environmental goals [20,21].
Economic growth often leads to increased carbon emissions and the degradation of the natural environment [4,22,23,24]. There is a statistically significant negative relationship between carbon dioxide emissions, trade openness and gross domestic product. In energy-dependent economies, economic growth is strongly correlated with energy consumption, which requires shifting the energy mix to renewable energy sources [16]. Gross capital formation, globalization, urbanization and technological innovation increase CO2 [23,25]. On the other hand, global financial development and renewable energy consumption positively impact the environment [26,27].
A more comprehensive approach to the research problem requires assessing the impact of macroeconomic stabilization on decarbonization. Macroeconomic stabilization means equilibrium in the real and monetary sphere [28]. It is a dynamic macroeconomic system in which the price mechanism operates smoothly, and there is full use of the production capacity [5,9]. Macroeconomic stabilization is essential for business, national and international authorities, institutions, rating agencies and investors. It stimulates investments (helps assess investment risk) and strengthens the economic activity [17,29,30].
Some of the researchers emphasize that macroeconomic stabilization positively impacts sustainable development [9]. Moreover, deep decarbonization is the basis for long-term economic growth (in developed countries) [18,31,32,33,34]. The situation looks different in emerging and developing economies whose industries are dependent on coal power (maintaining macroeconomic stabilization may increase carbon dioxide emissions) [35,36,37]. Hence, investing (generating additional costs) in new green technologies and eco-friendly solutions are essential here [35].
Economic growth (GDP growth or, more broadly, maintaining macroeconomic stabilization) must align with social and environmental goals. In the long run, macroeconomic stabilization should reduce carbon dioxide emissions to the atmosphere. Macroeconomic stabilization increases research and development and environmental awareness [9,38,39,40]. Of course, decarbonization requires additional financial outlays, changes in the energy balance and environmentally friendly technologies [41,42,43,44]. On the other hand, decarbonization should improve the country’s trade balance (resulting from a decline in fuel imports fossil). The low-carbon economy can bring many benefits, including investments, improved quality of life, less degradation of the natural environment [45,46,47].
There is a consensus in the scientific literature that limiting global warming requires a profound and rapid transformation in economic activity structure (production, urban, industrial, transport) [26]. It is related to the necessity of changes in relative energy prices, investments in green infrastructure, production capacity, renewable energy sources [27,48,49].
The research complements the literature on the subject, in which there is no assessment of the impact of strictly macroeconomic stabilization on decarbonization and economic efficiency. Such a study allows assessing which components of macroeconomic stability are crucial for the implementation of climate policy.

3. Research Methodology

The main aim of the research is to assess the impact of internal and external factors of macroeconomic stabilization on decarbonization and energy efficiency in the largest greenhouse gas emitters in the European Union from 1990 to 2020. The research sample covers the countries with the largest emitters of carbon dioxide in the EU. Considering this, we focus on the five countries, including Germany, Poland, France, Italy and Spain. A common feature of the analyzed countries is the great importance of hard coal for economic growth, high population, participation in the European Union and related environmental funds benefits [9]. All countries, except Poland (a developing country), have high socio-economic growth, high expenditure on research and development, innovation and widespread use of new technologies, including environmentally friendly technologies [5,17]. Moreover, in most countries, the political system is stable and society’s ecological awareness is high [29].
Moreover, international institutions and organizations, including the European Union, began to take more radical steps to reduce the emission of harmful substances into the environment (climate agreement). The central research hypothesis is: “The internal and external components of the macroeconomic stabilization have a different statistically significant impact on decarbonization and energy efficiency in the EU countries with the largest emission of carbon dioxide in the period from 1990 to 2020”.
The justification for such a research hypothesis is that macroeconomic stabilization is crucial for economic growth. It means maintaining an appropriate level and relationship between GDP, stable and low inflation, a balanced budget and low public debt, low (market) interest rates, high and stable level of employment (low level of unemployment), stable exchange rate (especially concerning the currencies of the largest regional partners). The stability of economic indicators affects investments and the economic situation, leads to the development of society. There is a greater emphasis on meeting the new needs of humanity, improving citizens’ quality of life and health. From this perspective, macroeconomic stability is one of the conditions for starting climate and environmental action.
The study assesses only macroeconomic stabilization influencing the decarbonization processes or energy efficiency. It is a severe limitation because it does not analyze qualitative factors (legal regulations, public awareness, the quality of implemented environmental programs) and other quantitative factors (expenditure on innovation, economic structures, financing of environmental protection). These determinants will be the subject of our further research.
We also formulate the sub hypotheses as follows:
Hypothesis 1 (H1).
There is a greater statistical impact of MSPI on DCO2 than MSPE on DCO2 in the analyzed countries in the period from 1990 to 2020.
Hypothesis 2 (H2).
There is a greater statistical impact of MSPE on EN than MSPI on EN in the analyzed countries in the period from 1990 to 2020.
Hypothesis 3 (H3).
The components of macroeconomic stabilization have a different impact on decarbonization and energy efficiency in the analyzed countries.
Our research consists of free stages:
(1)
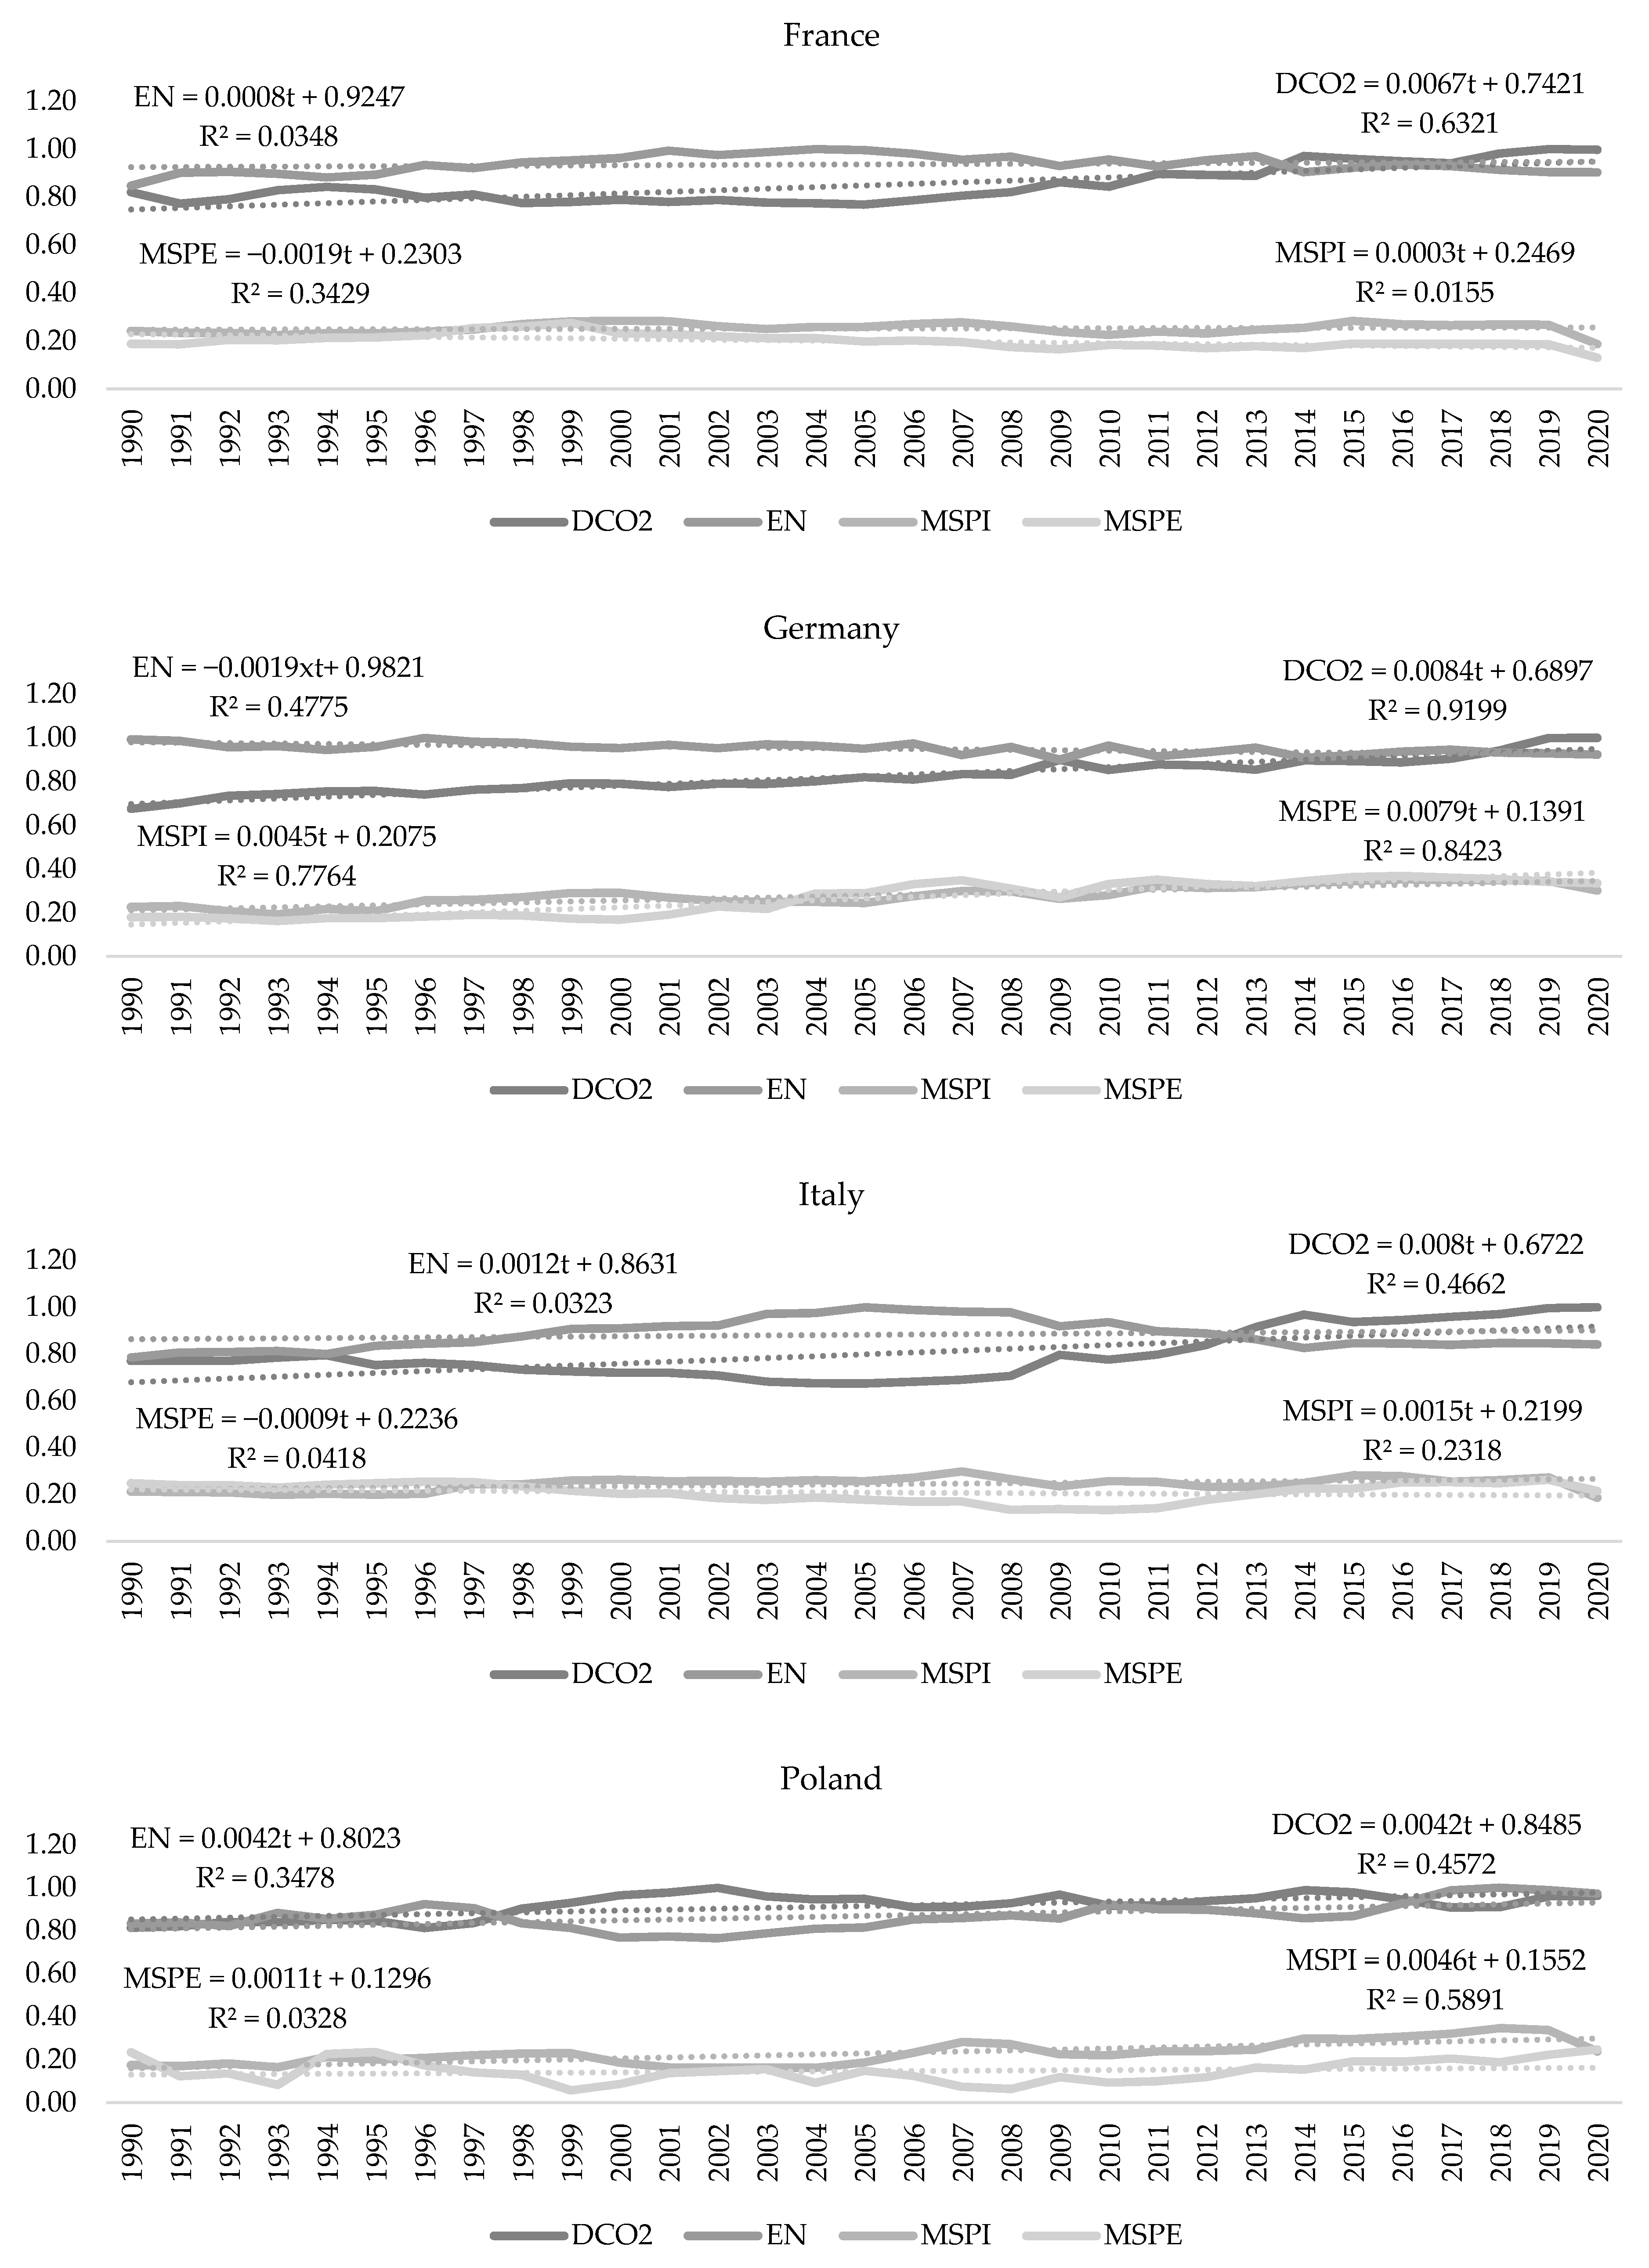
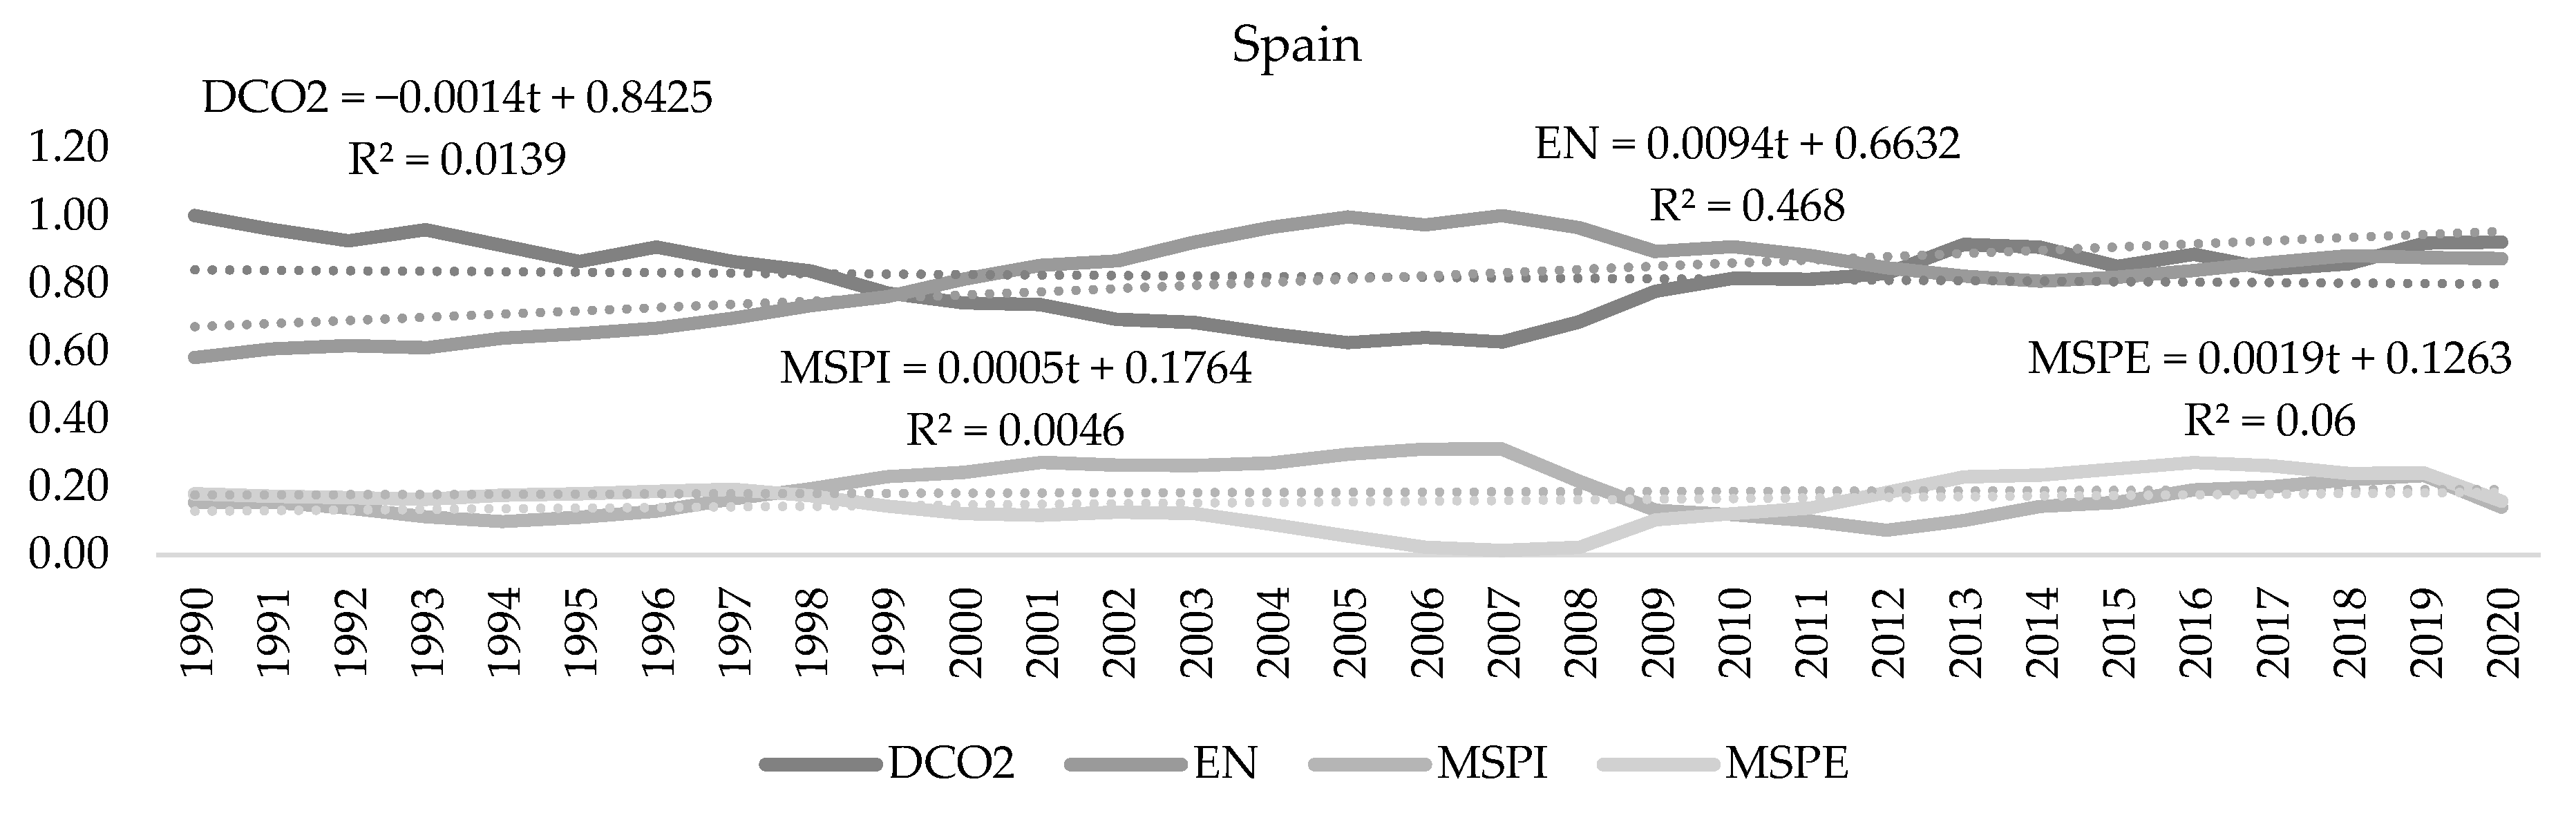
Creation of indicators: we create the indicators: DCO2, EN, MSP, MSPI, MSPE by normalizing diagnostic variables,
(2)
Hypothesis verification:
-
we check the level of dependence between the analyzed variables using the t Pearson’s r, Spearman-s Rho, Gamma and Kendall rank correlation coefficients,
-
we create two types of models allowing for the assessment of relationships between variables (dependent variables are: DCO2 and EN):
Model 1: the OLS estimation, explanatory variables: MSPI, MSPE MSPI(t−i), MSPE(t−i),
Model 2: the SUR method, explanatory variables: A, A(t−1), B, B(t−1), C, C(t−1), D, D(t−1), E, E(t−1), DCO2, DCO2(t−1), EN, EN(t−1).
(3)
Conclusion and discussion.
-
We use the Gretl and Statistica to estimate our models.
First, we create the indicators of decarbonization and energy efficiency. We transform the explanatory variables to unify their measuring scales using the following formulas [9]:
DCO 2 ij = minCO 2 ij CO 2 ij ,
where DCO2ij—stands for the normalized value of the j-th variable in the i-th year; CO2ij is the value of the j-th variable in the i-thyear (tonnes); min CO2ij is the lowest value of the j-th variable in the i-th year.
EN ij = ENE ij max   ENE ij ,
where ENij—stands for the normalized value of the j-th variable in the i-th year, ENEij (million tonnes of oil equivalent) is the value of the j-th variable in the i-year (stimulant), maxiENEij is the highest value of the j-th variable in the i-th year
We calculate the indicator of macroeconomic stabilization based on a method of macroeconomic stabilization pentagon. This approach is a method of analysis of the economy and is derived from the concept of the so-called magic quadrangle, which Mundell and Phillips proposed [50,51]. Their model presents the economic situation in terms of full employment, rapid growth, external balance and low inflation. In 1990, this concept was extended the magic quadrangle model by adding criterion (state budget). In 1993, the macroeconomic stabilization pentagon model was developed by Polish economist, Deputy Prime Minister and Minister of Finance—Grzegorz W. Kołodko [28].
The macroeconomic stabilization pentagon is shown in Figure 1.
The macroeconomic stabilization pentagon focuses on five characteristics, which should guarantee the economy’s stability. A synthetic approach to macroeconomic stability shapes base on five basic macroeconomic categories for each year [28]:
-
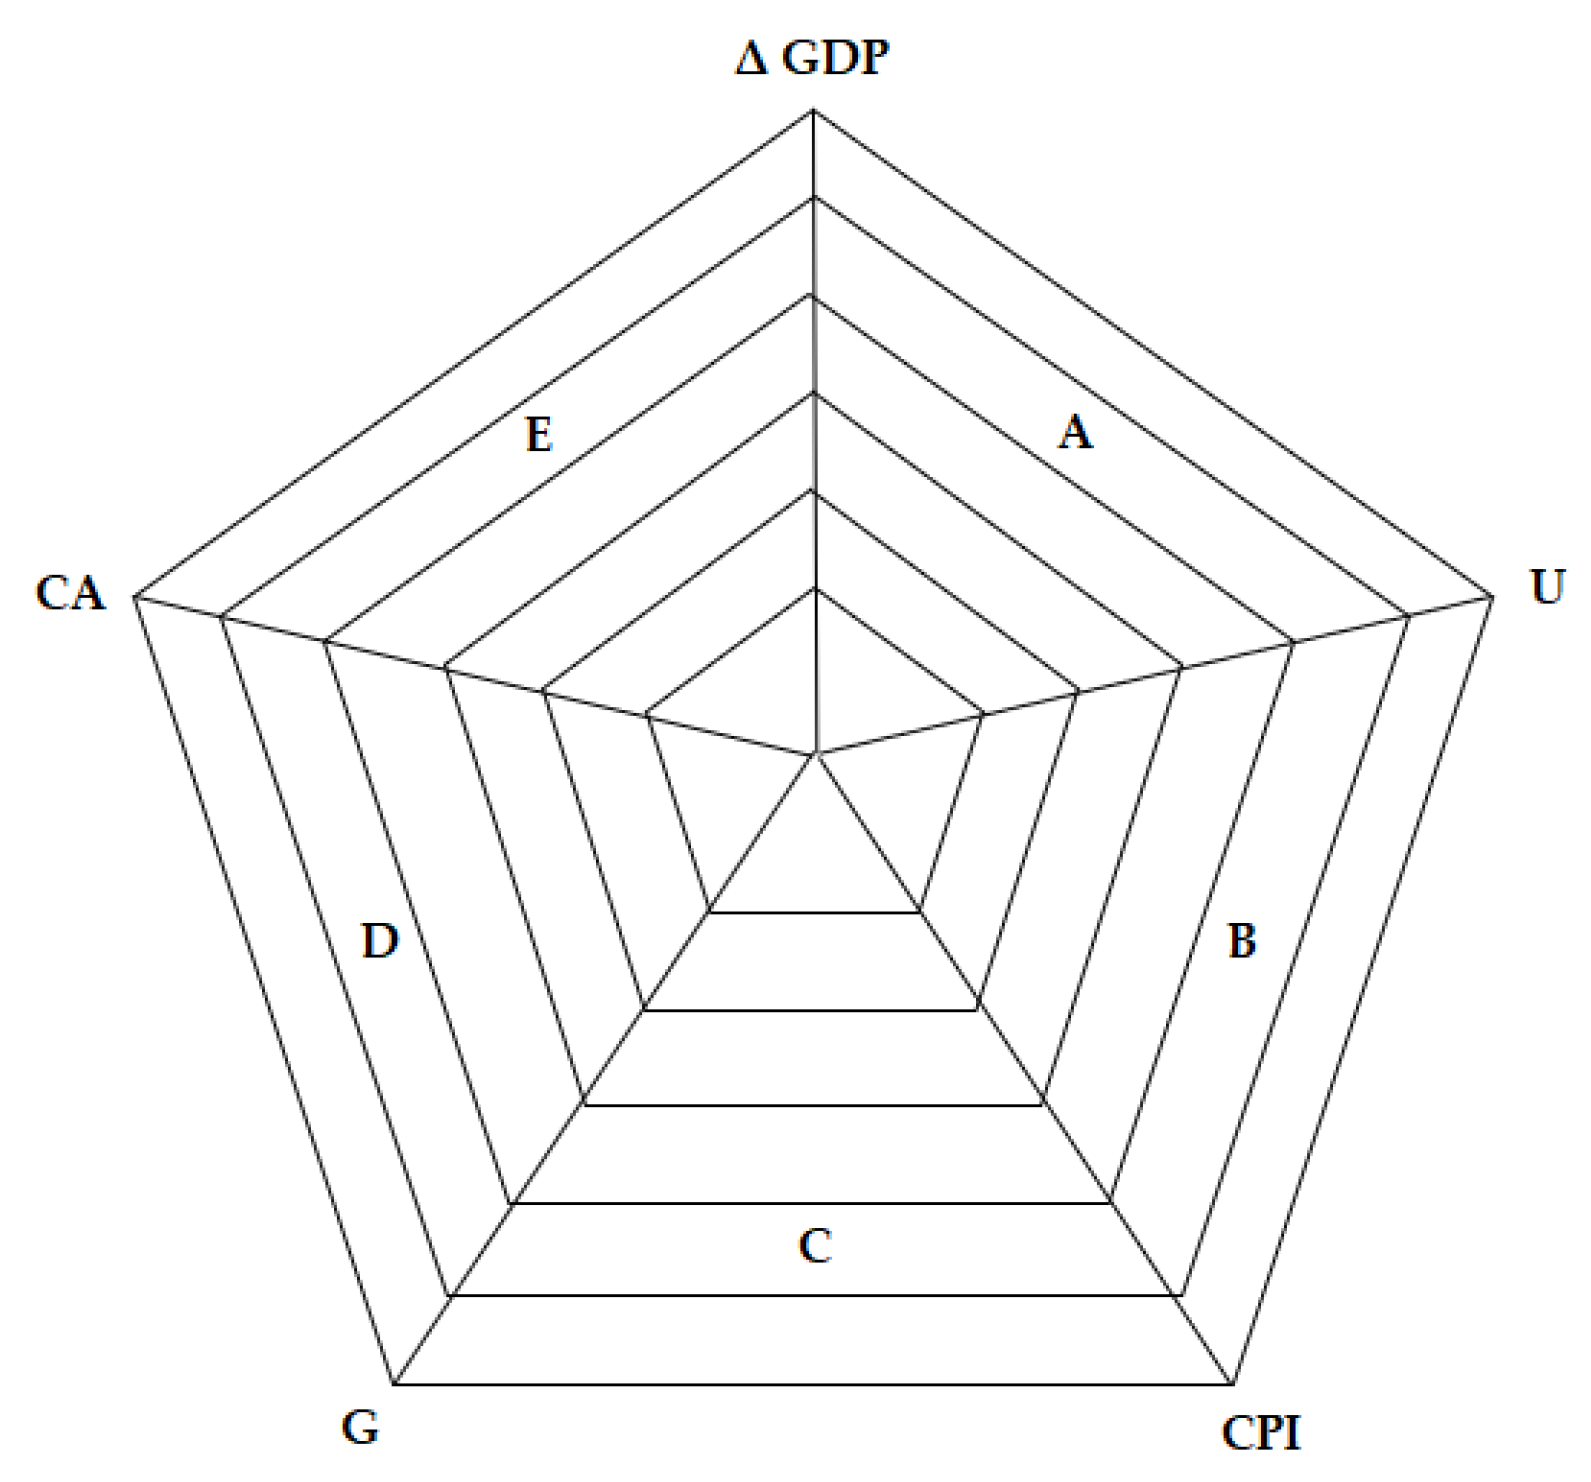
ΔGDP—GDP growth rate (%),
-
U—unemployment rate (%),
-
CPI—inflation rate (%),
-
G—state budget balance as (%) of GDP,
-
CA—current account balance as (%) of GDP.
The above indicators must be properly scaled or—saying more precisely—included in five vertices of the macroeconomic stabilization pentagon. The pentagon’s vertices are scaled so that if the levels of indicators are better, the points representing them are further from the center of the pentagon. The macroeconomic stabilization pentagon consists of five fields of triangles representing both the internal and external balance of a country.
Internal factors that determine the achievement of macroeconomic stabilization by the economy are included in triangles A, B and C, while external factors are analyze in the triangle’s D and E.
To calculate the total field of MSP we use the following formula:
MSP = MSPI + MSPE = A + B + C + D + E = [(ΔGDP·U) + (U·CPI) + (CPI·G) + (G·CA) + (CA·ΔGDP)]·k
where MSPI = A + B + C, MSPE = D + E, A = ΔGDP·U·k—presents triangle area called the real sphere triangle and characterizes the relation between the rate of economic growth and unemployment rate; B = U·CPI·k—stands for the stagflation triangle which depends on the unemployment rate and inflation rate; C = CPI·G·k—is defined as the budget and inflation triangle; D = G·CA·k—is called the financial equilibrium triangle and depends on the budget and the current account balance; E = CA·ΔGDP·k—means the external sector triangle and shows the variability of current account balance and rate of economic growth; k = 1/2 sin 72 (°) = 0.475—is a constant value.
First, we examine the strength and direction of a linear relationship between the MSP, MSPI, MSPE, DCO2 and EN. To do this, we use Pearson’s r, Spearman-s Rho, Gamma and Kendall rank correlation coefficients. We adopt the ranges of correlation strength that were suggested by Evans: |rxy| = 0—no correlation; 0 <|rxy| ≤ 0.19—very weak; 0.20 ≤ |rxy| ≤ 0.39—weak; 0.40 ≤ |rxy| ≤ 0.59—moderate; 0.60 ≤ |rxy| ≤ 0.79—strong; 0.80 ≤ |rxy| ≤ 1.00—very strong [52].
To assess the Model 1, we apply the OLS method. We checked the assumption of the method, including unit root tests (KPSS test), homoskedaskity (White test), autocorrelation (Durbin-Watson and Breuscha-Godfreya tests), normality (Doornik-Hansen test), collinearity (Variance Inflation Factor).
The simple linear regression is given by the following formula [53]:
DCO 2 i = β 0 + β 1 · MSPI i + β 2 · MSPI ( t i ) + β 3 · MSPE i + β 4 · MSPE ( t i ) + β 5 · DCO 2 ( t i ) + ε i
EN i = β 0 + β 1 · MSPI i + β 2 · MSPI ( t i ) + β 3 · MSPE i + β 4 · MSPE ( t i ) + β 5 · EN ( t i ) + ε i
where DCO 2 i ,   EN i are the dependent variable; DCO 2 ( t i ) ,   EN ( t i ) i are the independent variable from previous period; MSPIi and MSPEi are an independent variable; β0 is the intercept, β1,…,β5 are the slope; εi denotes the i-th residual; i is an observation index.
The estimated models are given by the equations [54]:
DCO 2 i = β ^ 0 + β ^ 1 · MSPI i + β ^ 2 · MSPI ( t i ) + β ^ 3 · MSPE i + β ^ 4 · MSPE ( t i ) + β ^ 5 · DCO 2 ( t i ) + e i = DCO 2 ^ i + e i ,
EN i = β ^ 0 + β ^ 1 · MSPI i + β ^ 2 · MSPI ( t i ) + β ^ 3 · MSPE i + β ^ 4 · MSPE ( t i ) + β ^ 5 · EN ( t i ) + e i = EN ^ i + e i ,
We adopt the following ranges of the coefficient of determination (R2) [55]: 0.0–0.5—unsatisfactory fit, 0.5–0.6—weak fit, 0.6–0.8—satisfactory fit, 0.8–0.9—good fit, 0.9–1.0—perfect fit.
Model 2: we use the structural equation model to assess the impact of A, B, C, D, E, DCO2, DCO2(t−1) and En, En(t−1) on DCO2 and En. The model is based on formula:
{ DCO 2 = β 0 + β 1 · A i + β 2 · B i + β 3 · C i + β 4 · D i + β 5 · E i + β 6 · EN i + β 7 · EN ( t 1 ) i + β 8 · DCO 2 ( t 1 ) i EN = β 0 + β 1 · A i + β 2 · B i + β 3 · C i + β 4 · D i + β 5 · E i + β 6 · DCO 2 i + β 7 · DCO 2 ( t 1 ) i + β 8 · EN ( t 1 ) i
We use feasible generalized least squares to estimate the SUR model. The residuals from our regression are used to estimate the elements of matrix [56]:
σ ^ ij = 1 R ε ^ i T · ε ^ j
Then, we run generalized least squares regression for using the variance matrix:
Ω = Ω I R β ^ = ( X T · ( ^ 1 I R ) · X ) 1 · X T · ( ^ 1 I R ) · y
The formula for the SUR estimator is as follows:
R · ( β ^ β ) d Ɲ ( 0 , ( 1 R · X T · ( 1 I R ) · X ) 1 )
where R—the number of observations, Ω—covariance matrix, X—equations, IR—the R-dimensional identity matrix; ⊗ denotes the matrix Kronecker product; ^ —the matrix, y—vector.

4. Research Results

Figure 2 presents the DCO2, MSPI, MSPE and EN in Germany, Poland, Italy, France and Spain from 1990 to 2020. In most countries, DCO2 increases, the exception here is Spain (α = −0.0014). The negative trend of DCO2 in Spain was in 1996–2007, which resulted from economic conditions, the need to develop country coal deposits and the increase in import of hard coal. Since the last economic crisis in Spain, there is a positive DCO2 trend. This phenomenon is particularly important due to the economic crisis that has hit Spain particularly hard (negative GDP, high unemployment, high inflation, decline in investments). It can result from restrictive EU regulations ordering to decrease the emission of harmful substances to the environment.
EN increase in all countries except Germany. The fundamental transformation of the energy supply, consumption and energy system may explain Germany’s decline EN. The energy transformation has made renewable energy the most important energy source, and it can decrease EN in the short term.
Even though countries have struggled with various socio-economic problems in recent years, they have a positive trend in the MSPI. The increase in MSPI is a consequence of the rational macroeconomic policy and financial support programs of the European Union.
MSPE increases in Germany, Poland and Spain, and decreases in France and Italy from 1990–2020. The last two of these countries have problems with state budget balance and current account balance.
Table 1 shows the Pearson’s r, Spearman-s Rho, Gamma and Kendall rank correlation coefficients. The correlation coefficients between the variables are significant (p < 0.05) in France, Germany and Poland (EN/MSP). There is also a different level of correlation coefficients in terms of strength and direction of impact. A positive relationship is between DCO2/MSP in Germany and EN/MSP in France and Poland. A negative relationship is between DCO2/MSP in France, and En/MSP in Germany.
In France, there is a statistically significant positive relationship between EN/MSPI and a negative relationship between DCO2/MSPE. In Germany, the positive relationship is between DCO2/MSPI, DCO2/MSPE and negative between EN/MSPI, EN/MSPE. In Italy, a positive relationship is between EN/MSPI, DCO2/MSPE. In Poland, the positive relationship is between EN/MSPI, EN/MSPE. In Spain, a positive relationship is between EN/ MSPI, DCO2/MSPE and negative DCO2/MSPI, EN/MSPE.
Analyzes show that, apart from Germany, macroeconomic stabilization usually has a positive effect on EN and a negative on DCO2. In Germany, the situation is different, and it can be resulting from the transformation of the country’s energy system.
Table 2 presents the results of the OLS estimation (DCO2 as a dependent variable) with the explanatory variables MSPI, MSPE from the current and previous period and delayed DCO2. The results meet the OLS estimation conditions, including no collinearity, homoscedasticity, normal distribution of variables and no autocorrelation.
The estimation results indicate that MSPI and MSPE have a statistically significant impact on DCO2. However, it is difficult to indicate which internal or external factors of MSP are more important for DCO2.
In France, there is a statistically significant MSPE(t−2) impact on DCO2, and in Germany, MSPI(t−2) on DCO2. The importance of external factors in France may be related to macroeconomic policy, a good level of trade balance and the importance of exports for the economy. On the other hand, France has a relatively low GDP growth rate (in 1990, DGDP was 2.4, in 2018, 1.51) and an unemployment rate closer to 10% over the entire analyzed period. Despite a low economic growth rate in Germany, there is low inflation and a low unemployment rate. France and Germany are the most economically developed of the analyzed countries. Despite many similarities (including increased environmental awareness), their development paths and approach to ecology are different, hence the impact of only one of the components of MSP.
In countries with a lower level of economic development, Italy, Poland and Spain, both MSPI and MSPE (current and previous periods) impact DCO2. These countries differ in many aspects, ranging from economic policy, internal development conditions and environmental policy. In Spain, in the period from 1990 to 2020, there is a negative decarbonization trend, although in the last decade, DCO2 increases. In Italy there is a significant impact of MSPI, MSPI(t−2), MSPE, MSPE(t−3), in Poland MSPI(t−1), MSPE(t−1) and in Spain MSPI, MSPE(t−3). There is also a clear impact of internal and external MSP from previous periods on decarbonization, which shows that the previously implemented economic policy impacts current DCO2.
In France, Germany, Italy and Poland, there is also the impact of DCO2 from the previous period to the current one, which indicates a continuity of the reduction of carbon dioxide emissions to the atmosphere. No such link has been found in Spain, and this may be because the country is struggling with many problems, including a low level of GDP (negative values) and a high unemployment rate. The importance of coal for the economy and the low level of development of alternative energy sources are also important here.
Table 3 presents the results of the OLS estimation (EN as a dependent variable) with the explanatory variables MSPI, MSPE from the current and previous period and delayed EN. The results of the estimation show that EN depends on the values from previous periods. Moreover, in analyzed countries there is a different impact of MSPI and MSPE on EN. In France, EN is influenced by MSPE(t−2), in Germany by MSPE(t−1), MSPE(t−4), in Italy by MSPE(t−3), in Poland by MSPI and MSPE(t−1) and in Spain by MSPI.
In countries with the highest level of socio-economic growth, MSPE is crucial for EN. It means that the exogenous factors such as international investments, trade balance, implementation of new technologies and the development of R&D contribute to the energy efficiency improvement. A positive impact of MSPE on EN is in France and Italy, and a negative in Germany (this is due to the transformation of the economic system).
In Poland, both MSPI and MSPE(t−1) impact EN. It can be a resulting from the transformation of the economic system. Moreover, the increase in energy efficiency is not correlated with a decrease in energy consumption per capita (in Poland, energy consumption is up to 40% higher than in Western Europe). Moreover, the trade balance is important to improve Poland’s EN. The crucial here is raised imports of new environmentally friendly technologies and open on green consumers from abroad.
In Spain, MSPI has a statistically significant positive impact on EN, which means that internal economic conditions, including ΔGDP, U and CPI, affect EN. The directions of economic growth in Spain is related to the new plan that focus on increasing energy efficiency by 35% to 2030 and introduces a low-carbon economy. Therefore, it will be very important to stabilize public finances and use EU financial aid related to the COVID pandemic.
Table 4 presents the results of the SUR estimation. We examine the impact of A, A(t−1), B, B(t−1), C, C(t−1), D, D(t−1), E, E(t−1), DCO2, DCO2(t−1), EN, EN(t−1) on DCO2 and En. The SUR is a relatively poorly recognized and rarely used model for the estimation of interdependent equations. There are conditions for applying the SUR method, but they are not used restrictively in applied econometrics [57,58,59]. In our model, we avoided autocorrelation and heteroscedasticity, achieved a high level of R-squared and a high p-value for the coefficients.
The coefficient of determination in most countries shows a perfect fit to the model’s data. The exceptions are Germany and Spain. In Germany, it is a weak fit to the model’s data (explained variable EN, R-squared is 0.53), and in Spain, it is a satisfactory fit to the model’s data (explained variable EN, R-squared is 0.77). The Ljung-Box Q’ show that there is no autocorrelation.
The impact of the explanatory variables on DCO2 and EN is different (in terms of area, direction and strength). The SUR estimation results indicate that DCO2 is most frequently influenced (4 times) by C and D from (t) or (t − 1), and the least influenced by B. It means that budget, inflation and current account play an important role in DCO2.
On the other hand, EN is most frequently affected (4 times) by B from the period (t) or (t − 1), and the least influenced by C. It means that unemployment rate and budget and inflation is essential for EN.
The results of the SUR estimation show that in France, DCO2 and EN are influenced by budget, inflation, current account balance and economic growth. In Germany, DCO2 is influenced by economic growth, unemployment rate, budget, current account balance, EN by the unemployment rate, inflation rate, budget and current account balance. In Italy, DCO2 is influenced by the unemployment rate, inflation rate, budget, current account balance, economic growth and EN by the unemployment rate and inflation rate. In Poland, DCO2 is influenced by economic growth, unemployment rate, inflation rate, budget, current account balance and EN by economic growth and unemployment rate. In Spain, DCO2 is influenced by the inflation rate, budget and current account balance, and EN is influenced by economic growth, unemployment rate, inflation rate, budget and current account balance.
DCO2 is most frequently influenced (4 times) by the budget, inflation rate and current account balance. EN is most frequently affected (4 times) by unemployment and inflation.

5. Discussion

According to the United Nations Report, “Pathways to deep decarbonization”, economic growth and decarbonization are two sides of the same coin [60]. Moreover, the deep decarbonization of developed economies can go along with economic growth. Rapid and effective DCO2 is crucial for the environmental policy of many economically developed countries. DCO2 requires focusing on EN on a massive scale and switch energy production to zero-emission sources [18,27,47].
Many researchers emphasize that it was possible to achieve economic growth and reduce CO2 emissions to the atmosphere in several developed countries. These countries are characterized by a low share of coal in electricity production, advanced environmentally friendly technologies and green energy sources [2,17,27].
Apart from economic growth, measured by GDP per capita, several macroeconomic categories affect the quality of life, the level of socio-economic development and the natural environment. Such macroeconomic categories such as U, CPI, G and CA are fundamental for macroeconomic stability, according to our research impact on DCO2 and EN [23,24].
Our research results indicate that DCO2 has a positive trend in France, Germany, Italy, Poland and a negative trend in Spain from 1990 to 2020. It should be emphasized that in Spain after 2007, DCO2 increased rapidly. Moreover, Spanish authorities have a new plan of economic growth, which focuses on increasing energy efficiency by 35% to 2030 and introduces a low-carbon economy. At the same time, EN increased in all countries, except Germany (the trend is slightly declining and can be a result of the changes in energy policy) [8,14,15,16,19].
DCO2 and EN are accompanied by an increase in MSPI in all countries and an increase in MSPE in Germany, Poland and Spain, and decreases in France and Italy. The MSPI and MSPE were undoubtedly influenced by the economic crisis from 2008. It hit Spain the hardest (very high GDP drops, high unemployment rate). Poland was the best through the crisis, with no negative decline in GDP and only a slight increase in unemployment. In France, Germany and Italy, economic indicators decreased (negative GDP, increase U). It seems that after 2014 most of these countries managed to rebuild their economies. Unfortunately, the covid pandemic caused a decline in macroeconomic indicators in 2020.
Actions taken by countries to reduce emissions of harmful substances are effective, although they could be more decisive and faster (the case of Polish mines, which the government is afraid of shutting down due to political goals). These countries are obliged to implement a low-carbon economy due to membership in the European Union. The increasing ecological awareness of society also plays a major role in DCO2.
The Pearson’s r, Spearman-s Rho, Gamma and Kendall rank correlation coefficients indicate a negative statistically significant relationship between DCO2 and MSP in France and a positive in Germany and Italy (in Italy only Pearson’s r). There is also a positive relationship between EN and MSP in France and Poland. A negative relationship is in Germany. MSPI affects positively DCO2 only in Germany and negatively in Spain. Between MSPE and DCO2 it is a positive correlation in Germany, Italy and Spain. There is a positive correlation between MSPI and EN in France, Italy, Poland and Spain, and a negative in Germany. A positive correlation between MSPE and EN is in Poland and Spain. A negative correlation is in Germany. The correlation coefficients are varied, the direction and strength of the impact of MSP, MSPI and MSPE on DCO2 and EN are different. Germany stands out from other countries because they are a negative correlation between MSPI/EN and MSPE/EN. It may result from deep energy reforms and a greater use of renewable energy sources in recent years. It seems that in the short term (until the transformation of the economy into a low-carbon economy), the shift to a low-carbon economy can cause a slight reduction in EN.
MSPI from the current or previous periods has a statistically significant influence on DCO2 in Germany, Italy, Poland and Spain. MSPE affects DCO2 in France, Italy, Poland and Spain. The OLS regressions indicate different directions of impact, which does not make a specific conclusion. This result may indicate differences in economic growth, development factors and different approaches to environmental protection.
On the other hand, the results of the second OLS regression shows that in most countries, MSPE (from previous periods) impact EN (in France, Germany, Italy and Poland). MSPI impact on EN in Spain and Poland. The solution for increasing EN is creating sustainable energy systems that focus on long-term economic and environmental goals, the protection of natural resources and the increase in the use of renewable energy.
The SUR models show that DCO2 is most frequently influenced (4 times) by the budget, inflation rate and current account balance. EN is most frequently affected (4 times) by unemployment and inflation. The positive impact of A on DCO2 is in Germany and on EN in Spain. In Poland, the impact of A on DCO2 is negative and on EN positive. These results confirm the thesis put forward by several researchers that in developed countries such as Germany and Spain, GDP growth is accompanied by an increase in DCO2 (Germany) and EN (Spain). Developing and emerging economies (especially energy-intensive economies) must change the economy’s structure and move away from fossil fuels [2,8,21].
The solution for EN is creating sustainable energy systems, which are focus on long-term economic and environmental goals, the protection of natural resources and the increase in the use of renewable energy [4,16,26,27]. Changes in the structure of European economies and increasing the use of renewable energy sources are a priority for improving energy EN.
Our research confirms the central research hypothesis. The internal and external factors of macroeconomic stabilization have a statistically significant impact on decarbonization and energy efficiency in the EU countries, with the largest carbon dioxide emission from 1990 to 2020. However, the direction and the strengths of the impact of MSPI and MSPE on DCO2 is diversified. In France, Germany and Italy, there is an impact of MSPE from previous periods on EN. In Poland, MSPI and MSPE from the previous period. In Spain, MSPI impacts on EN.
We cannot confirm the first sub-hypothesis because MSPI has no more significant impact on DCO2 than MSPE from 1990 to 2020. The strengths and directions of MSPI and MSPE on DCO2 are different in all analyzed countries.
We confirm the second sub-hypothesis because MSPE has a higher impact on EN than MSPI from 1990 to 2020. MSPE is essential in France, Germany, Italy and Poland. Only in Spain, there is no statistically significant influence of MSPE on EN.
We confirm the third sub-hypothesis because A, B, C, D and E have different impacts on DCO2 and EN in the analyzed countries. DCO2 is most frequently affected by budget, inflation rate and current account balance. EN is influenced by the unemployment and inflation rate.
MSPI and MSPE are essential for DCO2 and EN. A responsible macroeconomic policy is a key to achieving the SDGs. It is necessary to change the economic structure, move away from hard coal, develop R&D, introduce ecological technologies and shift the economy to greater energy from renewable sources.
The research has several limitations, including research sample (we focus only on countries with the highest emission of CO2), variable normalization and estimation methods. However, the estimates meet the rigorous assumptions of statistical methods and can be used for further interesting analyzes and conclusions.
DCO2 and EN are essential to ensure sustainable development. Undoubtedly, it is necessary to implement agreements and frameworks to achieve climate neutrality. The course of action of the European Commission is correct and requires action in all member states. It is crucial to develop the financial and monetary policy instruments, including financial outlays on environmental protection, environmental taxes, renewable energy sources and R&D, prices of futures contracts for carbon dioxide emissions and the EU Emissions Trading System. It is also necessary to mobilize additional funds to introduce changes to the economy’s sectors (transformation of the energy and mining sectors is fundamental). Apart from the instruments and tools of macroeconomic policy, it is essential to increase the awareness of societies about climate change. Hence, it is necessary to increase spending on education, research and innovation.
The fundamental issues should oscillate around increasing the ecological awareness of the society through appropriate education, taking actions to protect the natural environment (even at the cost of slowing down the economic growth). Undoubtedly, the share of renewable energy should also be increased, and ecological investments should be implemented [4,7,18,23]. It is necessary to expand and reform economic instruments of environmental protection. Financial outlays on environmental protection, environmental taxes, renewable energy sources, prices of futures contracts for carbon dioxide emissions, outlays on R&D, EU Emissions Trading System should be of key importance here. Essential is to increase the share of environmental taxes in the total fiscal burden and implement a more efficient emissions trading system [43,44,47,49].
In our future research, we will focus on assessing the impact of other components of sustainable development, including social and environmental development, on decarbonization. Moreover, we would prefer to create models for all the European Union countries. The analyzes can contribute to the shaping of a more effective policy of environmental protection.

6. Conclusions

The burning of fossil fuels still produces the vast majority of the energy needed for the functioning and development of economies. At the same time, it emits greenhouse gases which contribute to climate change. DCO2 is necessary to limit global warming. Its effectiveness depends on EN and the conversion of energy production to zero-emission sources.
DCO2 and EN are crucial to stop global warming, so it is necessary to maintain an appropriate balance between economic growth and environmental protection. In economic practice, this requires taking actions aimed at achieving economic, social and environmental goals. It is essential to understand that these actions cannot be mutually exclusive.
Our research confirms that MSPI and MSPE impact DCO2 and EN in France, Germany, Italy, Poland and Spain. At the same time, it should be emphasized that this influence is diversified in terms of direction and strength. Therefore, the political actions in economic policy impact the reduction of CO2 emissions to the atmosphere.
MSP, MSPI and MSPE have great importance for environmental actions. Therefore, it is vital to make rational decisions regarding macroeconomic conditions. Conducting a stable and responsible fiscal and monetary policy is of crucial importance here. Implementing the climate framework requires courage among the rulers and making decisions necessary and difficult (often inconsistent with the expectations of some social groups) for countries’ strategic development.

Author Contributions

A.F.-K.: introduction, conceptual background; A.M.: abstract, methodology, models, discussion, conclusions; M.K.: collection of statistical data, development of models, presentation of research results; O.S.: manuscript edition. All authors have read and agreed to the published version of the manuscript.

Funding

This research was carried out as a part of project no. POIR.01.01.01-00-0281/20-00, entitled: “Predictive energy management system EnMS”, co-financed by the National Center for Research and Development”.

Institutional Review Board Statement

Not applicable.

Informed Consent Statement

Not applicable.

Data Availability Statement

Conflicts of Interest

The authors declare no conflict of interest.

Abbreviations

A the relation between the rate of economic growth and unemployment rate
Bthe unemployment rate and inflation rate
Cinflation rate and the budget
CAcurrent account balance as (%) of GDP
CO2carbon dioxide emissions (millions of tonnes)
CPIinflation rate (consumer price index) (%),
Dthe budget and the current account balance
DCO2decarbonization (normalized indicator of decarbonization)
Ecurrent account balance and economic growth
ENenergy efficiency ((normalized indicator of energy efficiency)
ENEenergy efficiency in i-year (million tonnes of oil equivalent)
Gstate budget balance as (%) of GDP
MSPmacroeconomic stabilization
MSPEexternal dimension of macroeconomic stabilization
MSPIinternal dimension of macroeconomic stabilization
Uunemployment rate (%)
ΔGDPGDP growth rate (%)

References

  1. Martinez, V.; Sanchez-Robles, B. Macroeconomic Stability and Growth in Eastern Europe; Macroeconomics and Beyond, Essays in Honour of Wim Meeusen: Antwerpen, Belgium, 2012; pp. 130–144. [Google Scholar]
  2. Vasylieva, T.; Lyeonov, S.; Oleksii, L.; Kyrychenko, K. Macroeconomic Stability and Its Impact on the Economic Growth of the Country. Montenegrin J. Econ. 2018, 14, 159–170. [Google Scholar] [CrossRef]
  3. Bilan, Y.; Lyeonov, S.; Lyulyov, O.; Pimonenkow, T. Brand management and macroeconomic stability of the country. Pol. J. Manag. Stud. 2019, 19, 61–74. [Google Scholar] [CrossRef]
  4. Umar, M.; Ji, X.; Kirikkaleli, D.; Shahbaz, M.; Zhou, X. Environmental cost of natural resources utilization and economic growth: Can China shift some burden through globalization for sustainable development? Sustain. Dev. 2020, 28, 6. [Google Scholar] [CrossRef]
  5. Mann, K. The EU, a Growth Engine? The Impact of European Integration on Economic Growth in Central Eastern Europe; FIW-Research Centre International Economics: Vienna, Austria, 2015. [Google Scholar]
  6. Hnatyshyn, M. Decomposition analysis of the impact of economic growth on ammonia and nitrogen oxides emissions in the European Union. J. Int. Stud. 2018, 11, 201–209. [Google Scholar] [CrossRef] [PubMed] [Green Version]
  7. Hanif, I.; Gago-de-Santos, P. The importance of population control and macroeconomic stability to reducing environmental degradation: An empirical test of the environmental Kuznets curve for developing countries. Environ. Dev. 2017, 23, 1–9. [Google Scholar] [CrossRef]
  8. Kirikkaleli, D.; Ozun, A. Innovation capacity, business sophistication and macroeconomic stability: Empirical evidence from OECD countries. J. Bus. Econ. Manag. 2019, 20, 351–367. [Google Scholar] [CrossRef] [Green Version]
  9. Pieloch-Babiarz, A.; Misztal, A.; Kowalska, M. An impact of macroeconomic stabilization on the sustainable development of manufacturing enterprises: The case of Central and Eastern European Countries. Environ. Dev. Sustain. 2020, 23, 8669–8698. [Google Scholar] [CrossRef]
  10. Sirimaneetham, V.; Temple, J.R.W. Macroeconomic Stability and the Distribution of Growth Rates. World Bank Econ. Rev. 2009, 23, 443–479. [Google Scholar] [CrossRef] [Green Version]
  11. Vo, A.T.; Van, L.T.; Vo, D.H.; McAleer, M. Financial inclusion and macroeconomic stability in emerging and frontier markets. Ann. Financ. Econ. 2019, 14, 2. [Google Scholar] [CrossRef] [Green Version]
  12. Franke, R.; Westerhoff, F. Different compositions of aggregate sentiment and their impact on macroeconomic stability. Econ. Model. 2019, 76, 117–127. [Google Scholar] [CrossRef]
  13. de Mendonça, H.F.; Cunha Nascimento, N. Monetary policy efficiency and macroeconomic stability: Do financial openness and economic globalization matter? N. Am. J. Econ. Financ. 2020, 51, 100870. [Google Scholar] [CrossRef]
  14. Wójcik-Jurkiewicz, M.; Czarnecka, M.; Kinelski, G.; Sadowska, B.; Bilińska-Reformat, K. Determinants of Decarbonisation in the Transformation of the Energy Sector: The Case of Poland. Energies 2021, 14, 1217. [Google Scholar] [CrossRef]
  15. Adebayo, T.S.; Akinsola, G.D.; Kirikkaleli, D.; Bekun, F.V.; Umarbeyli, S.; Osemeahon, O.S. Economic performance of Indonesia amidst CO2 emissions and agriculture: A time series analysis. Environ. Sci. Pollut. Res. 2021, 1–15. [Google Scholar] [CrossRef]
  16. Udemba, E.N.; Güngör, H.; Bekun, F.V.; Kirikkaleli, D. Economic performance of India amidst high CO2 emissions. Sustain. Prod. Consum. 2021, 27, 52–60. [Google Scholar] [CrossRef]
  17. Berkowitz, P.; Monfort, P.; Pieńkowski, J. Unpacking the growth impacts of European Union Cohesion Policy: Transmission channels from Cohesion Policy into economic growth. Reg. Stud. 2020, 54, 60–71. [Google Scholar] [CrossRef]
  18. Månberger, A. Deep Decarbonization and Energy Security for Low-Carbon Societies. In Green Growth and Decarbonization of Energy Systems in a Changing World; Rocamora, A.R., Ishikawa, T., Eds.; Institute for Global Environmental Strategies (IGES): Hayama, Japan, 2018; pp. 14–16. [Google Scholar]
  19. Dahlström, H. Decarbonizing Development: 3 Steps to Decarbonizing Development for a Zero-Carbon Future; The World Bank: Washington, DC, USA, 2015. [Google Scholar]
  20. Afonso, A.; Blanco-Arana, C. Financial development and economic growth: A study for OECD countries in the context of crisis. In Proceedings of the MIRDEC-8th International Academic Conference on Social Sciences, Economics, Business and Finances Studies, Lisbon, Portugal, 29–31 May 2018. REM Working Paper 046-2018. [Google Scholar] [CrossRef] [Green Version]
  21. Wang, Q.; Jiang, R.; Zhan, L. Is decoupling economic growth from fuel consumption possible in developing countries?—A comparison of China and India. J. Clean. Prod. 2019, 229, 806–817. [Google Scholar] [CrossRef]
  22. Papadis, E.; Tsatsaronis, G. Challenges in the decarbonization of the energy sector. Energy 2020, 205, 18025. [Google Scholar] [CrossRef]
  23. Adebayo, T.S.; Awosusi, A.A.; Kirikkaleli, D.; Akinsola, G.D.; Mwamba, M.N. Can CO2 emissions and energy consumption determine the economic performance of South Korea? A time series analysis. Environ. Sci. Pollut. Res. 2021, 1–16. [Google Scholar] [CrossRef]
  24. Soylu, Ö.B.; Adebayo, T.S.; Kirikkaleli, D. The Imperativeness of Environmental Quality in China Amidst Renewable Energy Consumption and Trade Openness. Sustainability 2021, 13, 5054. [Google Scholar] [CrossRef]
  25. Zhang, L.; Li, Z.; Kirikkaleli, D.; Adebayo, T.S.; Adeshola, I.; Akinsola, G.D. Modeling CO2 emissions in Malaysia: An application of Maki cointegration and wavelet coherence tests. Environ. Sci. Pollut. Res. 2021, 28, 26030–26044. [Google Scholar] [CrossRef] [PubMed]
  26. Kirikkaleli, D.; Adebayo, T.S. Do renewable energy consumption and financial development matter for environmental sustainability? New global evidence. Sustain. Dev. 2020, 29, 583–594. [Google Scholar] [CrossRef]
  27. Adebayo, T.S.; Kirikkaleli, D. Impact of renewable energy consumption, globalization, and technological innovation on environmental degradation in Japan: Application of wavelet tools. Environ. Dev. Sustain. 2021, 1–26. [Google Scholar] [CrossRef]
  28. Kołodko, G.W. Kwadratura Pięciokąta Od Załamania Gospodarczego Do Trwałego Wzrostu; Poltext: Warsaw, Poland, 1993. [Google Scholar]
  29. Shkolnyk, I.; Kozmenko, S.; Kozmenko, O.; Mershchii, B. The impact of the economy financialization on the level of economic development of the associate EU member states. Econ. Sociol. 2019, 12, 4. [Google Scholar] [CrossRef] [PubMed]
  30. Cantiani, M.G.; Geitner, C.; Haida, C.; Maino, F.; Tattoni, C.; Vettorato, D.; Ciolli, M. Balancing Economic Development and Environmental Conservation for a New Governance of Alpine Areas. Sustainability 2016, 8, 802. [Google Scholar] [CrossRef] [Green Version]
  31. Komarnicka, A.; Murawska, A. Comparison of Consumption and Renewable Sources of Energy in European Union Countries—617 Sectoral Indicators, Economic Conditions and Environmental Impacts. Energies 2021, 14, 3714. [Google Scholar] [CrossRef]
  32. Geels, F.W.; Sovacool, B.C.; Schwanen, T.; Sorrell, S. Sociotechnical transitions for deep decarbonization. Science 2017, 357, 6357. [Google Scholar] [CrossRef] [PubMed]
  33. Simionescu, M.; Wojciechowski, A.; Tomczyk, A.; Rabe, M. Revised Environmental Kuznets Curve for V4 Countries and Baltic States. Energies 2021, 14, 3302. [Google Scholar] [CrossRef]
  34. Tvaronavičienė, M.; Prakapienė, D.; Garškaitė-Milvydienė, K.; Prakapas, R.; Nawrot, Ł. Energy Efficiency in the Long-Run in the Selected European Countries. Econ. Sociol. 2018, 11, 245–254. [Google Scholar] [CrossRef] [Green Version]
  35. Simionescu, M.; Bilan, Y.; Zawadzki, P.; Wojciechowski, A.; Rabe, M. GHG Emissions Mitigation in the European Union Based on Labor Market Changes. Energies 2021, 14, 465. [Google Scholar] [CrossRef]
  36. Štreimikienė, D. Externalities of power generation in Visegrad countries and their integration through support of renewables. Econ. Sociol. 2021, 14, 89–102. [Google Scholar] [CrossRef]
  37. Streimikiene, D. Ranking of Baltic States on progress towards the main energy security goals of European energy union strategy. J. Int. Stud. 2020, 13, 24–37. [Google Scholar] [CrossRef]
  38. Issah, M.; Antwi, S. Role of macroeconomic variables on firms’ performance: Evidence from the UK. Cogent Econ. Financ. 2017, 5, 1405581. [Google Scholar] [CrossRef]
  39. McKibbin, W.; Morris, A.; Panton, A.; Wilcoxen, P. Climate Change and Monetary Policy: Dealing with Disruption. CAMA Work. Pap. 2017, 77, 37. [Google Scholar] [CrossRef] [Green Version]
  40. Vo, H.D. Sustainable agriculture & energy in the U.S.: A link between ethanol production and the acreage for corn. Econ. Sociol. 2020, 13, 259–268. [Google Scholar] [CrossRef]
  41. Stavytskyy, A.; Kharlamova, G.; Giedraitis, V.; Šumskis, V. Estimating the interrelation between energy security and macroeconomic factors in European countries. J. Int. Stud. 2018, 11, 217–238. [Google Scholar] [CrossRef]
  42. Litavcová, E.; Chovancová, J. Economic Development, CO2 Emissions and Energy Use Nexus-Evidence from the Danube Region Countries. Energies 2021, 14, 3165. [Google Scholar] [CrossRef]
  43. Raveh, O. Monetary Policy, Natural Resources and Federal Redistribution. Environ. Resour. Econ. 2020, 75, 585–613. [Google Scholar] [CrossRef]
  44. Norton, T.A.; Zacher, H.; Ashkanasy, N.M. Organisational sustainability policies and employee green behaviour: The mediating role of work climate perceptions. J. Environ. Psychol. 2014, 38, 49–54. [Google Scholar] [CrossRef]
  45. Maroušek, J.; Maroušková, A. Economic Considerations on Nutrient Utilization in Wastewater Management. Energies 2021, 14, 3468. [Google Scholar] [CrossRef]
  46. Agliardi, E.; Xepapadeas, A. Introduction: Special Issue on the Economics of Climate Change and Sustainability. Environ. Resour. Econ. 2019, 72, 1–14. [Google Scholar] [CrossRef] [Green Version]
  47. Papadopoulou, C.A.; Papadopoulou, M.P.; Laspidou, C.; Munaretto, S.; Brouwer, F. Towards a Low-Carbon Economy: A Nexus-Oriented Policy Coherence Analysis in Greece. Sustainability 2020, 12, 373. [Google Scholar] [CrossRef] [Green Version]
  48. Svazas, M.; Navickas, V.; Krajnakova, E.; Nakonieczny, J. Sustainable supply chain of the biomass cluster as a factor for preservation and enhancement of forests. J. Int. Stud. 2019, 12, 309–321. [Google Scholar] [CrossRef]
  49. Fajczak-Kowalska, A.; Misztal, A.; Kowalska, M. Energy, Pollution, and Transport Taxes as Instruments of Sustainable Development of Manufacturing Enterprises in Emerging Economies in the European Union. Eur. Res. Stud. J. 2021, 24, 724–742. [Google Scholar] [CrossRef]
  50. Mundell, R. A Theory of Optimum Currency Areas. Am. Econ. Rev. 1961, 51, 657–665. [Google Scholar]
  51. Phillips, A. The Relationship between Unemployment and the Rate of Change of Money Wage Rates in the UK 1862–1957. Economica 1958, 25, 283–299. [Google Scholar]
  52. Raykov, T.; Marcoulides, G.A. Basic Statistics: An. Introduction with R; Rowman & Littlefield: Lanham, MD, USA, 2012. [Google Scholar]
  53. Das, P. Linear Regression Model: Relaxing the Classical Assumptions. In Econometrics in Theory and Practice; Das, P., Ed.; Springer: Singapore, 2019; pp. 109–135. [Google Scholar] [CrossRef]
  54. Schmidheiny, K. The Multiple Linear Regression Model, Short Guides to Microeconometrics. 2019. Available online: https://wwwschmidheinyname/teaching/olspdf (accessed on 6 May 2021).
  55. Ernst, A.; Albers, C. Regression assumptions in clinical psychology research practice—A systematic review of common misconceptions. Peer J. 2017, 5, e3323. [Google Scholar] [CrossRef] [Green Version]
  56. Takeshi, A. Advanced Econometrics; Harvard University Press: Cambridge, MA, USA, 1985. [Google Scholar] [CrossRef]
  57. Baltagi, B.H. Chapter 18—Panel Data Forecasting. In Handbook of Economic Forecasting; Elliott, G., Timmermann, A., Eds.; Elsevier: Amsterdam, The Netherlands, 2013; Volume 2, Part B. [Google Scholar] [CrossRef]
  58. Moon, H.R.; Perron, P. Efficient Estimation of SUR Cointegration Regression Model and Testing for Purchasing Power Parity. Econom. Rev. 2004, 23, 293–323. [Google Scholar] [CrossRef]
  59. Fiebig, D.G. Seemingly Unrelated Regression. In A Companion to Theoretical Econometrics; Baltagi, B., Ed.; Backwell Publishers: Hoboken, NJ, USA, 2001. [Google Scholar]
  60. DDPP. Pathways to Deep Decarbonization: 2014 Report; Sustainable Development Solutions. Network (SDSN) and Institute for Sustainable, Development and International Relations (IDDRI), September 2014. Available online: https://resources.unsdsn.org/pathways-to-deep-decarbonization-2014-report (accessed on 25 July 2021).
Figure 1. Macroeconomic stabilization pentagon. Source: own study based on [28].
Energies 14 05197 g001
Figure 2. DCO2, MSPI, MSPE En in selected EU countries in the period from 1990 to 2020 (n = 31).
Energies 14 05197 g002aEnergies 14 05197 g002b
Table 1. Correlation coefficients between DCO2, EN and MSP, MSPI, MSPE in selected EU countries in the period from 1990 to 2020, p < 0.05 (n = 31).
CountryCorrelationPearson’s rSpearman-s RhoGammaKendall Rank
FranceDCO2/MSPI−0.132050−0.179839−0.109677−0.109677
EN/MSPI0.4375270.4524190.3118280.311828
DCO2/MSPE−0.623767−0.634677−0.427957−0.427957
EN/MSPE0.2194530.1879030.1225810.122581
DCO2/MSP−0.478232−0.488306−0.341935−0.341935
EN/MSP0.362790.4040320.2688170.268817
GermanyDCO2/MSPI0.8038550.8479840.6645160.664516
EN/MSPI−0.556481−0.568145−0.380645−0.380645
DCO2/MSPE0.8246150.8407260.6559140.655914
EN/MSPE−0.634847−0.595565−0.415054−0.415054
DCO2/MSP0.8564280.9088710.759140.75914
EN/MSP−0.634992−0.63629−0.449462−0.449462
ItalyDCO2/MSPI−0.061814−0.213306−0.156989−0.156989
EN/MSPI0.6084030.6084680.4193550.419355
DCO2/MSPE0.4298180.4036290.3032260.303226
EN/MSPE−0.779933−0.757258−0.539785−0.539785
DCO2/MSP0.3815870.2068550.1483870.148387
EN/MSP−0.342537−0.308468−0.221505−0.221505
PolandDCO2/MSPI0.2575630.1435480.1311830.131183
EN/MSPI0.7276920.6995970.4924730.492473
DCO2/MSPE−0.119046−0.003629−0.015054−0.015054
EN/MSPE0.4237100.3322580.2086020.208602
DCO2/MSP0.089782−0.006048−0.027957−0.027957
En/MSP0.7304060.6713710.5053760.505376
SpainDCO2/MSPI−0.753634−0.628629−0.466667−0.466667
EN/MSPI0.5828260.5169350.3763440.376344
DCO2/MSPE0.7649910.6899190.4838710.483871
EN/MSPE−0.464228−0.543145−0.367742−0.367742
DCO2/MSP0.007958−0.0685480.0107530.010753
En/MSP0.1224490.0342740.0537630.053763
Source: own study based on Eurostat [https://ec.europa.eu/Eurostat, general and regional statistics, economy and finance, environment and energy], accessed on: 30 July 2021.
Table 2. The OLS estimation (1990–2020), dependent variable: DCO2.
Country CoefficientStd. Errort-Ratiop-ValueR-SquaredDW
France (n = 29)const0.2090670.09747772.1450.04150.912.38
MSPE(t−2)−0.4972620.209345−2.3750.0252
DCO2(t−1)0.8809890.077881811.31<0.0001
Germany (n = 30)const 0.0873249 0.05315761.6430.11200.922.35
MSPI(t−1)0.363304 0.1650382.2010.0364
DCO2(t−1)0.782834 0.1047017.477<0.0001
Italy (n = 28)const0.02597610.07020870.37000.71490.971.89
MSPI−0.4905710.178142−2.7540.0116
MSPI(t−2)0.7796180.2397243.2520.0037
MSPE0.5333440.2300272.3190.0301
MSPE(t−3)−0.6039740.156689−3.8550.0009
DCO2(t−1)0.9071780.064774214.01<0.0001
Poland (n = 30)const0.2497120.07746933.2230.00340.821.54
MSPI(t−1)0.1936310.08668382.2340.0343
MSPE(t−1)−0.2776960.0924479−3.0040.0058
DCO2(t−1)0.7271090.08485448.569<0.0001
Spain (n = 28)const0.9050510.021144342.80<0.00010.9022832.21
MSPI−1.203080.0895414−13.44<0.0001
MSPE(t−3)0.8525790.09767028.729<0.0001
Source: own study based on Eurostat [https://ec.europa.eu/Eurostat, general and regional statistics, economy and finance, environment and energy], accessed on: 30 July 2021.
Table 3. The OLS estimation (1990–2020), dependent variable: EN.
Country CoefficientStd. Errort-Ratiop-ValueR-SquaredDW
France (n = 28)const0.1609600.1052491.5290.13930.732.35
MSPE(t−2)0.5030170.1446733.4770.0020
EN(t−1)0.3881310.1607602.4140.0238
EN(t−3)0.3335140.1372622.4300.0230
Germany (n = 27)const2.236230.3152817.093<0.00010.72.34
MSPE(t−1)−0.1396040.0797736−1.7500.0947
MSPE(t−4)−0.3459300.0910329−3.8000.0010
EN(t−1)−0.5002330.176305−2.8370.0099
EN(t−3)−0.3183890.159726−1.9930.0594
EN(t−4)−0.4017430.157102−2.5570.0184
Italy (n = 28)const−0.05781490.0817915−0.70690.48620.892.5
MSPE(t−3)0.2896260.1148712.5210.0184
EN(t−1)0.9993710.075750713.19<0.0001
Poland (n = 30)const0.2062090.08946382.3050.02940.821.5
MSPI0.2561180.1424151.7980.0837
MSPE(t−1)0.3019390.1121752.6920.0123
EN(t−1)0.6485530.1310864.948<0.0001
Spain (n = 30)Const0.08336440.02335093.5700.00140.982.04
MSPI0.3129400.05700465.490<0.0001
EN(t−1)0.8376650.031921126.24<0.0001
Source: own study based on Eurostat [https://ec.europa.eu/Eurostat, general and regional statistics, economy and finance, environment and energy], accessed on: 30 July 2021.
Table 4. The SUR estimation (1990–2020) (n = 30).
CountryDependent Variable CoefficientStd. Errort-Ratiop-Value
FranceDCO2const0.3018890.1006383.0000.0062
EN−1.155490.0727256−15.893.08 × 10−14
EN(t−1)0.9330100.083976711.116.05 × 10−11
C0.5158770.2042972.5250.0186
E−0.5192490.20084−2.5850.0162
DCO2(t−1)0.9015910.041682021.633.00 × 10−17
ENconst0.2636620.08280483.1840.0040
DCO2−0.8535420.0537210−15.893.08 × 10−14
DCO2(t−1)0.7684410.064129511.981.29 × 10−11
C0.4455140.1740422.5600.0172
E−0.4441670.174158−2.5500.0176
EN(t−1)0.8042710.064197912.535.10 × 10−12
GermanyDCO2const−0.3854210.214783−1.7940.0859
EN−0.4391350.117039−3.7520.0010
EN(t−1)0.8186290.1231316.6488.78 × 10−7
A0.3879410.1429262.7140.0124
D1.143290.2700214.2340.0003
E−0.8138610.190388−4.2750.0003
DCO2(t−1)0.9687040.061930715.649.48 × 10−14
ENconst0.9940420.035953727.658.31 × 10−21
B−1.042410.529784−1.9680.0599
B(t−1)1.244240.5463602.2770.0312
D−0.4599270.0960344−4.7895.86 × 10−5
ItalyDCO2const0.1101960.1102470.99950.3284
EN−0.9661250.116617−8.2853.29 × 10−8
EN(t−1)0.8615070.1285246.7039.74 × 10−7
B−0.5453740.283447−1.9240.0674
C(t−1)0.6178730.1971653.1340.0048
D1.454090.3532294.1170.0005
E(t−1)−0.9626380.223448−4.3080.0003
DCO2(t−1)0.9115330.051580617.671.74 × 10−14
ENconst0.3425920.06623245.1732.13 × 10−5
DCO2−0.2102390.0409018−5.1402.32 × 10−5
B(t−1)0.9763910.3223793.0290.0055
EN(t−1)0.7333820.057183212.839.47 × 10−13
PolandDCO2const0.6899580.08875987.7739.48 × 10−8
EN−0.3326780.0854303−3.8940.0008
A−0.4296640.197754−2.1730.0409
A(t−1)0.8125290.1526315.3232.42 × 10−5
B1.449820.3425294.2330.0003
C(t−1)0.5296270.2036892.6000.0163
D(t−1)−0.4334370.131594−3.2940.0033
DCO2(t−1)0.4185040.09295014.5020.0002
ENconst0.2789840.09592702.9080.007
DCO2−1.062020.104407−10.172.27 × 10−10
DCO2(t−1)0.9660400.1013509.5328.36 × 10−10
A(t−1)0.4433040.1340763.3060.0029
EN(t−1)0.7548350.08563618.8143.84 × 10−9
SpainDCO2const1.072480.042800925.063.13 × 10−19
EN−1.066980.259615−4.1100.0004
EN(t−1)0.7014720.2361522.9700.0065
C−0.7751910.195985−3.9550.0006
D(t−1)1.779740.17426310.212.09 × 10−10
ENconst0.4418660.07003216.3091.33 × 10−6
A2.379980.3929006.0572.50 × 10−6
B(t−1)6.053981.199975.0453.32 × 10−5
D(t−1)8.000432.471273.2370.0034
E(t−1)−7.275021.84395−3.9450.0006
Source: own study based on Eurostat [https://ec.europa.eu/Eurostat, general and regional statistics, economy and finance, environment and energy], accessed on: 30 July 2021.
Publisher’s Note: MDPI stays neutral with regard to jurisdictional claims in published maps and institutional affiliations.

