
Implementation of Non-Destructive Electrical Condition Monitoring Techniques on Low-Voltage Nuclear Cables: I. Irradiation Aging of EPR/CSPE Cables


Abstract
:1. Introduction
2. Materials and Methods
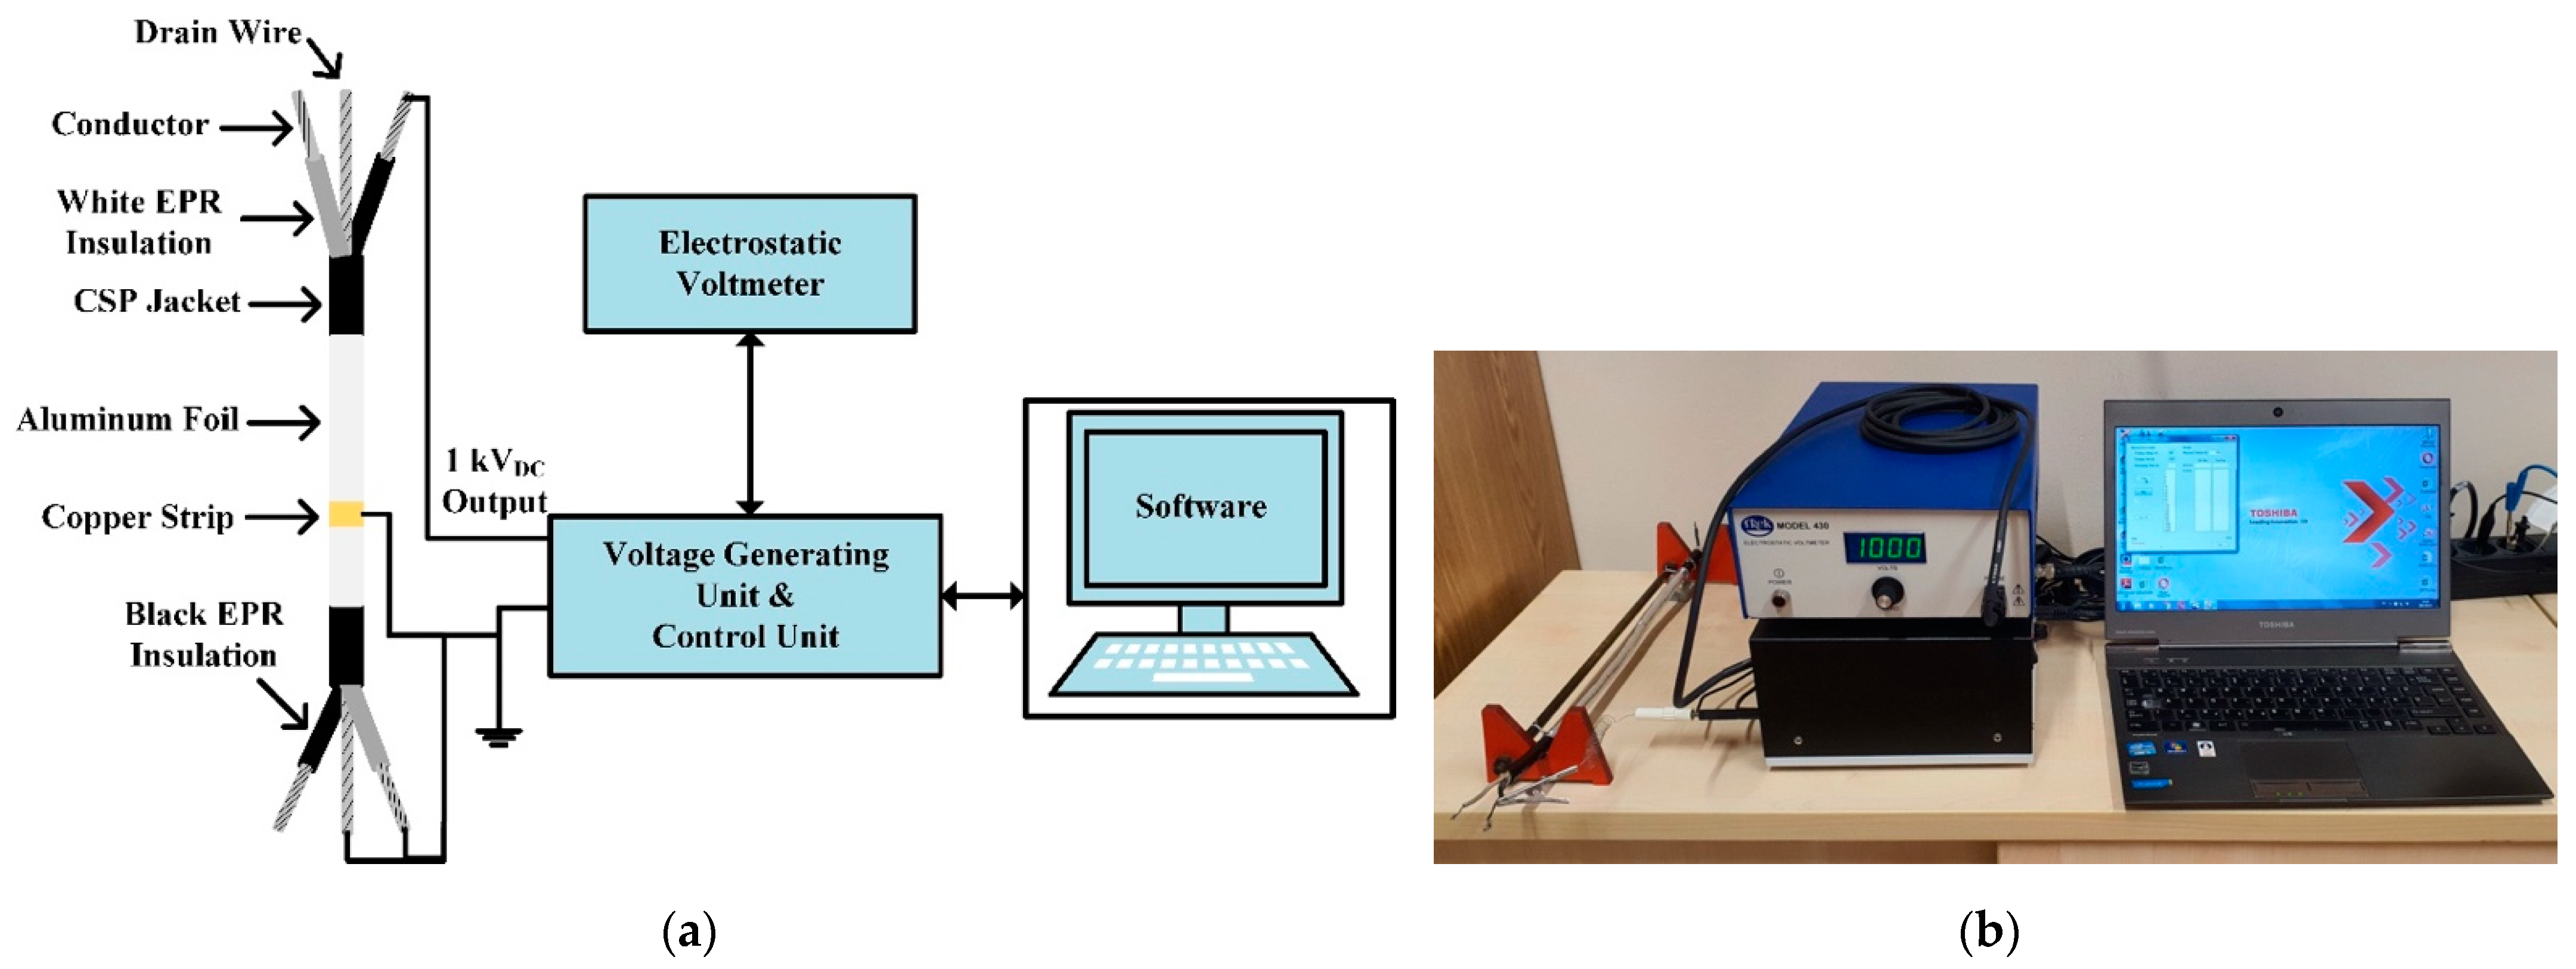
2.1. Cable Specimen
2.2. Accelerated Radiation Aging
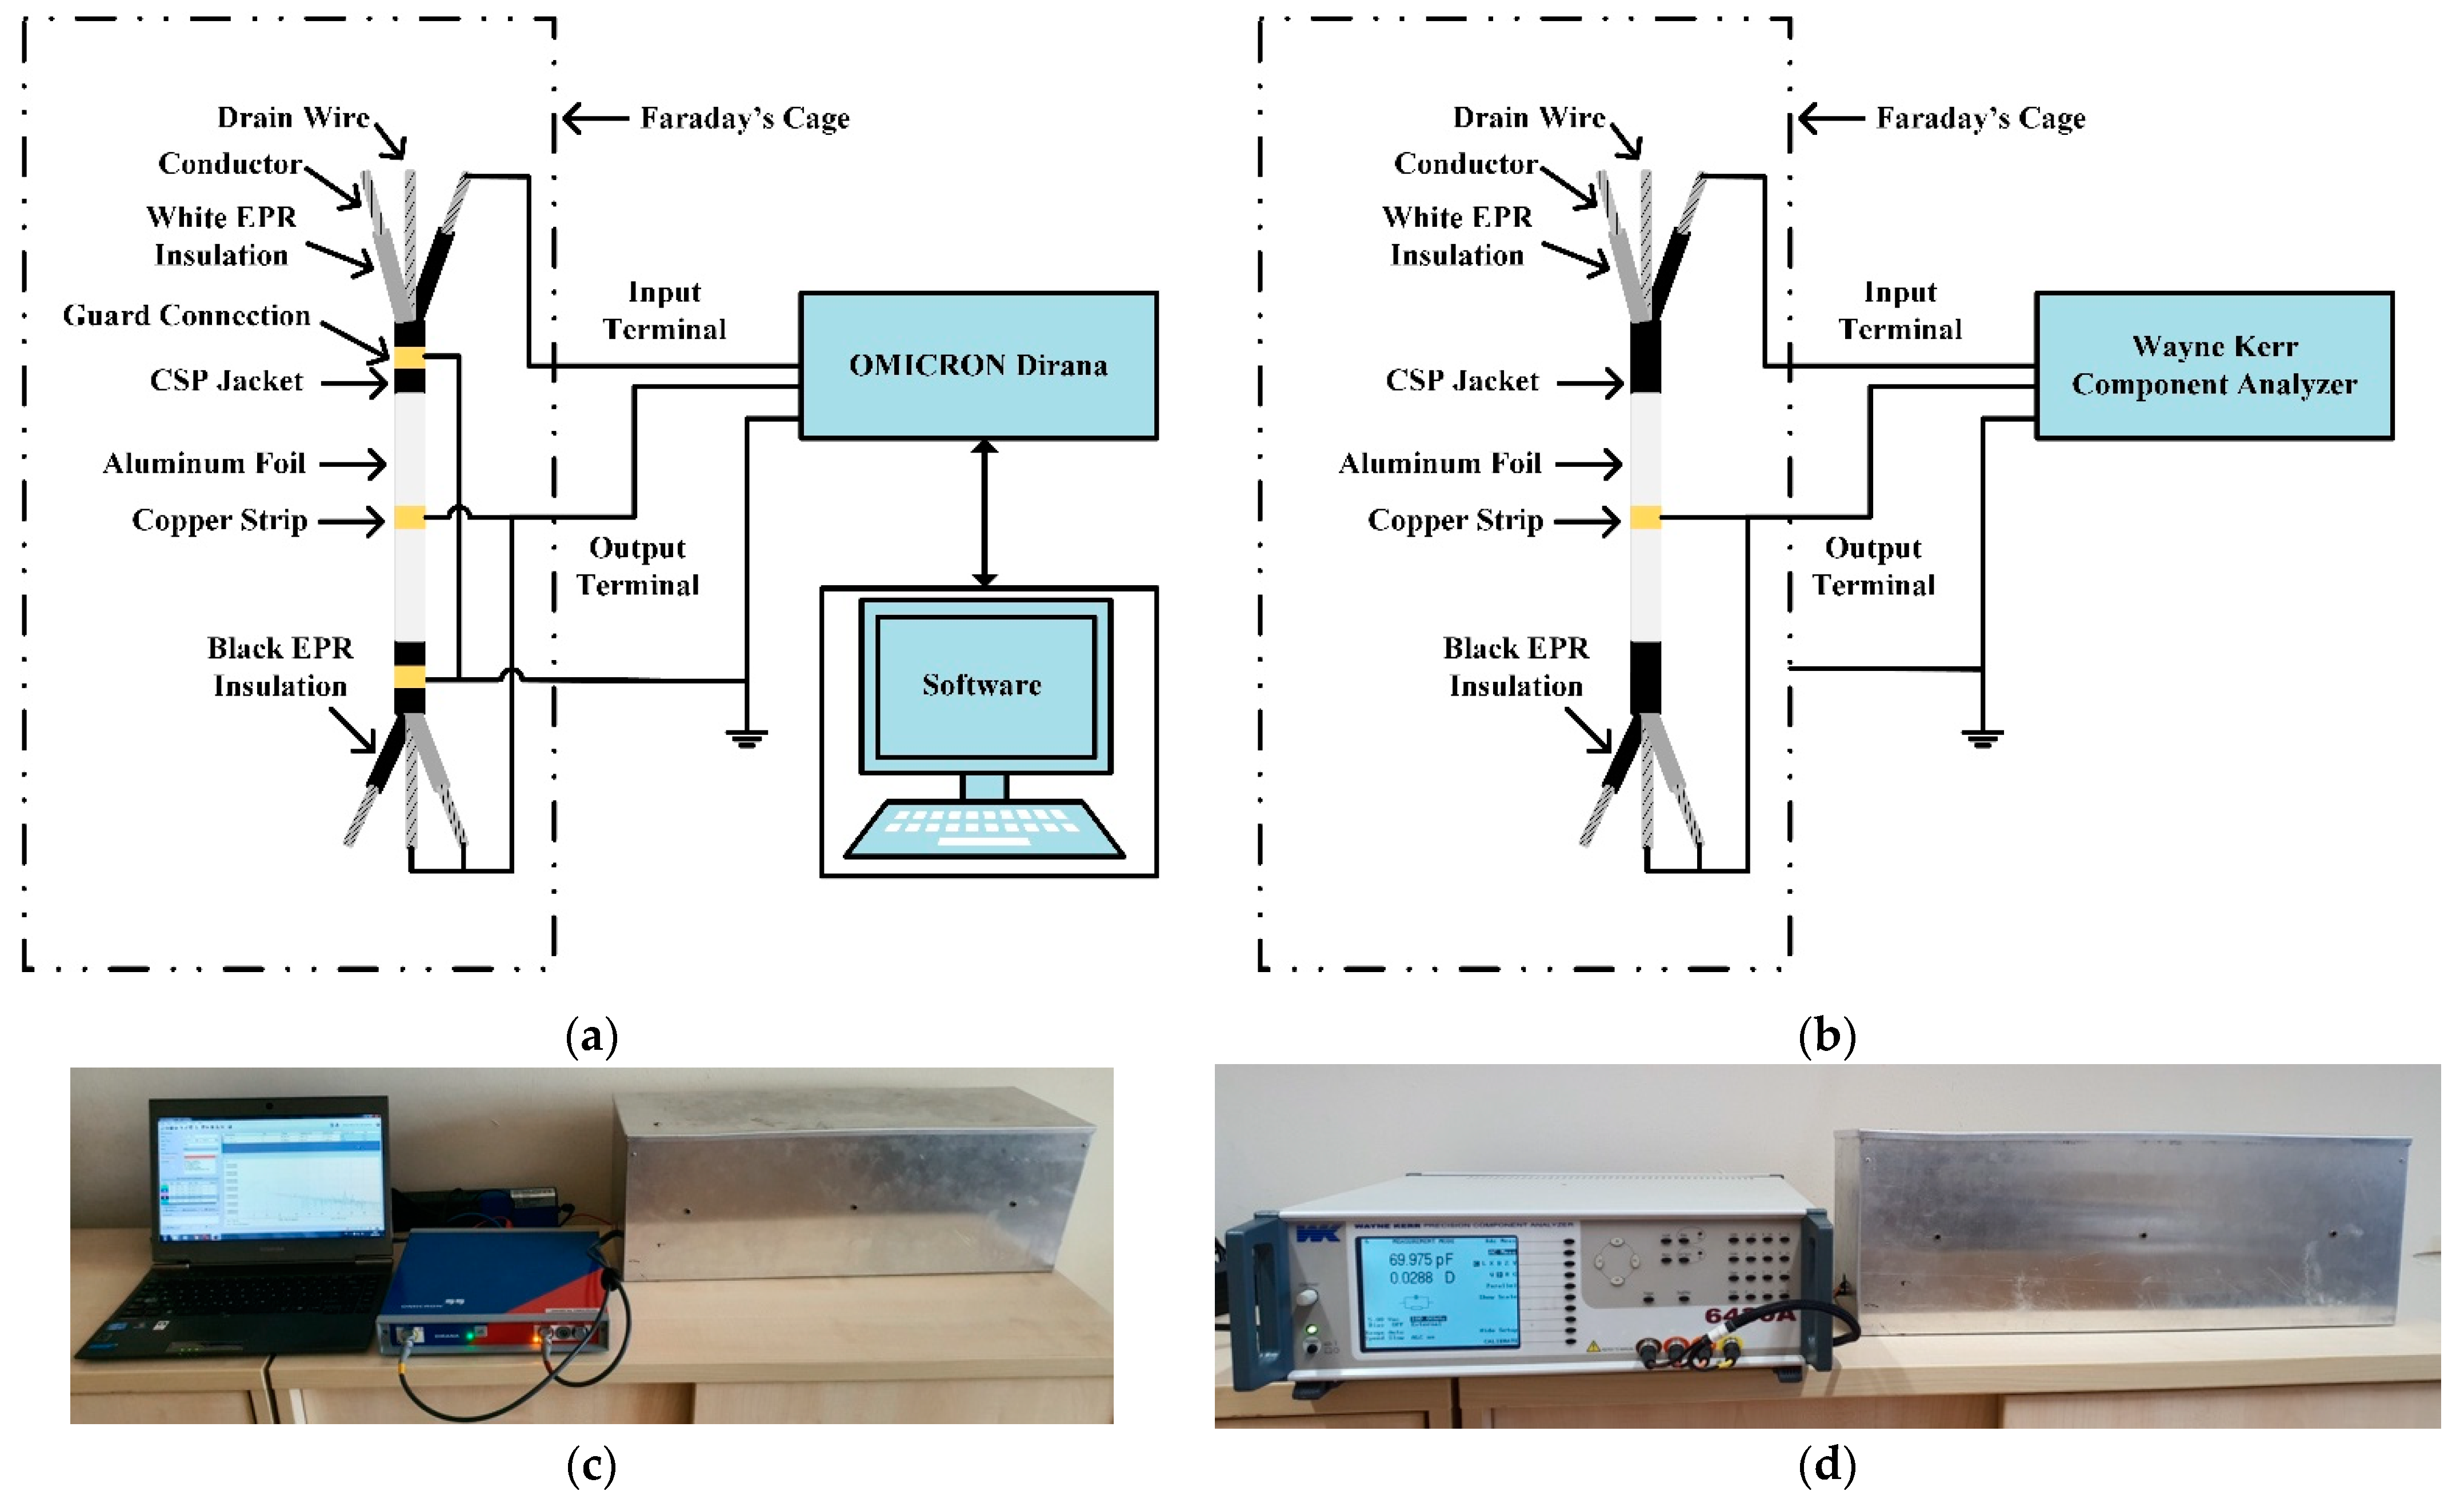
2.3. Measurement
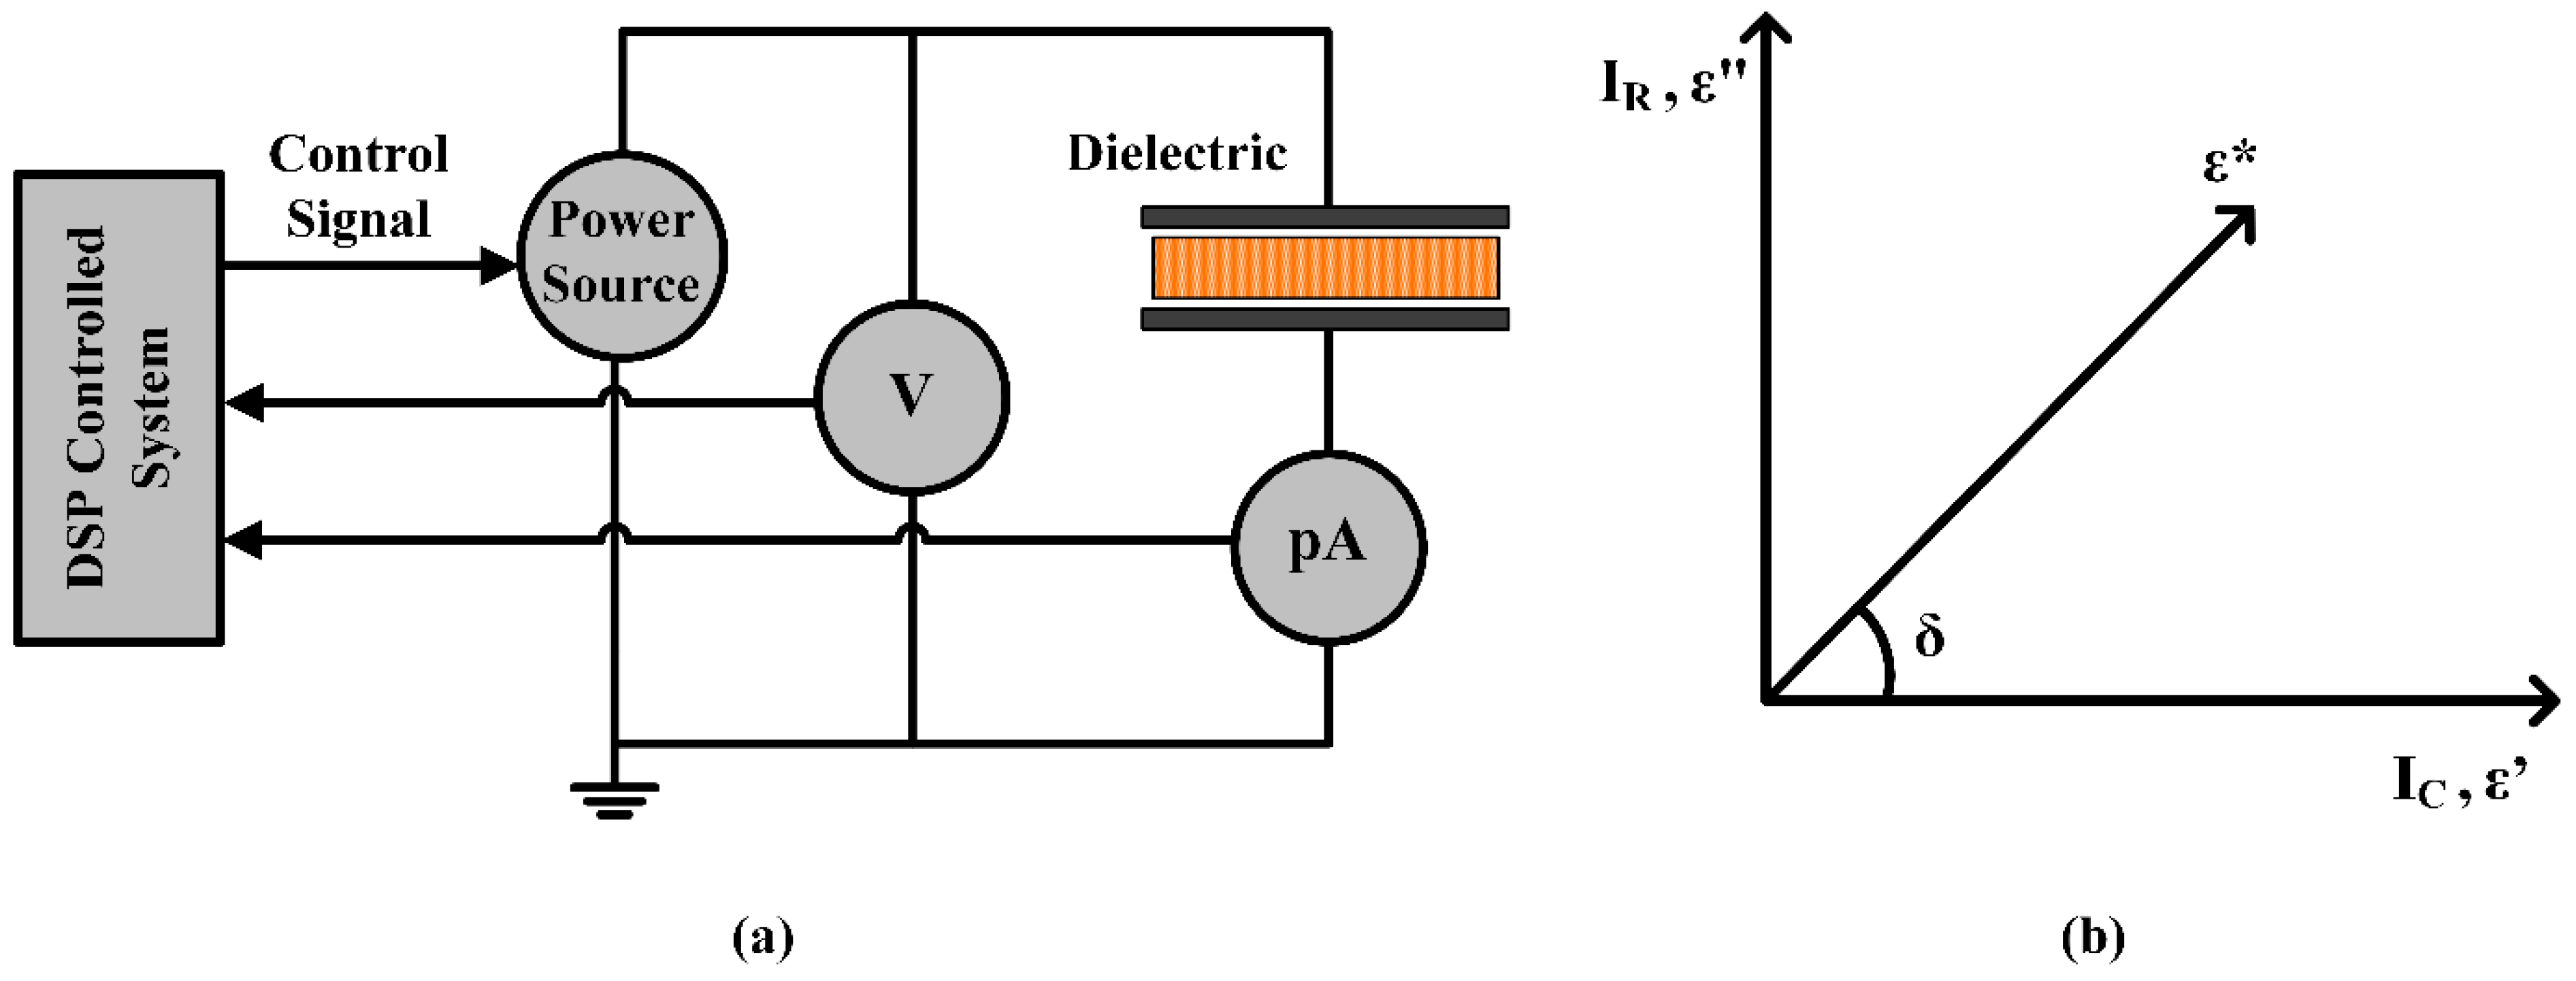
2.3.1. Capacitance and tan δ
2.3.2. Extended Voltage Response
2.3.3. Elongation at Break
3. Results
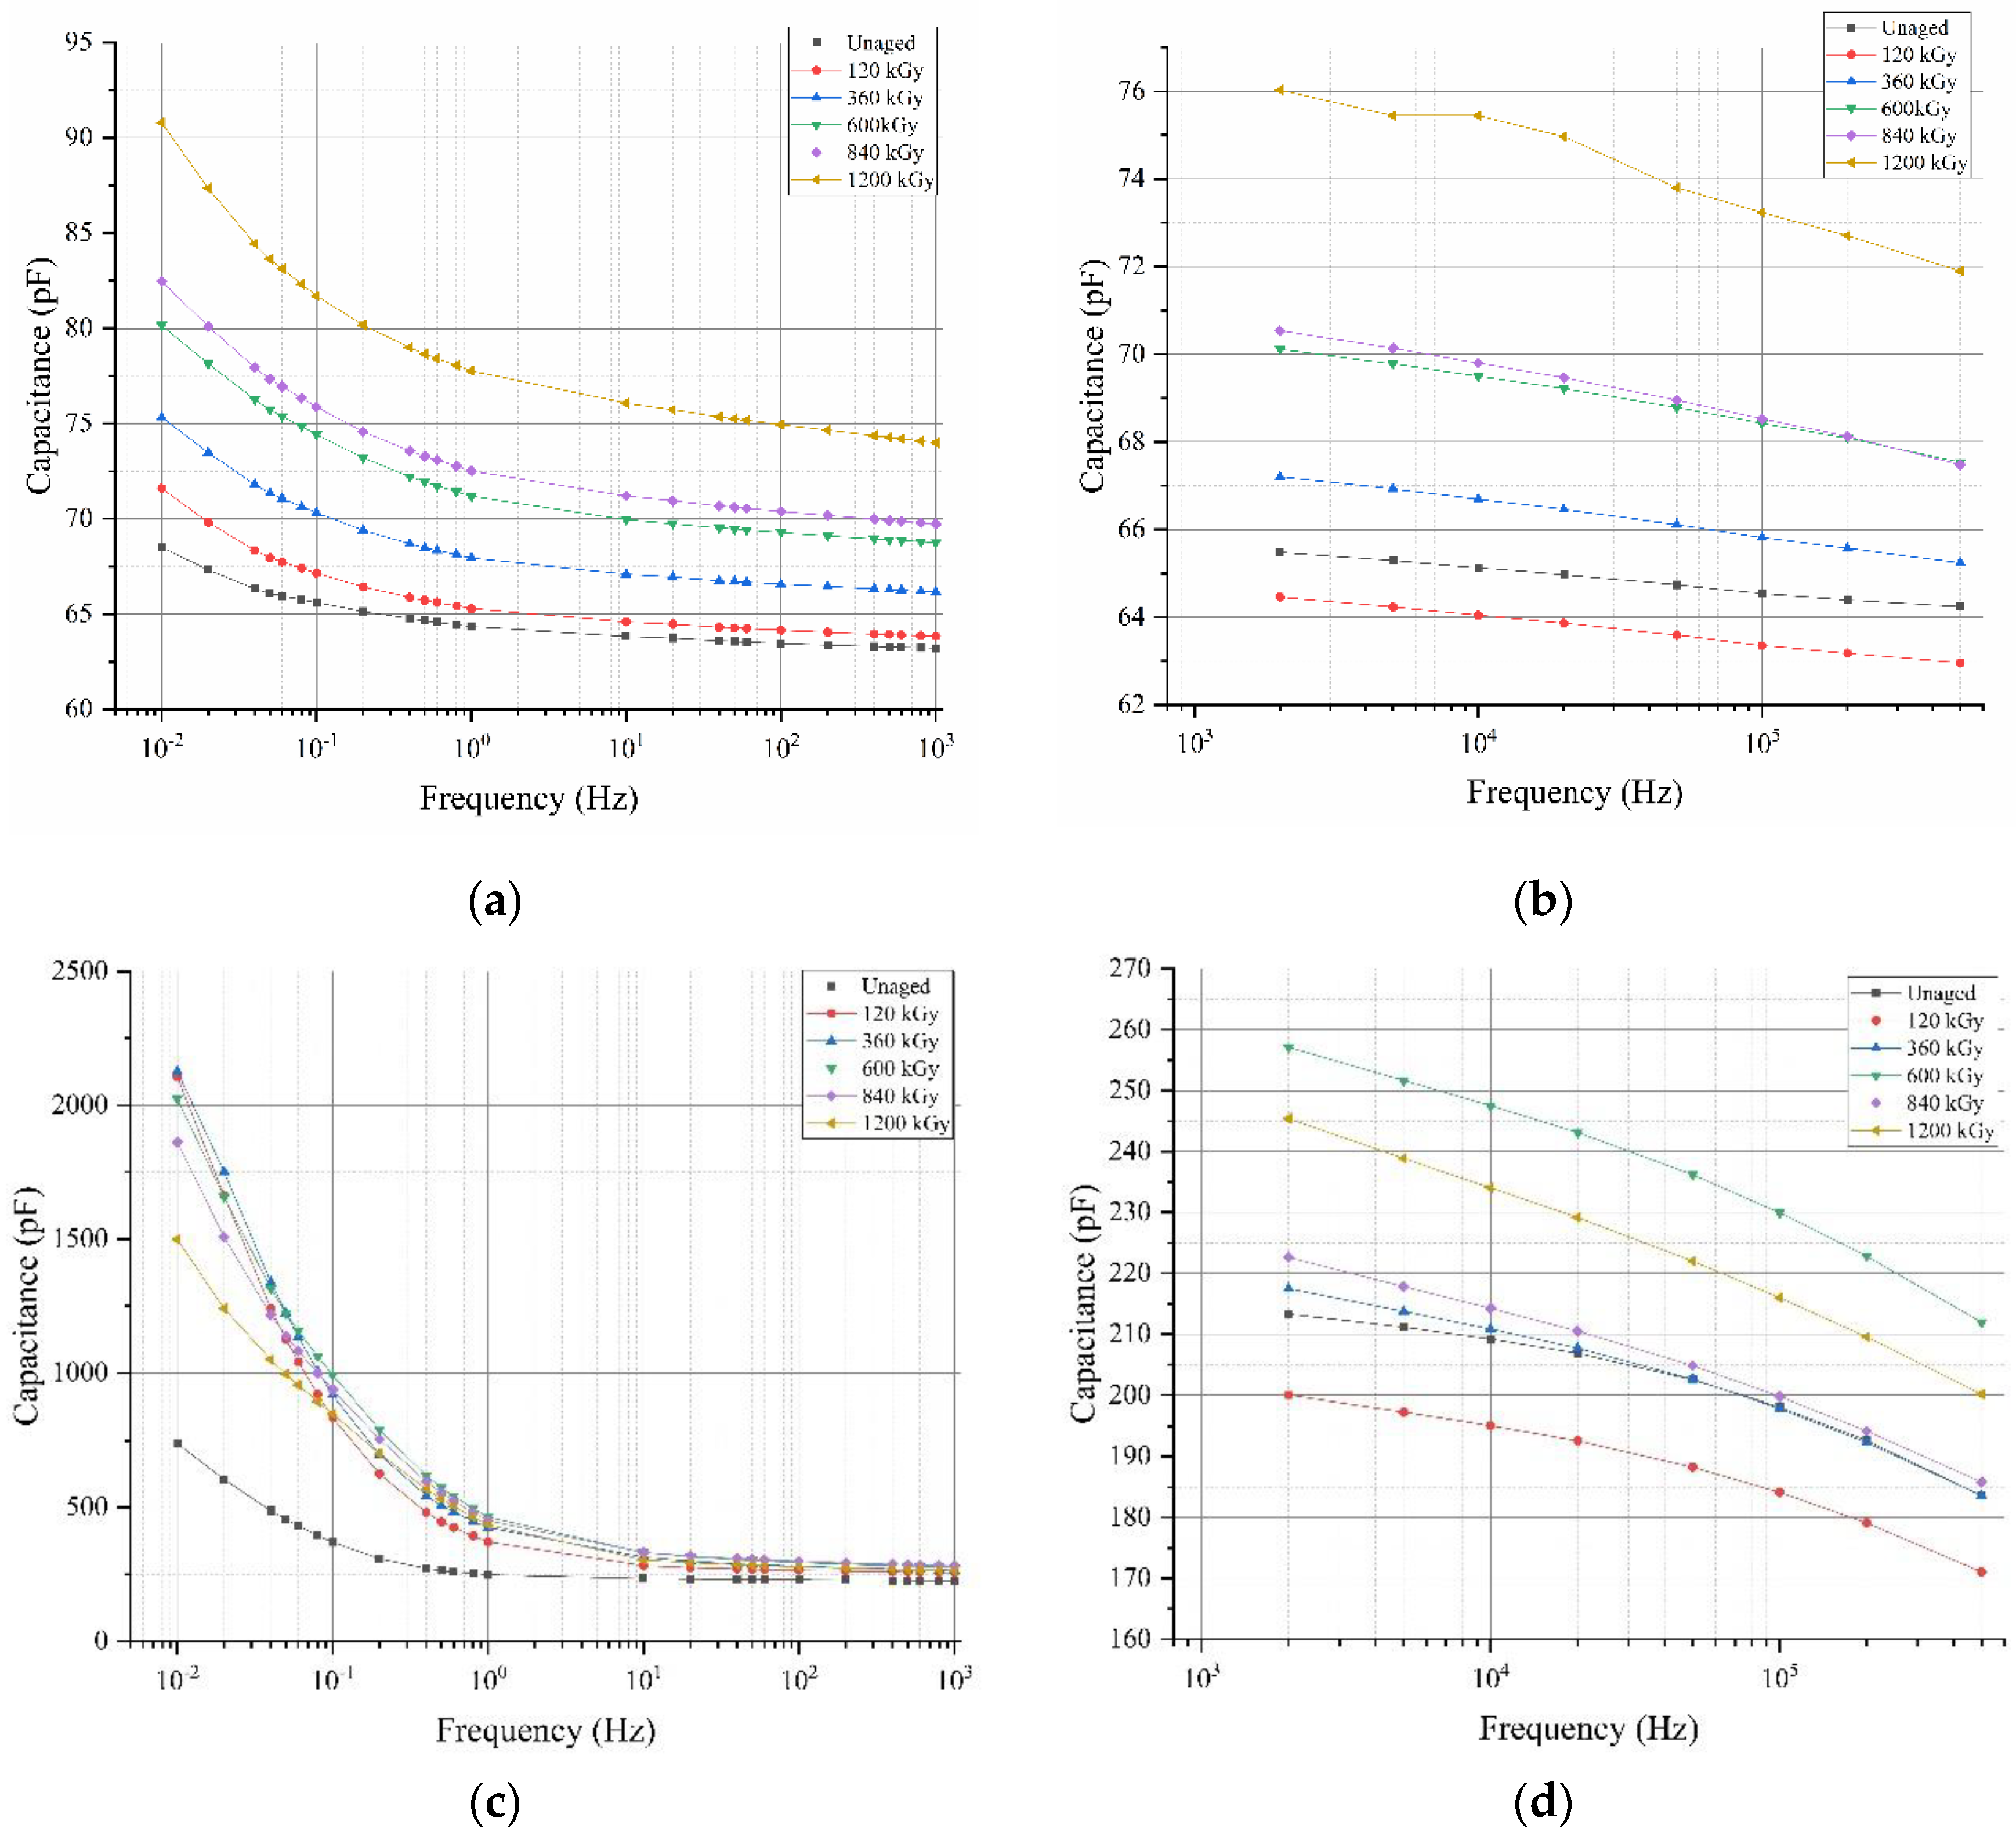
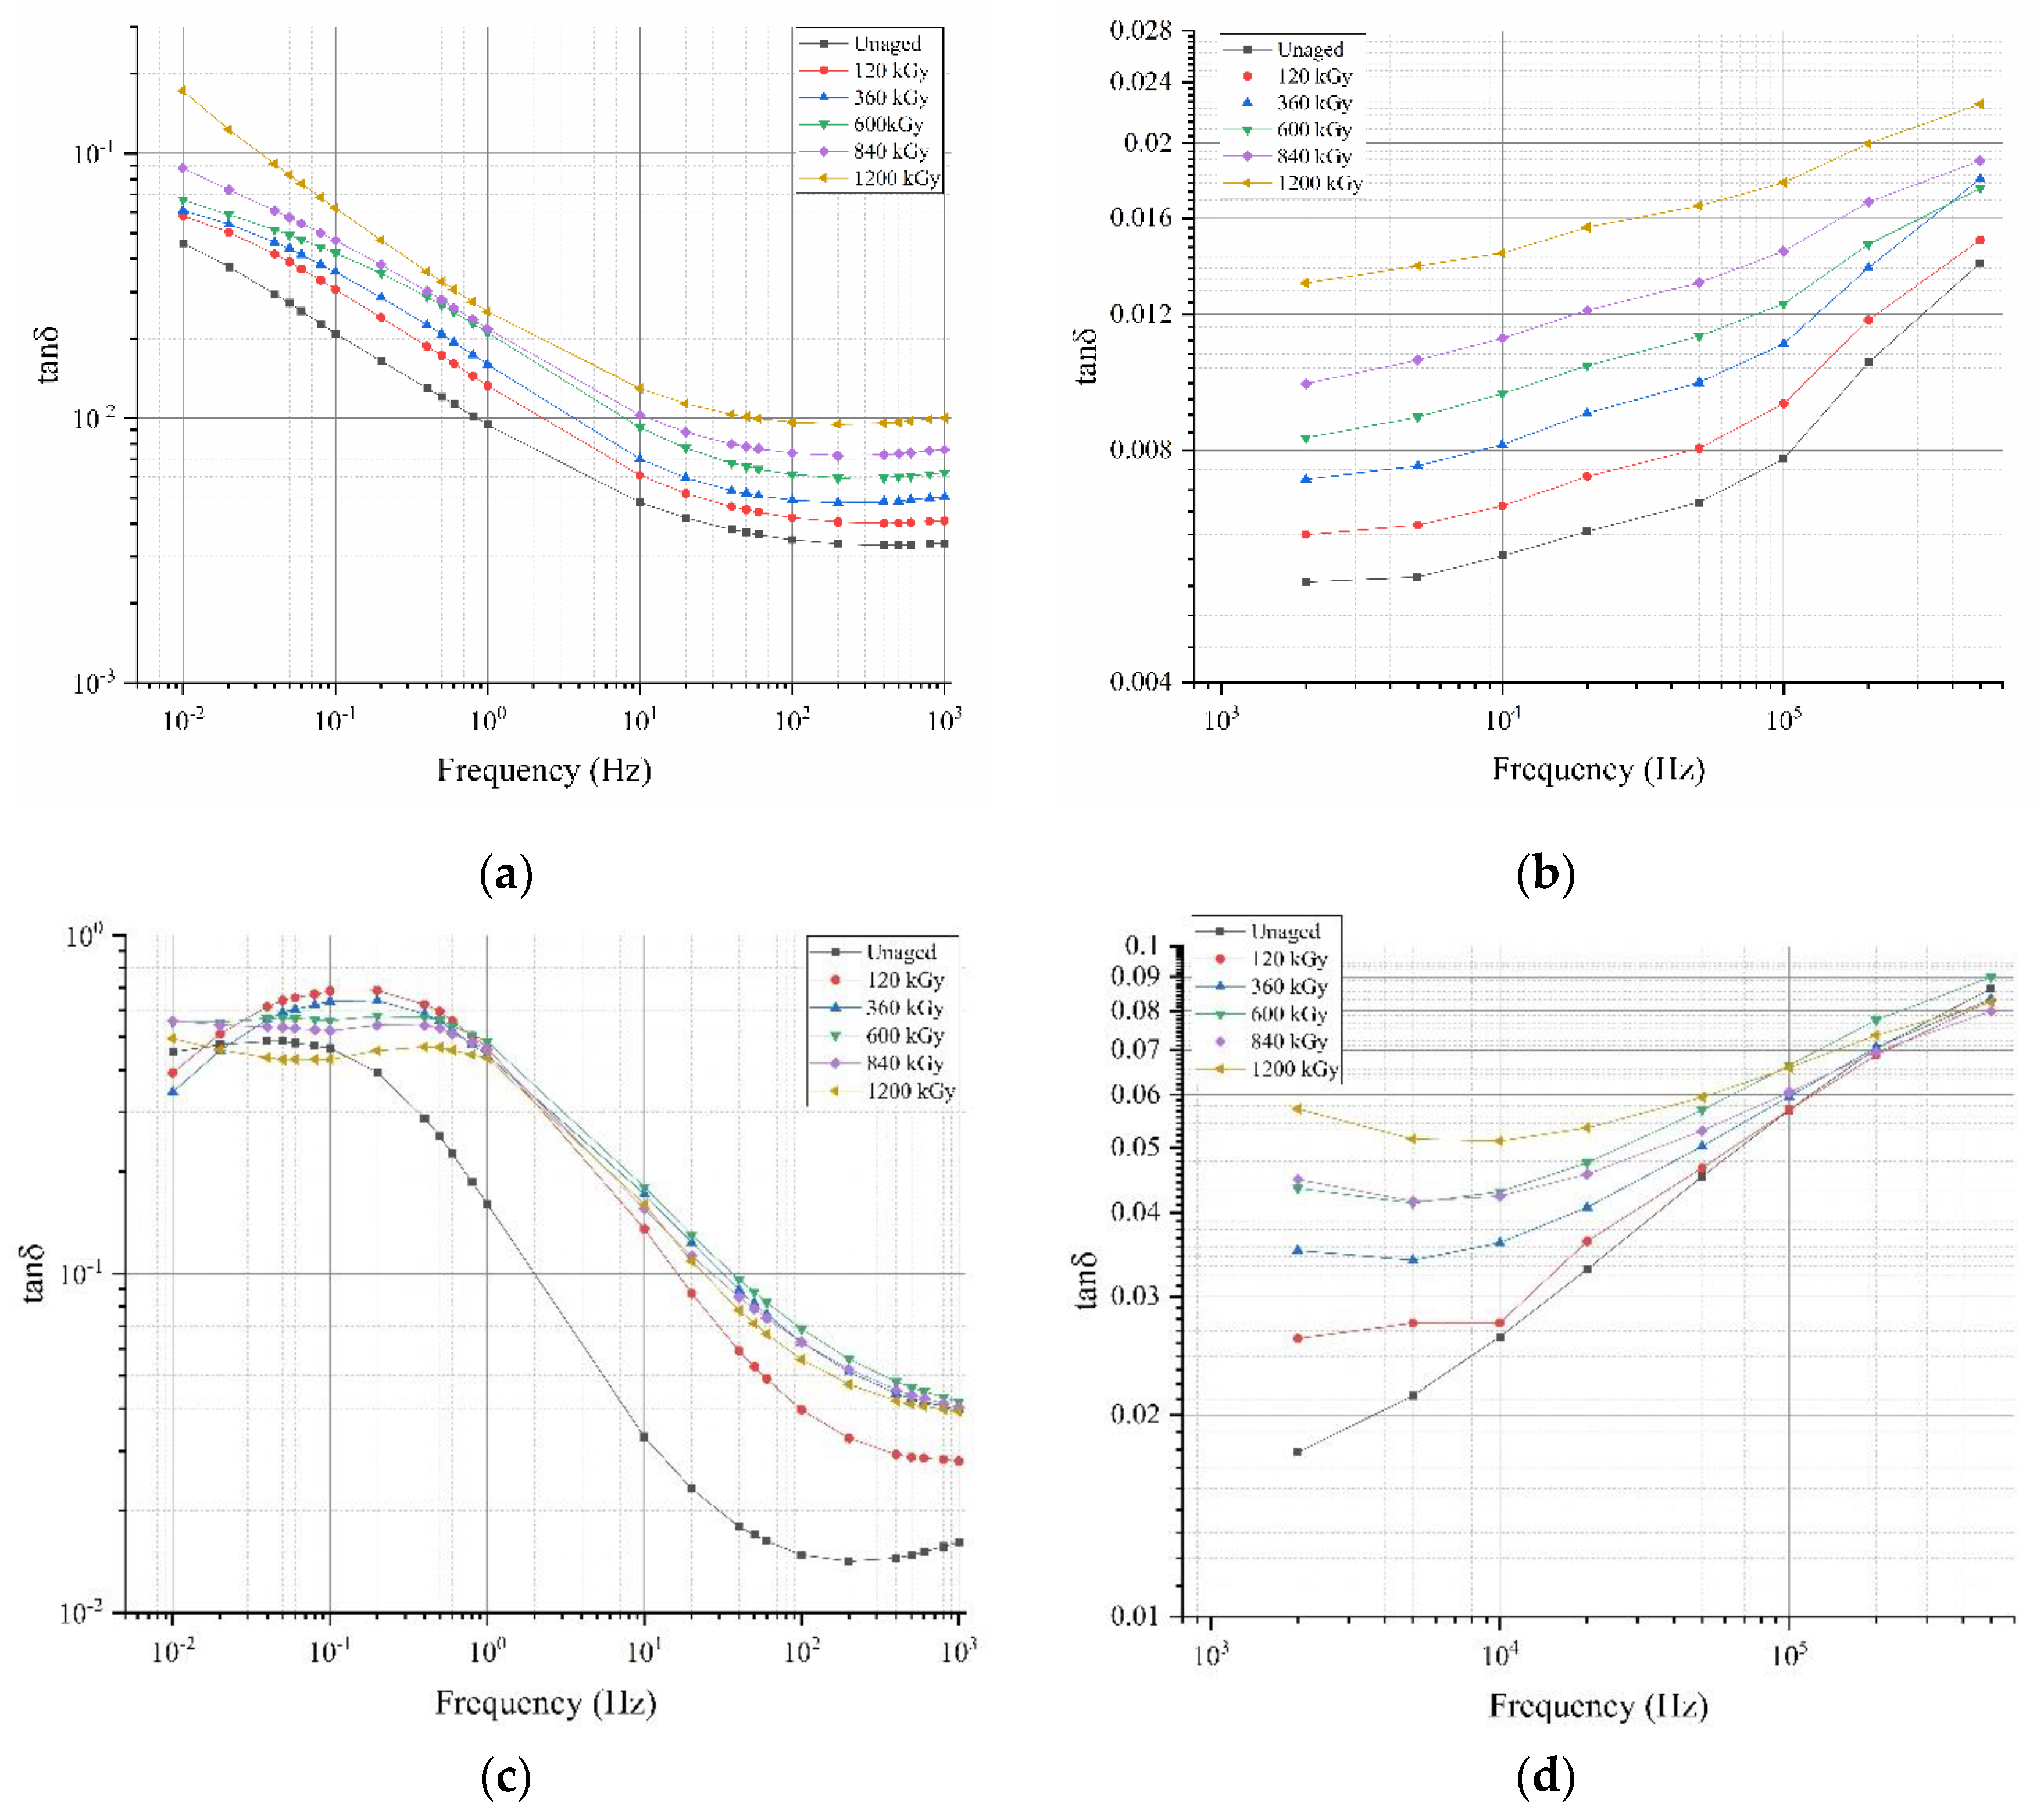
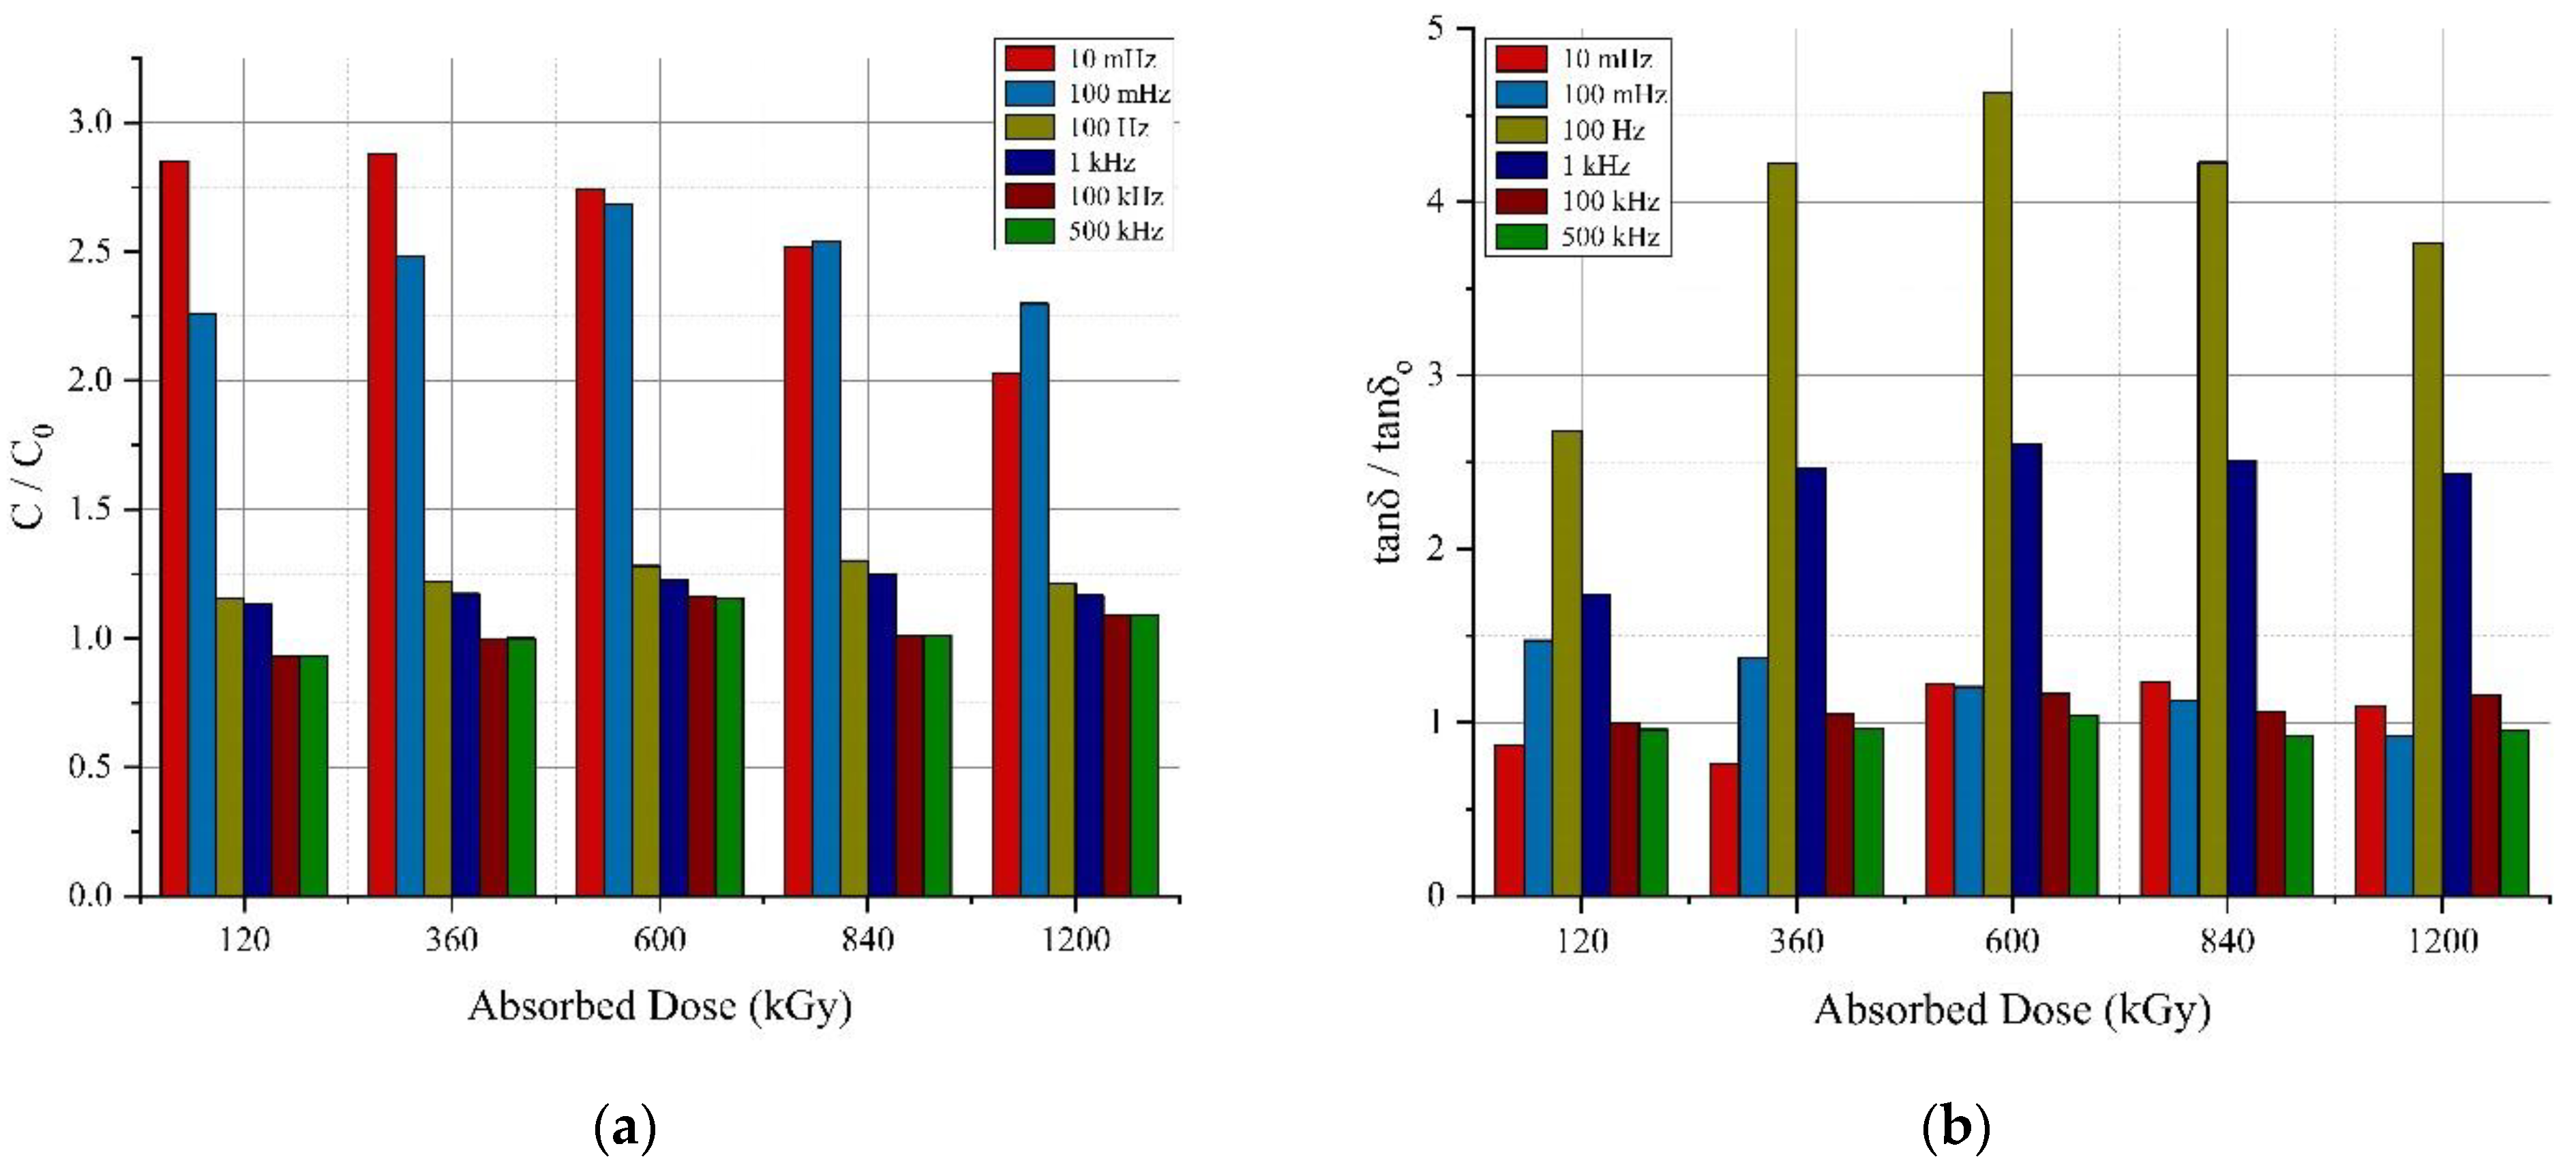
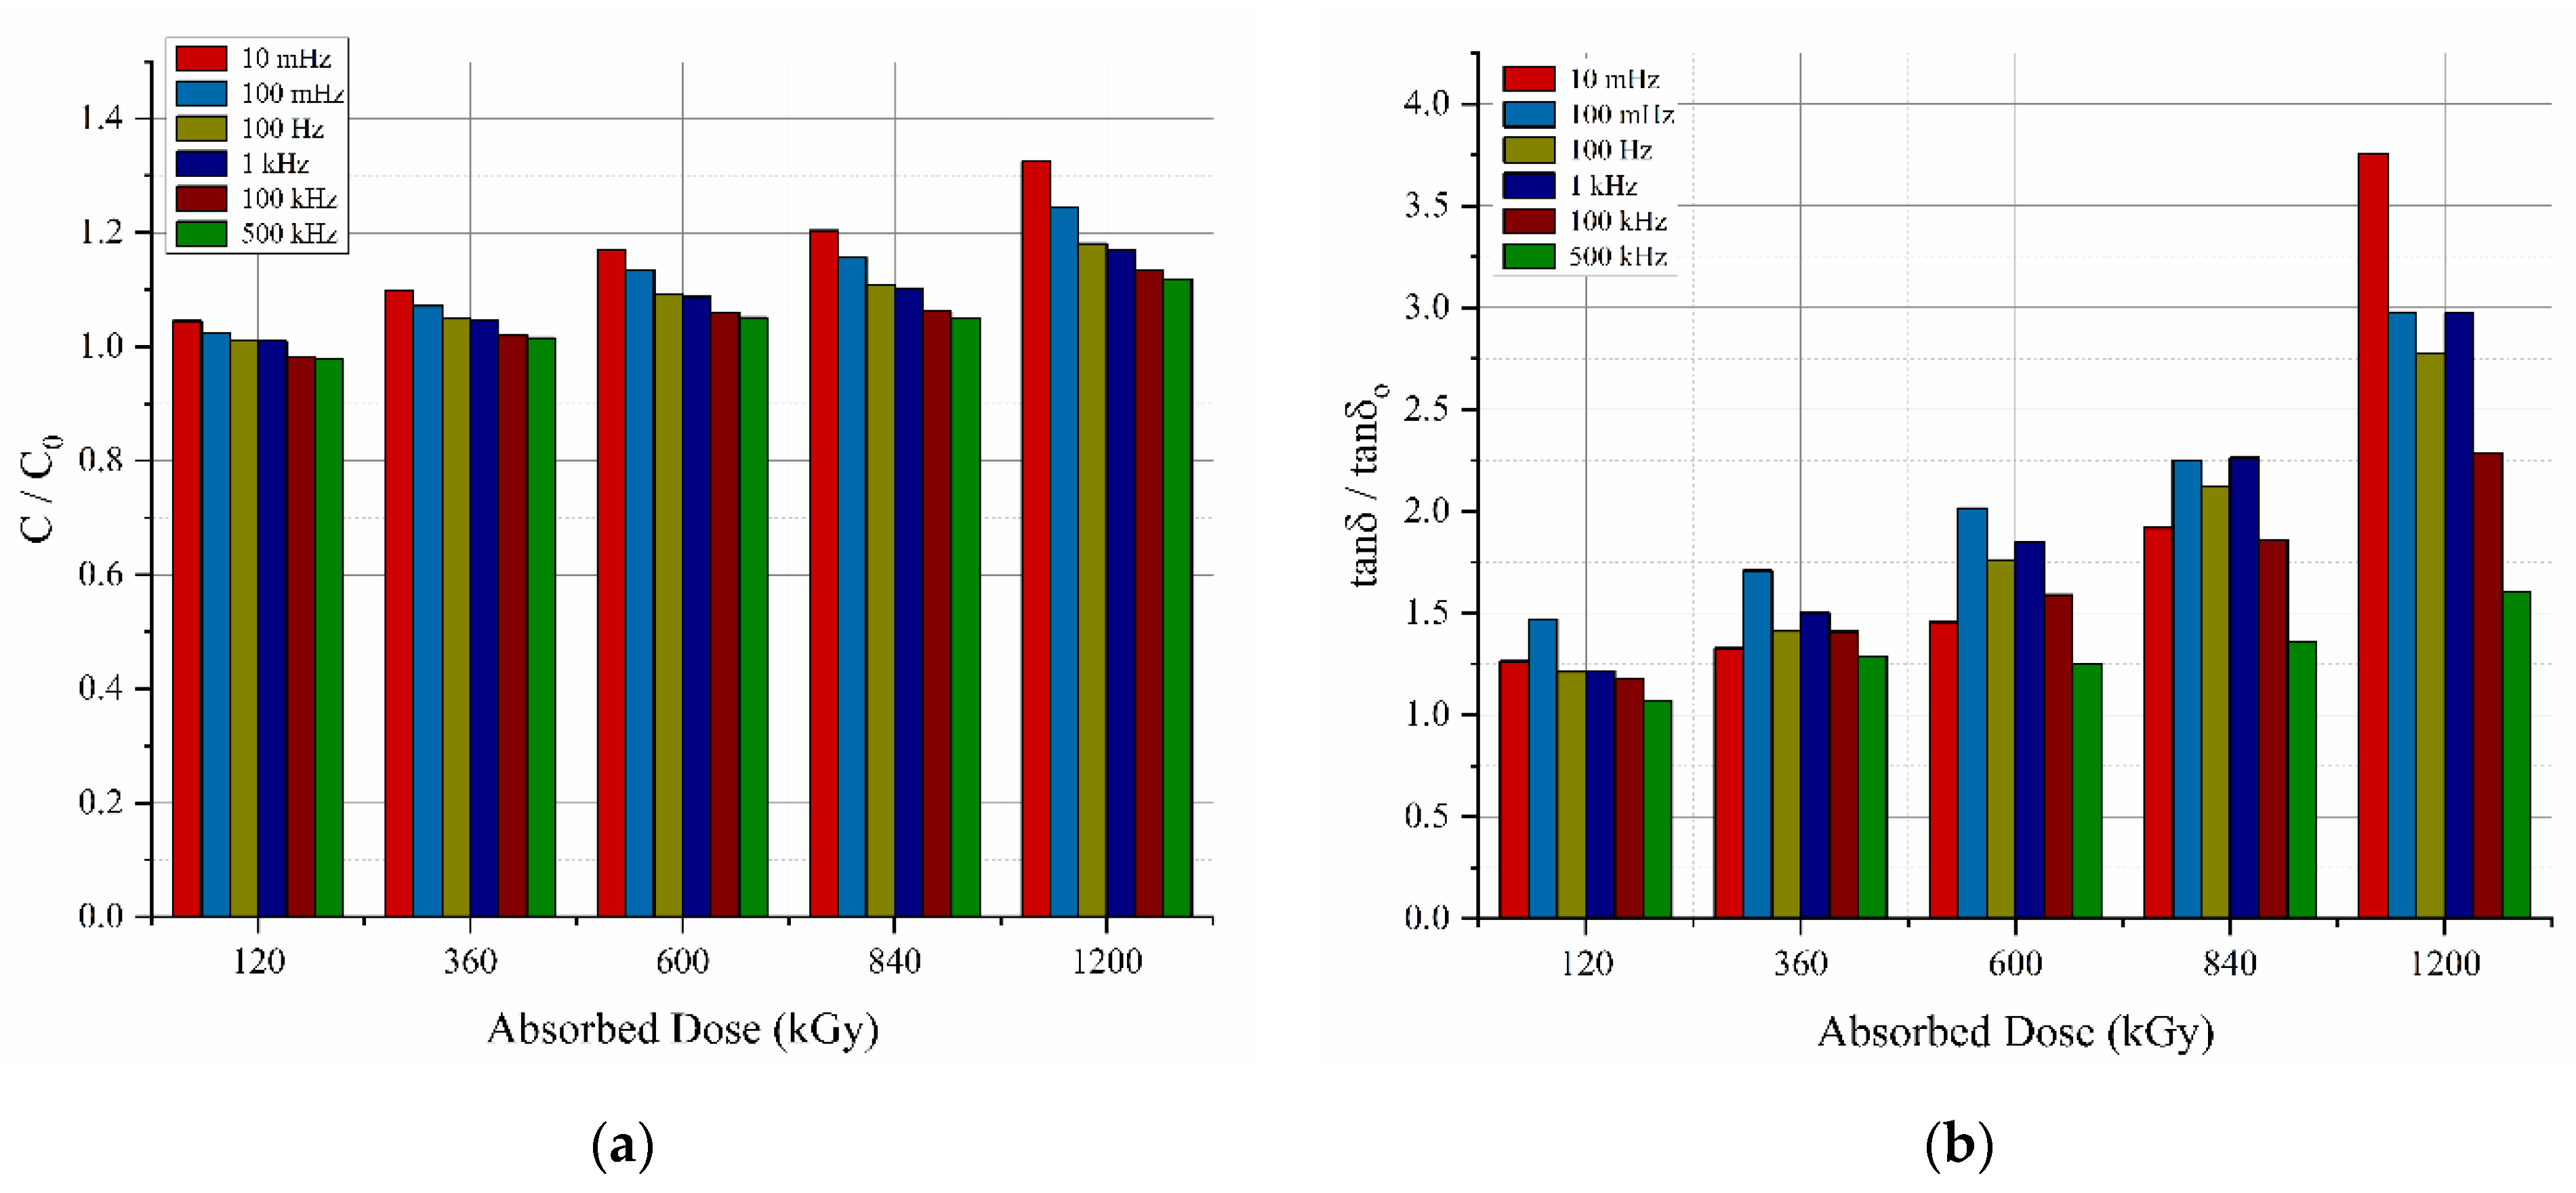
3.1. Capacitance and tan δ
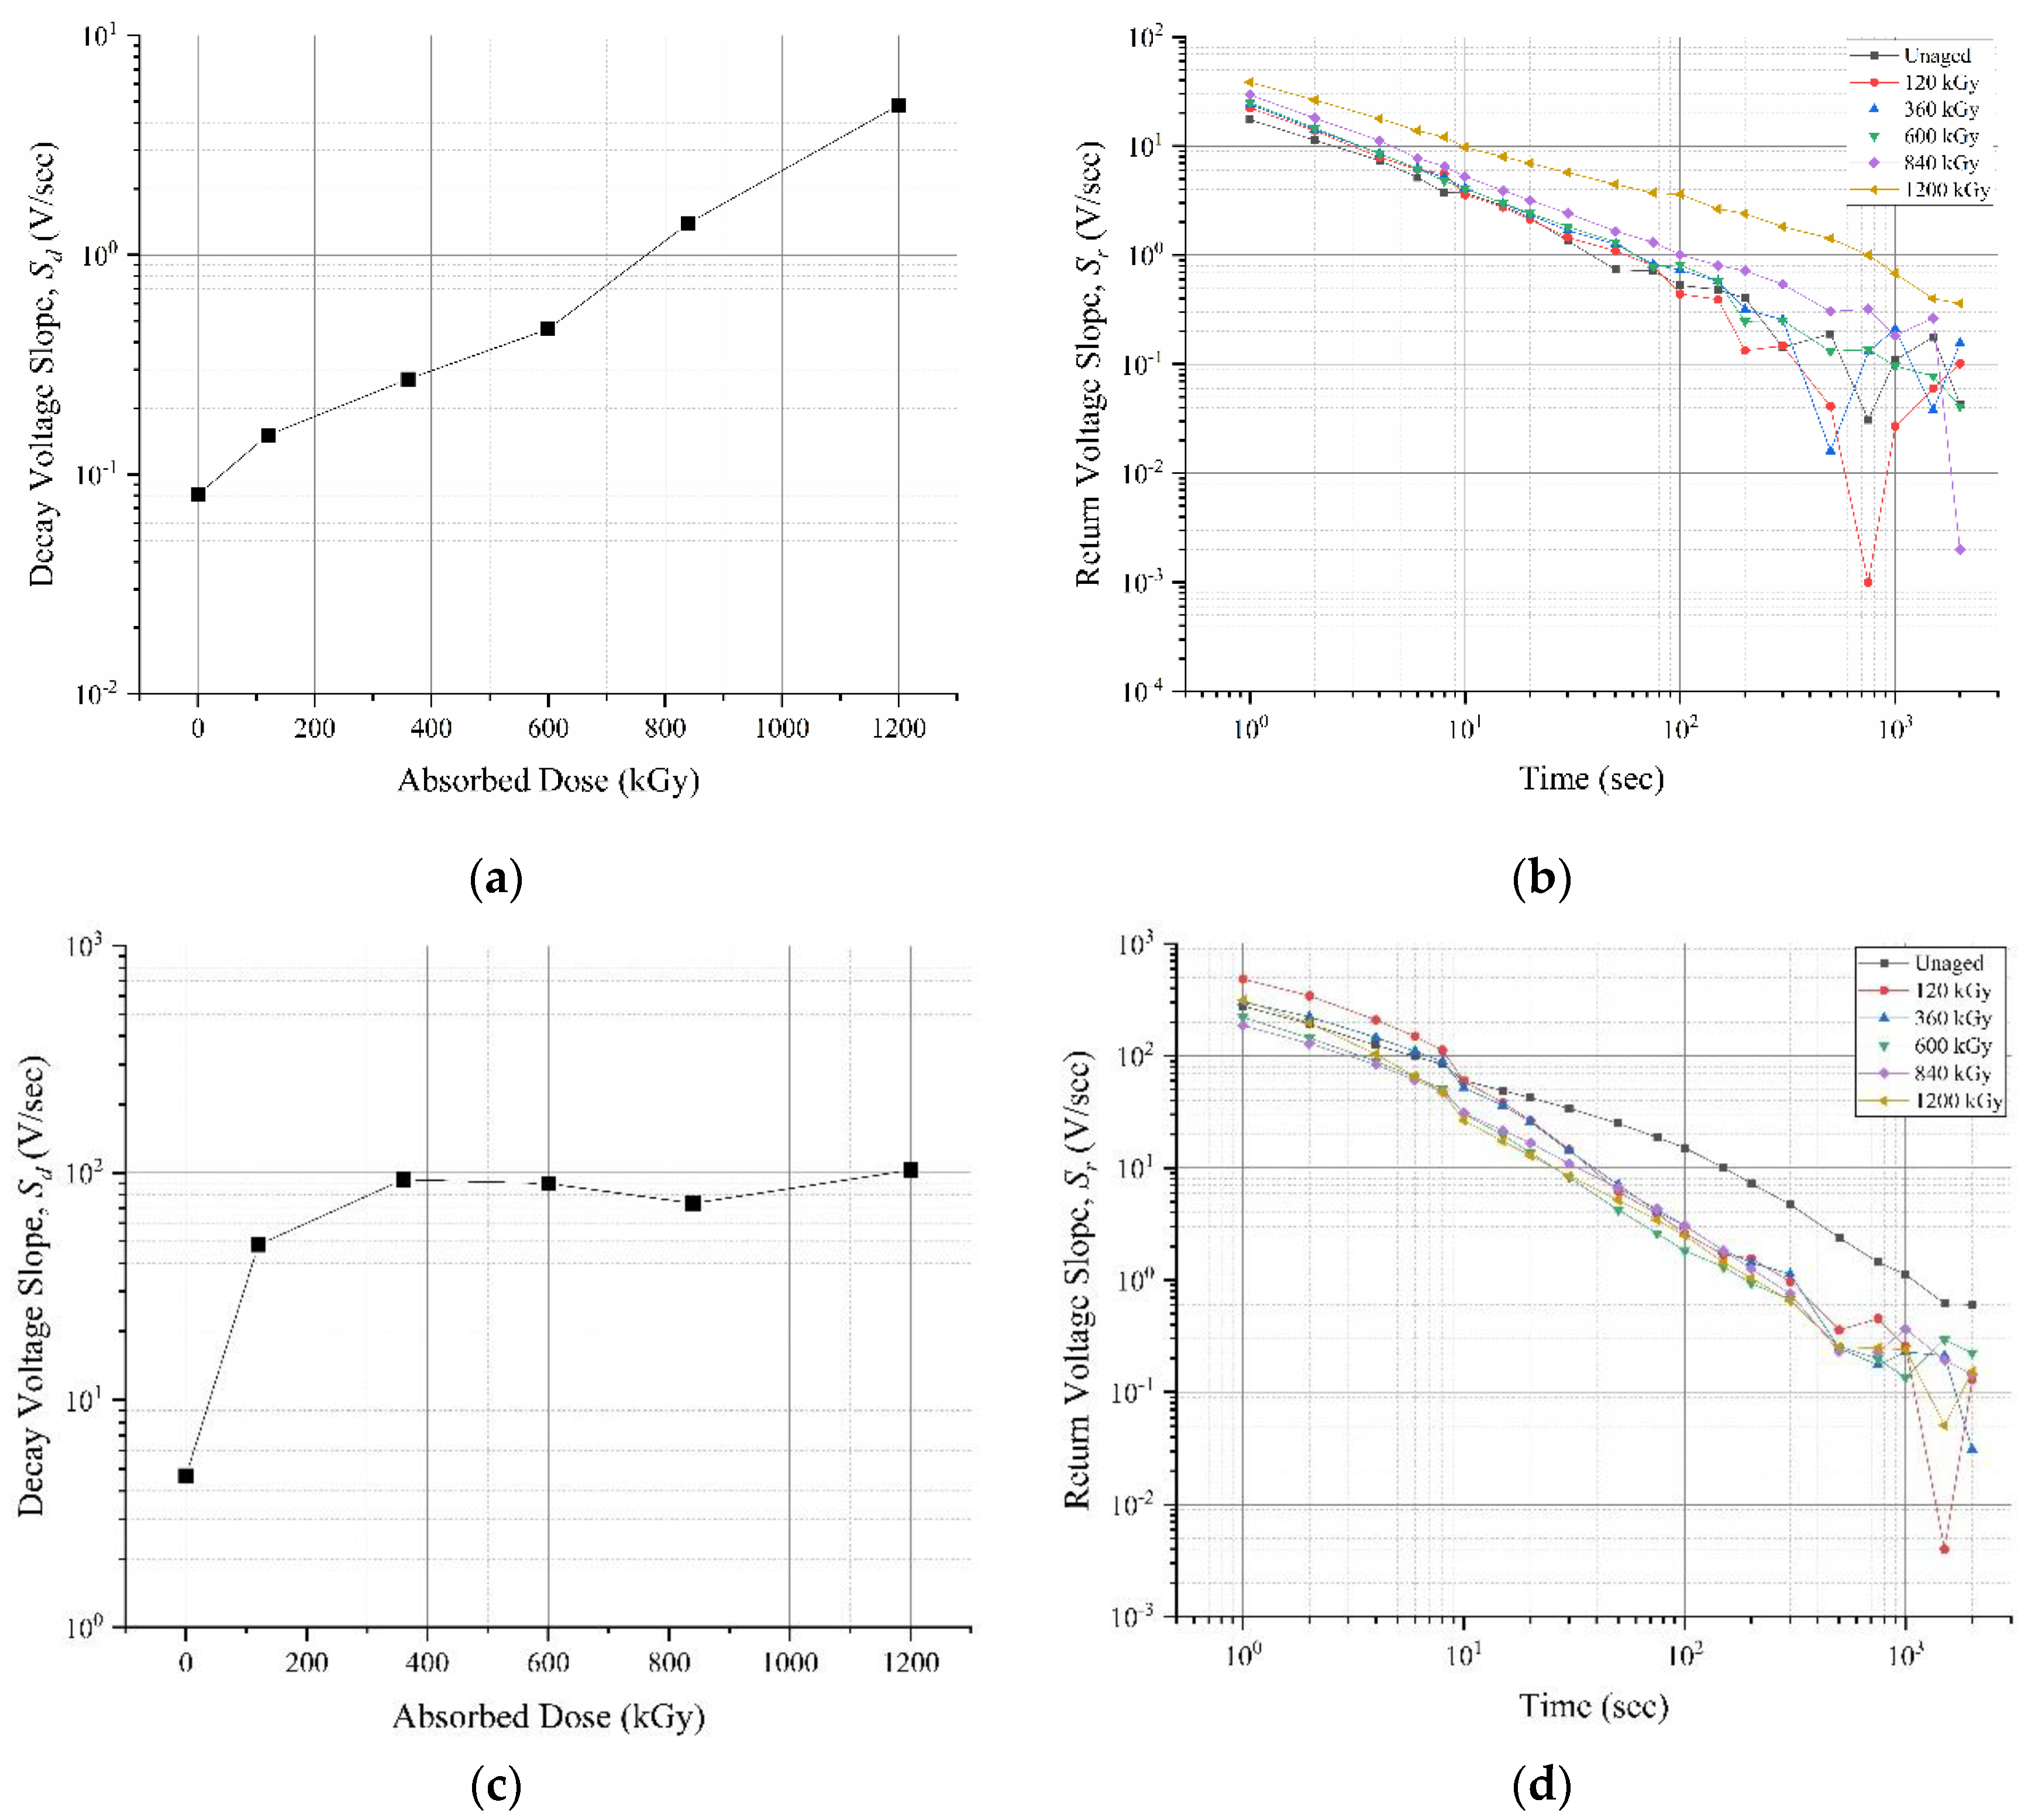
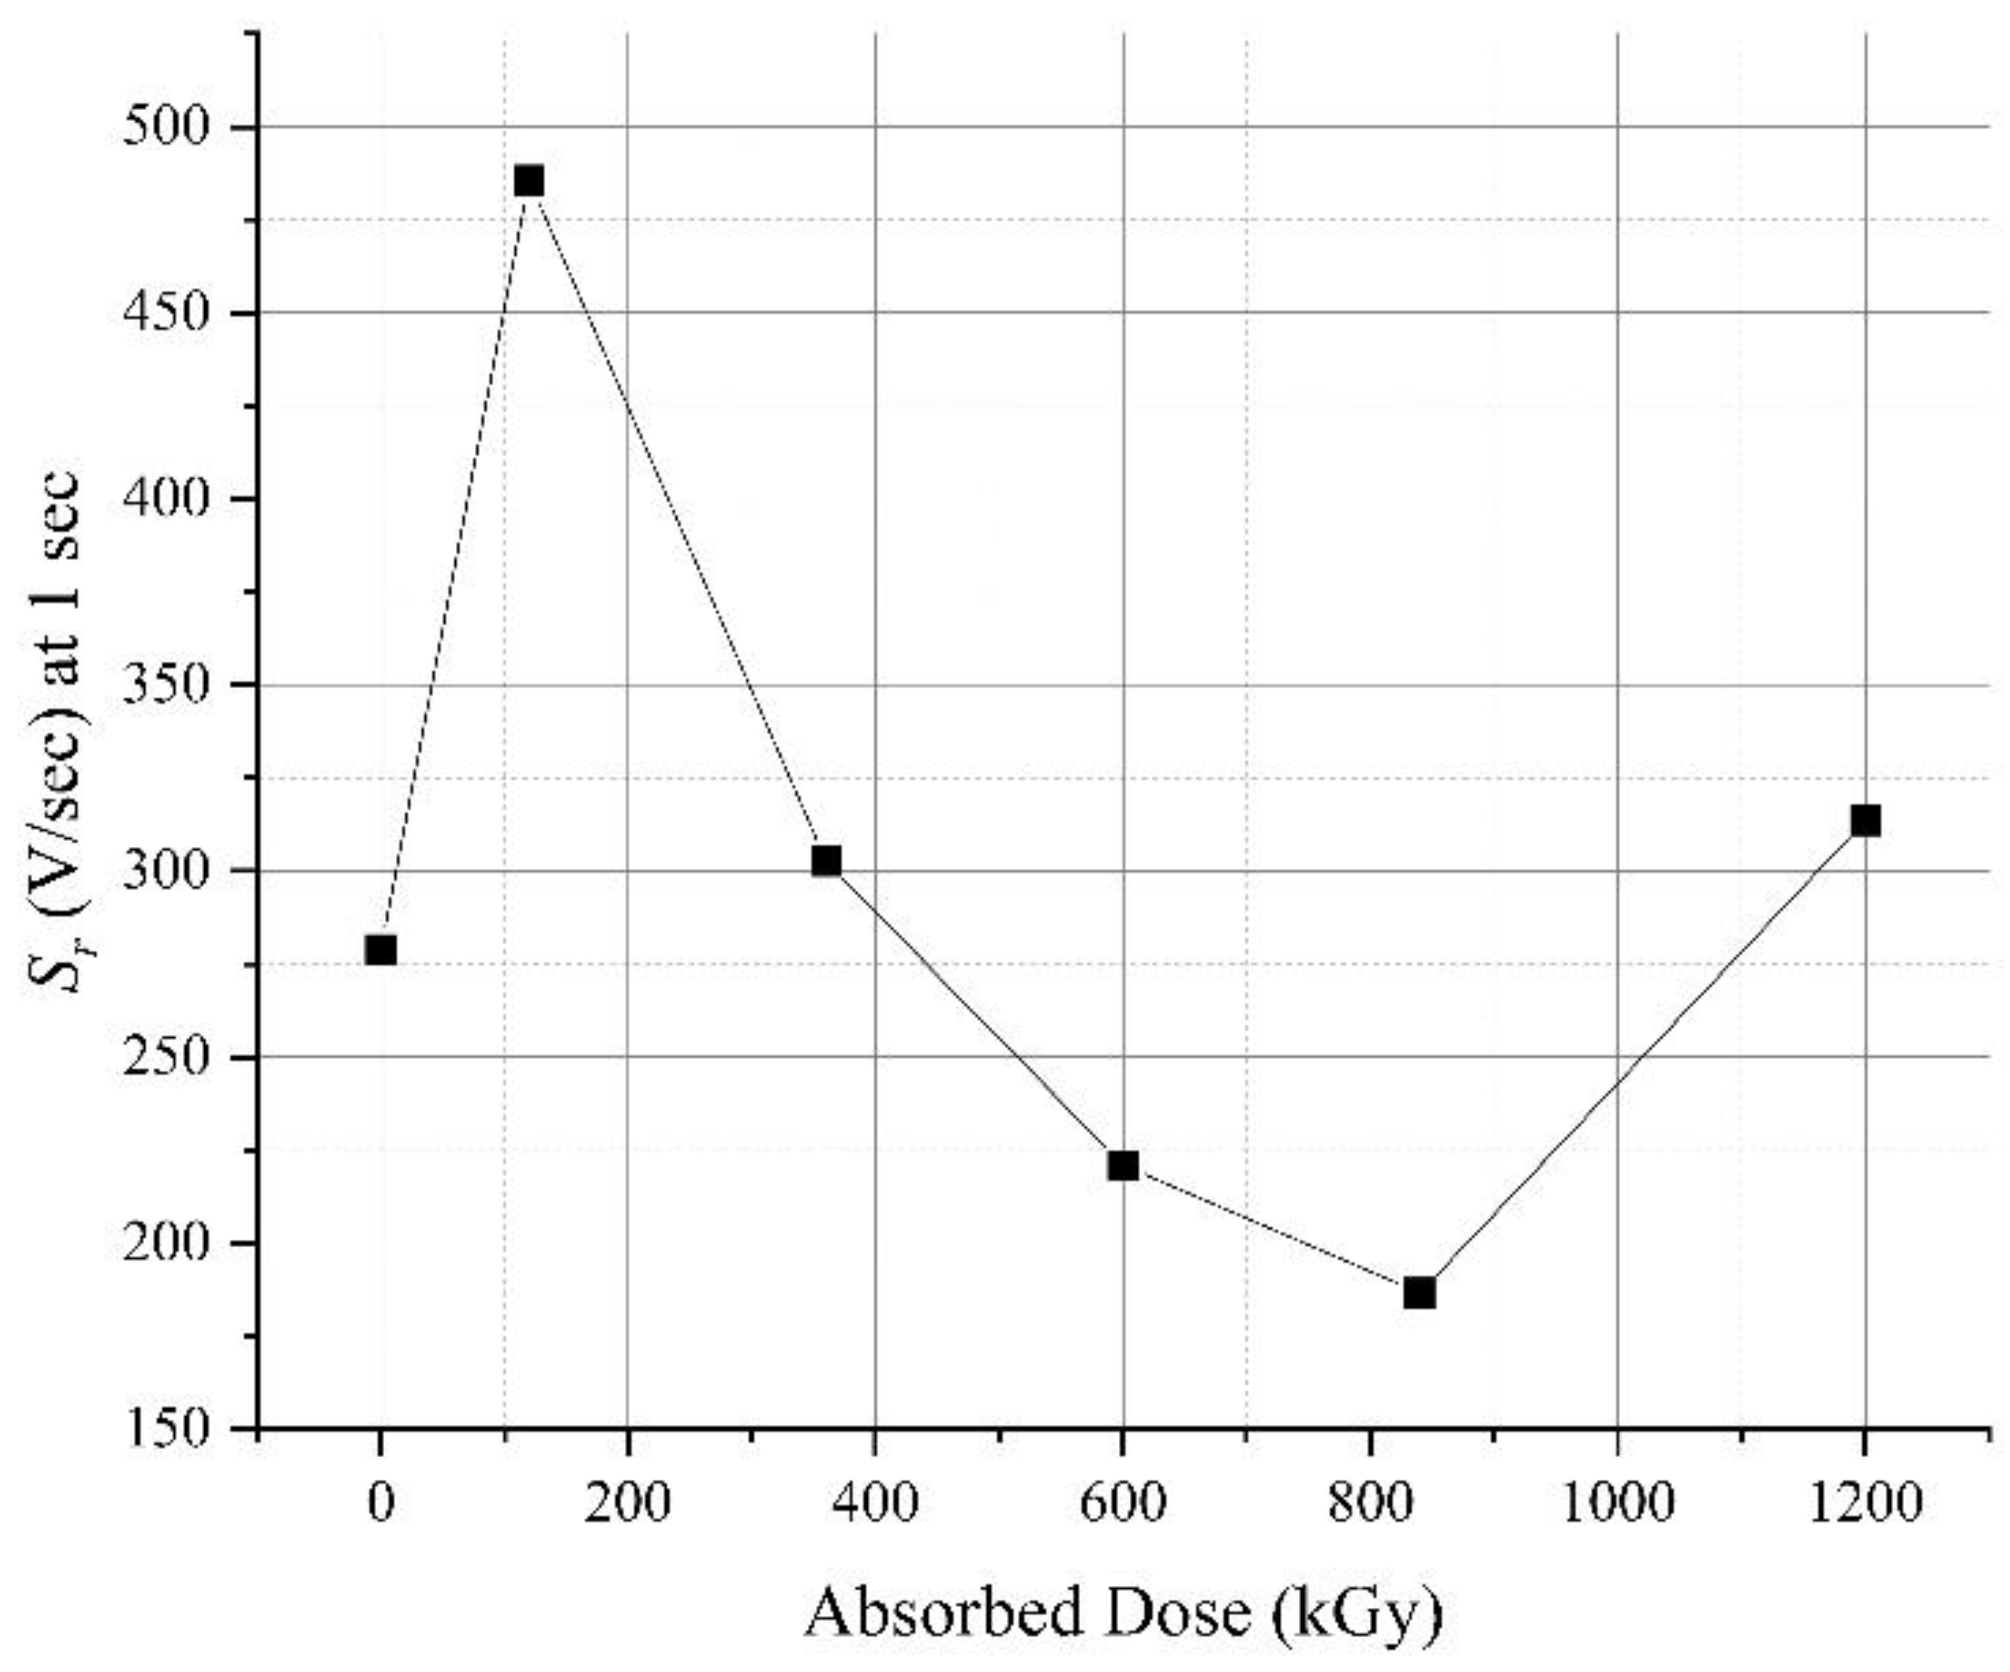
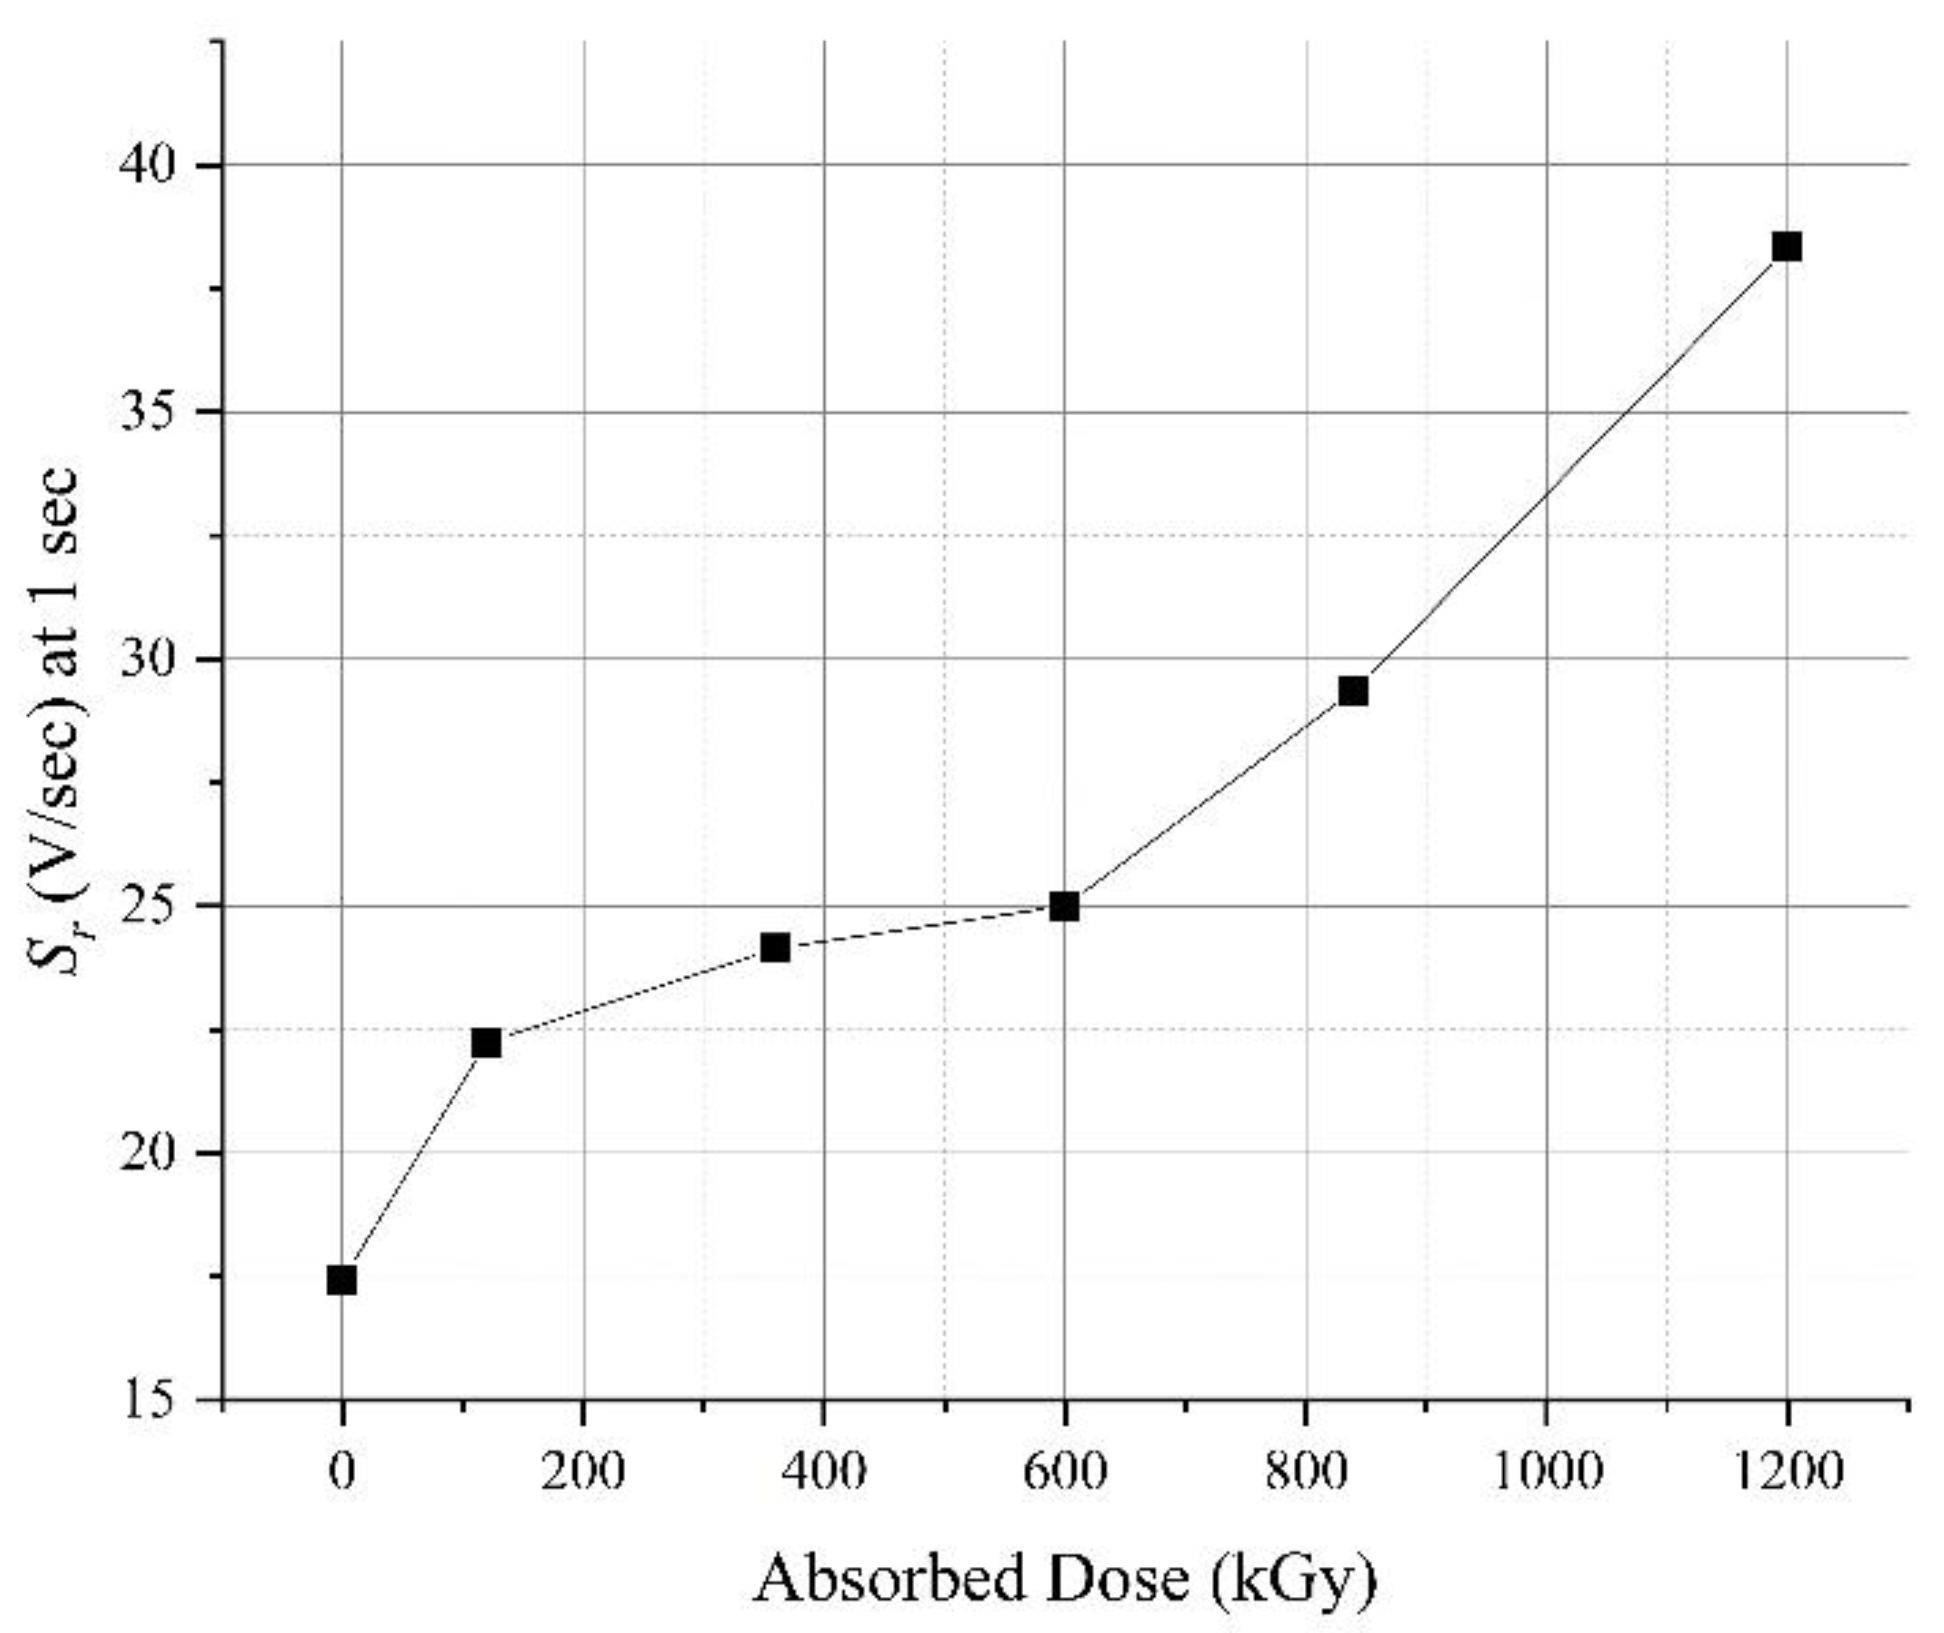
3.2. Extended Voltage Response
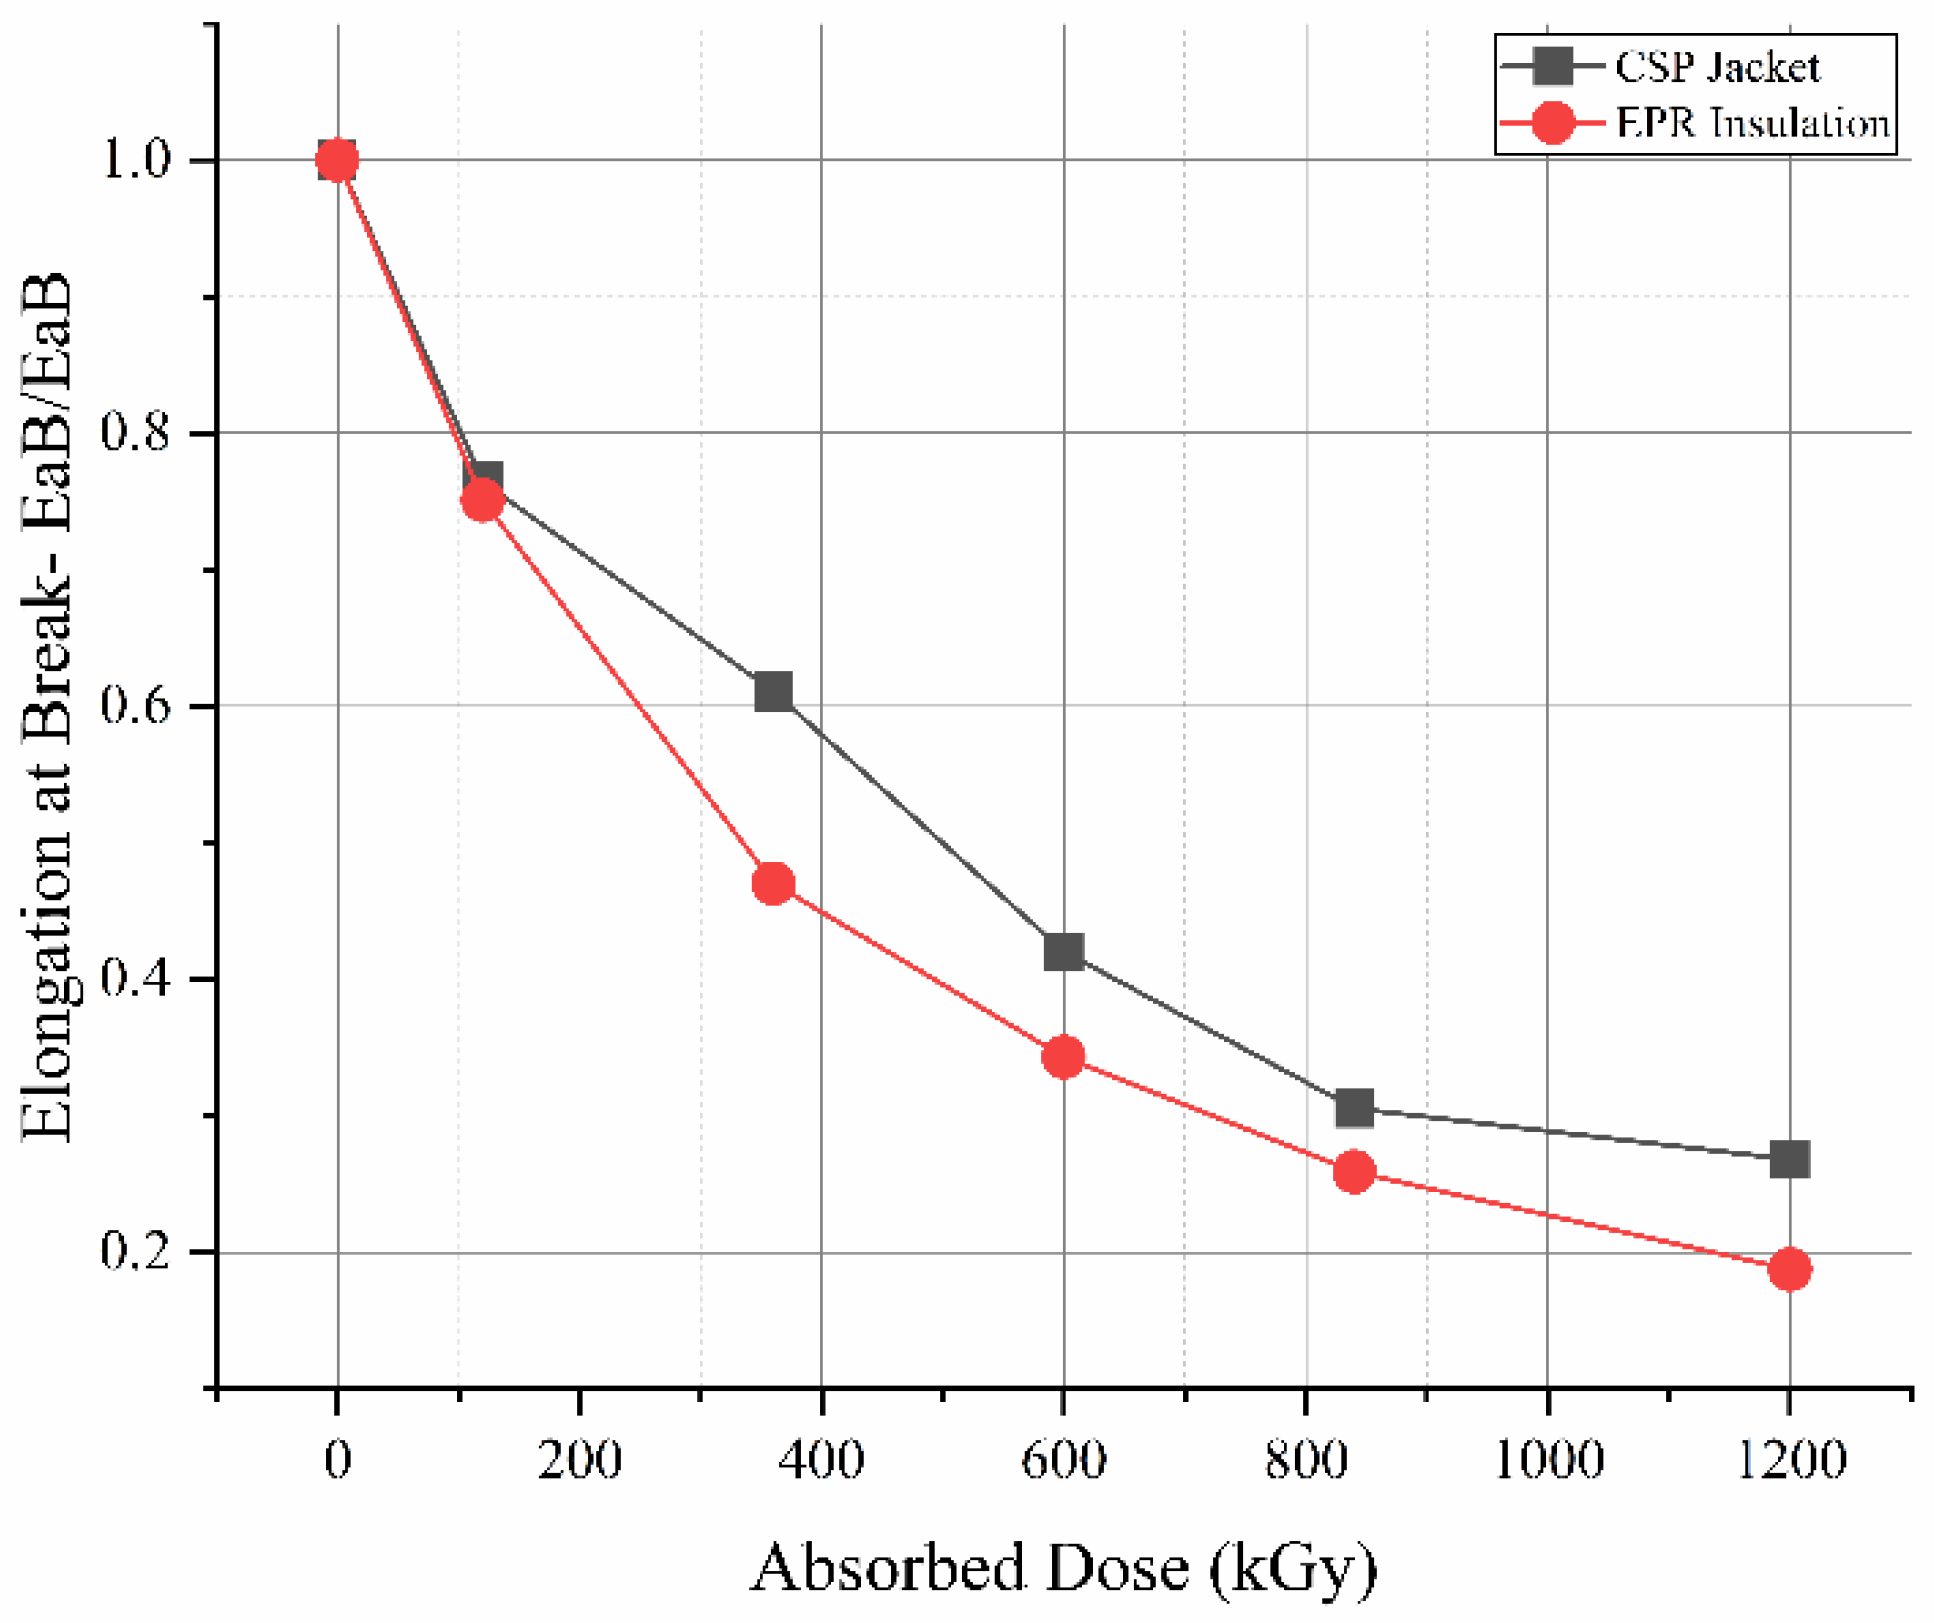
3.3. Elongation at Break
4. Discussion
4.1. EPR Insulation
4.2. CSPE Jacket
5. Correlation between Electrical and Mechanical Properties
6. Conclusions
Author Contributions
Funding
Institutional Review Board Statement
Informed Consent Statement
Data Availability Statement
Conflicts of Interest
References
- Mustafa, E.; Afia, R.S.A.; Tamus, Z.A. Application of Non-Destructive Condition Monitoring Techniques on Irradiated Low Voltage Unshielded Nuclear Power Cables. IEEE Access 2020, 8, 166024–166033. [Google Scholar] [CrossRef]
- Mustafa, E.; Afia, R.S.A.; Tamus, Z.Á. Dielectric loss and extended voltage response measurements for low-voltage power cables used in nuclear power plant: Potential methods for aging detection due to thermal stress. Electr. Eng. 2020. [Google Scholar] [CrossRef]
- International Atomic Energy Agency. Ageing Management for Nuclear Power Plants: International Generic Ageing Lessons Learned (IGALL); Safety Reports Series No. 82 (Rev. 1); International Atomic Energy Agency: Vienna, Austria, 2020. [Google Scholar]
- International Atomic Energy Agency. Benchmark Analysis for Condition Monitoring Test Techniques of Aged Low Voltage Cables in Nuclear Power Plants; International Atomic Energy Agency: Vienna, Austria, 2017. [Google Scholar]
- Chang, Y.S.; Mosleh, A. Probabilistic model of degradation of cable insulations in nuclear power plants. Proc. Inst. Mech. Eng. Part. O J. Risk Reliab. 2019. [Google Scholar] [CrossRef]
- Mustafa, E.; Afia, R.S.A.; Tamus, Z.Á. Condition Monitoring Uncertainties and Thermal-Radiation Multistress Accelerated Aging Tests for Nuclear Power Plant Cables: A Review. Period. Polytech. Electr. Eng. Comput. Sci. 2019, 64, 20–32. [Google Scholar] [CrossRef]
- Chen, G.; Banford, H.M.; Davies, A.E. Influence of radiation environments on space charge formation in y-irradiated LDPE. IEEE Trans. Dielectr. Electr. Insul. 1999, 6, 882–886. [Google Scholar] [CrossRef]
- Suraci, S.V.; Fabiani, D.; Xu, A.; Roland, S.; Colin, X. Ageing Assessment of XLPE LV Cables for Nuclear Applications through Physico-Chemical and Electrical Measurements. IEEE Access 2020, 8, 27086–27096. [Google Scholar] [CrossRef]
- Gao, Y.; Du, B.X. Effect of gamma-ray irradiation on permittivity and dielectric loss of polymer insulating materials. In Proceedings of the 2012 International Conference on High Voltage Engineering and Application, Shanghai, China, 17–20 September 2012; IEEE: Piscataway, NJ, USA, 2012; pp. 229–232. [Google Scholar] [CrossRef]
- Shao, Z.; Byler, M.I.; Liu, S.; Bowler, N.; Fifield, L.S.; Murphy, M.K. Dielectric Response of Cross-Linked Polyethylene (XLPE) Cable Insulation Material to Radiation and Thermal Aging. In Proceedings of the 2018 IEEE 2nd International Conference on Dielectrics (ICD), Budapest, Hungary, 1–5 July 2018; pp. 1–4. [Google Scholar] [CrossRef]
- Verardi, L.; Fabiani, D.; Montanari, G.C. Correlation of electrical and mechanical properties in accelerated aging of LV nuclear power plant cables. In Proceedings of the 2014 ICHVE International Conference on High Voltage Engineering and Application, Poznan, Poland, 8–11 September 2014; pp. 1–4. [Google Scholar] [CrossRef]
- Verardi, L.; Fabiani, D.; Montanari, G.C. Electrical aging markers for EPR-based low-voltage cable insulation wiring of nuclear power plants. Radiat. Phys. Chem. 2014, 94, 166–170. [Google Scholar] [CrossRef]
- Boukezzi, L.; Boubakeur, A. Effect of Thermal Aging on the Electrical Characteristics of XLPE for HV Cables. Trans. Electr. Electron. Mater. 2018, 19, 344–351. [Google Scholar] [CrossRef]
- Chi, X.; Li, J.; Ji, M.; Liu, W.; Li, S. Thermal-oxidative aging effects on the dielectric properties of nuclear cable insulation. Materials 2020, 13, 2215. [Google Scholar] [CrossRef]
- Ekelund, M.; Fantoni, P.F.; Gedde, U.W. Thermal ageing assessment of EPDM-chlorosulfonated polyethylene insulated cables using line resonance analysis (LIRA). Polym. Test. 2011, 30, 86–93. [Google Scholar] [CrossRef]
- Lee, C.-K.; Kwon, G.-Y.; Shin, Y.-J. Condition Assessment of I&C Cables in Nuclear Power Plants via Stepped-Frequency Waveform Reflectometry. IEEE Trans. Instrum. Meas. 2019, 68, 215–224. [Google Scholar] [CrossRef]
- Linde, E.; Verardi, L.; Fabiani, D.; Gedde, U.W. Dielectric spectroscopy as a condition monitoring technique for cable insulation based on crosslinked polyethylene. Polym. Test. 2015, 44, 135–142. [Google Scholar] [CrossRef]
- Bowler, N.; Liu, S. Aging Mechanisms and Monitoring of Cable Polymers. Progn. Health Manag. Soc. 2015, 6, 1–12. [Google Scholar]
- Mustafa, E.; Afia, R.S.A.; Tamus, Z.A. Investigation of Electrical and Mechanical Properties of Low Voltage Power Cables under Thermal Stress. In Proceedings of the 2020 International Conference on Diagnostics in Electrical Engineering (Diagnostika), Pilsen, Czech Republic, 1–4 September 2020; pp. 1–4. [Google Scholar] [CrossRef]
- Morsalin, S.; Phung, T.B.; Danikas, M.; Mawad, D. Diagnostic challenges in dielectric loss assessment and interpretation: A review. IET Sci. Meas. Technol. 2019, 13, 767–782. [Google Scholar] [CrossRef]
- Lee, C.; Lee, K.-B. Radiation effects on dielectric properties of ethylene propylene rubber. J. Ind. Eng. Chem. 2008, 14, 473–479. [Google Scholar] [CrossRef]
- Yizhou, Z.; Lei, W.; Pengyu, Z.; Liang, W.; Xuan, G.; Ge, T.; Huiming, M. Ageing Inspection for Cross-Linked Polyolefin Insulation Cable in NPP Using Dielectric Property. In Volume 1: Operations and Maintenance, Engineering, Modifications, Life Extension, Life Cycle and Balance of Plant; I&C, Digital Controls and Influence of Human Factors; American Society of Mechanical Engineers: New York, NY, USA, 2017; pp. 1–6. [Google Scholar]
- Csányi, G.M.; Bal, S.; Tamus, Z.Á. Dielectric Measurement Based Deducted Quantities to Track Repetitive, Short-Term Thermal Aging of Polyvinyl Chloride (PVC) Cable Insulation. Polymers 2020, 12, 2809. [Google Scholar] [CrossRef] [PubMed]
- Mustafa, E.; Afia, R.S.A.; Tamus, Z.Á. Condition Assessment of Low Voltage Photovoltaic DC Cables under Thermal Stress Using Non-Destructive Electrical Techniques. Trans. Electr. Electron. Mater. 2020, 21, 503–512. [Google Scholar] [CrossRef]
- 62582-3-2012-IEC/IEEE International Standard-Nuclear Power Plants-Instrumentation and Control. Important to Safety—Electrical Equipment Condition Monitoring Methods—Part. 3 Elongation at Break; IEEE: Piscataway, NJ, USA, 2012; ISBN 978-0-7381-8088-5.
- Gong, Y.; Hu, S.M.; Yang, X.L.; Fei, J.L.; Yang, Z.G.; Shi, X.Q.; Xie, Y.C.; Guo, A.H.; Xu, J.F. Comparative study on degradation of ethylene-propylene rubber for nuclear cables from gamma and beta irradiation. Polym. Test. 2017, 60, 102–109. [Google Scholar] [CrossRef]
- Suraci, S.V.; Fabiani, D.; Mazzocchetti, L.; Giorgini, L. Degradation assessment of polyethylene-based material through electrical and chemical-physical analyses. Energies 2020, 13, 650. [Google Scholar] [CrossRef] [Green Version]
- Menczel, J.D.; Prime, R.B. (Eds.) Thermal Analysis of Polymers: Fundamentals and Applications; Wiley: Hoboken, NJ, USA, 2009; ISBN 978-0-471-76917-0. [Google Scholar]
- Jonscher, A.K. Dielectric relaxation in solids. J. Phys. D. Appl. Phys. 1999, 32, R57. [Google Scholar] [CrossRef]
- Gillen, K.T.; Bernstein, R.; Clough, R.L.; Celina, M. Lifetime predictions for semi-crystalline cable insulation materials: I. Mechanical properties and oxygen consumption measurements on EPR materials. Polym. Degrad. Stab. 2006, 91, 2146–2156. [Google Scholar] [CrossRef]
- Gillen, K.T.; Celina, M.; Clough, R.L. Density measurements as a condition monitoring approach for following the aging of nuclear power plant cable materials. Radiat. Phys. Chem. 1999, 56, 429–447. [Google Scholar] [CrossRef]
- Chailan, J.F.; Boiteux, G.; Chauchard, J.; Pinel, B.; Seytre, G. Effects of thermal degradation on the viscoelastic and dielectric properties of chlorosulfonated polyethylene (CSPE) compounds. Polym. Degrad. Stab. 1995, 48, 61–65. [Google Scholar] [CrossRef]
- Mustafa, E.; Tamus, Á.Z.; Afia, R.S.A. Thermal Degradation and Condition Monitoring of Low Voltage Power Cables in Nuclear Power Industry. IFIP Adv. Inf. Commun. Technol. 2019, 553. [Google Scholar] [CrossRef]
- Foucault, F.; Esnouf, S.; Le Moël, A. Irradiation/temperature synergy effects on degradation and ageing of chlorosulphonated polyethylene. Nucl. Instrum. Methods Phys. Res. Sect. B Beam Interact. Mater. Atom. 2001, 185, 311–317. [Google Scholar] [CrossRef]
- Boukezzi, L.; Rondot, S.; Jbara, O.; Boubakeur, A. A time-resolved current method and TSC under vacuum conditions of SEM: Trapping and detrapping processes in thermal aged XLPE insulation cables. Nucl. Instrum. Methods Phys. Res. Sect. B Beam Interact. Mater. Atoms 2017, 394, 126–133. [Google Scholar] [CrossRef]
- Gillen, K.T.; Assink, R.; Bernstein, R.; Celina, M. Condition monitoring methods applied to degradation of chlorosulfonated polyethylene cable jacketing materials. Polym. Degrad. Stab. 2006, 91, 1273–1288. [Google Scholar] [CrossRef]
- Calmet, J.F.; Carlin, F.; Nguyen, T.M.; Bousquet, S.; Quinot, P. Irradiation ageing of CSPE/EPR control command electric cables. Correlation between mechanical properties and oxidation. Radiat. Phys. Chem. 2002, 63, 235–239. [Google Scholar] [CrossRef]
- Gillen, K.T.; Bernstein, R.; Celina, M. Non-Arrhenius behavior for oxidative degradation of chlorosulfonated polyethylene materials. Polym. Degrad. Stab. 2005, 87, 335–346. [Google Scholar] [CrossRef]


| Device | Frequency Range | Input Voltage |
|---|---|---|
| Omicron Dirana | 10 mHz–1 kHz | 100 Vrms |
| Wayne Kerr Component Analyzer | 2 kHz–500 kHz | 5 Vrms |
| Electrical Quantities | EPR | CSPE | |
|---|---|---|---|
| EaB | EaB | ||
| 10 mHz | Capacitance | 0.9729 | 0.2043 |
| tan δ | 0.7994 | 0.3835 | |
| 100 mHz | Capacitance | 0.9729 | 0.6095 |
| tan δ | 0.9582 | 0.1503 | |
| 100 Hz | Capacitance | 0.9572 | 0.7707 |
| tan δ | 0.9808 | 0.7194 | |
| 1 kHz | Capacitance | 0.9579 | 0.7515 |
| tan δ | 0.9889 | 0.6333 | |
| 100 kHz | Capacitance | 0.8595 | 0.327 |
| tan δ | 0.9906 | 0.6192 | |
| Sd | 0.9435 | 0.7418 | |
| Sr at 1 s | 0.9138 | 0.2354 | |
Publisher’s Note: MDPI stays neutral with regard to jurisdictional claims in published maps and institutional affiliations. |
© 2021 by the authors. Licensee MDPI, Basel, Switzerland. This article is an open access article distributed under the terms and conditions of the Creative Commons Attribution (CC BY) license (https://creativecommons.org/licenses/by/4.0/).
Share and Cite
Mustafa, E.; Afia, R.S.A.; Nouini, O.; Tamus, Z.Á. Implementation of Non-Destructive Electrical Condition Monitoring Techniques on Low-Voltage Nuclear Cables: I. Irradiation Aging of EPR/CSPE Cables. Energies 2021, 14, 5139. https://doi.org/10.3390/en14165139
Mustafa E, Afia RSA, Nouini O, Tamus ZÁ. Implementation of Non-Destructive Electrical Condition Monitoring Techniques on Low-Voltage Nuclear Cables: I. Irradiation Aging of EPR/CSPE Cables. Energies. 2021; 14(16):5139. https://doi.org/10.3390/en14165139
Chicago/Turabian StyleMustafa, Ehtasham, Ramy S. A. Afia, Oumaima Nouini, and Zoltán Ádám Tamus. 2021. "Implementation of Non-Destructive Electrical Condition Monitoring Techniques on Low-Voltage Nuclear Cables: I. Irradiation Aging of EPR/CSPE Cables" Energies 14, no. 16: 5139. https://doi.org/10.3390/en14165139
APA StyleMustafa, E., Afia, R. S. A., Nouini, O., & Tamus, Z. Á. (2021). Implementation of Non-Destructive Electrical Condition Monitoring Techniques on Low-Voltage Nuclear Cables: I. Irradiation Aging of EPR/CSPE Cables. Energies, 14(16), 5139. https://doi.org/10.3390/en14165139