
Verifying the Efficiency of a Diesel Particulate Filter Using Particle Counters with Two Different Measurements in Periodic Technical Inspection of Vehicles


Abstract
:1. Introduction
- (1)
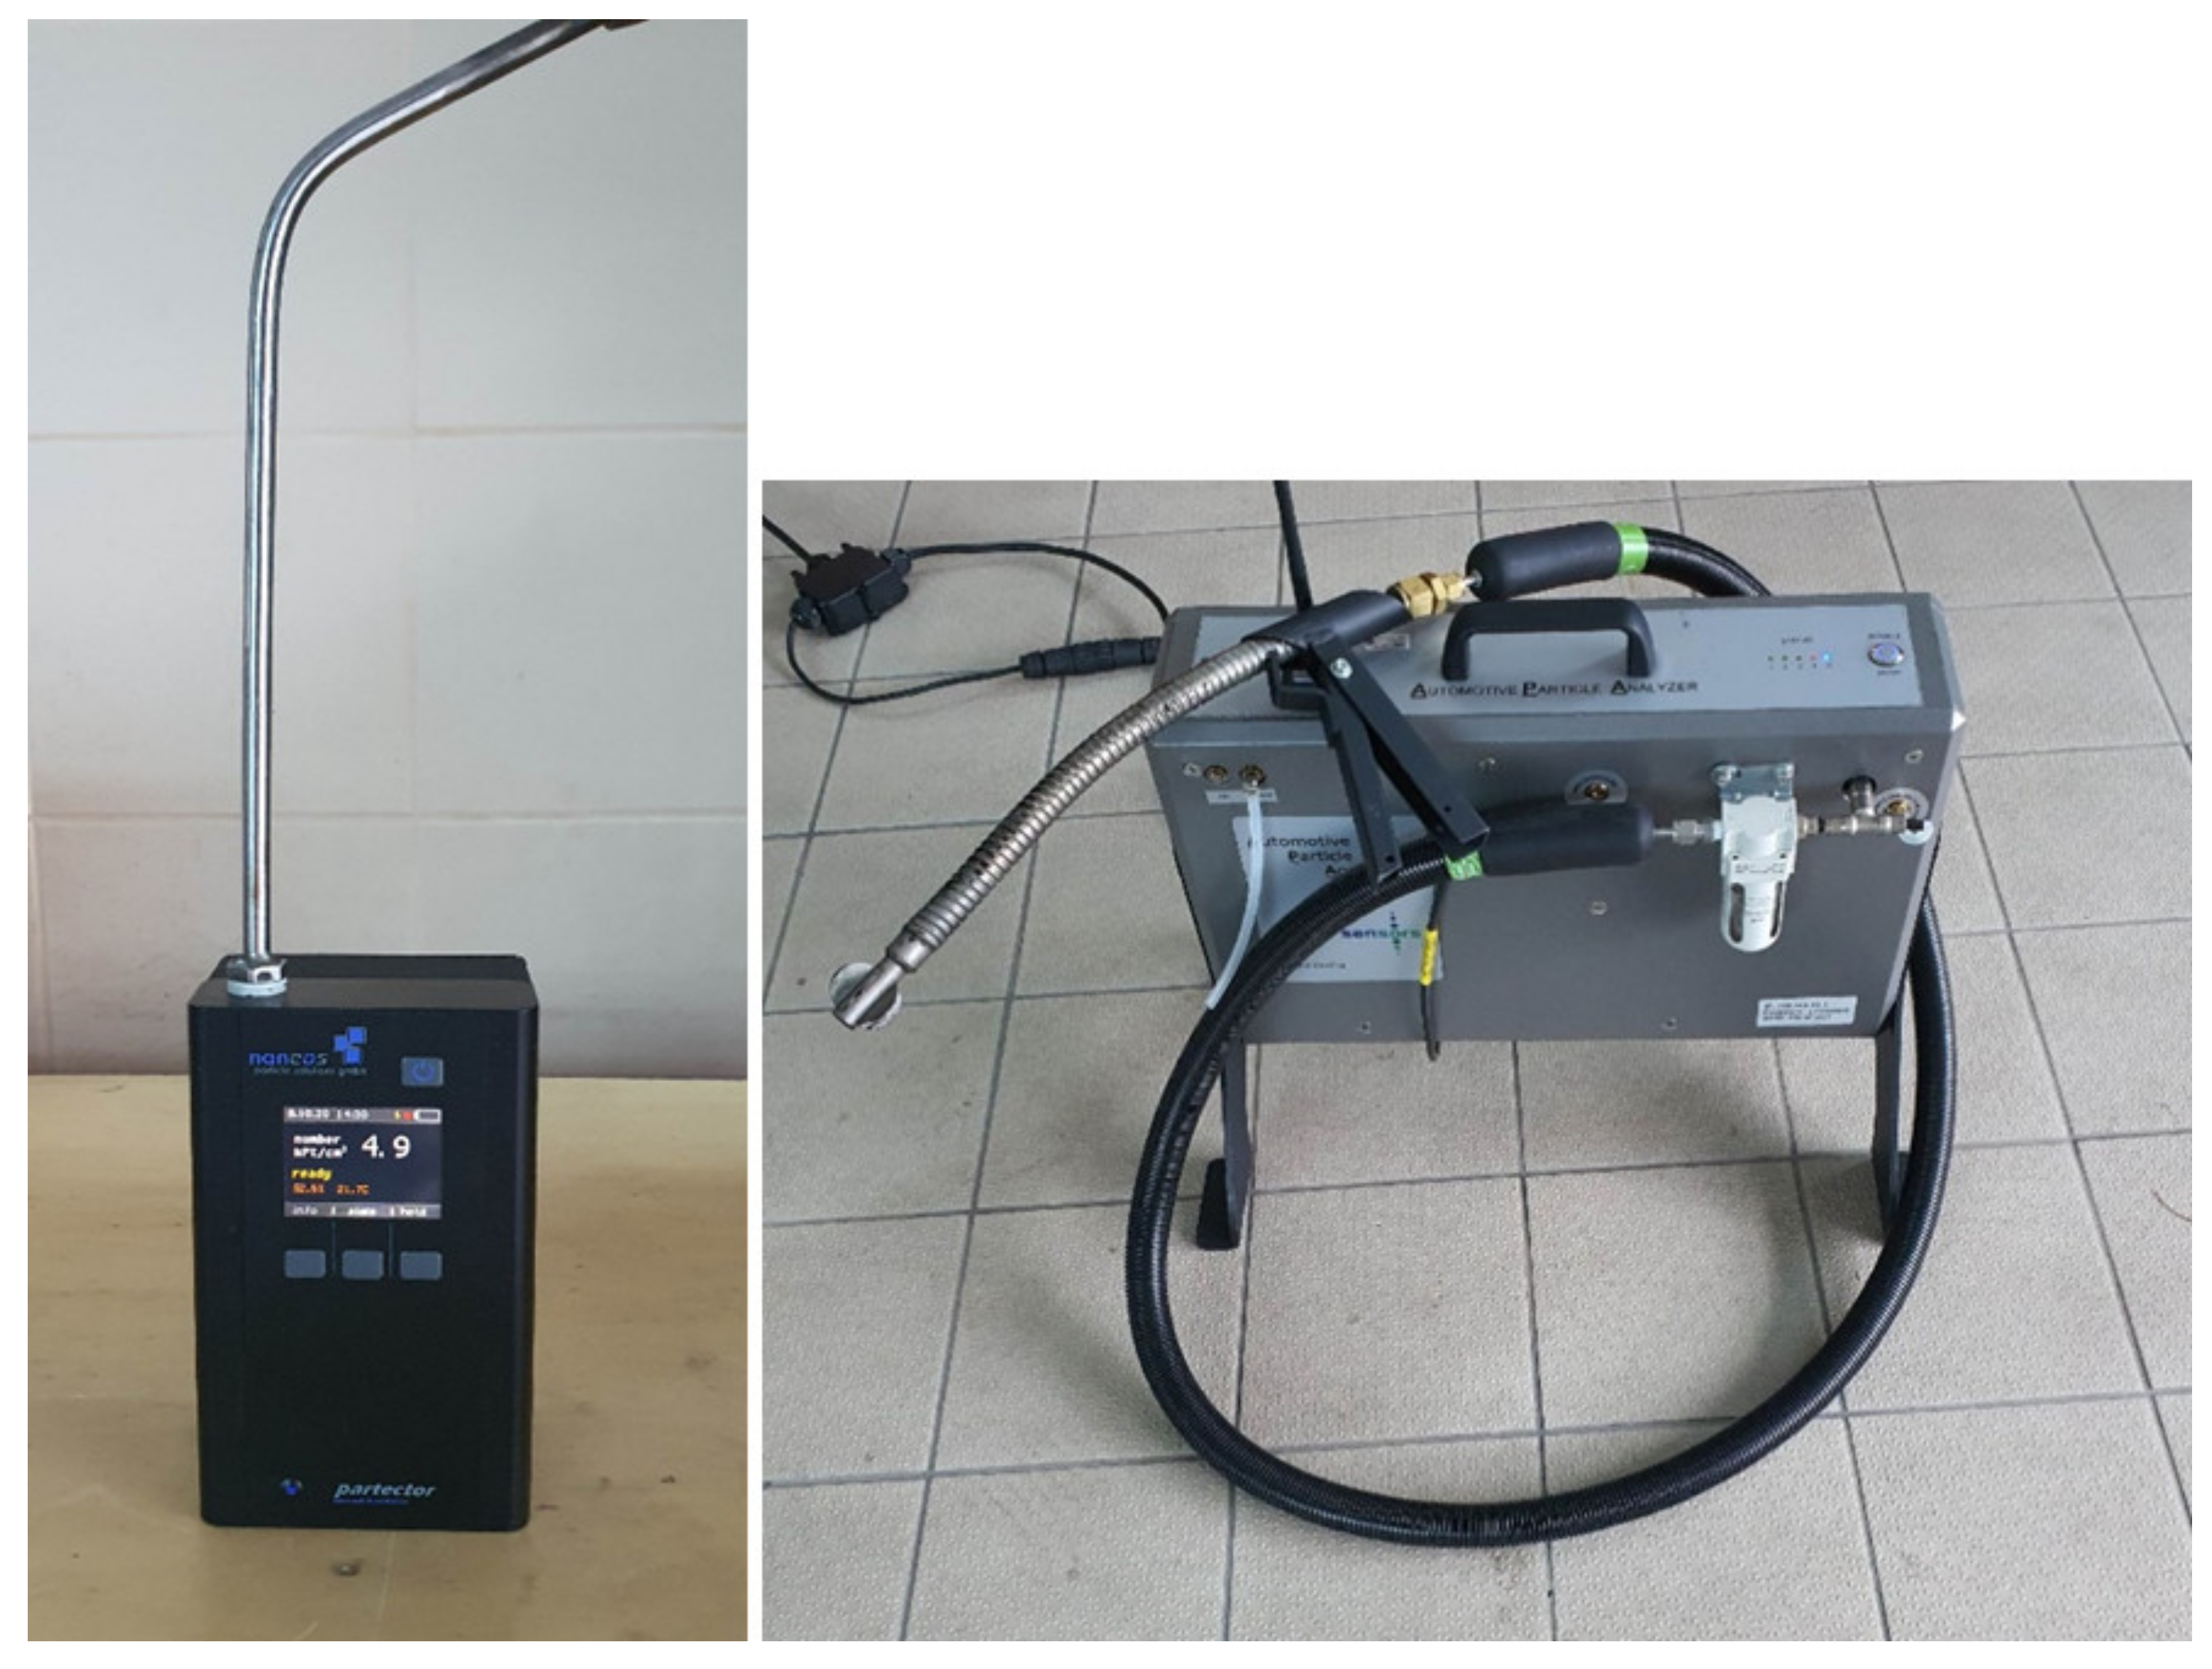
- Aerosol electrometer particle counter (AEPC)—the measurement is performed using an electrometer. The charged particles cause the electrode to generate a current proportional to their quantity.
- (2)
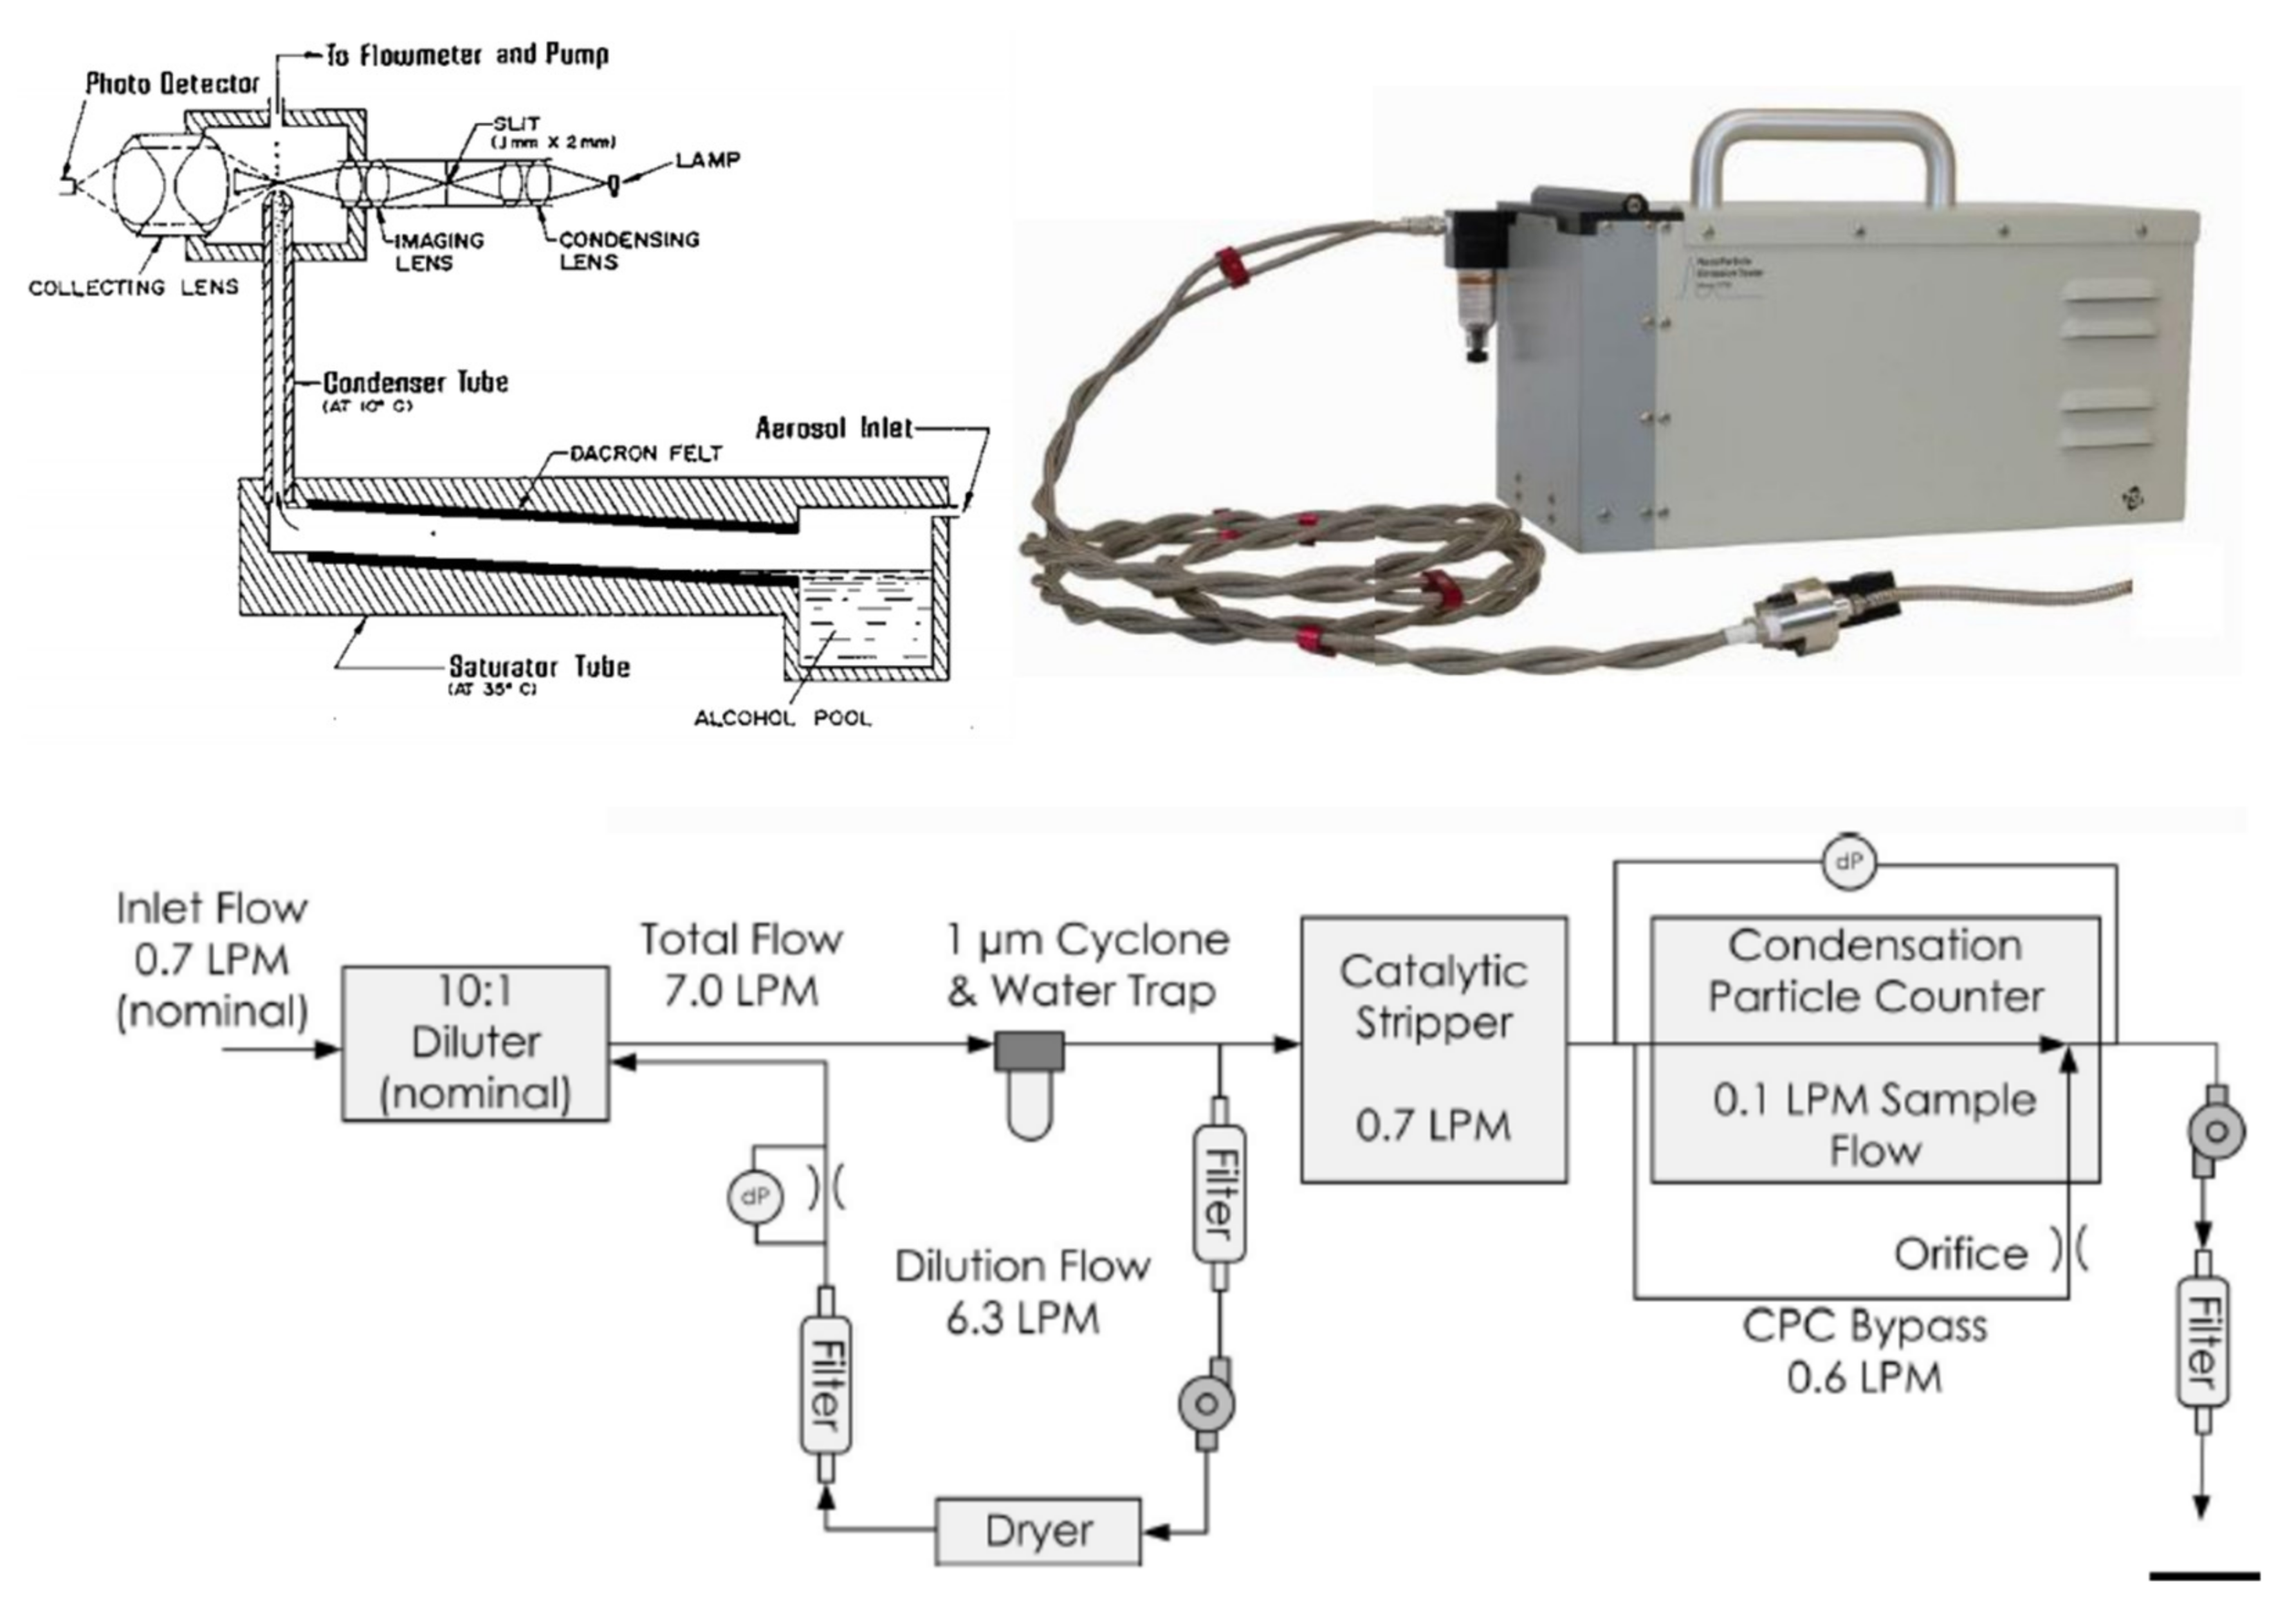
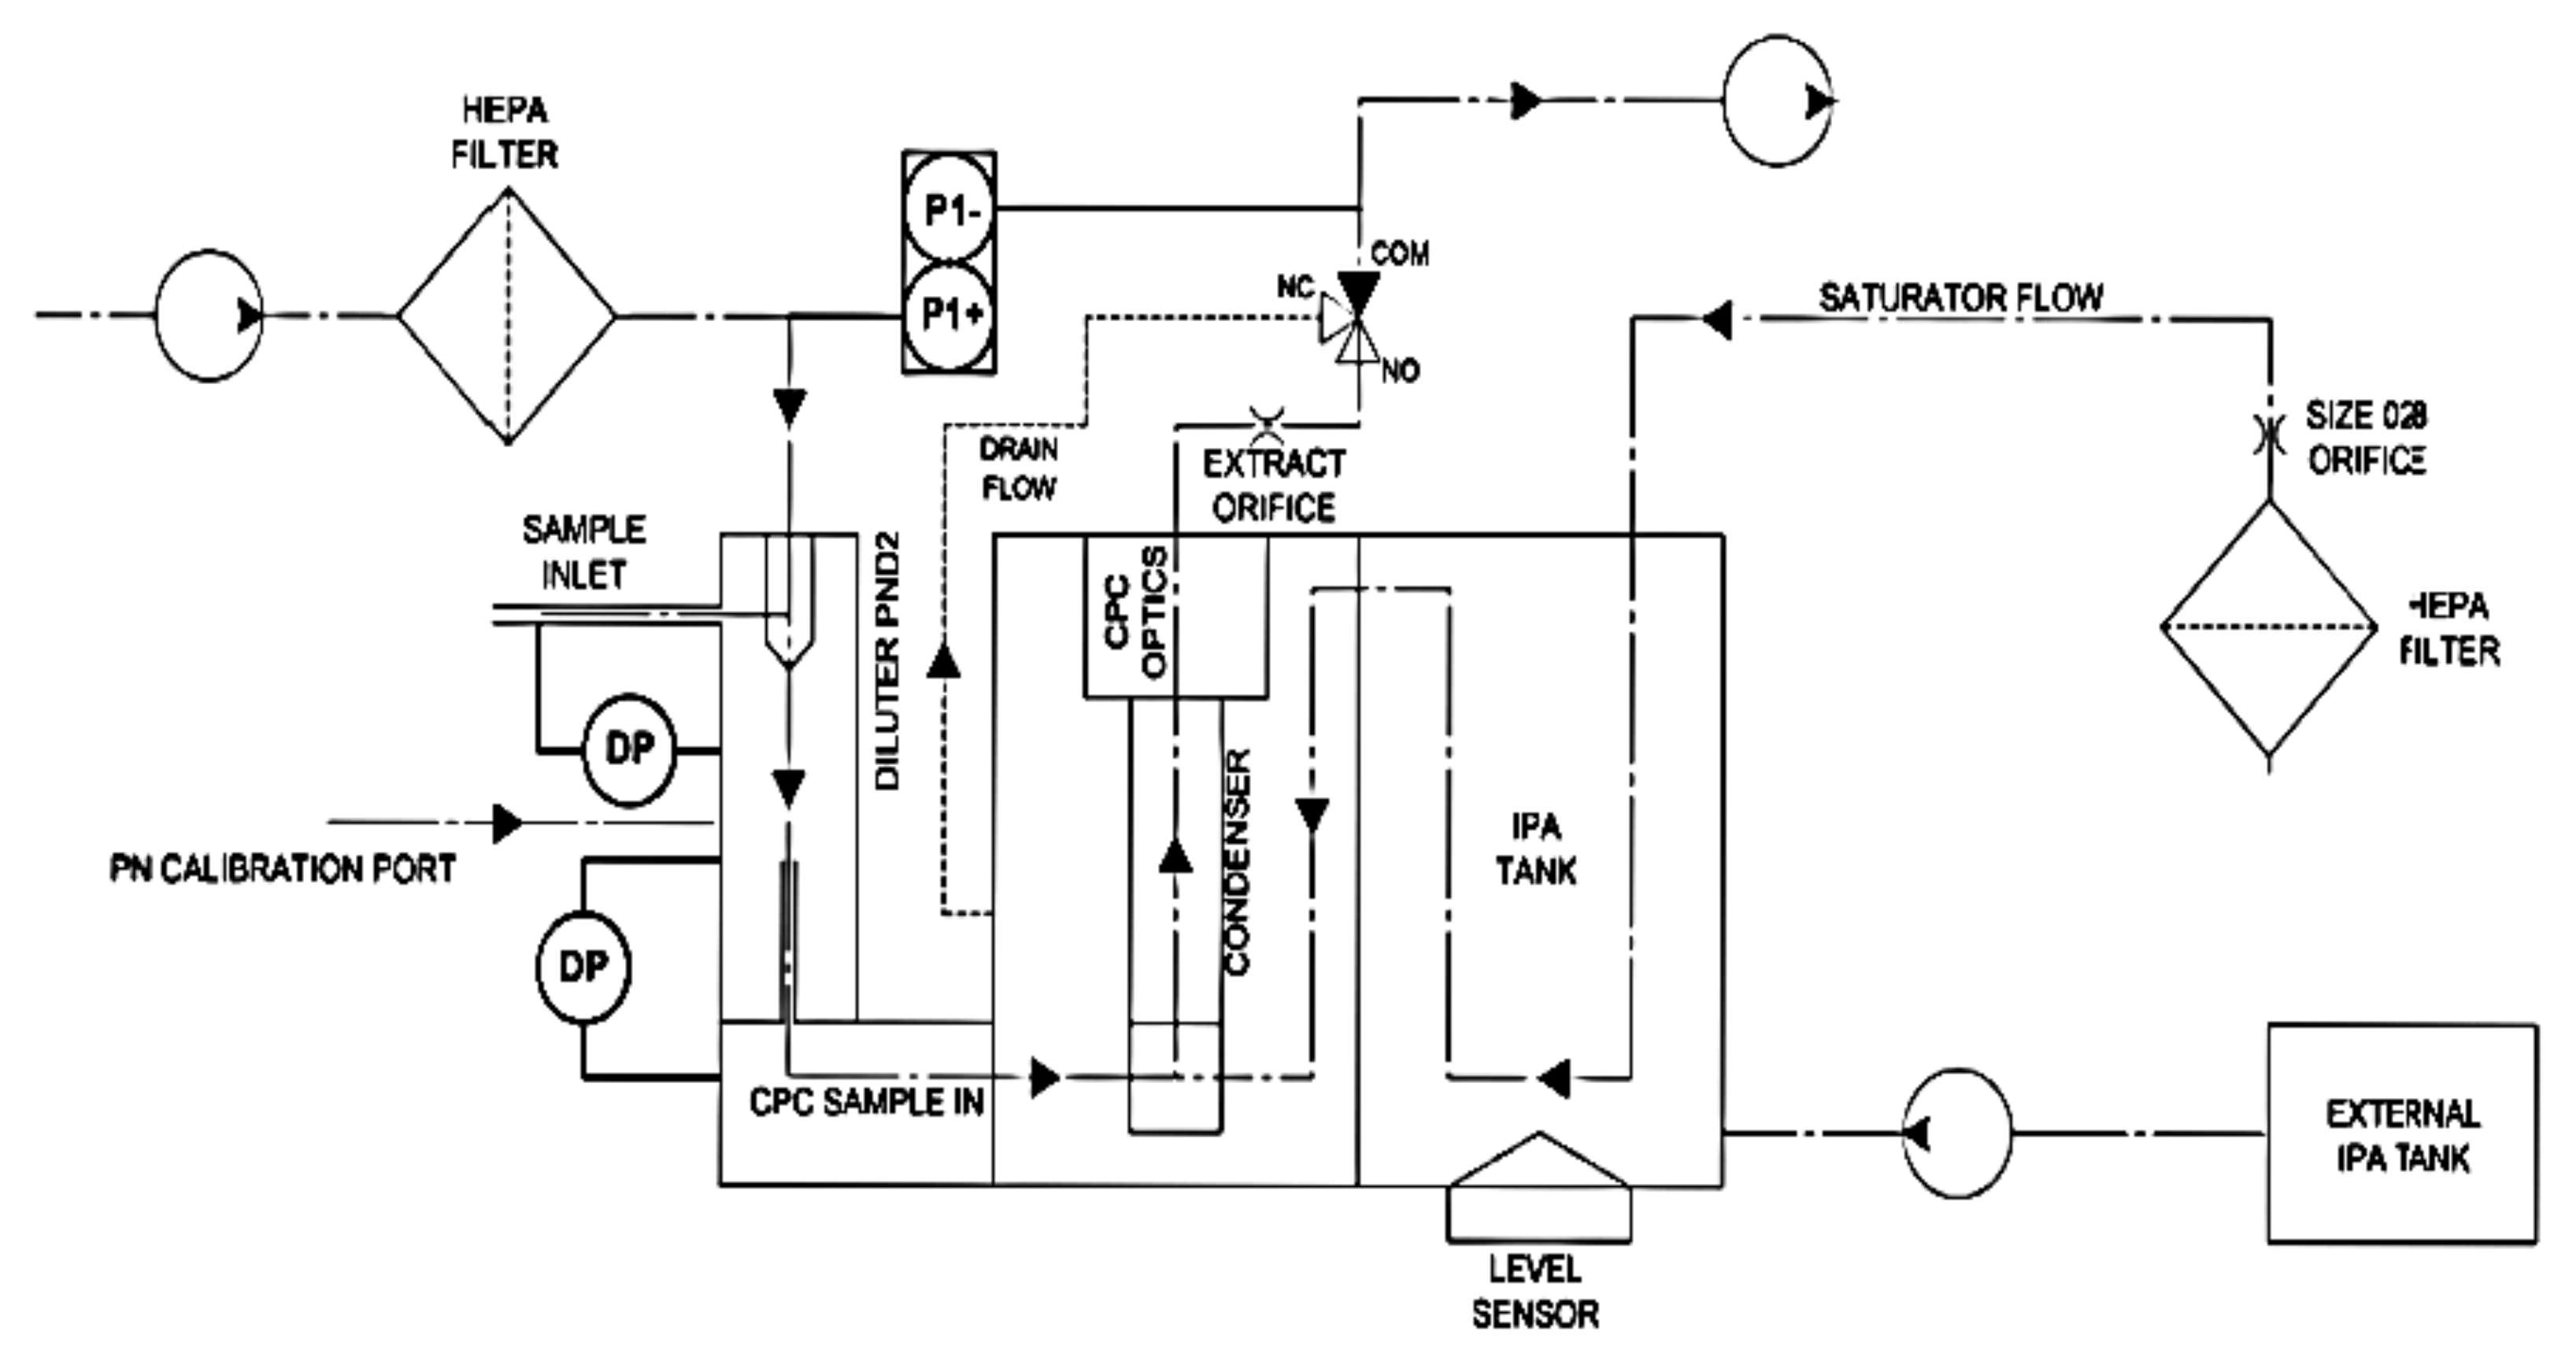
- Condensation particle counter (CPC)—optical measurement of particles enlarged by condensation in a saturated aerosol (e.g., isopropanol).
- (3)
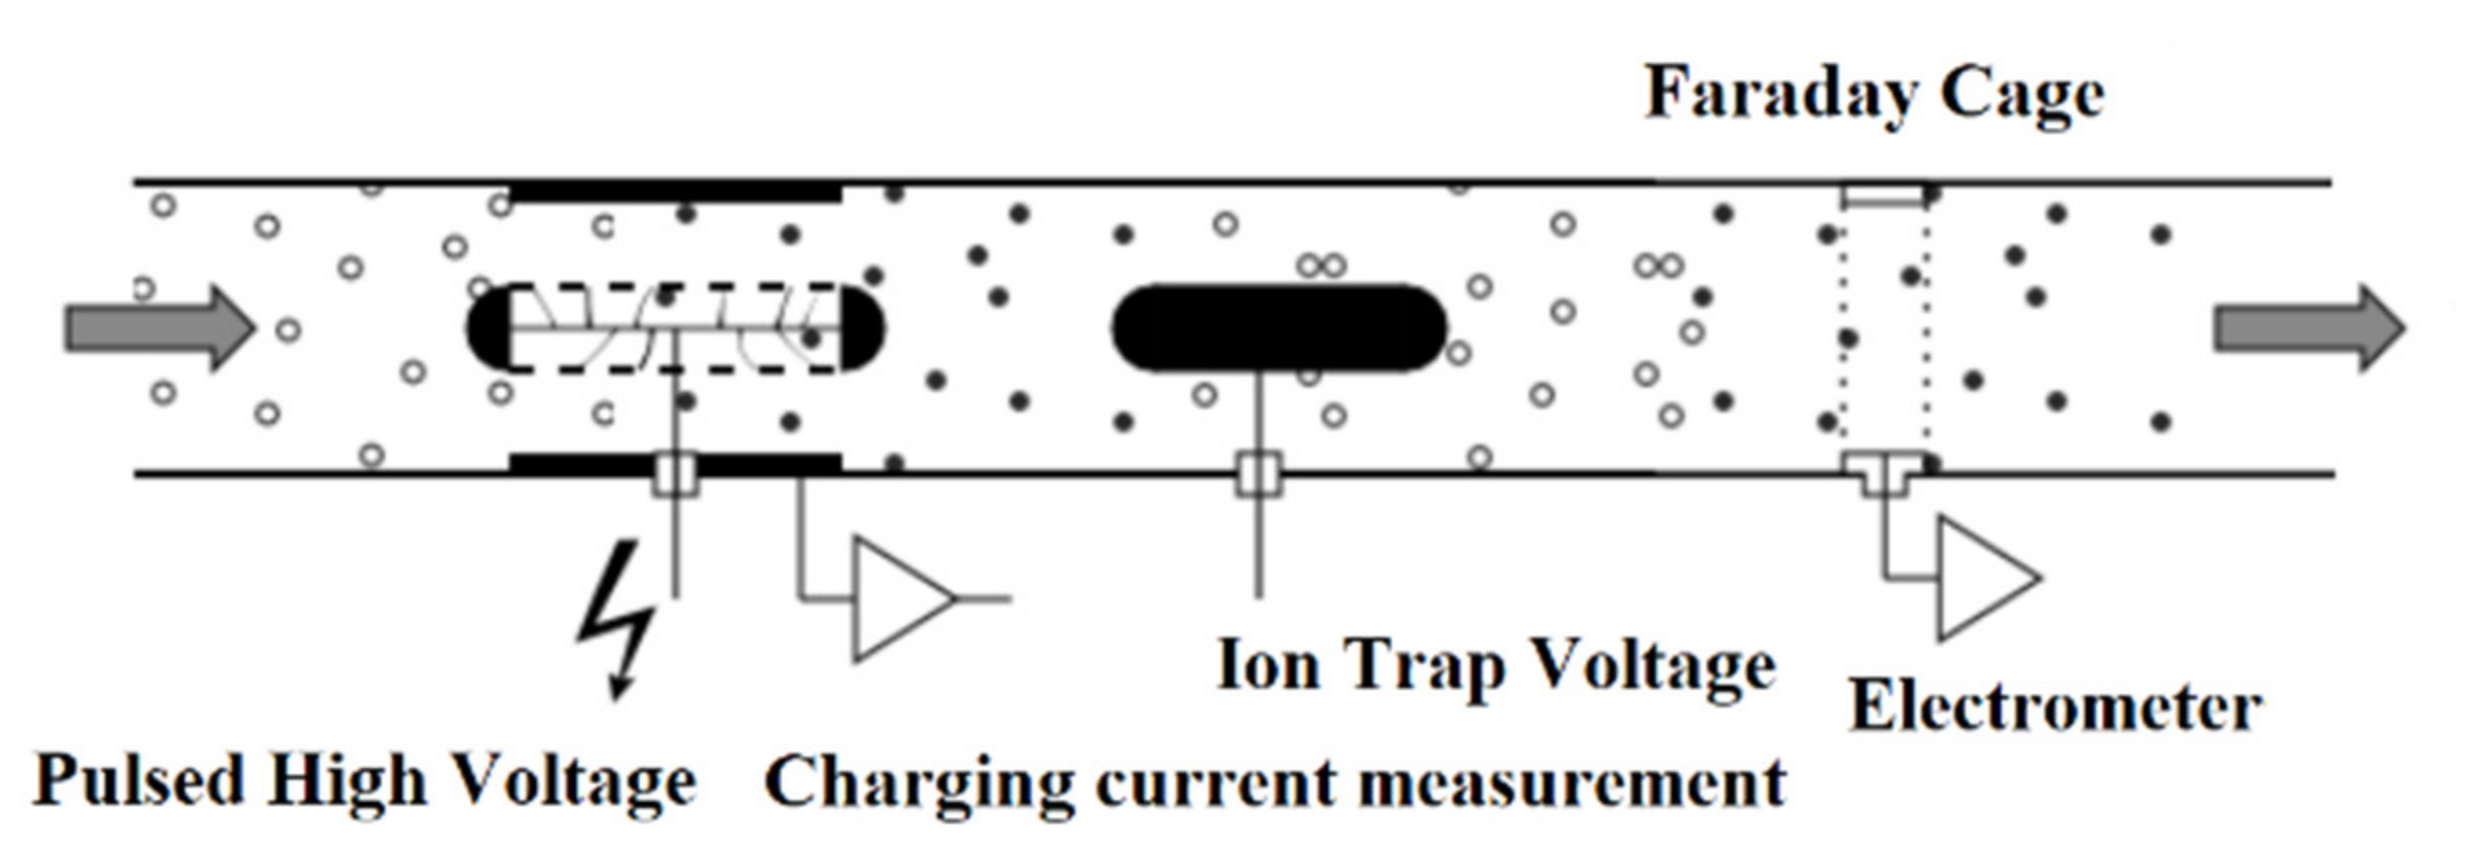
- Diffusion charger (DC)—electrically charged aerosol particles are analyzed, which flow into the condenser in a laminar form with air. There, the stream of charged particles is separated due to the electric voltage and fed to the electrode.
- provide the measurement result within the permissible limit errors or switch to the mode in which the measurement is impossible, which should be signaled by an appropriate message,
- work in the full measuring range in the set and the widest possible range of temperatures, atmospheric pressure and humidity,
- work and also show correct results in dynamic conditions (vibrations, shocks), as well as in the presence of an electromagnetic field,
- meet the maximum permissible errors in the measuring range of 5000–500,000 cm−3, and in the case of a variable, automatically switch over the measuring range and also meet the requirements when changing the range,
- have adequate effectiveness in detecting particles with different diameters,
- have a self-checking system for faults and errors,
- have the possibility of zero and calibration control, sample volume control, etc.,
- allow for a simple evaluation of the results,
- ensure a constant volume of the exhaust sample taken,
- be equipped with a system for emptying the exhaust gas collection system,
- be characterized by a short warm-up time and signal that the readiness time is reached, as well as an adequately fast response time.
2. Methodology
3. Results and Discussion
4. Conclusions
Author Contributions
Funding
Institutional Review Board Statement
Informed Consent Statement
Acknowledgments
Conflicts of Interest
References
- Chłopek, Z.; Bebkiewicz, K. Model of the structure of motor vehicles for the criterion of the technical level on account of pollutant emission. Eksploat. I Niezawodn. Maint. Reliab. 2017, 19, 501–507. [Google Scholar] [CrossRef]
- Silitonga, A.S.; Masjuki, H.H.; Ong, H.C.; Sebayang, A.H.; Dharma, S.; Kusumo, F.; Siswantoro, J.; Milano, J.; Daud, K.; Mahlia, T.M.I.; et al. Evaluation of the engine performance and exhaust emissions of biodiesel-bioethanol-diesel blends using kernel-based extreme learning machine. Energy 2018, 159, 1075–1087. [Google Scholar] [CrossRef]
- Merkisz, J.; Rymaniak, Ł. The assessment of vehicle exhaust emissions referred to CO2 based on the investigations of city buses under actual conditions of operation. Eksploat. Niezawodn. Maint. Reliab. 2017, 19, 522–529. [Google Scholar] [CrossRef]
- Giechaskiel, B.; Riccobono, F.; Bonnel, P. Feasibility Study on the Extension of the Real Driving Emission (RDE) Procedure to Particle Number (PN) JRC Science and Policy Reports; European Commission, Joint Research Centre: Brussels, Belgium, 2015; ISBN 978-92-79-51003-8. [Google Scholar]
- Borucka, A.; Wiśniowski, P.; Mazurkiewicz, D.; Świderski, A. Laboratory measurements of vehicle exhaust emissions in conditions reproducing real traffic. Measurement 2021, 174, 108998. [Google Scholar] [CrossRef]
- Hinds, W.C. Aerosol Technology Properties, Behavior, and Measurement of Airborne Particles, 2nd ed.; Willey & Sons: Los Angeles, CA, USA, 1999. [Google Scholar]
- PTI PN Test Procedure, Unece IWG PTI, 2020, Brussels, Belgium. Available online: https://wiki.unece.org/download/attachments/94047068/PTI-17-08%20TNO%20PTI%20PN%20test%20procedure%202020%20v1.1.pdf?api=v2 (accessed on 1 July 2021).
- NIK Report. Eliminowanie z ruchu drogowego pojazdów nadmiernie emitujących substancje szkodliwe, KIN.430.016.2019, Nr ewid. 11/2020/P/19/031/KIN. Available online: https://www.nik.gov.pl/kontrole/P/19/031/ (accessed on 1 July 2021).
- Goede, M.; Andriessen, L. Emission Measurements on Diesel Vehicles with Diesel Particulate Filters, Carried out with a Second Generation Smoke Meter; Report Test Equipment: Baambrugge, The Netherlands, 2015. [Google Scholar]
- Ong, H.C.; Masjuki, H.H.; Mahlia, T.M.I.; Silitonga, A.S.; Chong, W.T.; Leong, K.Y. Optimization of biodiesel production and engine performance from high free fatty acid Calophyllum inophyllum oil in CI diesel engine. Energy Convers. Manag. 2014, 81, 30–40. [Google Scholar] [CrossRef]
- Lay-Ekuakille, A.; Carlucci, A.; Ficarella, A.; Laforgia, D. Measurements of opacity at exhaust of diesel engine using extinction laser technique. Proc. SPIE Int. Soc. Opt. Eng. 2002, 4915. [Google Scholar] [CrossRef]
- Quan-shun, Y.; Jian-wei, T.; Yun-shan, G.; Li-jun, H. Application of Diesel Particulate Filter on in-use On-road Vehicles. Energy Procedia 2017, 105, 1730–1736. [Google Scholar] [CrossRef]
- Schriefl, A.; Longin, M.; Bergmann, A. Charging-Based PN Sensing of Automotive Exhaust Particles; Graz University of Technology: Graz, Austria, 2018. [Google Scholar]
- Giechaskiel, B.; Lahde, T.; Suarez-Bertoa, R.; Clairotte, M.; Grigoratos, T.; Zardini, A.; Perujo, A.; Martini, G. Particle number measurements in the European legislation and future JRC activities. Combust. Engines 2018, 174, 3–16. [Google Scholar] [CrossRef]
- Giechaskiel, B.; Ntziachristos, L.; Wang, X.; Bergmann, A. Review of motor vehicle particulate emissions sampling and measurement: From smoke and filter mass to particle number. J. Aerosol. Sci. 2014, 67, 48–86. [Google Scholar] [CrossRef]
- Schriefl, A.; Nishida, R.T.; Knoll, M.; Boies, A.M.; Bergmann, A. Characterization of particle number counters based on pulsed-mode diffusion charging. Aerosol Sci. Technol. 2020, 54, 772–789. [Google Scholar] [CrossRef]
- Golomb, P. Nowa metoda pomiaru emisji cząstek stałych w spalinach silnika z zapłonem samoczynnym za pomocą metody TEOM, PTNSS-2007-SS3-218 Silniki Spalinowe, nr 3/2007 (130). Available online: http://yadda.icm.edu.pl/baztech/element/bwmeta1.element.baztech-article-LOD5-0005-0009 (accessed on 1 July 2021).
- Puchalski, A.; Ślęzak, M.; Komorska, I.; Wiśniowski, P. Multifractal analysis vehicle’s in-use speed profile for application in driving cycles. Eksploat. Niezawodn. Maint. Reliab. 2018, 20, 177–181. [Google Scholar] [CrossRef]
- Kuula, J.; Kuuluvainen, H.; Rönkkö, T.; Niemi, J.V.; Saukko, E.; Portin, H.; Aurela, M.; Saarikoski, S.; Rostedt, A.; Hillamo, R.; et al. Applicability of Optical and Diffusion Charging-Based Particulate Matter Sensors to Urban Air Quality Measurements. Aerosol Air Qual. 2019, 19, 1024–1039. [Google Scholar] [CrossRef]
- Bucher, R.; Fierz, M. Simple Periodic DPF Testing with a Handheld Device. In Proceedings of the 21st ETH-Conference on Combustion Generated Nanoparticles, Zurich, Switzerland, 19–22 June 2017. [Google Scholar]
- NanoIndEx Assesment of Personal Exposure to Airborne Nanomaterials. Project Report. 2016. Available online: https://nanopartikel.info/wp-content/uploads/2020/10/NanoIndEx-GuidanceDocument-2016.pdf (accessed on 1 July 2021).
- Partector DPF Tester–Operation Manual, Naneos Particle Solutions gmbh, 2019. Available online: https://www.naneos.ch/pdf/naneos_partector_operation_manual.pdf (accessed on 1 July 2021).
- Meier, D.; Egli, D.; Steigmeier, P.; Burtscher, H.; Fierz, M. Miniature nanoparticle sensor for exposure measurement and TEM sampling. J. Phys. Conf. Ser. 2015, 617, 012034. [Google Scholar] [CrossRef]
- Kulkarni, P.; Baron, P.A.; Willeke, K. Aerosol Measurement: Principles, Techniques, and Applications; John Wiley & Sons: Hoboken, NJ, USA, 2011. [Google Scholar]
- Mayer, A. NPTI, New periodic emission inspection. In Proceedings of the 8 VERT Forum, Dubendorf, Switzerland, 17 March 2017. [Google Scholar]
- Automotive Particle Analyzer Quick Start Reference Manual 9510-206 Rev. 1.40 Sensors inc., Saline, MI, USA.


| Date | Mark | Model | Fuel/Year * | Odometer Reading [km] | Sensors APA [#/cm3] | Naneos Partector [#/cm3] |
|---|---|---|---|---|---|---|
| 25 August 2020 | Renault | Clio | D/2015 | 125,736 | 546 | 400 |
| 25 August 2020 | Citroen | C5 | D/2002 | 246,000 | 10,000,000 | 10,000,000 |
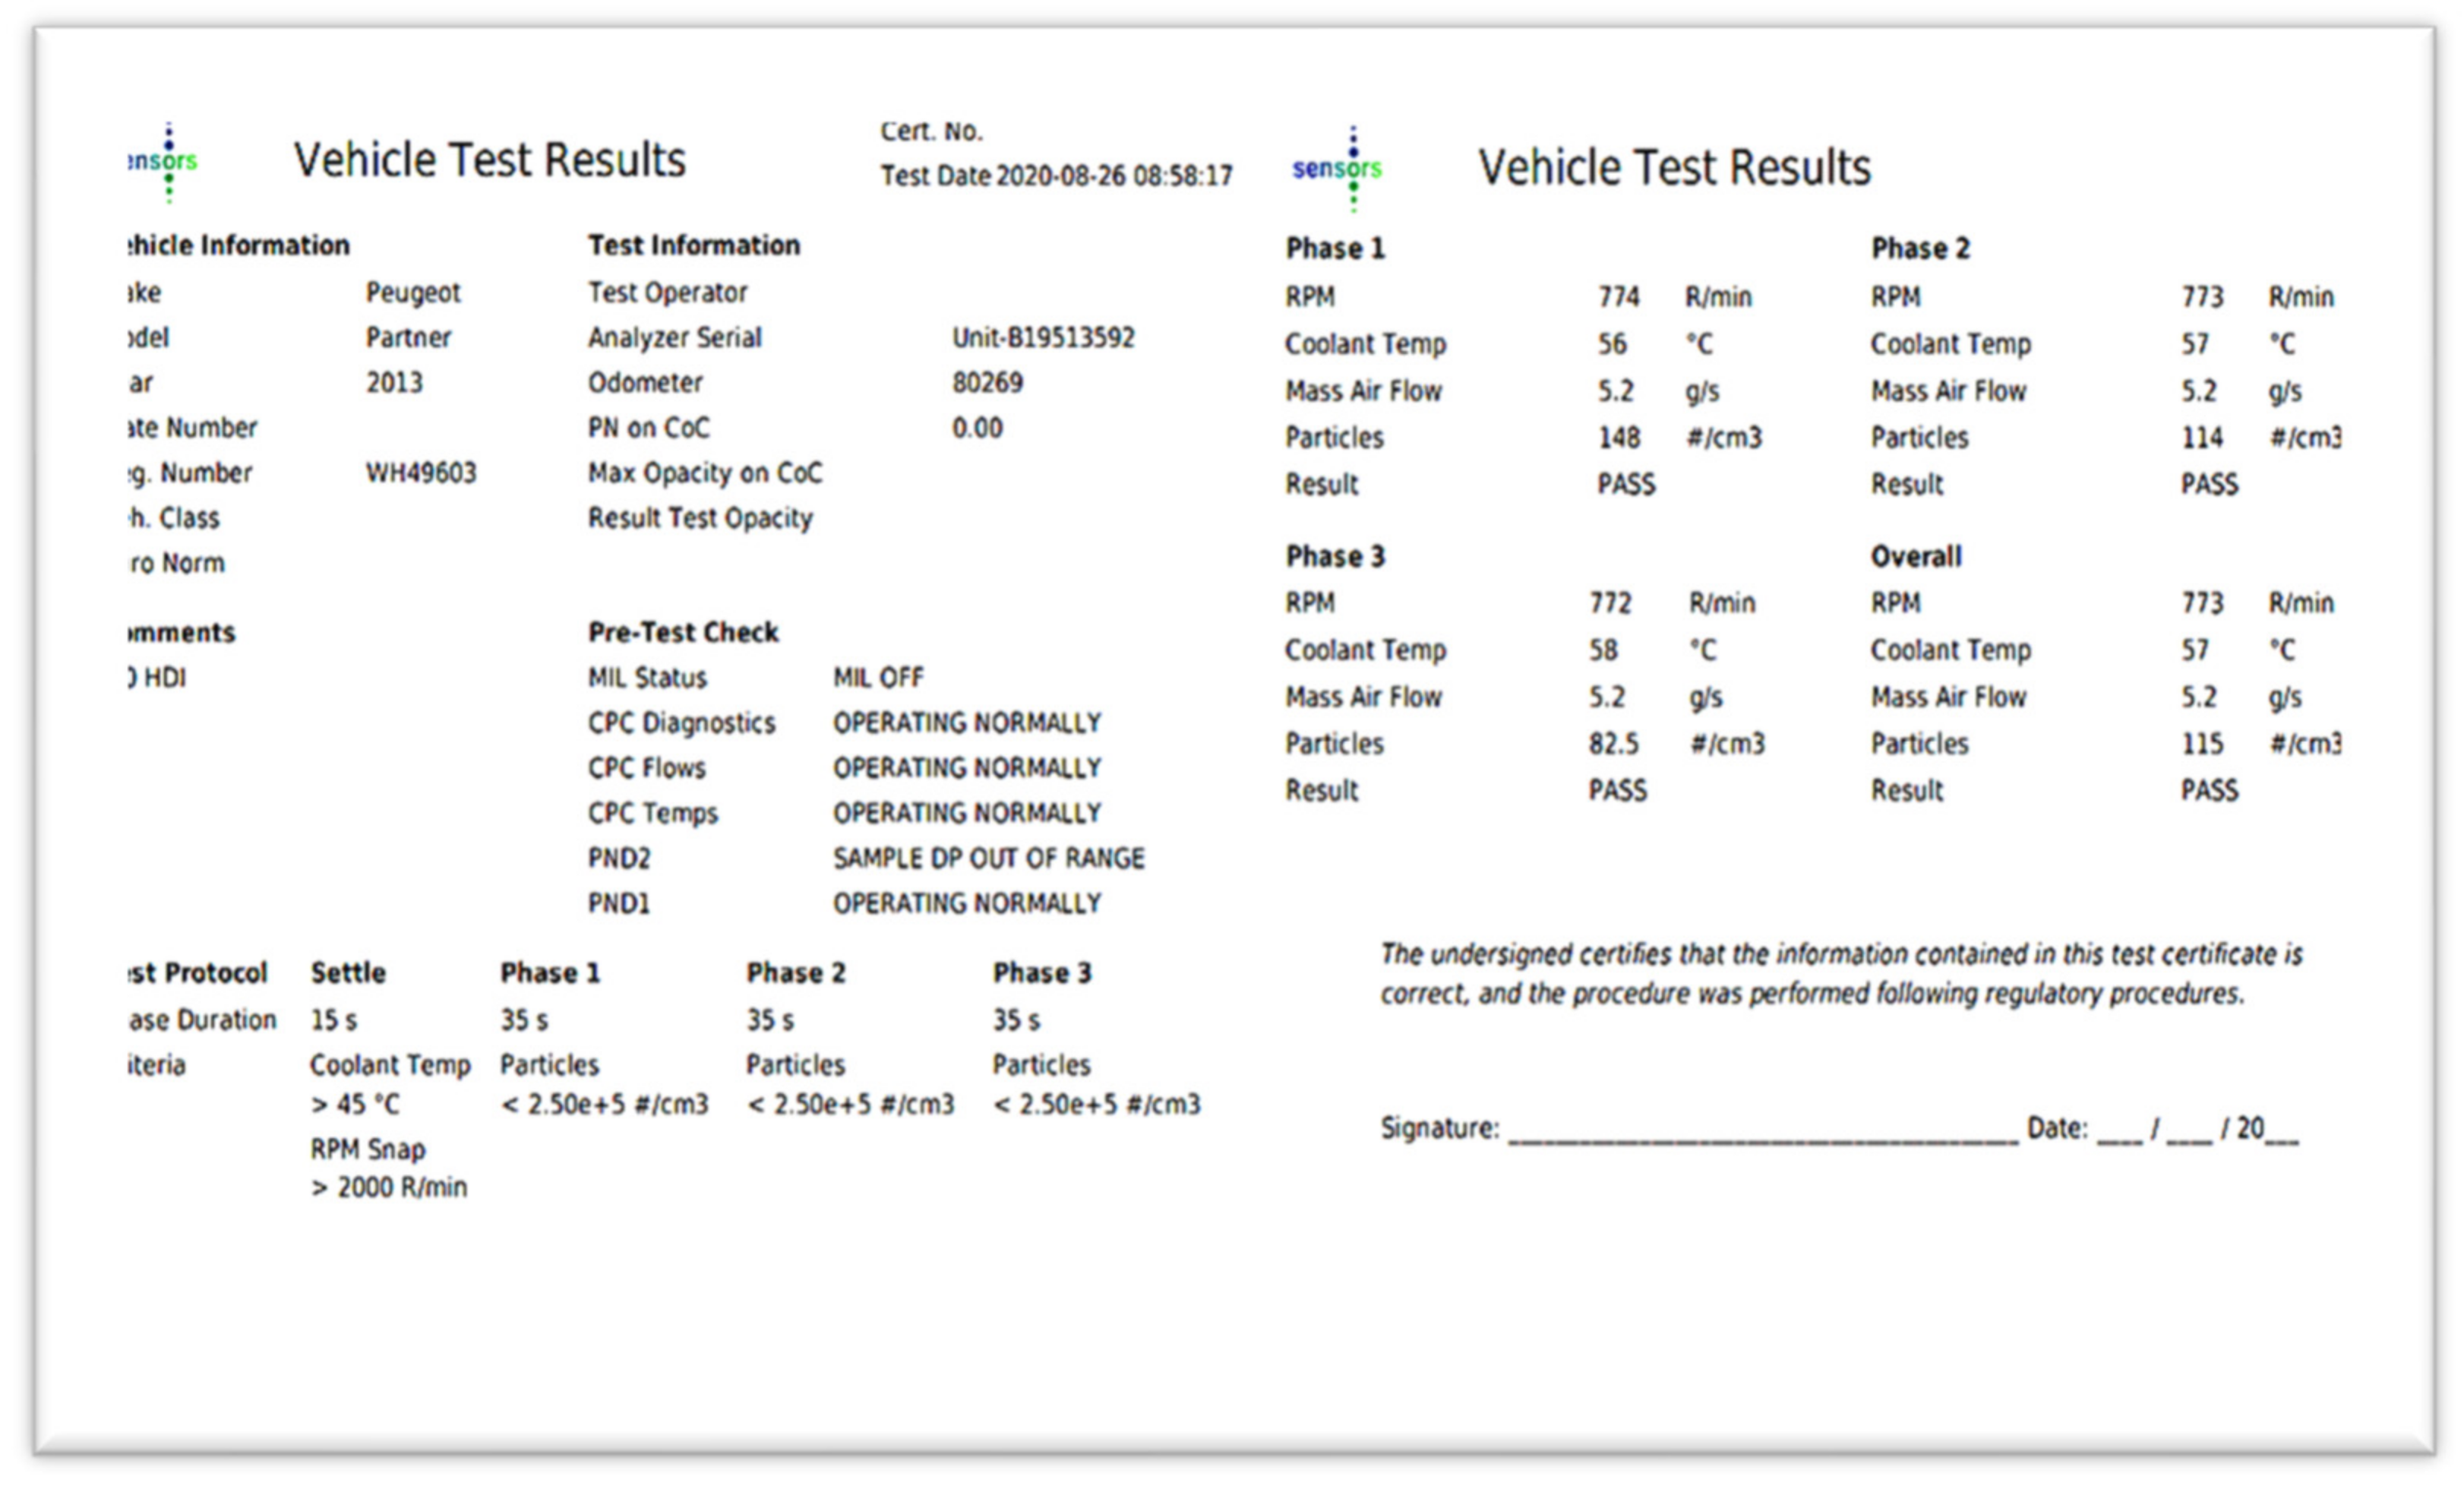
| 26 August 2020 | Peugeot | Partner | D/2013 | 80,269 | 115 | 200 |
| 26 August 2020 | Peugeot | Partner | D/2013 | 118,106 | 311 | 400 |
| 26 August 2020 | Peugeot | Boxer | D/2013 | 37,579 | 499 | 600 |
| 26 August 2020 | BMW | F10 | D/2017 | 79,524 | 20,500 | 16,000 |
| 27 August 2020 | Hyundai | Sonata | D/2008 | 124,071 | 4,030,000 | 1,190,000 |
| 28 August 2020 | Nissan | X-Trail | D/2018 | 25,000 | 127 | 200 |
| 2 September 2020 | Renault | Clio | D/2015 | 126,000 | 50.7 | 200 |
| 2 September 2020 | Mercedes | Moleń | D/2015 | 136,000 | 5890 | 4500 |
| 4 September 2020 | Peugeot | 508SW | D/2011 | 185,000 | 353,000 | 269,000 |
| 7 September 2020 | Audi | A4 | D/2004 | 234,000 | 12,900,000 | 10 × 106 |
| 7 September 2020 | Renault | Clio | D/2015 | 160,905 | 2730 | |
| 8 September 2020 | Renault | Koleos | D/2008 | 225,737 | 3960 | 3200 |
| 9 September 2020 | Skoda | Yeti | D/2013 | 76,716 | 1980 | 2100 |
| 9 September 2020 | Citroen | C5 | D/2014 | 767,716 | 593,000 | 530,000 |
| 9 September 2020 | Volkswagen | Golf 2.0TDI | D/2015 | 233,557 | 6040 | 6300 |
| 9 September 2020 | Mercedes | Sprinter | D/2011 | 128,406 | 342 | 200 |
| 11 September 2020 | BMW | 520D | D/2019 | 8300 | 689 | 300 |
| 11 September 2020 | Audi | A6 3.0TDI | D/2017 | 80,223 | 174 | 200 |
| 11 September 2020 | Peugeot | 3008 | D/2012 | 150,500 | 3410 | 2600 |
| 11 September 2020 | Volkswagen | Passat 2.0TDI | D/2013 | 209,900 | 1740 | 1000 |
| 17 September 2020 | BMW | 520D | D/2006 | 310,000 | 10,000,000 | |
| 17 September 2020 | Nissan | Qashqai | D/2008 | 10,000,000 | ||
| 17 September 2020 | Skoda | Octavia | D/2015 | 192,840 | 708 | 700 |
| 18 September 2020 | Skoda | Roomster | D/2012 | 133,389 | 54 | 200 |
| 23 September 2020 | Toyota | Avensis | D/2010 | 218,500 | 41,400 | 39,100 |
| 24 September 2020 | BMW | 520D | D/2015 | 112,634 | 235,000 | 138,000 |
| 24 September 2020 | Ford | Mondeo | D/2006 | 260,000 | 10,000,000 | |
| 29 September 2020 | Hyundai | Ix35 | D/2015 | 81,199 | 281 | 300 |
| 29 September 2020 | Hyundai | I30 | D/2013 | 107,675 | 192 | 300 |
| 29 September 2020 | Mercedes | Vito | D/2002 | 324,988 | 10,000,000 | |
| 29 September 2020 | Toyota | Auris | D/2009 | 260,304 | 10,000,00 | |
| 29 September 2020 | Fiat | Ducato | D/2005 | 151,870 | 7,500,000 | |
| 29 September 2020 | Renault | Kadjar | D/2015 | 96,110 | 137 | 100 |
| 29 September 2020 | Ford | Focus | D/2008 | 234,000 | 10,000,000 | |
| 30 September 2020 | Ford | Mondeo | D/2009 | 206,519 | 7,500,000 | |
| 30 September 2020 | Toyota | Verso | D/2005 | 417,399 | 10,000,000 | |
| 30 September 2020 | Opel | Combo | D/2007 | 206,700 | 2,170,000 | 1,900,000 |
| 30 September 2020 | Fiat | Panda | D/2011 | 115,219 | 5,500,000 | 7,630,000 |
| 30 September 2020 | Ford | Mondeo | D/2010 | 254,700 | 4,650,000 | 4,610,000 |
| 30 September 2020 | Toyota | Corolla | D/2017 | 101,328 | 777 | 200 |
| 1 October 2020 | Skoda | Fabia | D/2008 | 212,454 | 10,000,000 | |
| 1 October 2020 | Kia | CEED | D/2008 | 245,567 | 1,500,000 | 7,500,000 |
| 1 October 2020 | Jaguar | XF | D/2012 | 150,545 | 300 | 400 |
| 1 October 2020 | Audi | A6 | D/2013 | 180,490 | 100 | 300 |
| 1 October 2020 | Opel | Zafira | D/2008 | 222,905 | 2,300,000 | 4,300,000 |
| 1 October 2020 | Opel | Insignia | D/2015 | 123,008 | 215 | 300 |
| 1 October 2020 | Hyundai | I30 | D/2011 | 170,511 | 2,400,000 | 2,500,000 |
| 3 November 2020 | Audi | Q7 | D/2008 | 198,300 | 150 | 400 |
Publisher’s Note: MDPI stays neutral with regard to jurisdictional claims in published maps and institutional affiliations. |
© 2021 by the authors. Licensee MDPI, Basel, Switzerland. This article is an open access article distributed under the terms and conditions of the Creative Commons Attribution (CC BY) license (https://creativecommons.org/licenses/by/4.0/).
Share and Cite
Jarosiński, W.; Wiśniowski, P. Verifying the Efficiency of a Diesel Particulate Filter Using Particle Counters with Two Different Measurements in Periodic Technical Inspection of Vehicles. Energies 2021, 14, 5128. https://doi.org/10.3390/en14165128
Jarosiński W, Wiśniowski P. Verifying the Efficiency of a Diesel Particulate Filter Using Particle Counters with Two Different Measurements in Periodic Technical Inspection of Vehicles. Energies. 2021; 14(16):5128. https://doi.org/10.3390/en14165128
Chicago/Turabian StyleJarosiński, Wojciech, and Piotr Wiśniowski. 2021. "Verifying the Efficiency of a Diesel Particulate Filter Using Particle Counters with Two Different Measurements in Periodic Technical Inspection of Vehicles" Energies 14, no. 16: 5128. https://doi.org/10.3390/en14165128
APA StyleJarosiński, W., & Wiśniowski, P. (2021). Verifying the Efficiency of a Diesel Particulate Filter Using Particle Counters with Two Different Measurements in Periodic Technical Inspection of Vehicles. Energies, 14(16), 5128. https://doi.org/10.3390/en14165128