
Investigation of Energy Consumption and Associated CO2 Emissions for Wheat–Rice Crop Rotation Farming

 ,
, 
 ,
,  and
and 
Abstract
:1. Introduction
2. Research Methodology
3. Results and Discussion
4. Conclusions
Author Contributions
Funding
Institutional Review Board Statement
Informed Consent Statement
Data Availability Statement
Acknowledgments
Conflicts of Interest
References
- Cereals Production Quantity. Knoema n.d. Available online: https://knoema.com/atlas/topics/Agriculture/Crops-Production-Quantity-tonnes/Cereals-production (accessed on 24 May 2021).
- Crops Data. FAOSTAT n.d. Available online: http://www.fao.org/faostat/en/#data/QC/visualize (accessed on 24 May 2021).
- Giraldo, P.; Benavente, E.; Manzano-Agugliaro, F.; Gimenez, E. Worldwide research trends on wheat and barley: A bibliometric comparative analysis. Agronomy 2019, 9, 352. [Google Scholar] [CrossRef] [Green Version]
- Lizette, K. Food Security & Staple Crops Staple Food Around the World. IAEA Bull. 2012, 53, 11. [Google Scholar]
- Lucas, H. Breakout session P1.1 National Food Security-The Wheat Initiative-an International Research Initiative for Wheat Improvement context–the problems being addressed. In Proceedings of the GCARD-Second Global Conference on Agricultural Research for Development, Punta del Este, Uruguay, 29 October–1 November 2012; pp. 1–3. [Google Scholar]
- Mahmood, M.H.; Sultan, M.; Miyazaki, T. Significance of Temperature and Humidity Control for Agricultural Products Storage: Overview of Conventional and Advanced Options. Int. J. Food Eng. 2019, 15. [Google Scholar] [CrossRef]
- Muhammad, H. Mahmood, Muhammad Sultan, Takahiko Miyazaki SK. Study on desiccant air-conditioning system for agricultural product storage in Pakistan. Intellect. Exch. Innov. Conf. Eng. Sci. 2015, 1, 13–14. [Google Scholar] [CrossRef]
- Sultan, M.; El-sharkawy, I.I.; Miyazaki, T.; Baran, B.; Koyama, S. An overview of solid desiccant dehumidification and air conditioning systems. Renew. Sustain. Energy Rev. 2015, 46, 16–29. [Google Scholar] [CrossRef]
- Sultan, M.; El-Sharkawy, I.I.; Miyazaki, T.; Saha, B.B.; Koyama, S.; Maruyama, T.; Maeda, S.; Nakamura, T. Insights of water vapor sorption onto polymer based sorbents. Adsorption 2015, 21, 205–215. [Google Scholar] [CrossRef]
- Sultan, M.; Miyazaki, T.; Mahmood, M.H.; Khan, Z.M. Solar assisted evaporative cooling based passive air-conditioning system for agricultural and livestock applications. J. Eng. Sci. Technol. 2018, 13, 693–703. [Google Scholar]
- Ashraf, H.; Sultan, M.; Shamshiri, R.R.; Abbas, F.; Farooq, M.; Sajjad, U.; Md-Tahir, H.; Mahmood, M.H.; Ahmad, F.; Taseer, Y.R.; et al. Dynamic Evaluation of Desiccant Dehumidification Evaporative Cooling Options for Greenhouse Air-Conditioning Application in Multan (Pakistan). Energies 2021, 14, 1097. [Google Scholar] [CrossRef]
- Conway, R.K.; Stout, B.A. Handbook of Energy for World Agriculture. London and New York: Elsevier, Applied Science, 1990, 504 pp., \$@@-@@135.00. Am. J. Agric. Econ. 1991, 73, 1302. [Google Scholar] [CrossRef]
- Pishgar-Komleh, S.H.; Sefeedpari, P.; Rafiee, S. Energy and economic analysis of rice production under different farm levels in Guilan province of Iran. Energy 2011, 36, 5824–5831. [Google Scholar] [CrossRef]
- Kardoni, F.; Ahmadi, J.A.; Bakhshi, M.R. Energy Efficiency Analysis and Modeling the Relationship between Energy Inputs and Wheat Yield in Iran. Int. J. Agric. Manag. Dev. 2015, 5, 321–330. [Google Scholar]
- Ashraf, M.N.; Mahmood, M.H.; Sultan, M.; Banaeian, N.; Usman, M.; Ibrahim, S.M.; Butt, M.U.B.U.; Waseem, M.; Ali, I.; Shakoor, A.; et al. Investigation of Input and Output Energy for Wheat Production: A Comprehensive Study for Tehsil Mailsi (Pakistan). Sustainability 2020, 12, 6884. [Google Scholar] [CrossRef]
- Maraseni, T.; Chen, G.; Banhazi, T.; Bundschuh, J.; Yusaf, T. An Assessment of Direct on-Farm Energy Use for High Value Grain Crops Grown under Different Farming Practices in Australia. Energies 2015, 8, 13033–13046. [Google Scholar] [CrossRef] [Green Version]
- Ozkan, B.; Akcaoz, H.; Fert, C. Energy input-output analysis in Turkish agriculture. Renew. Energy 2004, 29, 39–51. [Google Scholar] [CrossRef]
- Safa, M.; Samarasinghe, S.; Mohssen, M. Determination of fuel consumption and indirect factors affecting it in wheat production in Canterbury, New Zealand. Energy 2010, 35, 5400–5405. [Google Scholar] [CrossRef]
- Fami, H.S.; Ghasemi, J.; Malekipoor, R.; Rashidi, P.; Nazari, S.; Mirzaee, A. Renewable energy use in smallholder farming systems: A case study in tafresh township of Iran. Sustainability 2010, 2, 702–716. [Google Scholar] [CrossRef] [Green Version]
- Esengun, K.; Gündüz, O.; Erdal, G. Input-output energy analysis in dry apricot production of Turkey. Energy Convers. Manag. 2007, 48, 592–598. [Google Scholar] [CrossRef]
- Singh, G.; Lee, J.; Karakoti, A.; Bahadur, R.; Yi, J.; Zhao, D.; AlBahilyc, K.; Vinu, A. Emerging trends in porous materials for CO2 capture and conversion. Chem. Soc. Rev. 2020, 49, 4360–4404. [Google Scholar] [CrossRef]
- US Department of Commerce, NOAA GML. Global Monitoring Laboratory—Carbon Cycle Greenhouse Gases n.d. Available online: https://gml.noaa.gov/ccgg/trends/mlo.html (accessed on 5 April 2021).
- Snoeckx, R.; Bogaerts, A. Plasma technology—A novel solution for CO2 conversion? Chem. Soc. Rev. 2017, 46, 5805–5863. [Google Scholar] [CrossRef] [Green Version]
- Grant, J.; Low, L.P.; Unsworth, S.; Hornwall, C.; Davies, M. The Low Carbon Economy Index 2018—Time to Get on with It. Available online: https://www.pwc.co.uk/lowcarboneconomy (accessed on 5 April 2021).
- Eckstein, D.; Künzel, V.; Schäfer, L.; Winges, M. Global Climate Rate Index 2020; Germanwatch e.V., Germany. 2020. Available online: www.germanwatch.org/en/cri (accessed on 5 April 2021).
- USAID. Greenhouse Gas Emissions Factsheet: Pakistan | Global Climate Change. 2018. Available online: https://www.climatelinks.org/resources/greenhouse-gas-emissions-factsheet-pakistan (accessed on 5 April 2021).
- Singh, H.; Singh, A.K.; Kushwaha, H.L.; Singh, A. Energy consumption pattern of wheat production in India. Energy 2007, 32, 1848–1854. [Google Scholar] [CrossRef]
- Saad, A.A.; Das, T.K.; Rana, D.S.; Sharma, A.R.; Bhattacharyya, R.; Lal, K. Energy auditing of a maize–wheat–greengram cropping system under conventional and conservation agriculture in irrigated north-western Indo-Gangetic Plains. Energy 2016, 116, 293–305. [Google Scholar] [CrossRef]
- Mani, I.; Kumar, P.; Panwar, J.S.; Kant, K. Variation in energy consumption in production of wheat-maize with varying altitudes in hilly regions of Himachal Pradesh, India. Energy 2007, 32, 2336–2339. [Google Scholar] [CrossRef]
- Chaudhary, V.P.; Gangwar, B.; Pandey, D.K.; Gangwar, K.S. Energy auditing of diversified rice-wheat cropping systems in Indo-gangetic plains. Energy 2009, 34, 1091–1096. [Google Scholar] [CrossRef]
- Singh, H.; Mishra, D.; Nahar, N.M.; Ranjan, M. Energy use pattern in production agriculture of a typical village in arid zone India: Part II. Energy Convers. Manag. 2003, 44, 1053–1067. [Google Scholar] [CrossRef]
- Singh, K.P.; Prakash, V.; Srinivas, K.; Srivastva, A.K. Effect of tillage management on energy-use efficiency and economics of soybean (Glycine max) based cropping systems under the rainfed conditions in North-West Himalayan Region. Soil Tillage Res. 2008, 100, 78–82. [Google Scholar] [CrossRef]
- Tabatabaeefar, A.; Emamzadeh, H.; Varnamkhasti, M.G.; Rahimizadeh, R.; Karimi, M. Comparison of energy of tillage systems in wheat production. Energy 2009, 34, 41–45. [Google Scholar] [CrossRef]
- Soltani, A.; Rajabi, M.H.; Zeinali, E.; Soltani, E. Energy inputs and greenhouse gases emissions in wheat production in Gorgan, Iran. Energy 2013, 50, 54–61. [Google Scholar] [CrossRef]
- Shahan, S.; Jafari, A.; Mobli, H.; Rafiee, S.; Karimi, M. Effect of Farm Size on Energy Ratio for Wheat Production: A Case Study from Ardabil Province of Iran. Energy 2008, 3, 604–608. [Google Scholar]
- Yousefi, M.; Khoramivafa, M.; Mondani, F. Integrated evaluation of energy use, greenhouse gas emissions and global warming potential for sugar beet (Beta vulgaris) agroecosystems in Iran. Atmos. Environ. 2014, 92, 501–505. [Google Scholar] [CrossRef]
- Ra, S.; Hashem, S.; Avval, M.; Mohammadi, A. Modeling and sensitivity analysis of energy inputs for apple production in Iran. Energy 2010, 35, 3301–3306. [Google Scholar] [CrossRef]
- Mousavi-Avval, S.H.; Ra, S.; Mohammadi, A. Optimization of energy consumption and input costs for apple production in Iran using data envelopment analysis. Energy 2011, 36, 909–916. [Google Scholar] [CrossRef]
- Khoshroo, A.; Mulwa, R.; Emrouznejad, A.; Arabi, B. A non-parametric Data Envelopment Analysis approach for improving energy ef fi ciency of grape production. Energy 2013, 63, 189–194. [Google Scholar] [CrossRef]
- Safa, M.; Samarasinghe, S. CO2 emissions from farm inputs “case study of wheat production in Canterbury, New Zealand”. Environ. Pollut. 2012, 171, 126–132. [Google Scholar] [CrossRef]
- Safa, M.; Samarasingh, S.; Mohssen, M. A field study of energy consumption in wheat production in Canterbury, New Zealand. Energy Convers. Manag. 2011, 52, 2526–2532. [Google Scholar] [CrossRef]
- Safa, M.; Samarasinghe, S. Determination and modelling of energy consumption in wheat production using neural networks: “A case study in Canterbury province, New Zealand”. Energy 2011, 36, 5140–5147. [Google Scholar] [CrossRef] [Green Version]
- Kuswardhani, N.; Soni, P.; Shivakoti, G.P. Comparative energy input-output and financial analyses of greenhouse and open field vegetables production in West Java, Indonesia. Energy 2013, 53, 83–92. [Google Scholar] [CrossRef]
- Soni, P.; Taewichit, C.; Salokhe, V.M. Energy consumption and CO2 emissions in rainfed agricultural production systems of Northeast Thailand. Agric. Syst. 2013, 116, 25–36. [Google Scholar] [CrossRef]
- Yilmaz, I.; Akcaoz, H.; Ozkan, B. An analysis of energy use and input costs for cotton production in Turkey. Renew. Energy 2005, 30, 145–155. [Google Scholar] [CrossRef]
- Erdal, G.; Esengün, K.; Erdal, H.; Gündüz, O. Energy use and economical analysis of sugar beet production in Tokat province of Turkey. Energy 2007, 32, 35–41. [Google Scholar] [CrossRef]
- Ozkan, B.; Fert, C.; Karadeniz, C.F. Energy and cost analysis for greenhouse and open-field grape production. Energy 2007, 32, 1500–1504. [Google Scholar] [CrossRef]
- Canakci, M.; Topakci, M.; Akinci, I.; Ozmerzi, A. Energy use pattern of some field crops and vegetable production: Case study for Antalya Region, Turkey. Energy Convers. Manag. 2005, 46, 655–666. [Google Scholar] [CrossRef]
- Snyder, C.S.; Bruulsema, T.W.; Jensen, T.L.; Fixen, P.E. Review of greenhouse gas emissions from crop production systems and fertilizer management effects. Agric. Ecosyst. Environ. 2009, 133, 247–266. [Google Scholar] [CrossRef]
- Khan, S.; Hanjra, M.A. Footprints of water and energy inputs in food production—Global perspectives. Food Policy 2009, 34, 130–140. [Google Scholar] [CrossRef]
- Yuan, S.; Peng, S.; Wang, D.; Man, J. Evaluation of the energy budget and energy use efficiency in wheat production under various crop management practices in China. Energy 2018, 160, 184–191. [Google Scholar] [CrossRef]
- Khan, M.A.; Awan, I.U.; Zafar, J. Energy requirement and economic analysis of rice production in western part of Pakistan. Soil Environ. 2009, 28, 60–67. [Google Scholar]
- Khan, S.B.; Khan, F.; Sadaf, S.; Kashif, R.H. Crops Area and Production (By Districts) (1981–82 To 2008–09); Pakistan Bureau of Statistics: Islamabad, Pakistan, 2009; p. 214. [Google Scholar]
- Banaeian, N.; Omid, M.; Ahmadi, H. Energy and economic analysis of greenhouse strawberry production in Tehran province of Iran. Energy Convers. Manag. 2011, 52, 1020–1025. [Google Scholar] [CrossRef]
- Kitani, O.; Jungbluth, T.; Peart, R.M.; Ramdani, A. CIGR Handbook of Agricultural Engineering (Energy and Biomass Engineering); ASAE Publication: St. Joseph, MI, USA, 1999; Volume 5. [Google Scholar]
- ASAE. Agricultural Machinery Management Data; American Society of Agricultural and Biological Engineers: St. Joseph, MI, USA, 2011. [Google Scholar]
- Wells, D. Total Energy Indicators of Agricultural Sustainability: Dairy Farming Case Study; Technical Paper; Ministry of Agriculture and Forestry: Wellington, New Zealand, 2001; ISBN 0-478-07968-0. [Google Scholar]
- Singh, P.; Singh, G.; Sodhi, G.P.S. Applying DEA optimization approach for energy auditing in wheat cultivation under rice-wheat and cotton-wheat cropping systems in north-western India. Energy 2019, 181, 18–28. [Google Scholar] [CrossRef]
- Charnes, A.; Cooper, W.W.; Rhodes, E. Measuring the efficiency of decision making units. Eur. J. Oper. Res. 1978, 2, 429–444. [Google Scholar] [CrossRef]
- Cooper, W.W.; Seiford, L.M.; Tone, K. Data Envelopment Analysis: A Comprehensive Text with Models, Applications, References and DEA-Solver Software, 2nd ed.; Springer: New York, NY, USA, 2007. [Google Scholar] [CrossRef] [Green Version]
- Saunders, C.; Barber, A.; Taylor, G. Food Miles - Comparative Energy/emissions Performance of New Zealand’s Agriculture Industry; Agribusiness & Economics Research Unit, Lincoln University: Lincoln, New Zealand, 2006. [Google Scholar]
- Gündogmus, E.; Bayramoglu, Z. Energy input use on organic farming: A comparative analysis on organic versus conventional farms in Turkey. J. Agron. 2006, 5, 16–22. [Google Scholar] [CrossRef]


| Property | Min | Max | Mean |
|---|---|---|---|
| Farmer’s education (yrs.) | 2 | 14 | 8.00 |
| Farmer’s experience (yrs.) | 6 | 30 | 18.35 |
| Farm size (ha) | 2.07 | 31.03 | 8.78 |
| Farm labor (No.) | 1 | 7 | 2.30 |
| No. of tractors | 0 | 2 | 0.87 |
| Source of irrigation | C + T | ||
| Canal to tube-well ratio | 31:61 | ||
| Inputs/Outputs | Equivalent (MJ/Unit) | Reference |
|---|---|---|
| Inputs | ||
| wheat seed (kg) | 20.1 | [51] |
| rice seed (kg) | 14.7 | [13] |
| diesel (l) | 56.31 | [28] |
| labor (h) | 1.96 | [28] |
| nitrogen (kg) | 60.6 | [28] |
| phosphorous (kg) | 11.1 | [28] |
| potassium (kg) | 6.7 | [28] |
| water (m3) | 1.02 | [28] |
| tractor operation (h) | 138 | [55] |
| disc harrow operation (h) | 149 | [55] |
| plough operation (h) | 180 | [55] |
| combine harvester operation (h) | 116 | [55] |
| rotavator operation (h) | 148 | [55] |
| chemicals (ml) | 0.102 | [28] |
| fungicides (kg) | 216 | [20] |
| herbicides (kg) | 238 | [20] |
| insecticides (kg) | 101.2 | [20] |
| electricity (kWh) | 11.93 | [51] |
| Outputs | ||
| wheat grains (kg) | 15.7 | [28] |
| wheat straw (kg) | 12.5 | [28] |
| rice grains (kg) | 17 | [55] |
| Input Energy | Equivalent (kg CO2/MJ) |
|---|---|
| nitrogen | 0.05 |
| phosphorous | 0.06 |
| potassium | 0.06 |
| biocides | 0.06 |
| diesel | 0.0687 |
| electricity | 0.0192 |
| machinery | 0.10 |
| Production Factors | Units/ha | Wheat | Rice |
|---|---|---|---|
| inputs | |||
| seed | kg | 125.053 | 23.0824 |
| diesel | L | 85.5408 | 252.154 |
| labor | h | 59.4992 | 242.698 |
| fertilizer | kg | ||
| N | - | 126.525 | 127.134 |
| P2O5 | - | 59.7945 | 62.2378 |
| K2O | - | 3.67804 | 9.06375 |
| water | m3 | 3197.99 | 13137.7 |
| machinery | h | ||
| tractor | - | 19.1878 | 72.1281 |
| plough | - | 3.58482 | 4.37146 |
| rotary hoe | - | 2.50457 | 1.89331 |
| combine harvester | - | 0.97132 | 1.66165 |
| chemicals | mL | 867.493 | 375.844 |
| chemicals | kg | 0 | 4.87158 |
| electricity | kWh | 100.568 | 354.091 |
| outputs | |||
| grain | kg | 4325.38 | 4441.24 |
| straw | kg | 4287.55 |
| Parameter | Unit | Crop | |
|---|---|---|---|
| Wheat | Rice | ||
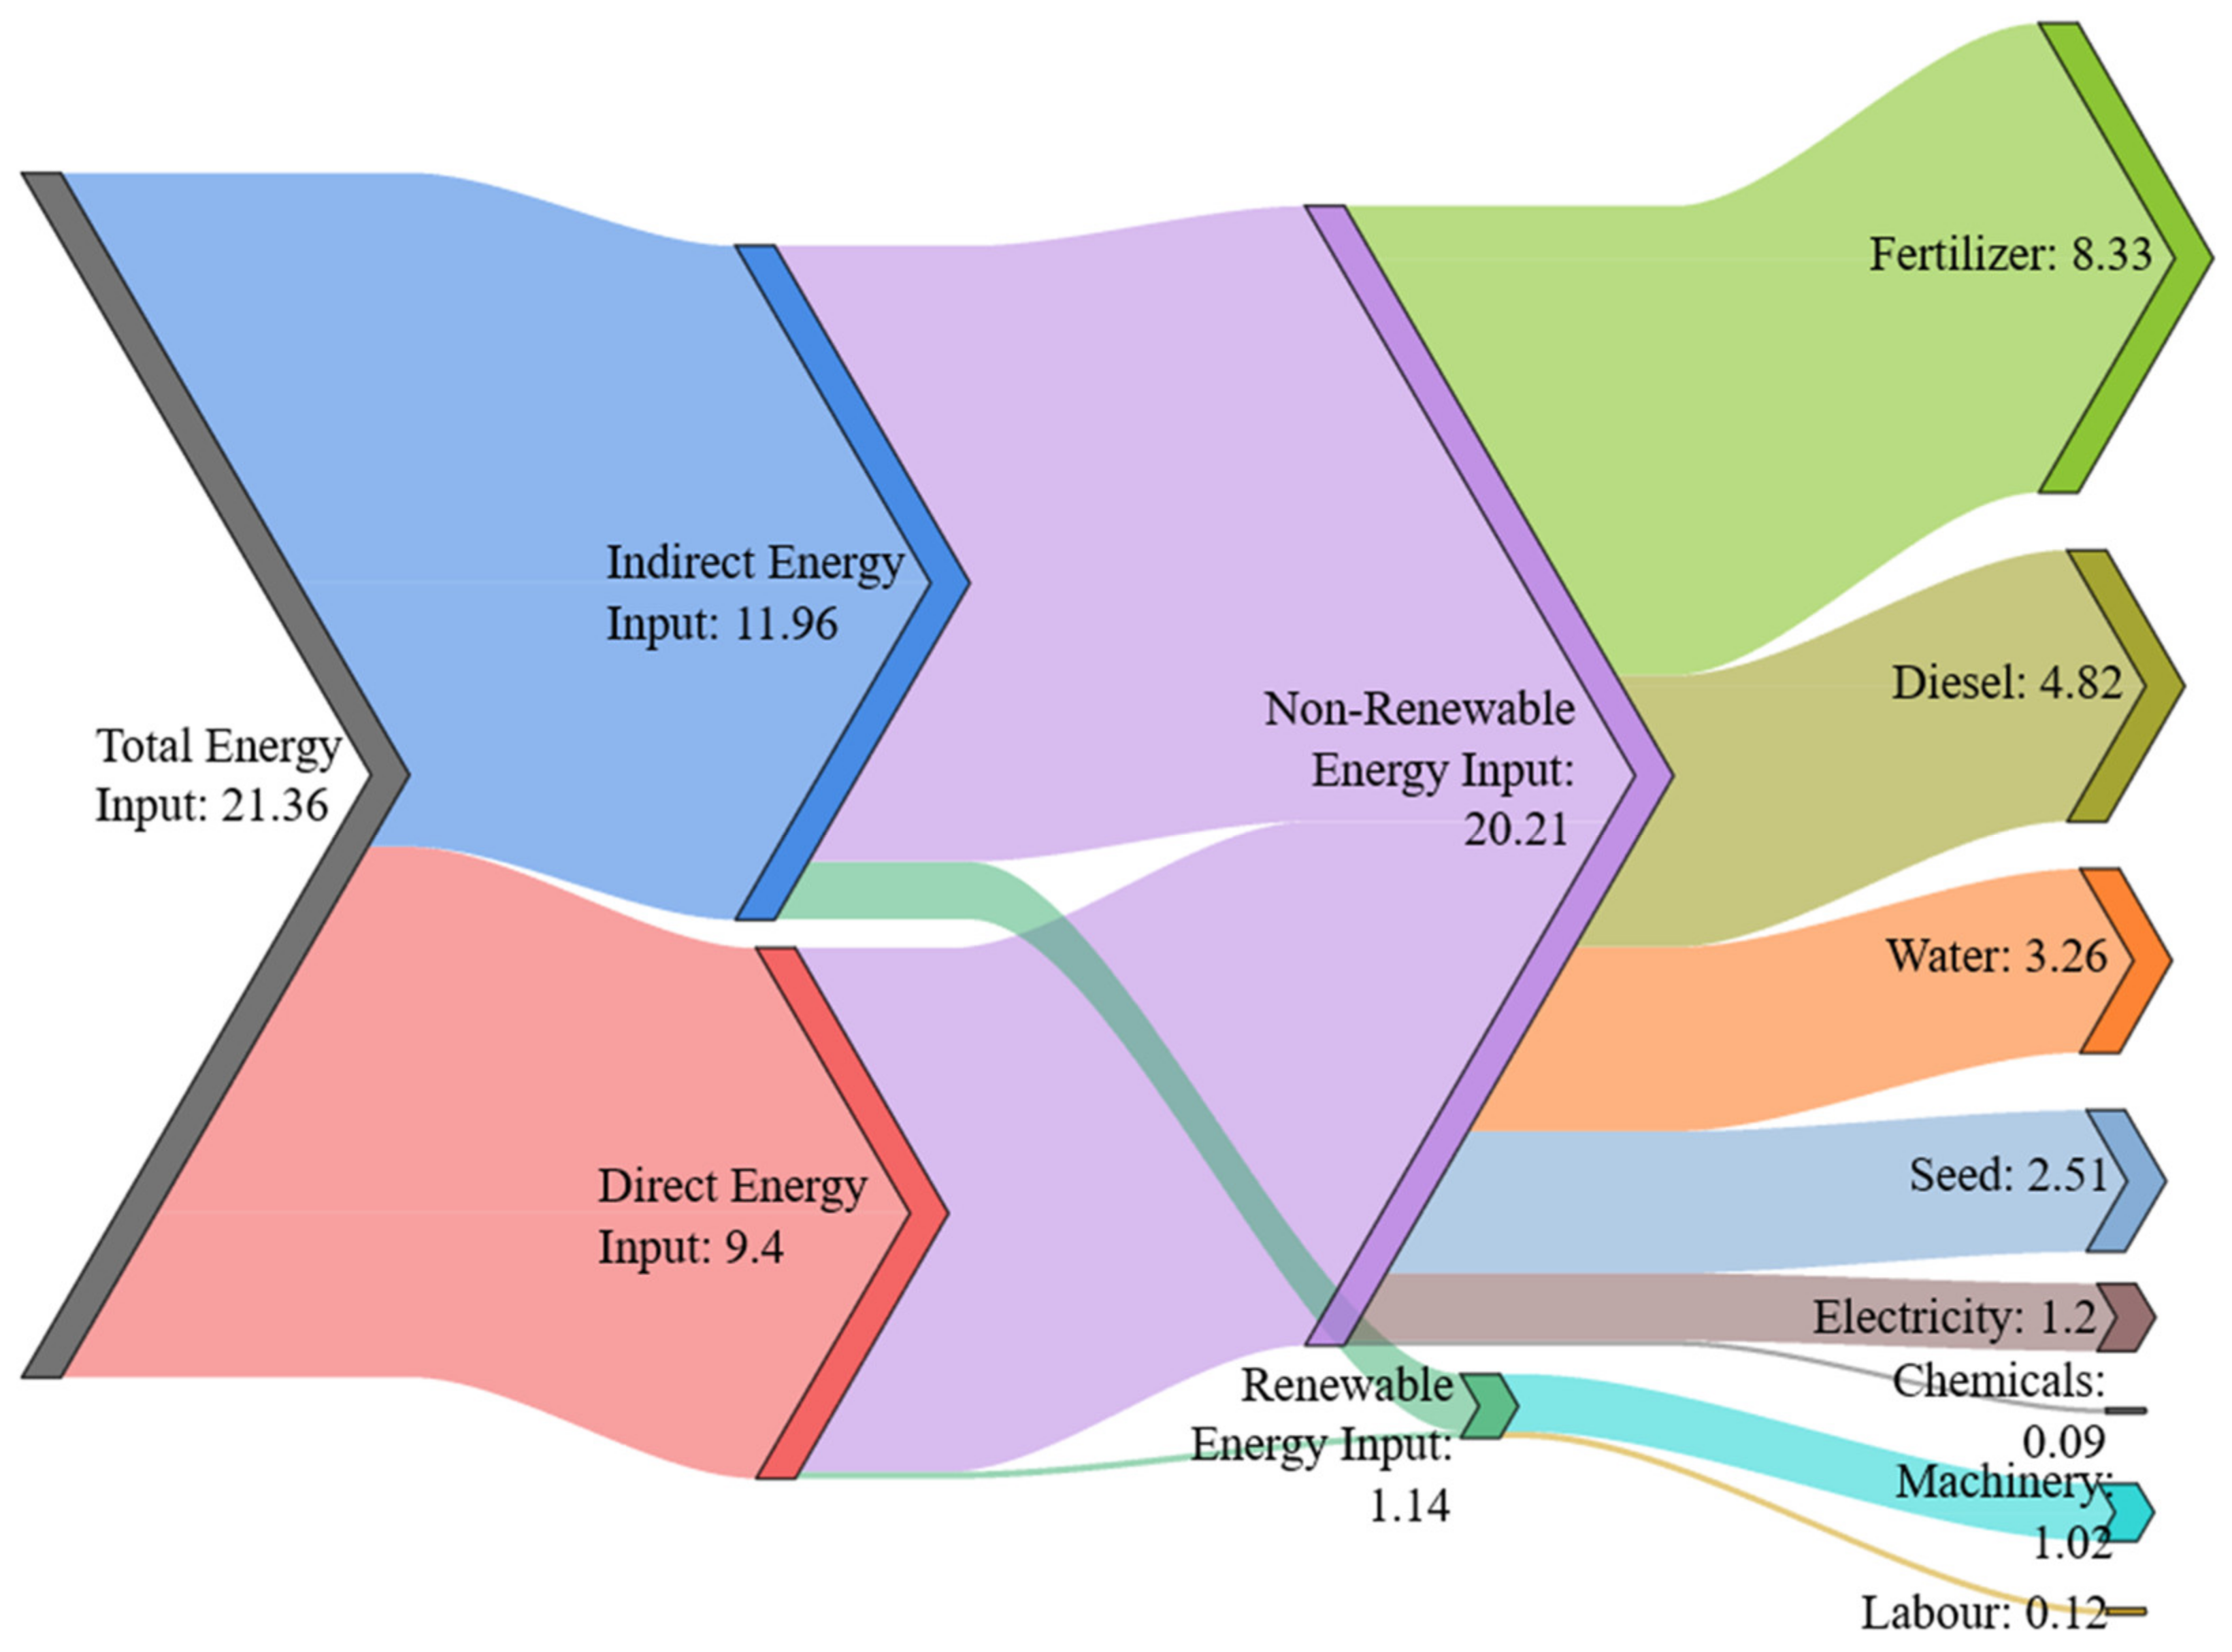
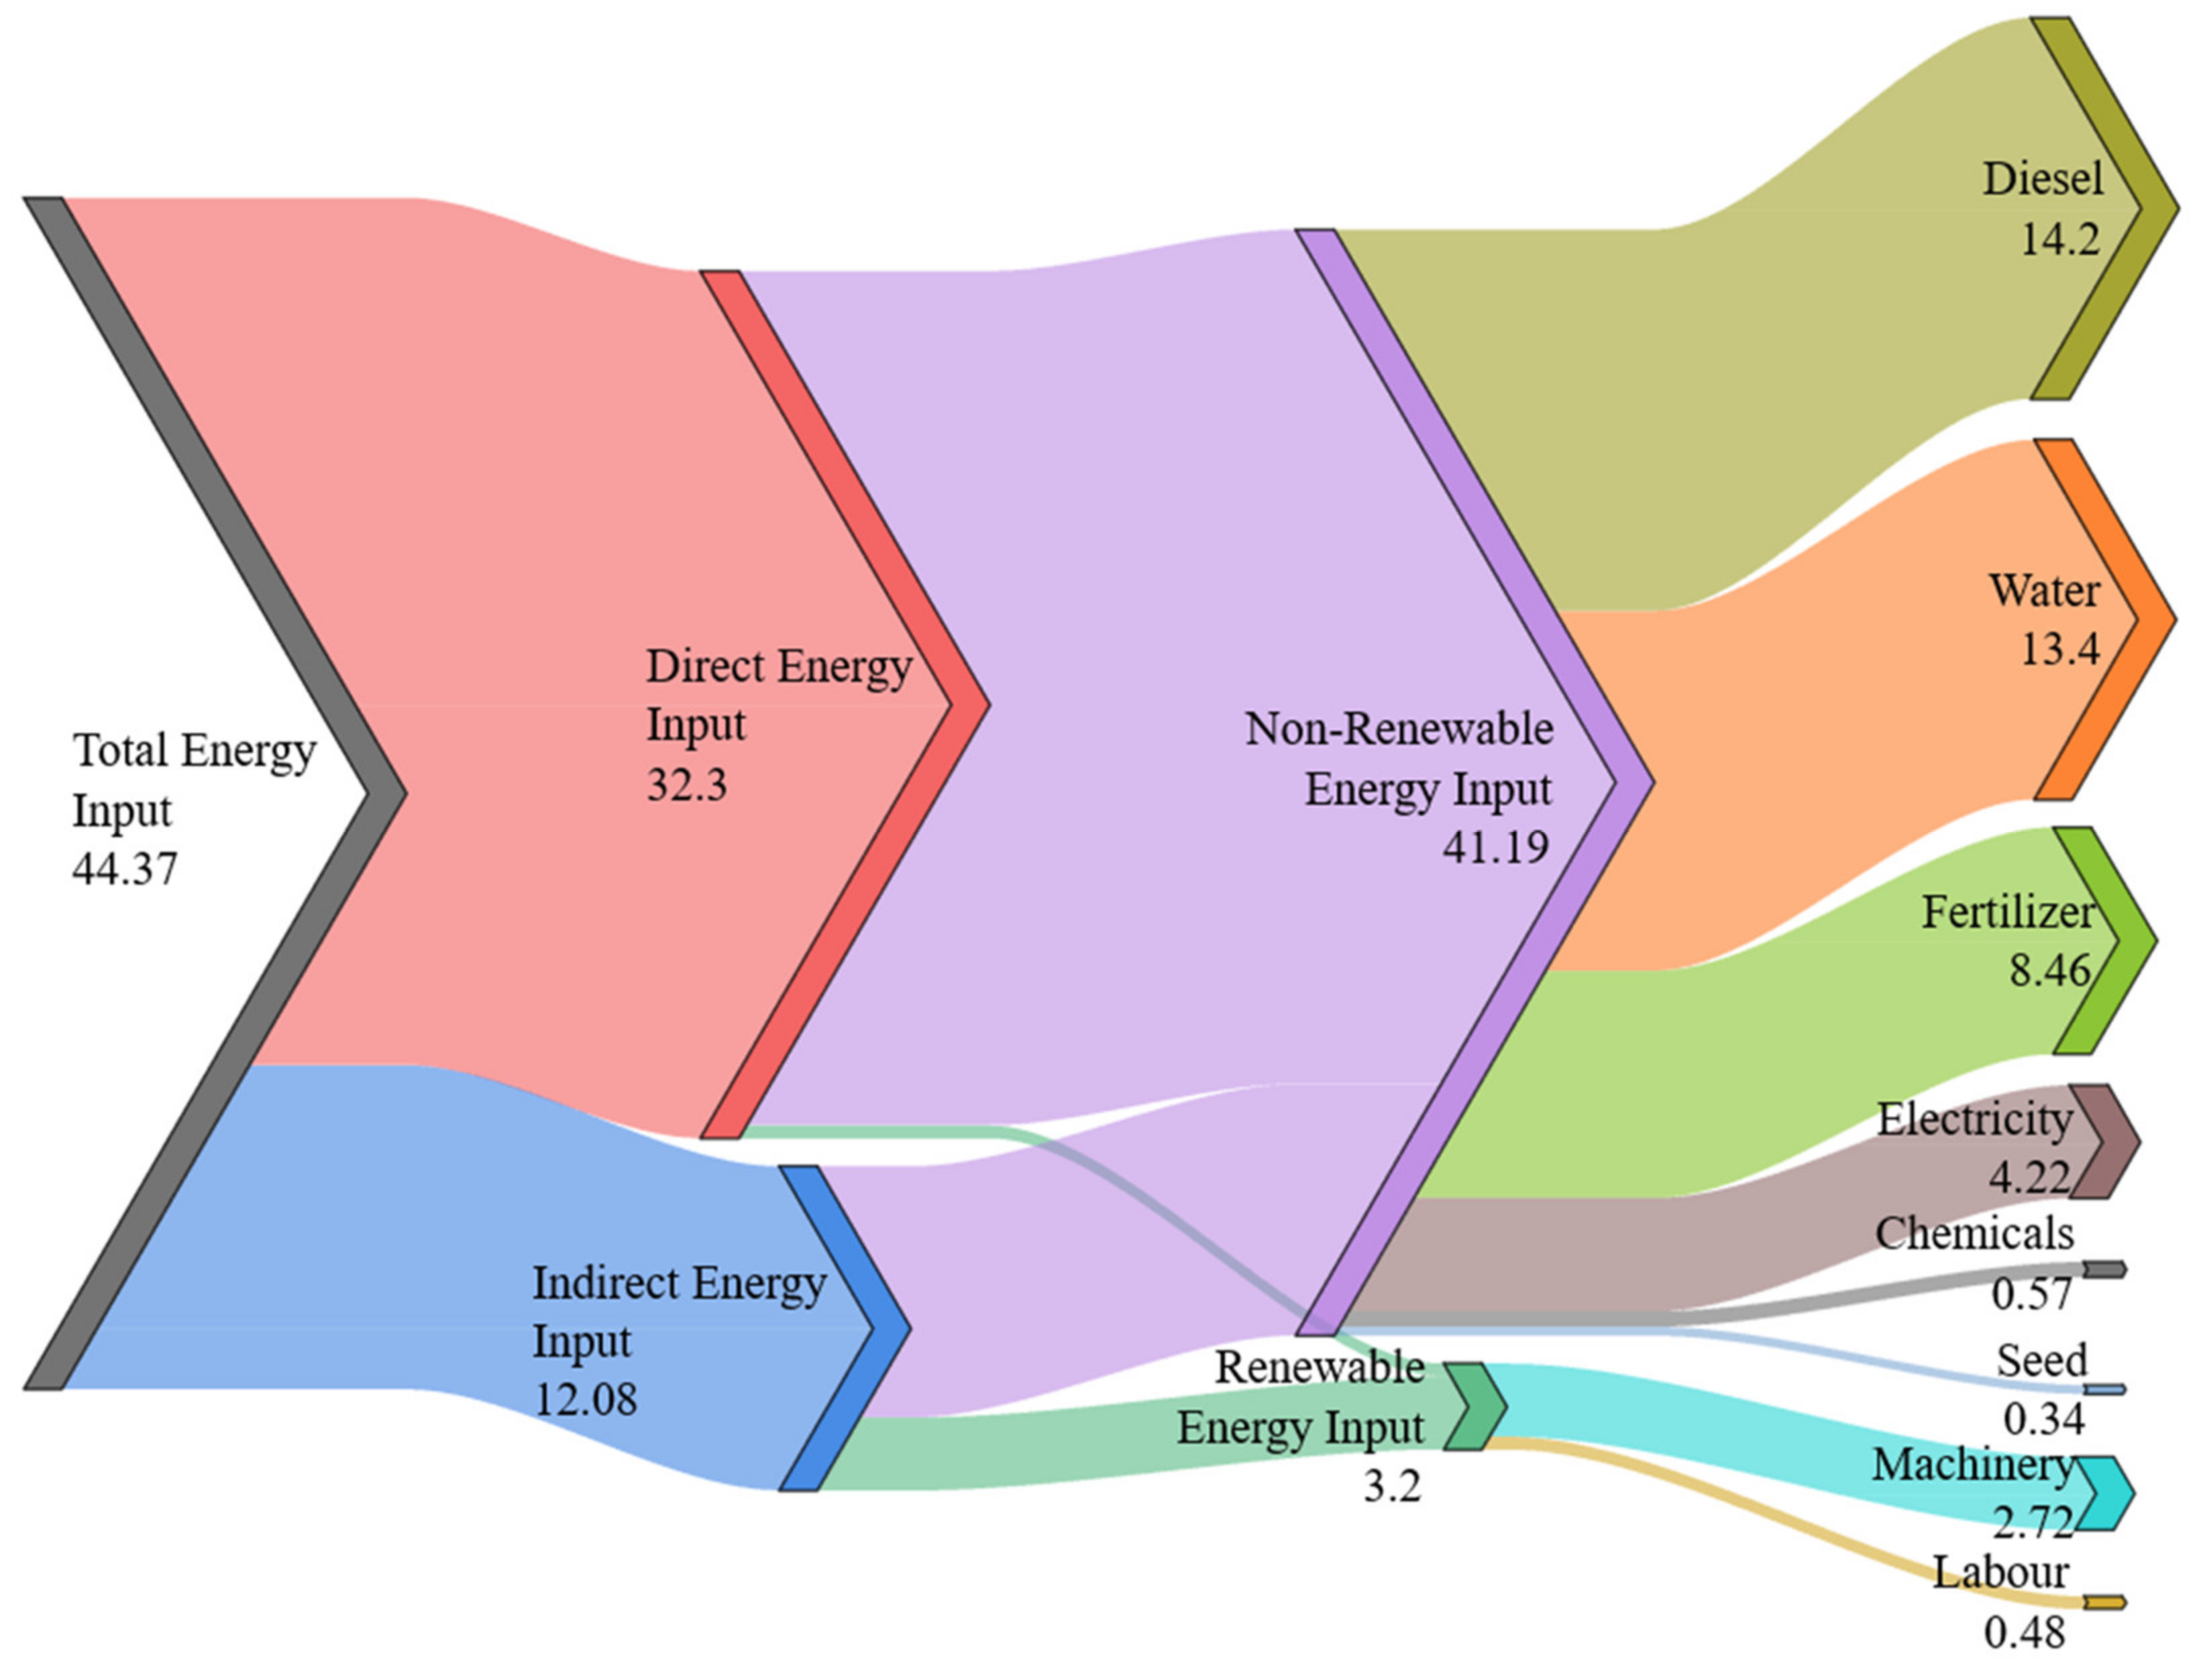
| input energy | GJ/ha | 21.36 | 44.37 |
| output energy | GJ/ha | 121.5 | 75.5 |
| grain yield | kg/ha | 4325.38 | 4441.24 |
| energy use efficiency | - | 5.68 | 1.71 |
| energy productivity | kg/GJ | 202.3 | 100.72 |
| net energy | GJ/ha | 100.12 | 31.13 |
| Energy Input | Units | Wheat | Rice | ||||
|---|---|---|---|---|---|---|---|
| Actual | Targeted | Percentage | Actual | Targeted | Percentage | ||
| fertilizer | GJ/ha | 8.01 | 7.36 | −7.75 | 8.08 | 6.46 | −18.68 |
| diesel | GJ/ha | 4.40 | 3.78 | −11.92 | 11.43 | 9.20 | −17.25 |
| water | GJ/ha | 3.01 | 2.76 | −8.06 | 10.97 | 8.68 | −17.65 |
| machinery | GJ/ha | 0.96 | 0.76 | −17.48 | 1.86 | 0.72 | −42.97 |
| technical efficiency | % | 93.7 | 82.7 | ||||
Publisher’s Note: MDPI stays neutral with regard to jurisdictional claims in published maps and institutional affiliations. |
© 2021 by the authors. Licensee MDPI, Basel, Switzerland. This article is an open access article distributed under the terms and conditions of the Creative Commons Attribution (CC BY) license (https://creativecommons.org/licenses/by/4.0/).
Share and Cite
Ashraf, M.N.; Mahmood, M.H.; Sultan, M.; Shamshiri, R.R.; Ibrahim, S.M. Investigation of Energy Consumption and Associated CO2 Emissions for Wheat–Rice Crop Rotation Farming. Energies 2021, 14, 5094. https://doi.org/10.3390/en14165094
Ashraf MN, Mahmood MH, Sultan M, Shamshiri RR, Ibrahim SM. Investigation of Energy Consumption and Associated CO2 Emissions for Wheat–Rice Crop Rotation Farming. Energies. 2021; 14(16):5094. https://doi.org/10.3390/en14165094
Chicago/Turabian StyleAshraf, Muhammad N., Muhammad H. Mahmood, Muhammad Sultan, Redmond R. Shamshiri, and Sobhy M. Ibrahim. 2021. "Investigation of Energy Consumption and Associated CO2 Emissions for Wheat–Rice Crop Rotation Farming" Energies 14, no. 16: 5094. https://doi.org/10.3390/en14165094
APA StyleAshraf, M. N., Mahmood, M. H., Sultan, M., Shamshiri, R. R., & Ibrahim, S. M. (2021). Investigation of Energy Consumption and Associated CO2 Emissions for Wheat–Rice Crop Rotation Farming. Energies, 14(16), 5094. https://doi.org/10.3390/en14165094